|
||||||||||||||||||||
| |
| Phenotypic Information (metabolism pathway, cancer, disease, phenome) |
| |
| |
| Gene-Gene Network Information: Co-Expression Network, Interacting Genes & KEGG |
| |
|


| Gene Summary for HS6ST1 |
| Top |
| Phenotypic Information for HS6ST1(metabolism pathway, cancer, disease, phenome) |
| Cancer | CGAP: HS6ST1 |
| Familial Cancer Database: HS6ST1 | |
| * This gene is included in those cancer gene databases. |
|
|
|
|
|
|
| ||||||||||||||
Oncogene 1 | Significant driver gene in | |||||||||||||||||||
| cf) number; DB name 1 Oncogene; http://nar.oxfordjournals.org/content/35/suppl_1/D721.long, 2 Tumor Suppressor gene; https://bioinfo.uth.edu/TSGene/, 3 Cancer Gene Census; http://www.nature.com/nrc/journal/v4/n3/abs/nrc1299.html, 4 CancerGenes; http://nar.oxfordjournals.org/content/35/suppl_1/D721.long, 5 Network of Cancer Gene; http://ncg.kcl.ac.uk/index.php, 1Therapeutic Vulnerabilities in Cancer; http://cbio.mskcc.org/cancergenomics/statius/ |
| REACTOME_METABOLISM_OF_CARBOHYDRATES | |
| OMIM | |
| Orphanet | |
| Disease | KEGG Disease: HS6ST1 |
| MedGen: HS6ST1 (Human Medical Genetics with Condition) | |
| ClinVar: HS6ST1 | |
| Phenotype | MGI: HS6ST1 (International Mouse Phenotyping Consortium) |
| PhenomicDB: HS6ST1 | |
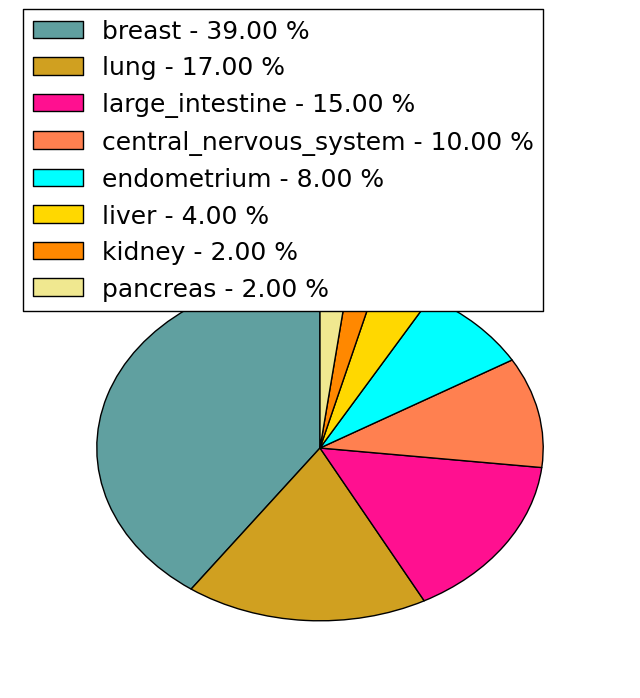
| Mutations for HS6ST1 |
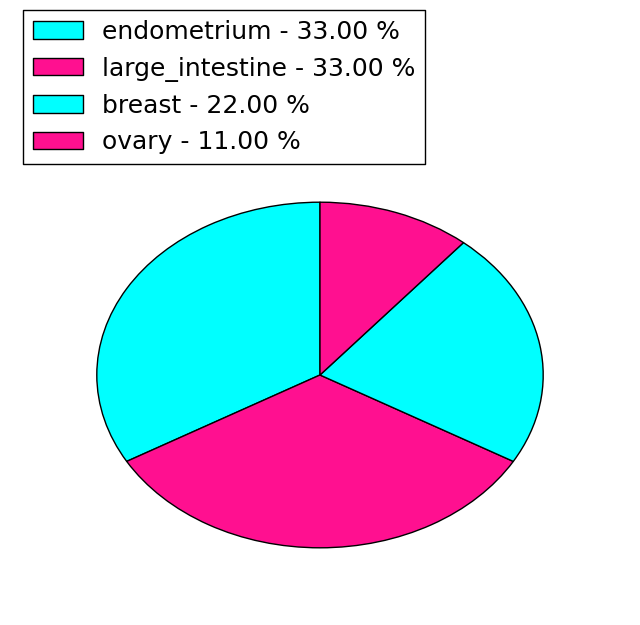
| * Under tables are showing count per each tissue to give us broad intuition about tissue specific mutation patterns.You can go to the detailed page for each mutation database's web site. |
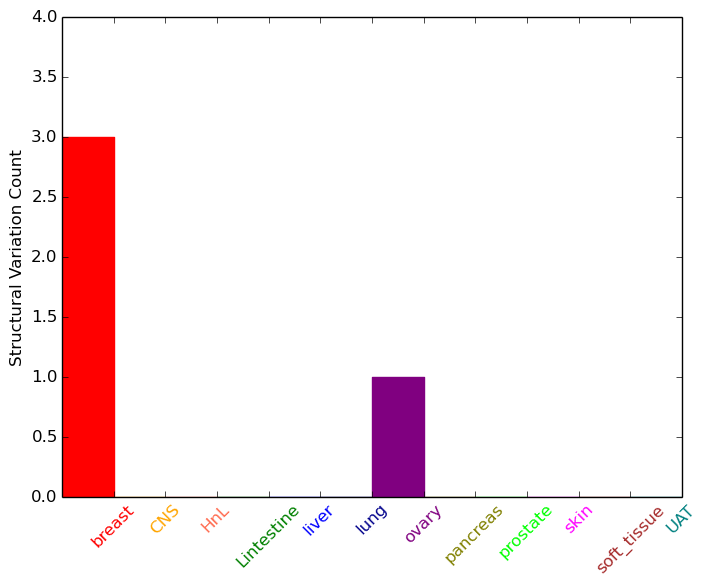
| - Statistics for Tissue and Mutation type | Top |
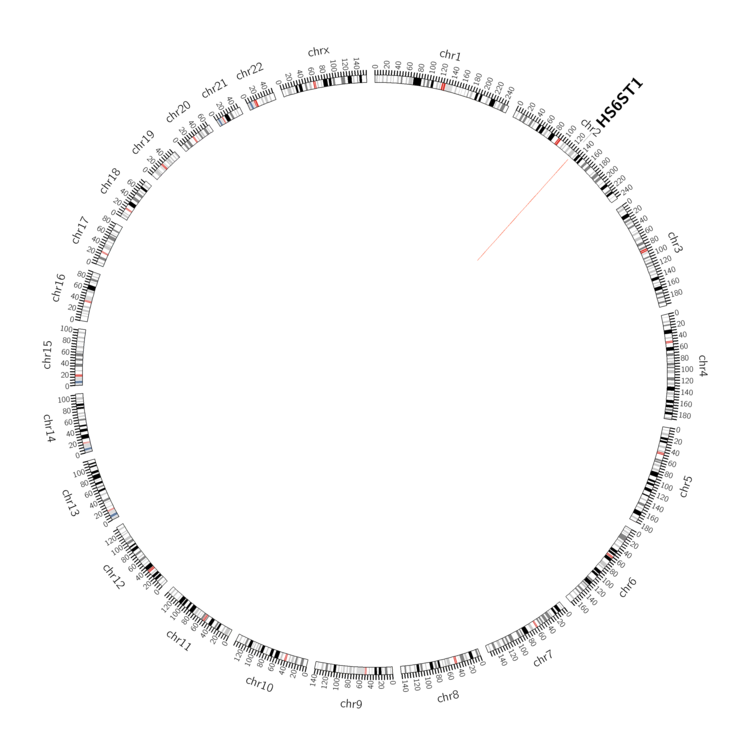 |
| - For Inter-chromosomal Variations |
| There's no inter-chromosomal structural variation. |
| - For Intra-chromosomal Variations |
| * Intra-chromosomal variantions includes 'intrachromosomal amplicon to amplicon', 'intrachromosomal amplicon to non-amplified dna', 'intrachromosomal deletion', 'intrachromosomal fold-back inversion', 'intrachromosomal inversion', 'intrachromosomal tandem duplication', 'Intrachromosomal unknown type', 'intrachromosomal with inverted orientation', 'intrachromosomal with non-inverted orientation'. |
 |
| Sample | Symbol_a | Chr_a | Start_a | End_a | Symbol_b | Chr_b | Start_b | End_b |
| breast | HS6ST1 | chr2 | 129028833 | 129028833 | chr2 | 129182142 | 129182142 | |
| ovary | HS6ST1 | chr2 | 129056092 | 129056112 | HS6ST1 | chr2 | 129064226 | 129064246 |
| cf) Tissue number; Tissue name (1;Breast, 2;Central_nervous_system, 3;Haematopoietic_and_lymphoid_tissue, 4;Large_intestine, 5;Liver, 6;Lung, 7;Ovary, 8;Pancreas, 9;Prostate, 10;Skin, 11;Soft_tissue, 12;Upper_aerodigestive_tract) |
| * From mRNA Sanger sequences, Chitars2.0 arranged chimeric transcripts. This table shows HS6ST1 related fusion information. |
| ID | Head Gene | Tail Gene | Accession | Gene_a | qStart_a | qEnd_a | Chromosome_a | tStart_a | tEnd_a | Gene_a | qStart_a | qEnd_a | Chromosome_a | tStart_a | tEnd_a |
| BQ375227 | PEBP1 | 7 | 89 | 12 | 118577253 | 118577336 | HS6ST1 | 82 | 356 | 2 | 129023995 | 129024269 | |
| Top |
| There's no copy number variation information in COSMIC data for this gene. |
| Top |
|
 |
| Top |
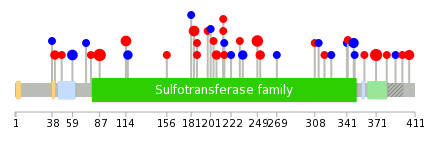
| Stat. for Non-Synonymous SNVs (# total SNVs=46) | (# total SNVs=9) |
 |  |
(# total SNVs=0) | (# total SNVs=0) |
| Top |
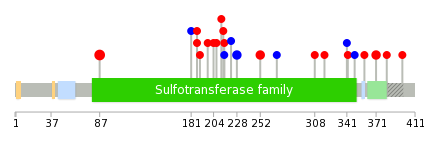
| * When you move the cursor on each content, you can see more deailed mutation information on the Tooltip. Those are primary_site,primary_histology,mutation(aa),pubmedID. |
| GRCh37 position | Mutation(aa) | Unique sampleID count |
| chr2:129075877-129075877 | p.D87E | 9 |
| chr2:129025860-129025860 | p.R371H | 8 |
| chr2:129026227-129026227 | p.R249S | 6 |
| chr2:129075797-129075797 | p.V114G | 4 |
| chr2:129075961-129075961 | p.T59T | 4 |
| chr2:129026419-129026419 | p.R185* | 4 |
| chr2:129026421-129026421 | p.L184P | 4 |
| chr2:129025928-129025928 | p.Y348Y | 3 |
| chr2:129075939-129075939 | p.K67* | 3 |
| chr2:129025758-129025758 | p.S405I | 3 |
| Top |
|
 |
| Point Mutation/ Tissue ID | 1 | 2 | 3 | 4 | 5 | 6 | 7 | 8 | 9 | 10 | 11 | 12 | 13 | 14 | 15 | 16 | 17 | 18 | 19 | 20 |
| # sample | 1 | 5 | 2 | 2 | 3 | 3 | 3 | 5 | 7 | |||||||||||
| # mutation | 1 | 2 | 2 | 2 | 3 | 3 | 2 | 5 | 6 | |||||||||||
| nonsynonymous SNV | 1 | 2 | 2 | 1 | 3 | 3 | 1 | 2 | 3 | |||||||||||
| synonymous SNV | 1 | 1 | 3 | 3 |
| cf) Tissue ID; Tissue type (1; BLCA[Bladder Urothelial Carcinoma], 2; BRCA[Breast invasive carcinoma], 3; CESC[Cervical squamous cell carcinoma and endocervical adenocarcinoma], 4; COAD[Colon adenocarcinoma], 5; GBM[Glioblastoma multiforme], 6; Glioma Low Grade, 7; HNSC[Head and Neck squamous cell carcinoma], 8; KICH[Kidney Chromophobe], 9; KIRC[Kidney renal clear cell carcinoma], 10; KIRP[Kidney renal papillary cell carcinoma], 11; LAML[Acute Myeloid Leukemia], 12; LUAD[Lung adenocarcinoma], 13; LUSC[Lung squamous cell carcinoma], 14; OV[Ovarian serous cystadenocarcinoma ], 15; PAAD[Pancreatic adenocarcinoma], 16; PRAD[Prostate adenocarcinoma], 17; SKCM[Skin Cutaneous Melanoma], 18:STAD[Stomach adenocarcinoma], 19:THCA[Thyroid carcinoma], 20:UCEC[Uterine Corpus Endometrial Carcinoma]) |
| Top |
| * We represented just top 10 SNVs. When you move the cursor on each content, you can see more deailed mutation information on the Tooltip. Those are primary_site, primary_histology, mutation(aa), pubmedID. |
| Genomic Position | Mutation(aa) | Unique sampleID count |
| chr2:129075877 | p.D87E | 4 |
| chr2:129026218 | p.R371H | 2 |
| chr2:129026412 | p.P187R | 2 |
| chr2:129026288 | p.R252C | 2 |
| chr2:129025860 | p.T228T | 2 |
| chr2:129025948 | p.R382L | 1 |
| chr2:129026338 | p.S207L | 1 |
| chr2:129025949 | p.W204C | 1 |
| chr2:129026352 | p.Y359H | 1 |
| chr2:129026019 | p.V198L | 1 |
| * Copy number data were extracted from TCGA using R package TCGA-Assembler. The URLs of all public data files on TCGA DCC data server were gathered on Jan-05-2015. Function ProcessCNAData in TCGA-Assembler package was used to obtain gene-level copy number value which is calculated as the average copy number of the genomic region of a gene. |
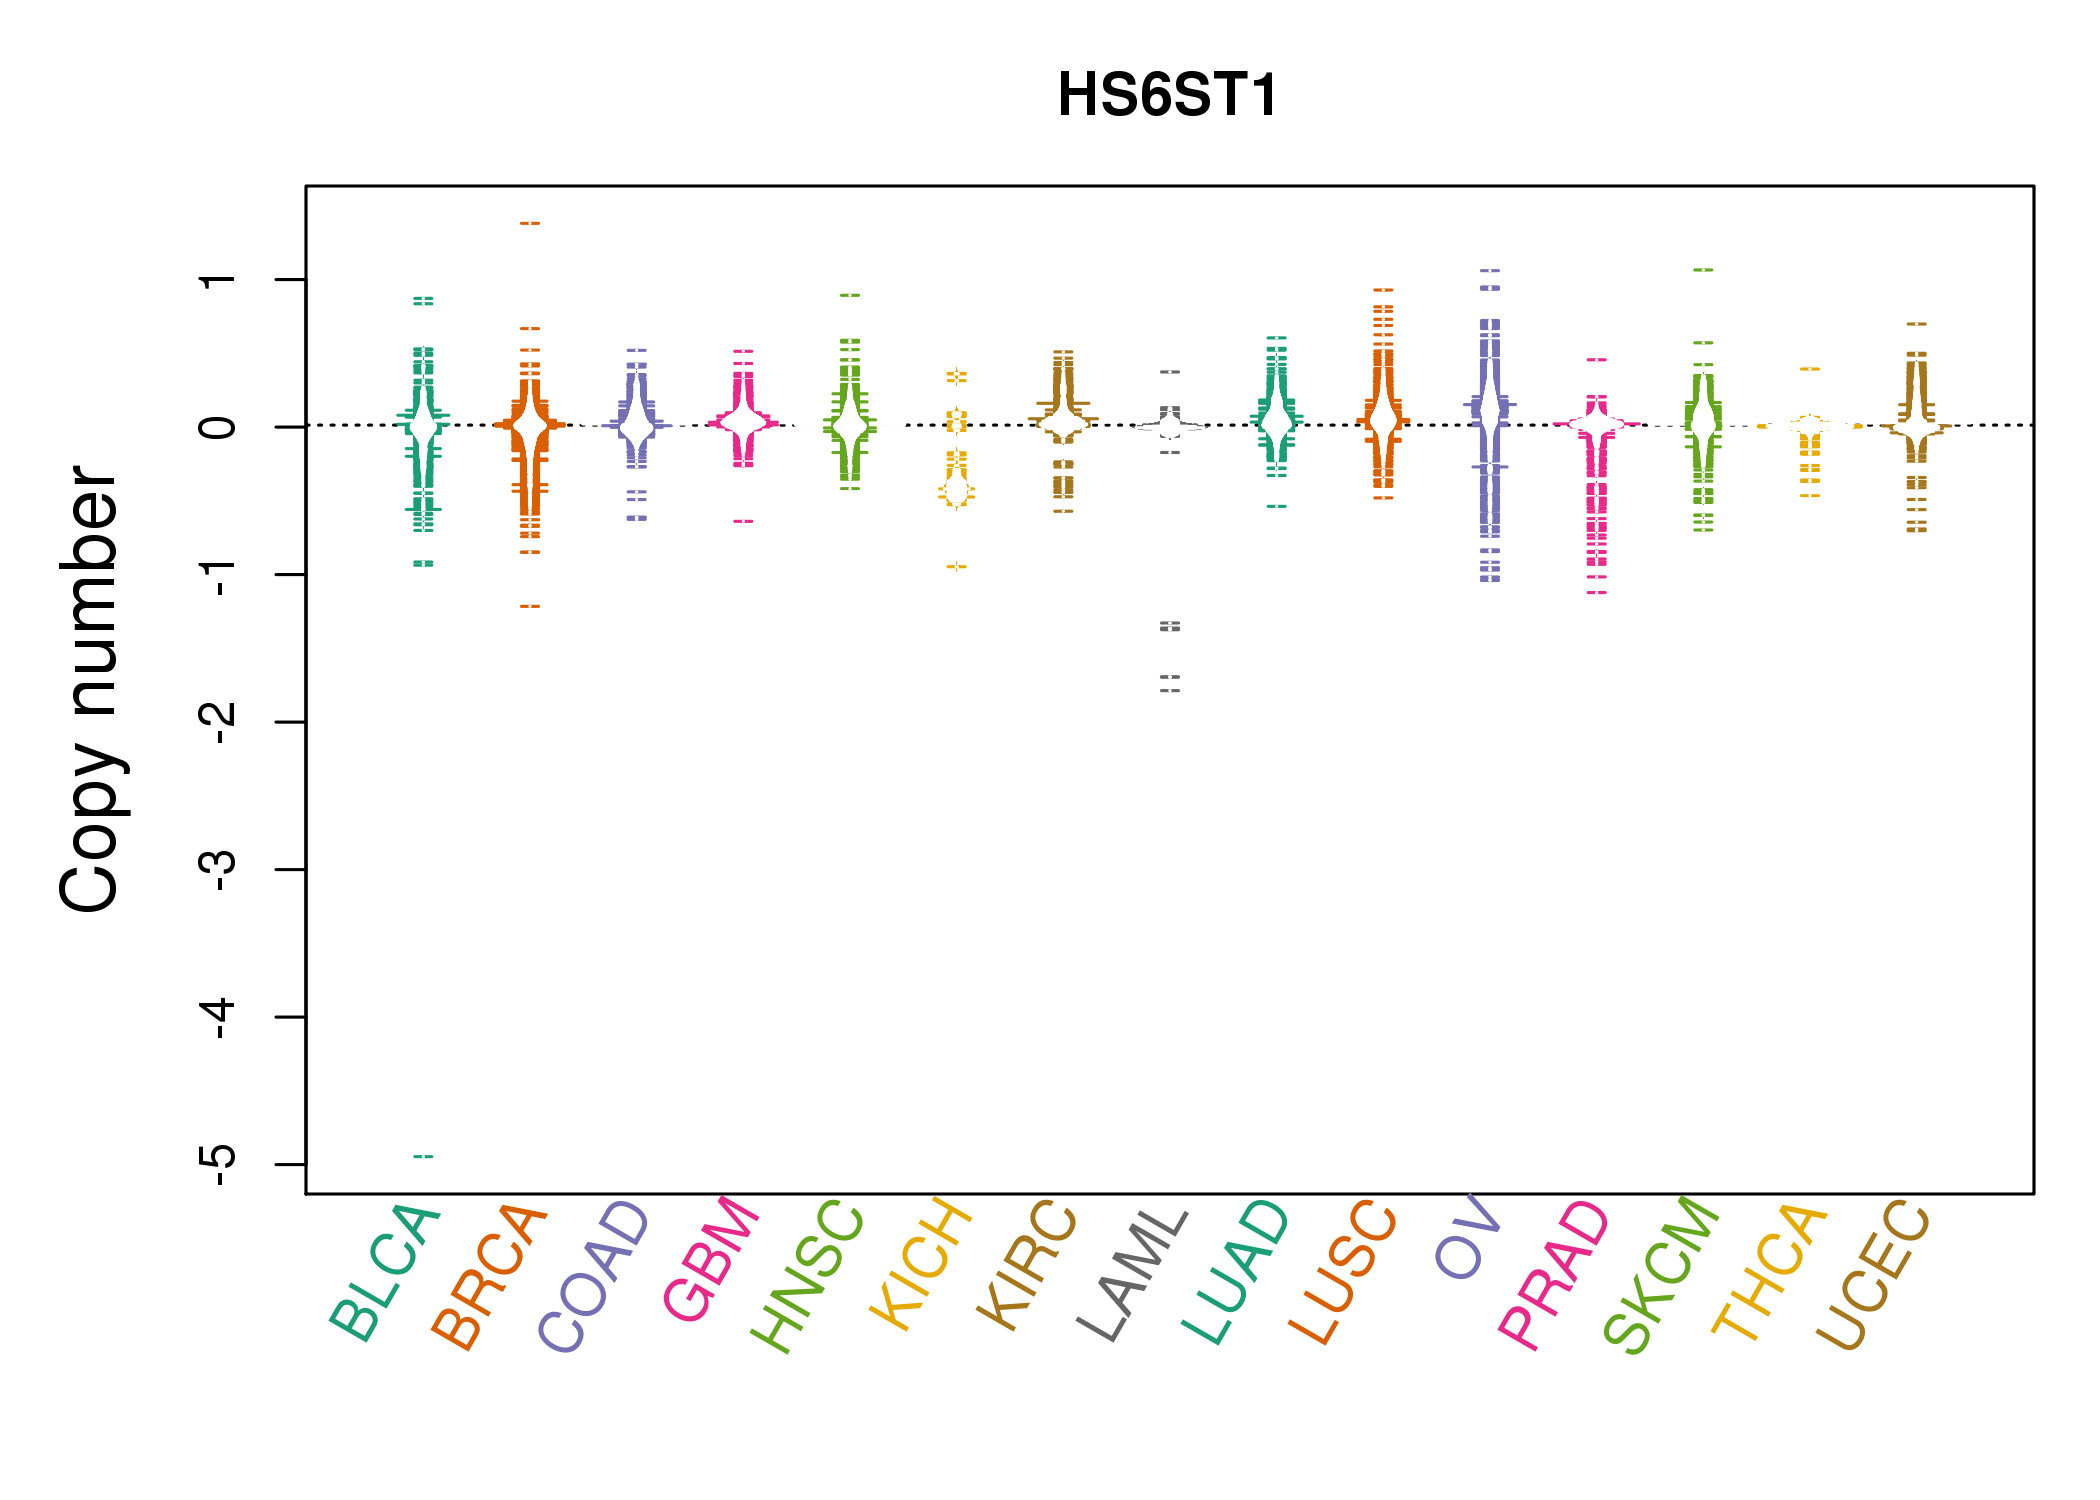 |
| cf) Tissue ID[Tissue type]: BLCA[Bladder Urothelial Carcinoma], BRCA[Breast invasive carcinoma], CESC[Cervical squamous cell carcinoma and endocervical adenocarcinoma], COAD[Colon adenocarcinoma], GBM[Glioblastoma multiforme], Glioma Low Grade, HNSC[Head and Neck squamous cell carcinoma], KICH[Kidney Chromophobe], KIRC[Kidney renal clear cell carcinoma], KIRP[Kidney renal papillary cell carcinoma], LAML[Acute Myeloid Leukemia], LUAD[Lung adenocarcinoma], LUSC[Lung squamous cell carcinoma], OV[Ovarian serous cystadenocarcinoma ], PAAD[Pancreatic adenocarcinoma], PRAD[Prostate adenocarcinoma], SKCM[Skin Cutaneous Melanoma], STAD[Stomach adenocarcinoma], THCA[Thyroid carcinoma], UCEC[Uterine Corpus Endometrial Carcinoma] |
| Top |
| Gene Expression for HS6ST1 |
| * CCLE gene expression data were extracted from CCLE_Expression_Entrez_2012-10-18.res: Gene-centric RMA-normalized mRNA expression data. |
 |
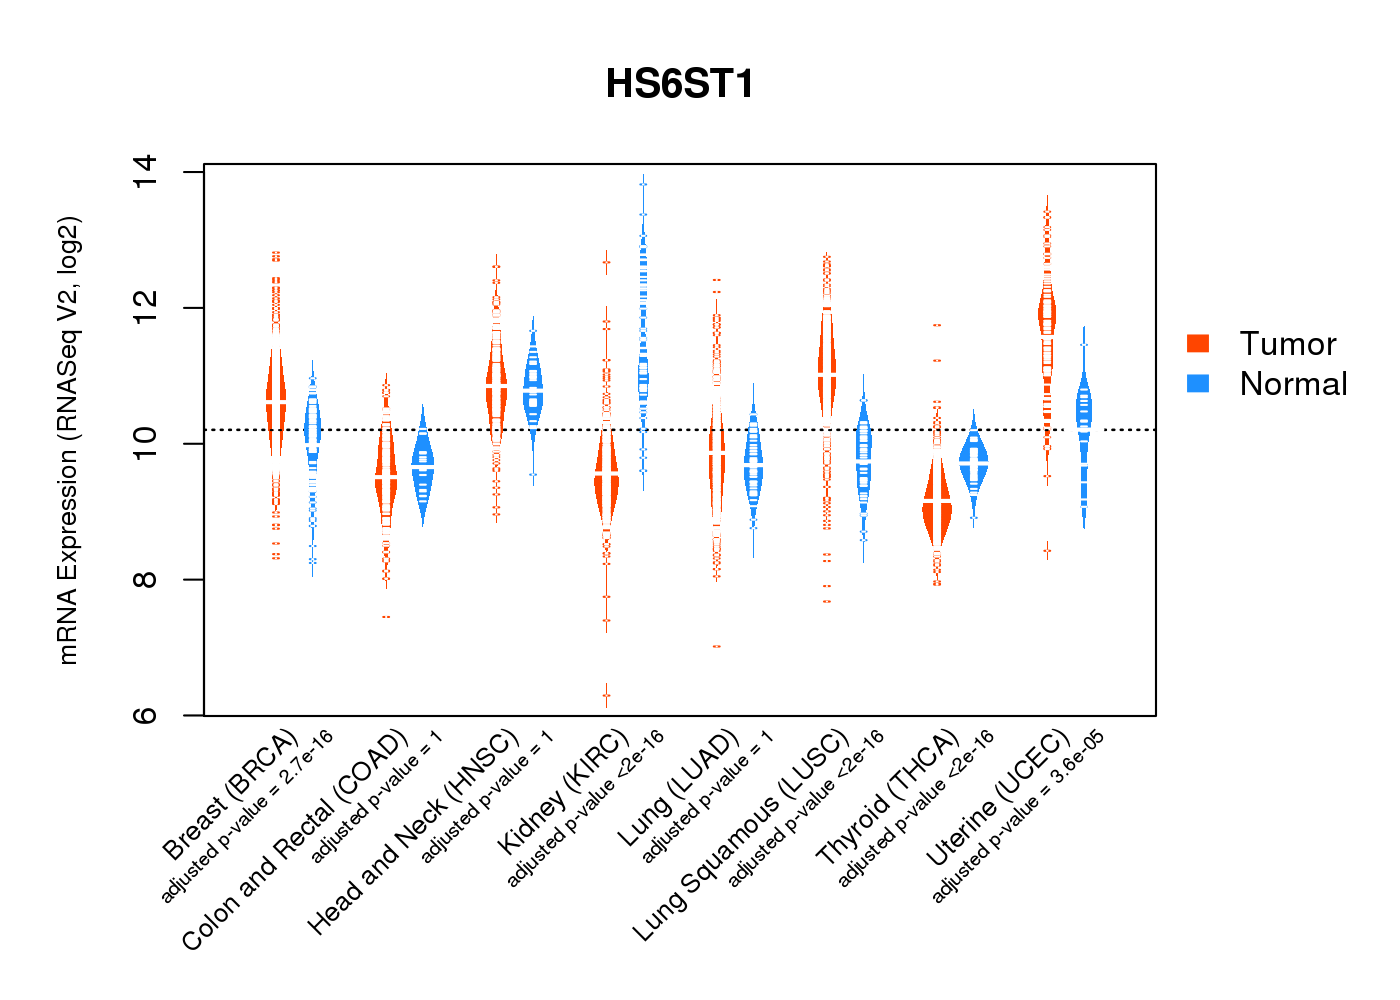
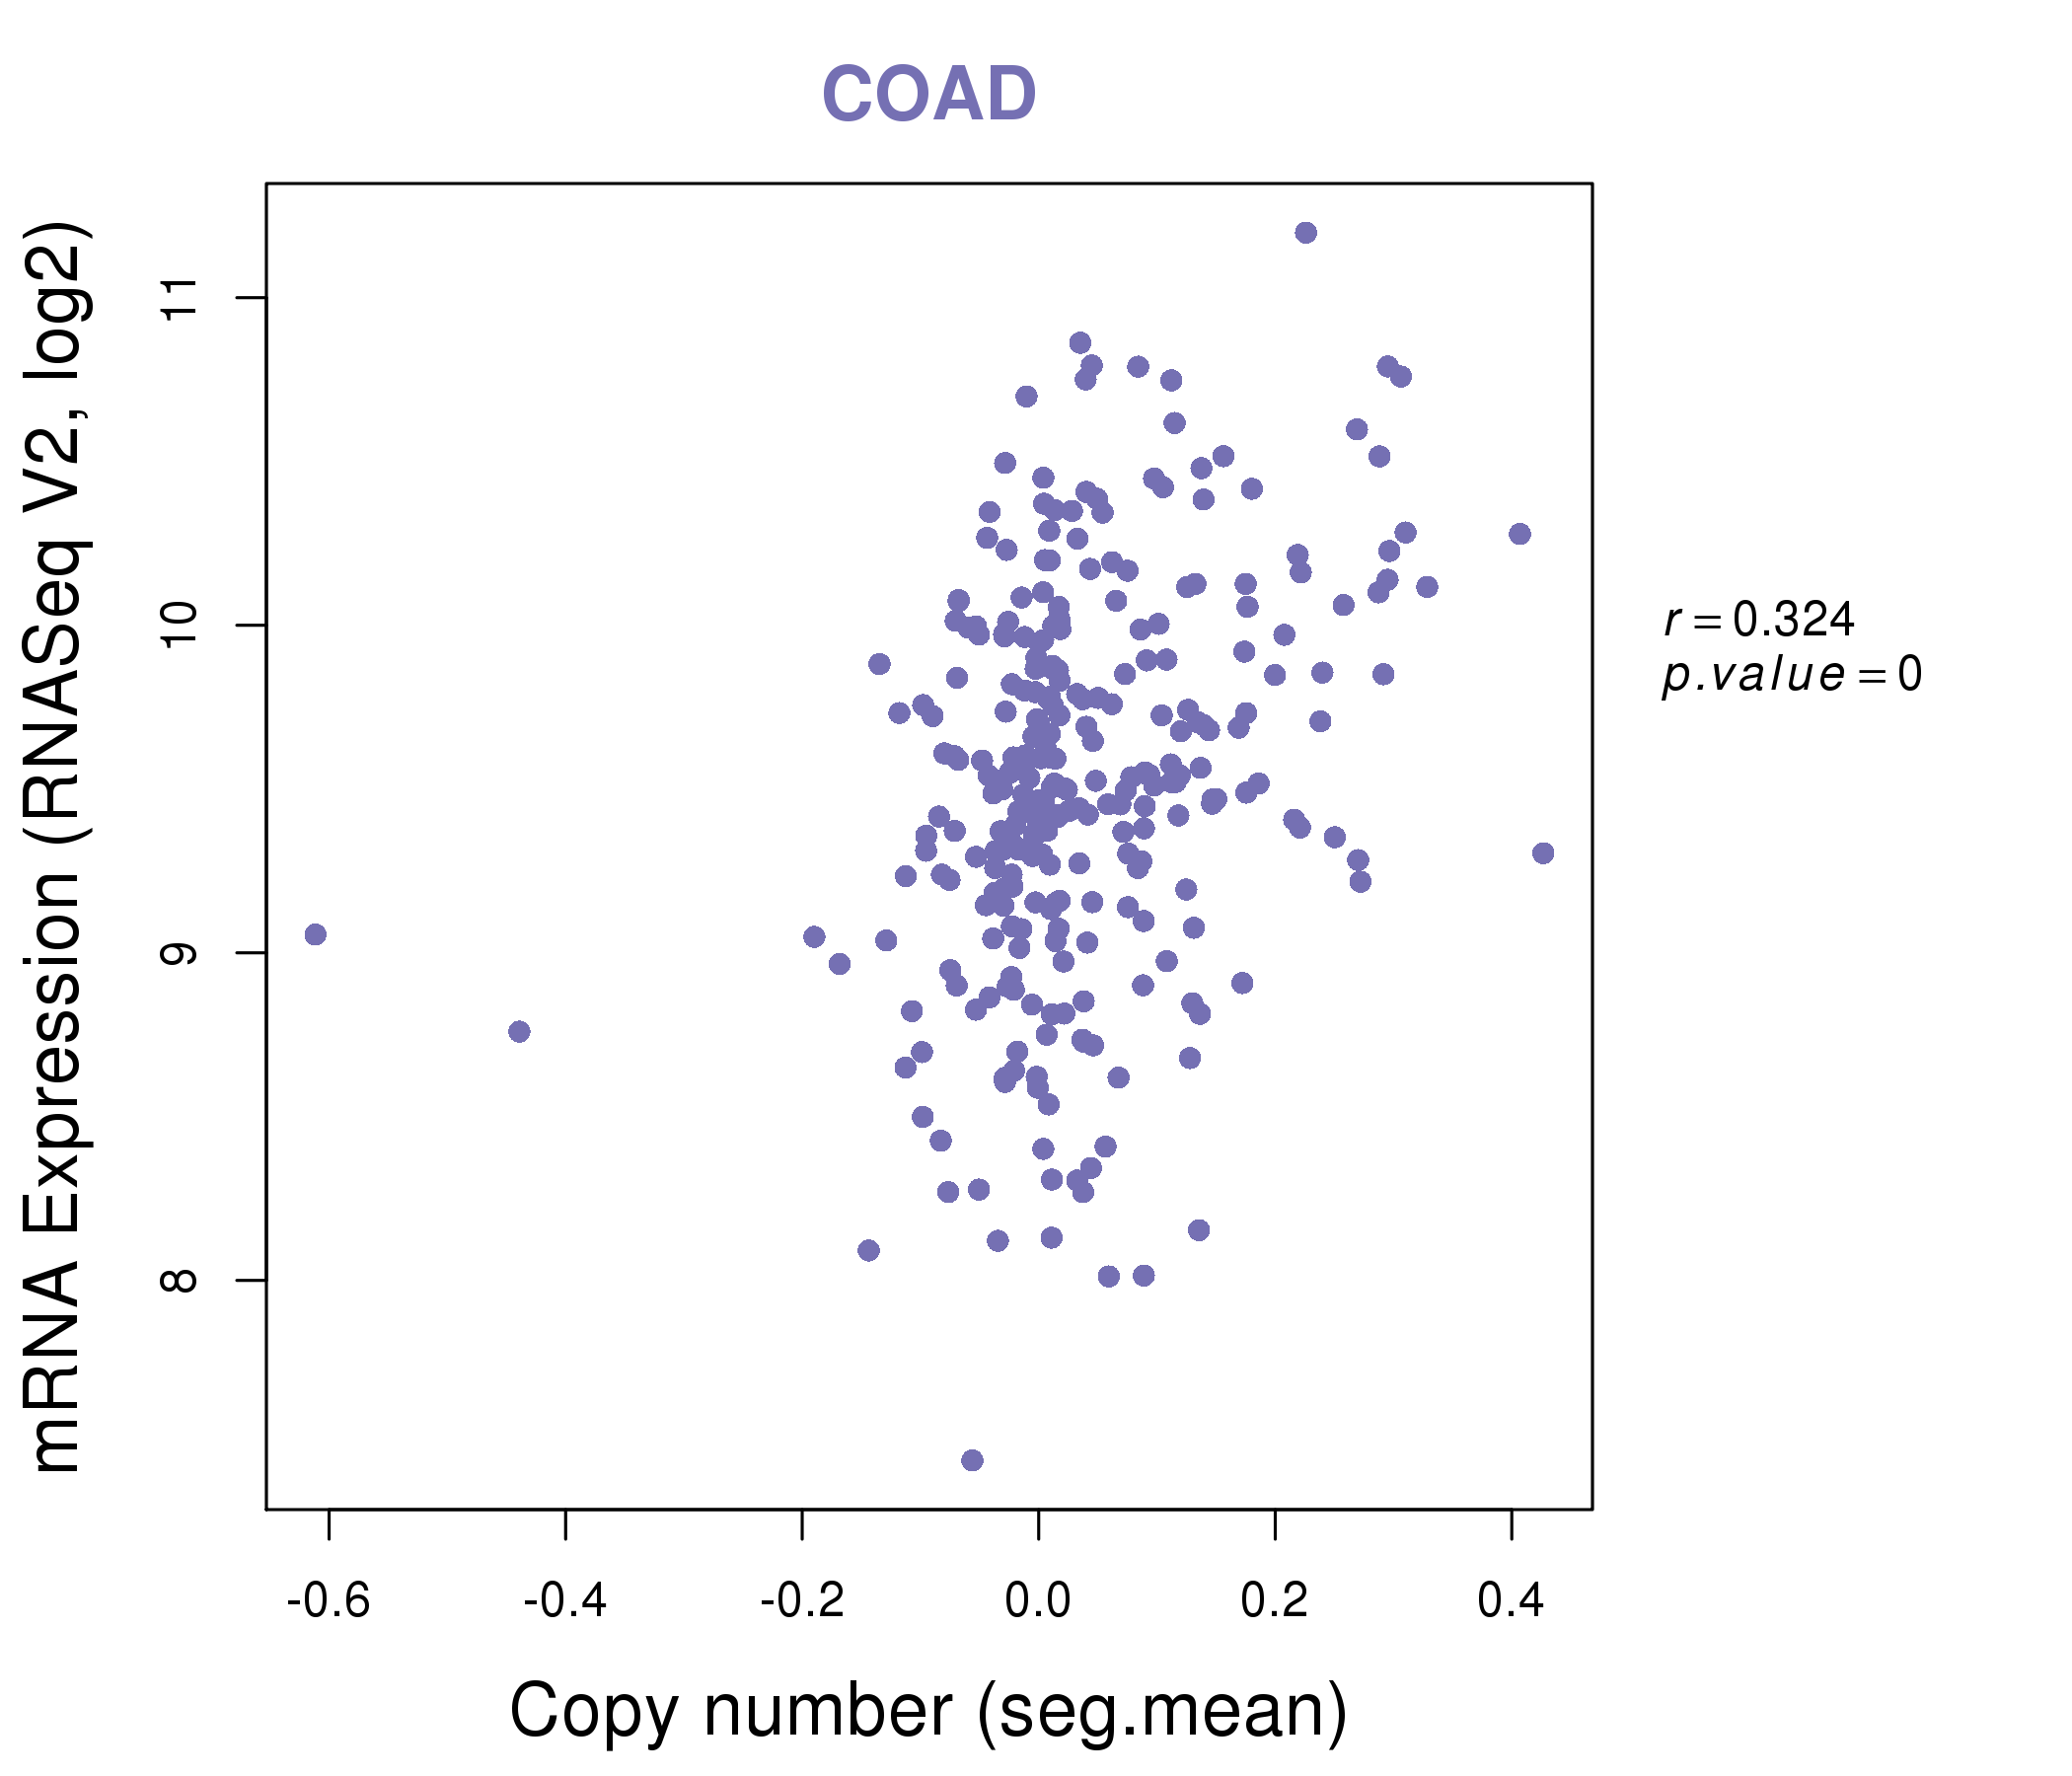
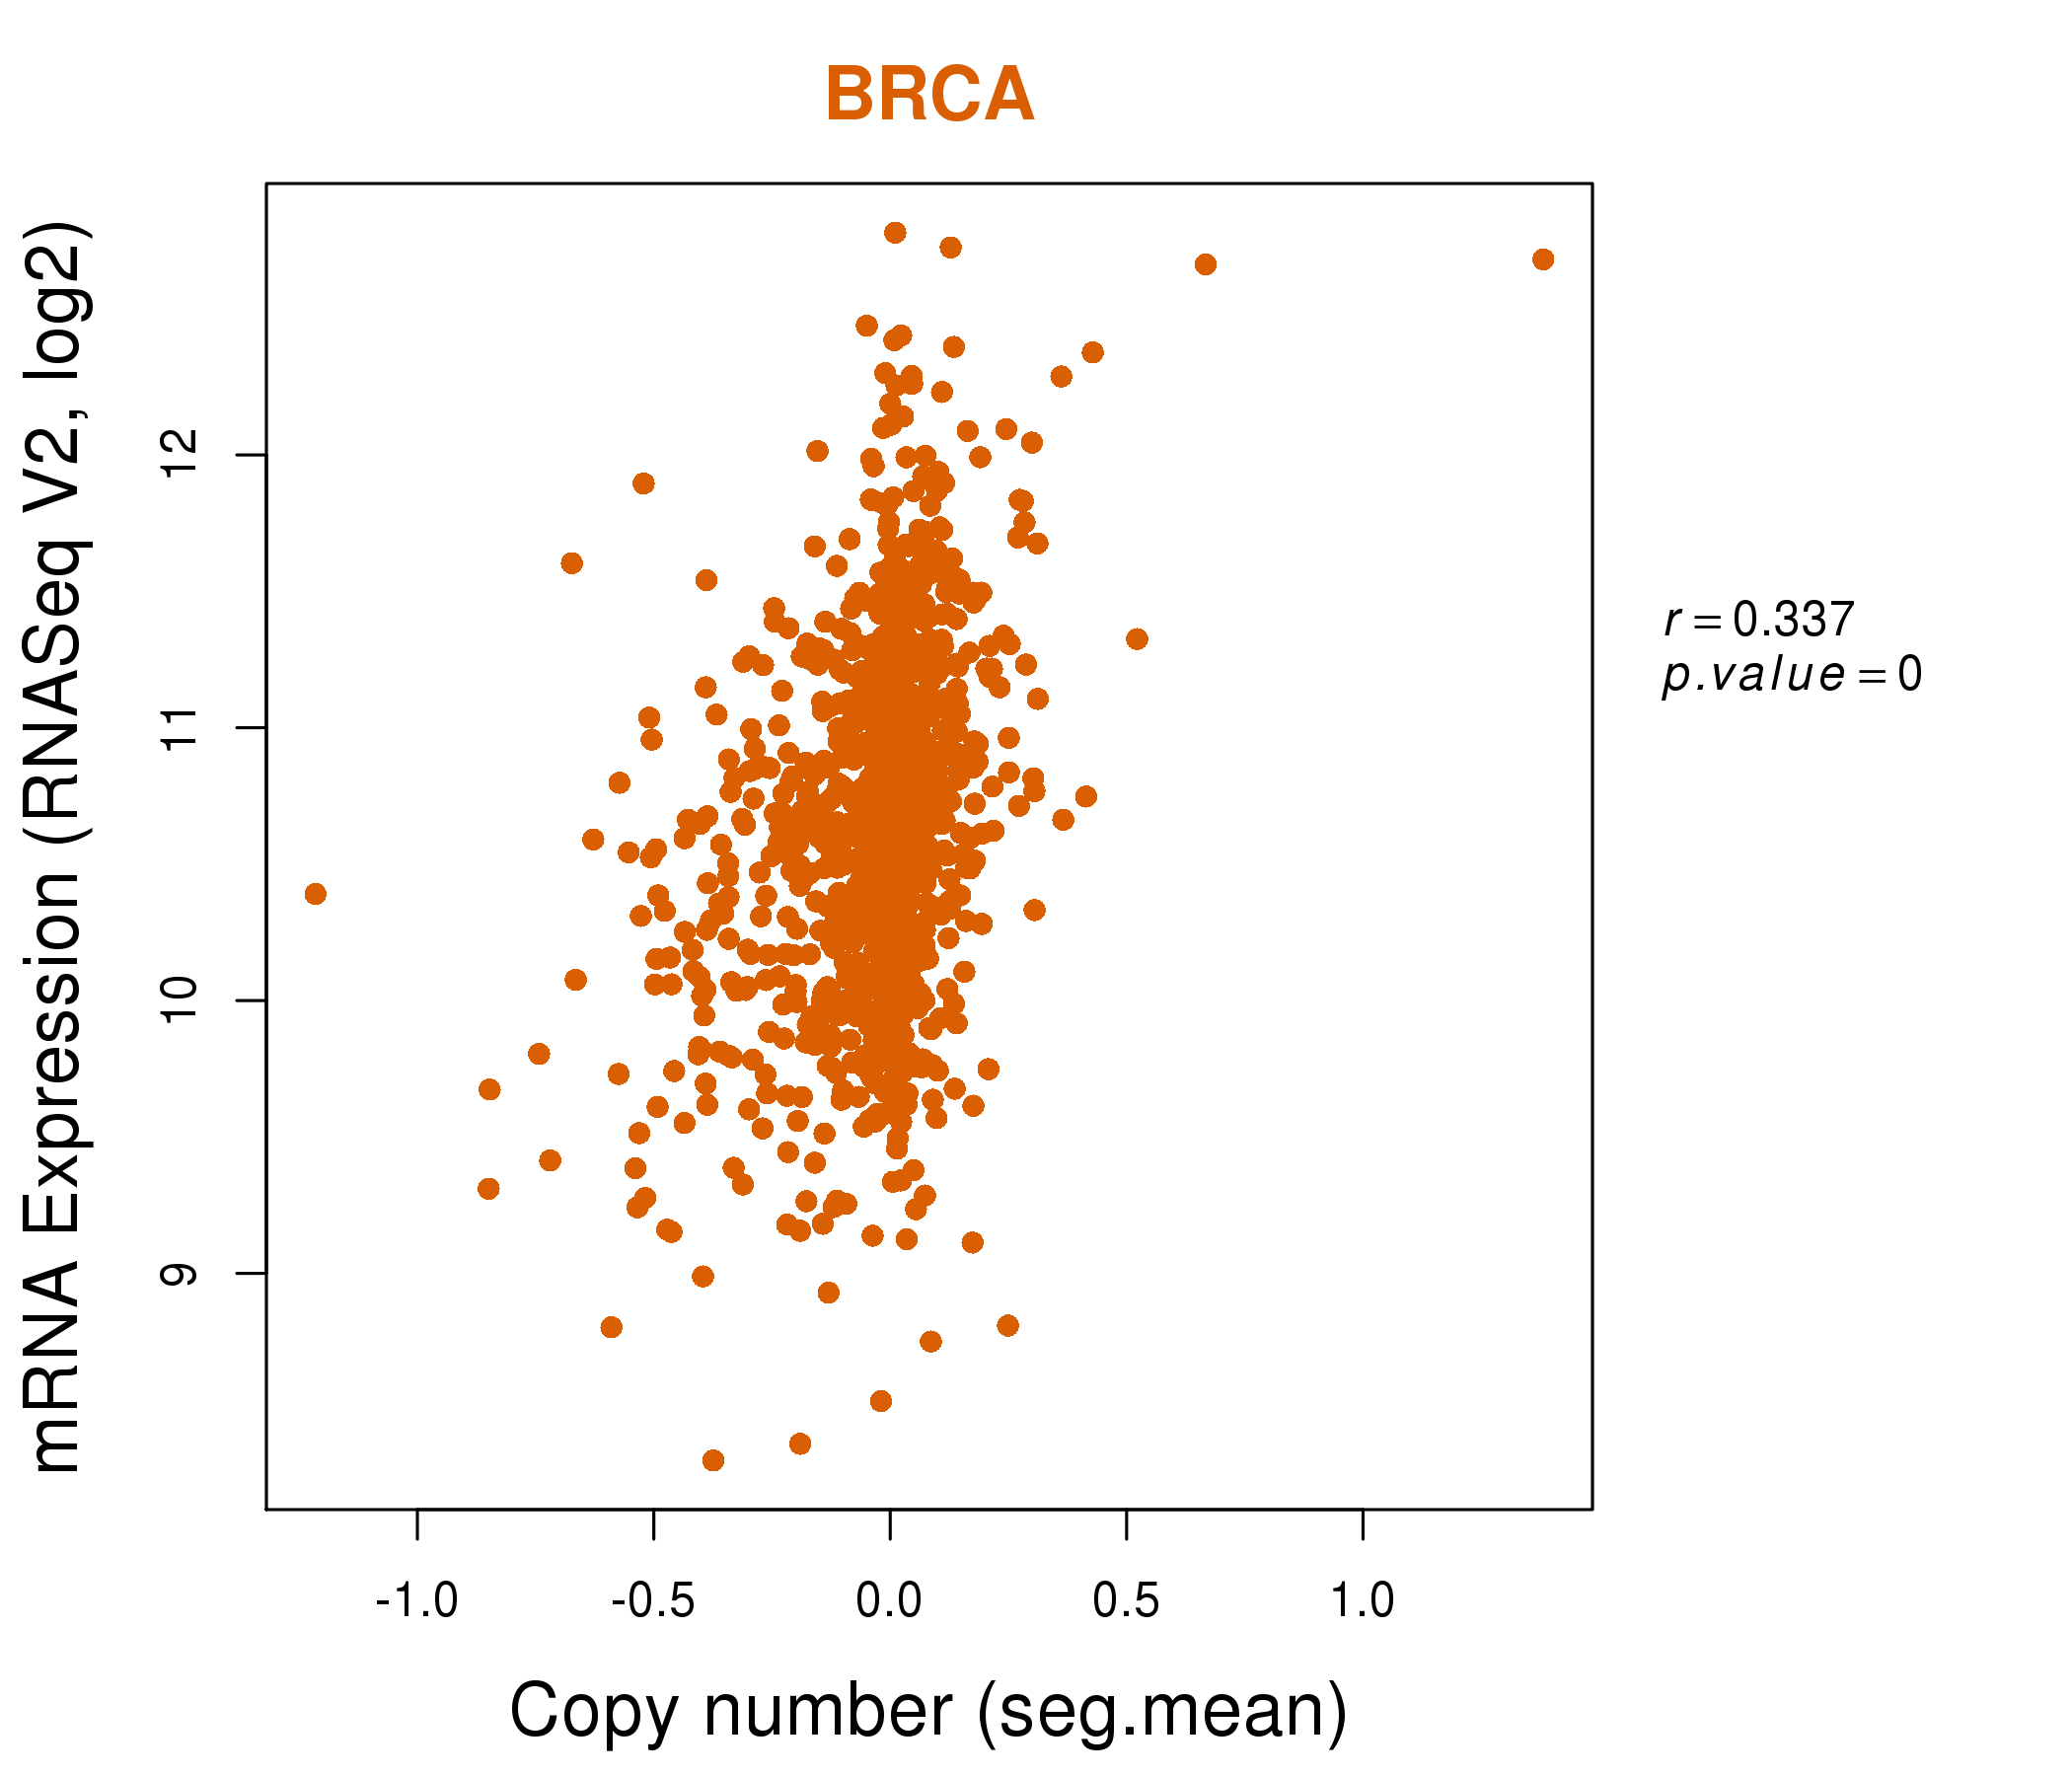
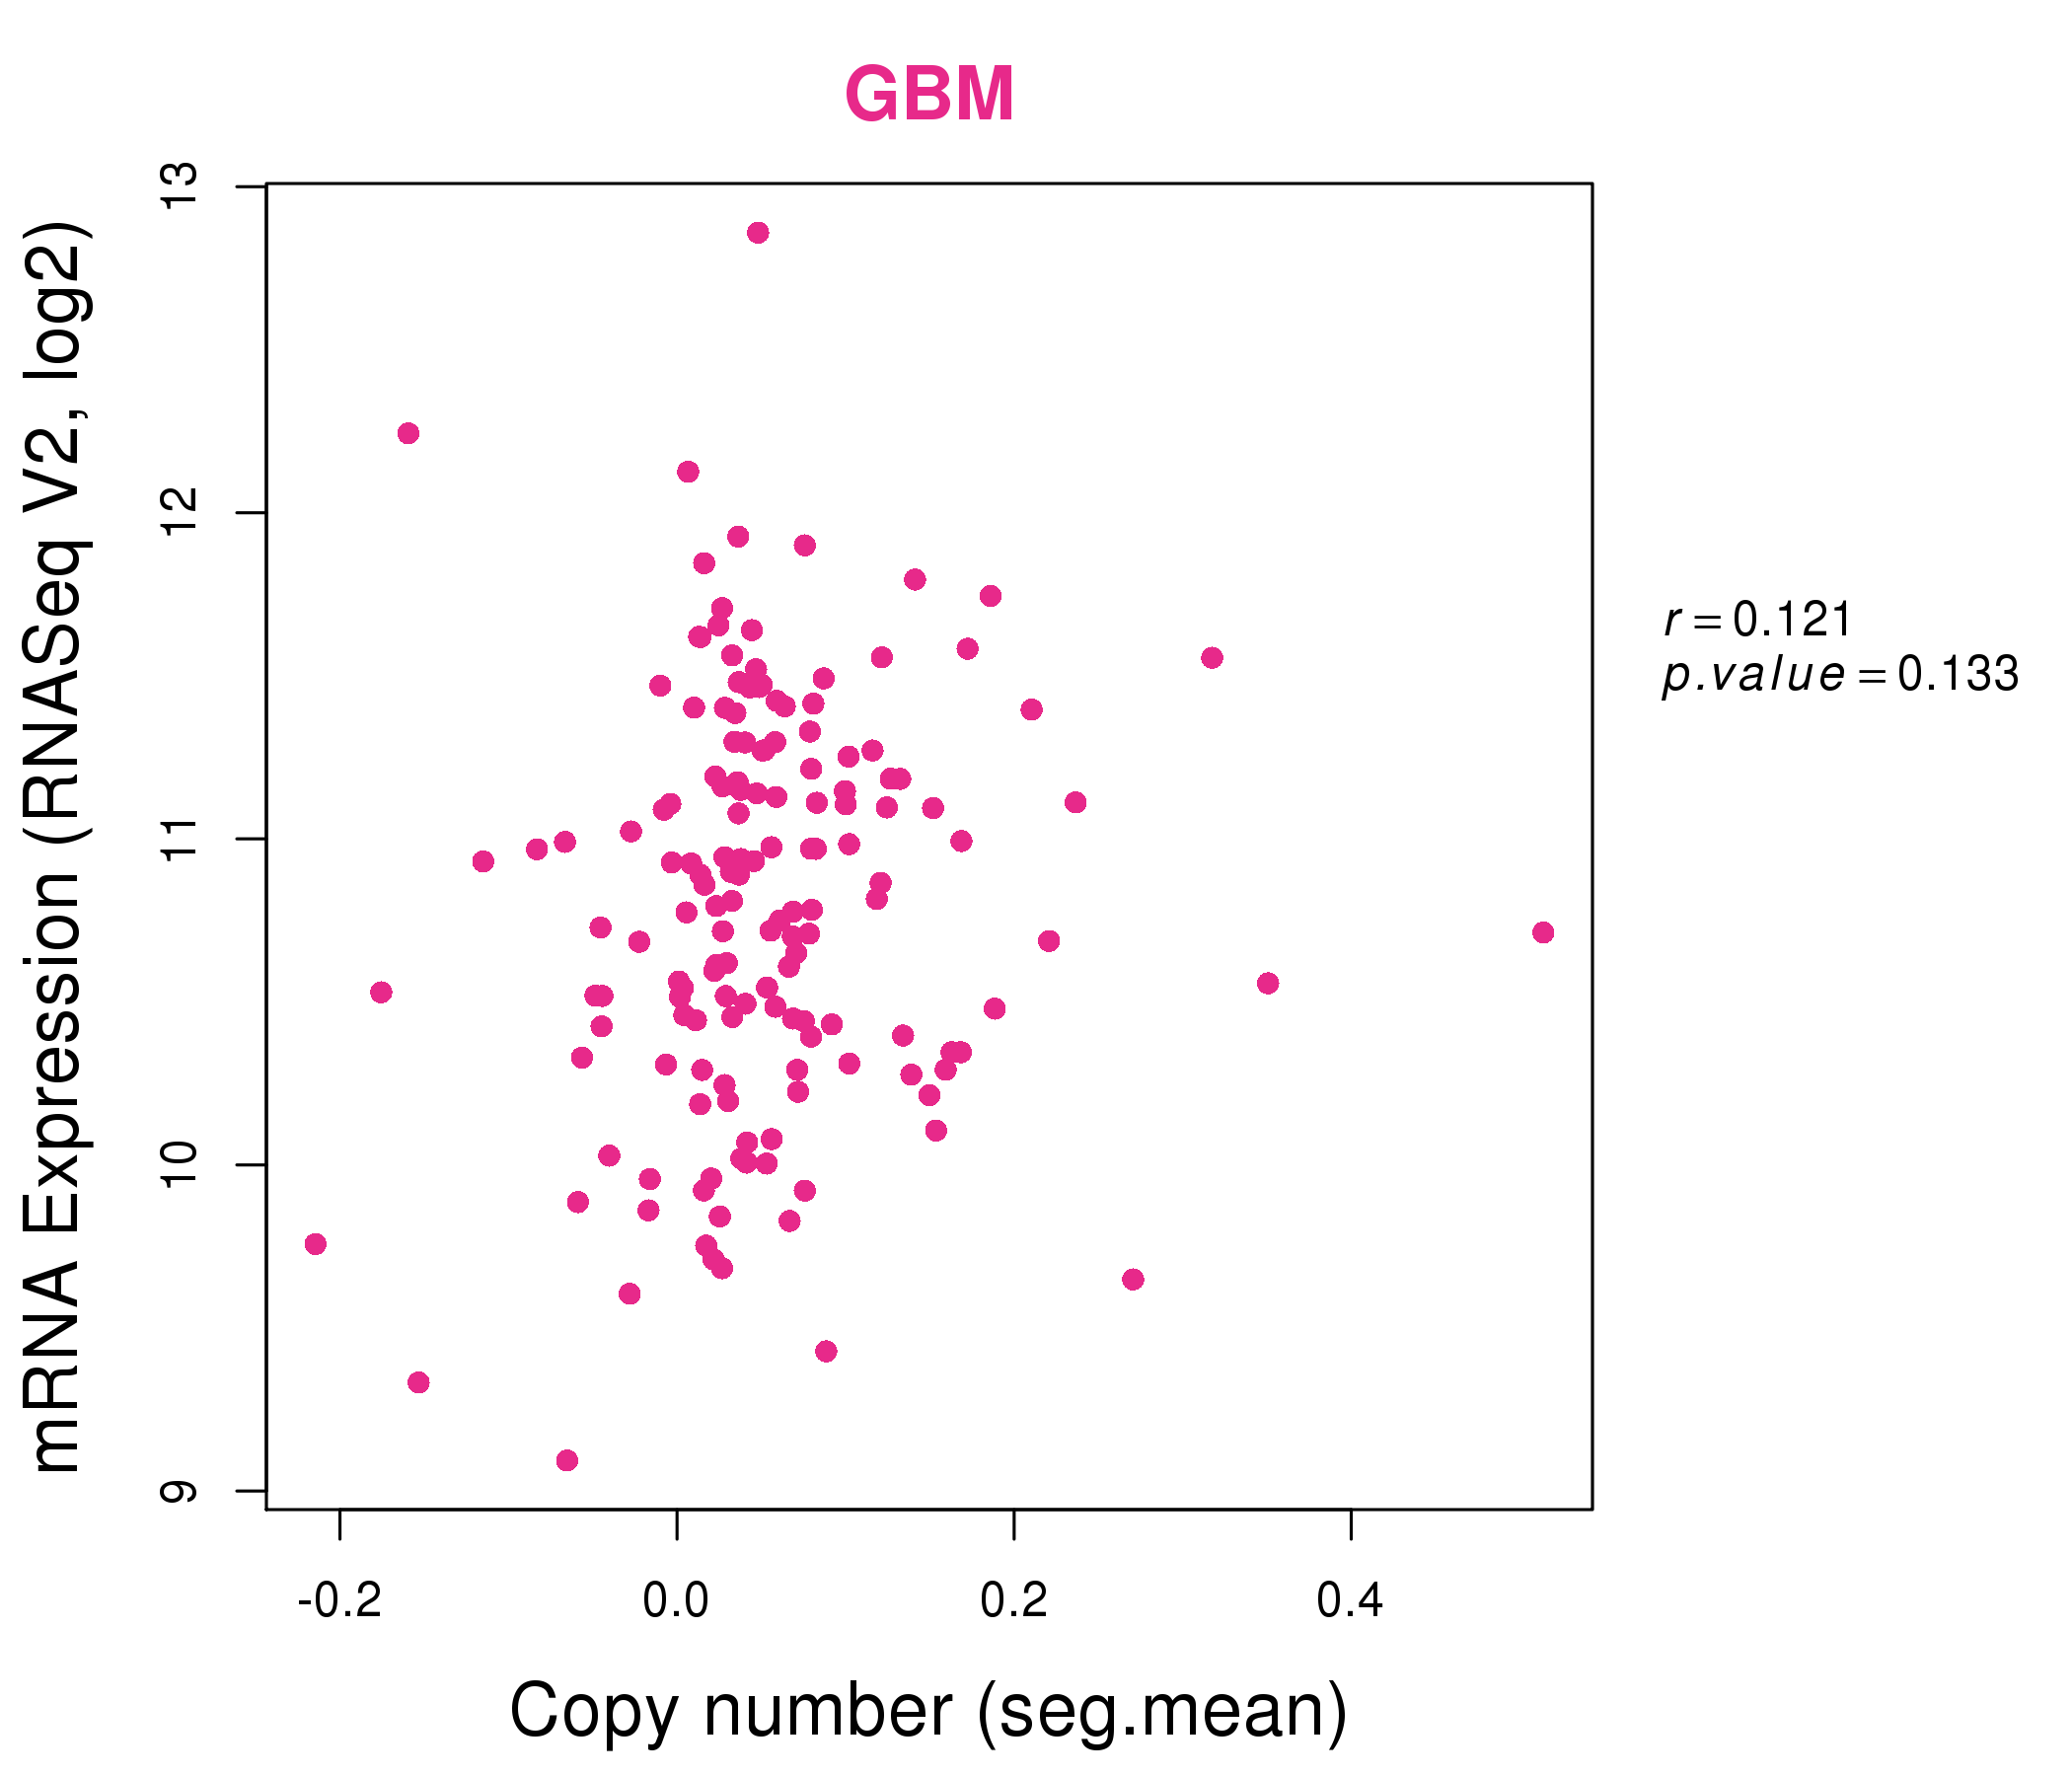
| * Normalized gene expression data of RNASeqV2 was extracted from TCGA using R package TCGA-Assembler. The URLs of all public data files on TCGA DCC data server were gathered at Jan-05-2015. Only eight cancer types have enough normal control samples for differential expression analysis. (t test, adjusted p<0.05 (using Benjamini-Hochberg FDR)) |
 |
| Top |
| * This plots show the correlation between CNV and gene expression. |
: Open all plots for all cancer types
 |
|
 |
|
| Top |
| Gene-Gene Network Information |
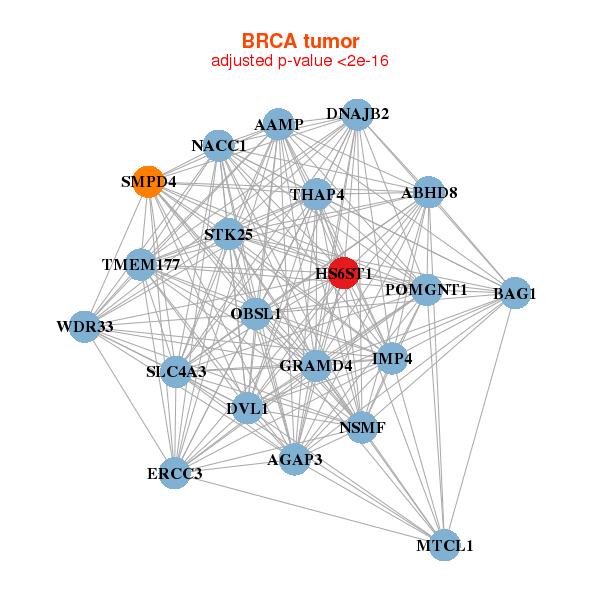
| * Co-Expression network figures were drawn using R package igraph. Only the top 20 genes with the highest correlations were shown. Red circle: input gene, orange circle: cell metabolism gene, sky circle: other gene |
: Open all plots for all cancer types
 |
|
| AAMP,ABHD8,AGAP3,BAG1,DNAJB2,DVL1,ERCC3, GRAMD4,HS6ST1,IMP4,MTCL1,NACC1,NSMF,OBSL1, POMGNT1,SLC4A3,SMPD4,STK25,THAP4,TMEM177,WDR33 | AGRN,ARVCF,CADM4,CAPN1,CHST10,EPS8L2,EVPL, FAM129B,FBXL19,H2AFY2,HS6ST1,ITGB4,LSR,NGFR, NKD2,PKP3,RTKN,SEPT9,SMARCA4,ST14,U2AF2 |
 |
|
| ASXL1,CEP250,CLASP1,DNAJC5,ELMO2,FMNL2,HS6ST1, LRP3,LSM14B,MYO7A,NCOA6,NOD2,OGFR,PLCG1, SLC5A6,SNRNP200,SNX21,TAF4,UGGT1,ZGPAT,ZNF319 | ARHGAP17,ATG2A,CACFD1,CLCN2,CLDN4,CLSTN1,CYTH2, GBA,GBAP1,GMIP,HS6ST1,JUP,LRP10,MARK2, NR2F6,OSBPL2,PCSK7,SLC9A1,TMEM127,TMEM8A,WWP2 |
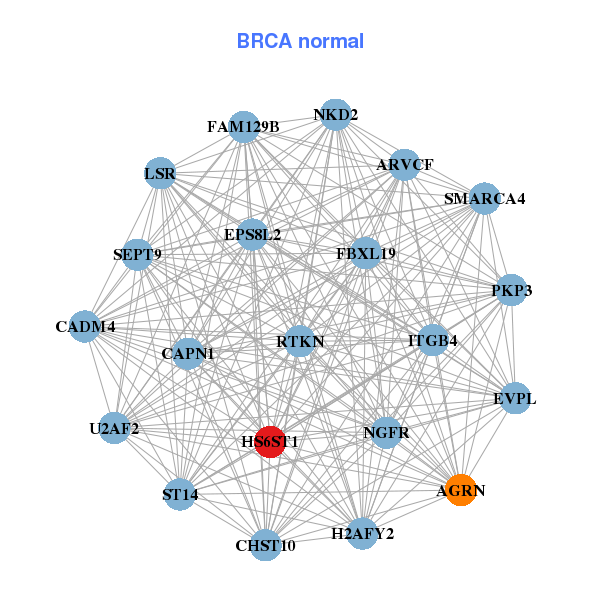
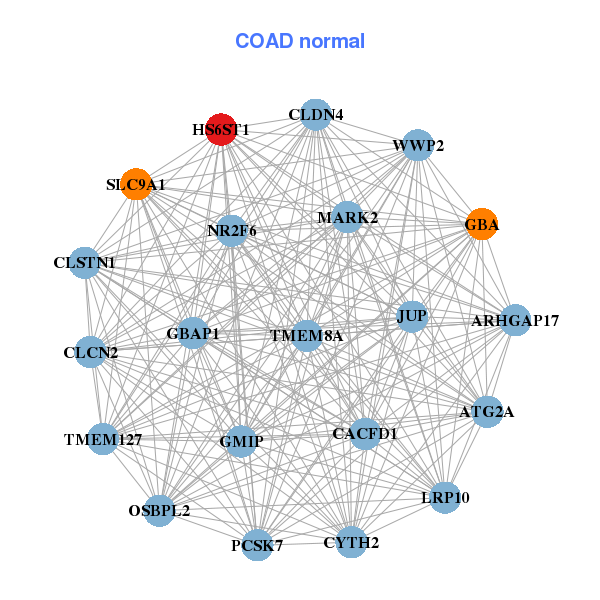
| * Co-Expression network figures were drawn using R package igraph. Only the top 20 genes with the highest correlations were shown. Red circle: input gene, orange circle: cell metabolism gene, sky circle: other gene |
: Open all plots for all cancer types
| Top |
: Open all interacting genes' information including KEGG pathway for all interacting genes from DAVID
| Top |
| Pharmacological Information for HS6ST1 |
| There's no related Drug. |
| Top |
| Cross referenced IDs for HS6ST1 |
| * We obtained these cross-references from Uniprot database. It covers 150 different DBs, 18 categories. http://www.uniprot.org/help/cross_references_section |
: Open all cross reference information
|
Copyright © 2016-Present - The Univsersity of Texas Health Science Center at Houston @ |