|
||||||||||||||||||||
| |
| Phenotypic Information (metabolism pathway, cancer, disease, phenome) |
| |
| |
| Gene-Gene Network Information: Co-Expression Network, Interacting Genes & KEGG |
| |
|


| Gene Summary for FTMT |
| Basic gene info. | Gene symbol | FTMT |
| Gene name | ferritin mitochondrial | |
| Synonyms | MTF | |
| Cytomap | UCSC genome browser: 5q21.3 | |
| Genomic location | chr5 :121187649-121188523 | |
| Type of gene | protein-coding | |
| RefGenes | NM_177478.1, | |
| Ensembl id | ENSG00000181867 | |
| Description | ferritin H subunitferritin, mitochondrialmitochondrial ferritin | |
| Modification date | 20141207 | |
| dbXrefs | MIM : 608847 | |
| HGNC : HGNC | ||
| Ensembl : ENSG00000181867 | ||
| HPRD : 12316 | ||
| Vega : OTTHUMG00000128912 | ||
| Protein | UniProt: go to UniProt's Cross Reference DB Table | |
| Expression | CleanEX: HS_FTMT | |
| BioGPS: 94033 | ||
| Gene Expression Atlas: ENSG00000181867 | ||
| The Human Protein Atlas: ENSG00000181867 | ||
| Pathway | NCI Pathway Interaction Database: FTMT | |
| KEGG: FTMT | ||
| REACTOME: FTMT | ||
| ConsensusPathDB | ||
| Pathway Commons: FTMT | ||
| Metabolism | MetaCyc: FTMT | |
| HUMANCyc: FTMT | ||
| Regulation | Ensembl's Regulation: ENSG00000181867 | |
| miRBase: chr5 :121,187,649-121,188,523 | ||
| TargetScan: NM_177478 | ||
| cisRED: ENSG00000181867 | ||
| Context | iHOP: FTMT | |
| cancer metabolism search in PubMed: FTMT | ||
| UCL Cancer Institute: FTMT | ||
| Assigned class in ccmGDB | C | |
| Top |
| Phenotypic Information for FTMT(metabolism pathway, cancer, disease, phenome) |
| Cancer | CGAP: FTMT |
| Familial Cancer Database: FTMT | |
| * This gene is included in those cancer gene databases. |
|
|
|
|
|
|
| ||||||||||||||
Oncogene 1 | Significant driver gene in | |||||||||||||||||||
| cf) number; DB name 1 Oncogene; http://nar.oxfordjournals.org/content/35/suppl_1/D721.long, 2 Tumor Suppressor gene; https://bioinfo.uth.edu/TSGene/, 3 Cancer Gene Census; http://www.nature.com/nrc/journal/v4/n3/abs/nrc1299.html, 4 CancerGenes; http://nar.oxfordjournals.org/content/35/suppl_1/D721.long, 5 Network of Cancer Gene; http://ncg.kcl.ac.uk/index.php, 1Therapeutic Vulnerabilities in Cancer; http://cbio.mskcc.org/cancergenomics/statius/ |
| KEGG_PORPHYRIN_AND_CHLOROPHYLL_METABOLISM | |
| OMIM | |
| Orphanet | |
| Disease | KEGG Disease: FTMT |
| MedGen: FTMT (Human Medical Genetics with Condition) | |
| ClinVar: FTMT | |
| Phenotype | MGI: FTMT (International Mouse Phenotyping Consortium) |
| PhenomicDB: FTMT | |
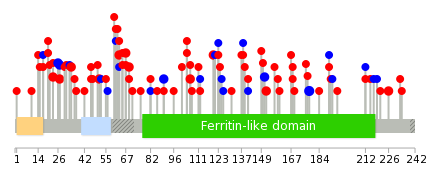
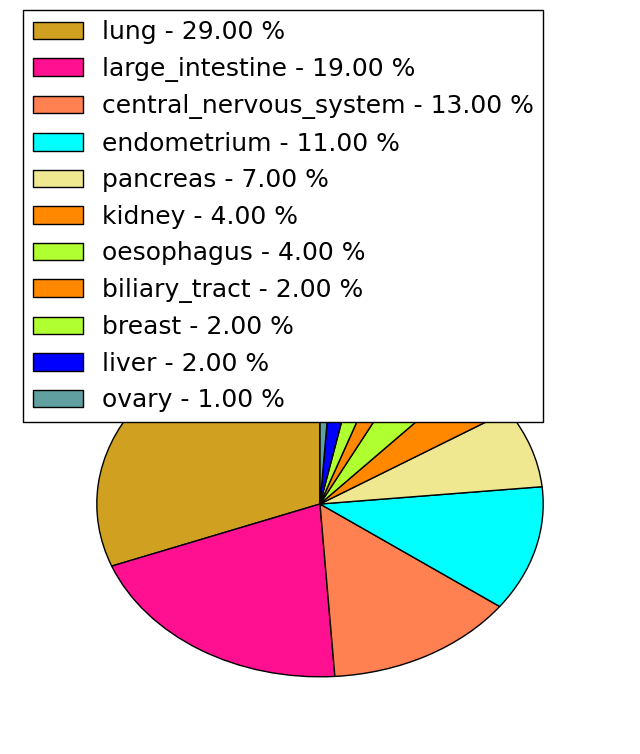
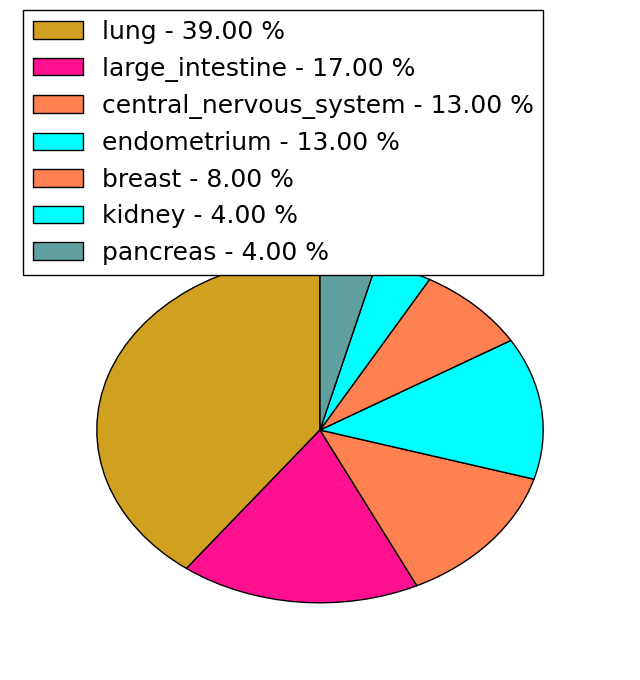
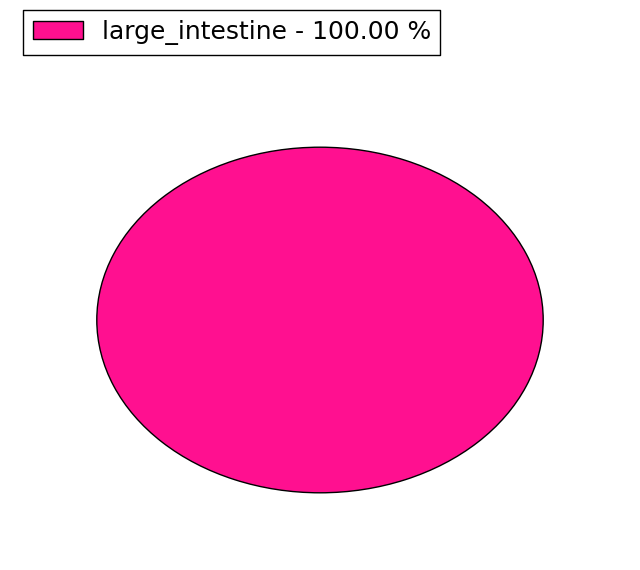
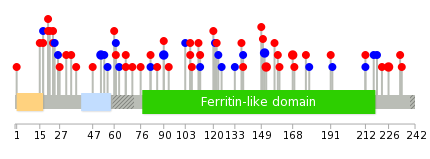
| Mutations for FTMT |
| * Under tables are showing count per each tissue to give us broad intuition about tissue specific mutation patterns.You can go to the detailed page for each mutation database's web site. |
| There's no structural variation information in COSMIC data for this gene. |
| * From mRNA Sanger sequences, Chitars2.0 arranged chimeric transcripts. This table shows FTMT related fusion information. |
| ID | Head Gene | Tail Gene | Accession | Gene_a | qStart_a | qEnd_a | Chromosome_a | tStart_a | tEnd_a | Gene_a | qStart_a | qEnd_a | Chromosome_a | tStart_a | tEnd_a |
| Top |
| There's no copy number variation information in COSMIC data for this gene. |
| Top |
|
 |
| Top |
| Stat. for Non-Synonymous SNVs (# total SNVs=68) | (# total SNVs=23) |
 |  |
(# total SNVs=1) | (# total SNVs=0) |
 |
| Top |
| * When you move the cursor on each content, you can see more deailed mutation information on the Tooltip. Those are primary_site,primary_histology,mutation(aa),pubmedID. |
| GRCh37 position | Mutation(aa) | Unique sampleID count |
| chr5:121187974-121187974 | p.V106L | 3 |
| chr5:121188192-121188192 | p.H178H | 3 |
| chr5:121187845-121187845 | p.A63S | 3 |
| chr5:121187928-121187928 | p.A90A | 2 |
| chr5:121187809-121187809 | p.A51T | 2 |
| chr5:121187858-121187858 | p.R67Q | 2 |
| chr5:121187716-121187716 | p.R20S | 2 |
| chr5:121187863-121187863 | p.R69C | 2 |
| chr5:121187759-121187759 | p.P34L | 2 |
| chr5:121188111-121188111 | p.D151D | 2 |
| Top |
|
 |
| Point Mutation/ Tissue ID | 1 | 2 | 3 | 4 | 5 | 6 | 7 | 8 | 9 | 10 | 11 | 12 | 13 | 14 | 15 | 16 | 17 | 18 | 19 | 20 |
| # sample | 1 | 1 | 8 | 5 | 6 | 1 | 2 | 2 | 12 | 6 | 1 | 8 | 5 | 11 | ||||||
| # mutation | 1 | 1 | 8 | 5 | 6 | 1 | 2 | 2 | 12 | 9 | 1 | 10 | 5 | 10 | ||||||
| nonsynonymous SNV | 6 | 4 | 4 | 1 | 2 | 1 | 7 | 7 | 1 | 6 | 3 | 7 | ||||||||
| synonymous SNV | 1 | 1 | 2 | 1 | 2 | 1 | 5 | 2 | 4 | 2 | 3 |
| cf) Tissue ID; Tissue type (1; BLCA[Bladder Urothelial Carcinoma], 2; BRCA[Breast invasive carcinoma], 3; CESC[Cervical squamous cell carcinoma and endocervical adenocarcinoma], 4; COAD[Colon adenocarcinoma], 5; GBM[Glioblastoma multiforme], 6; Glioma Low Grade, 7; HNSC[Head and Neck squamous cell carcinoma], 8; KICH[Kidney Chromophobe], 9; KIRC[Kidney renal clear cell carcinoma], 10; KIRP[Kidney renal papillary cell carcinoma], 11; LAML[Acute Myeloid Leukemia], 12; LUAD[Lung adenocarcinoma], 13; LUSC[Lung squamous cell carcinoma], 14; OV[Ovarian serous cystadenocarcinoma ], 15; PAAD[Pancreatic adenocarcinoma], 16; PRAD[Prostate adenocarcinoma], 17; SKCM[Skin Cutaneous Melanoma], 18:STAD[Stomach adenocarcinoma], 19:THCA[Thyroid carcinoma], 20:UCEC[Uterine Corpus Endometrial Carcinoma]) |
| Top |
| * We represented just top 10 SNVs. When you move the cursor on each content, you can see more deailed mutation information on the Tooltip. Those are primary_site, primary_histology, mutation(aa), pubmedID. |
| Genomic Position | Mutation(aa) | Unique sampleID count |
| chr5:121187716 | p.A90A | 2 |
| chr5:121187814 | p.A52A | 2 |
| chr5:121188111 | p.V106M | 2 |
| chr5:121188112 | p.D151D | 2 |
| chr5:121187928 | p.A226V | 2 |
| chr5:121188162 | p.D152N | 2 |
| chr5:121188335 | p.R20C | 2 |
| chr5:121187974 | p.K168N | 2 |
| chr5:121188072 | p.A90V | 1 |
| chr5:121187797 | p.G138A | 1 |
| * Copy number data were extracted from TCGA using R package TCGA-Assembler. The URLs of all public data files on TCGA DCC data server were gathered on Jan-05-2015. Function ProcessCNAData in TCGA-Assembler package was used to obtain gene-level copy number value which is calculated as the average copy number of the genomic region of a gene. |
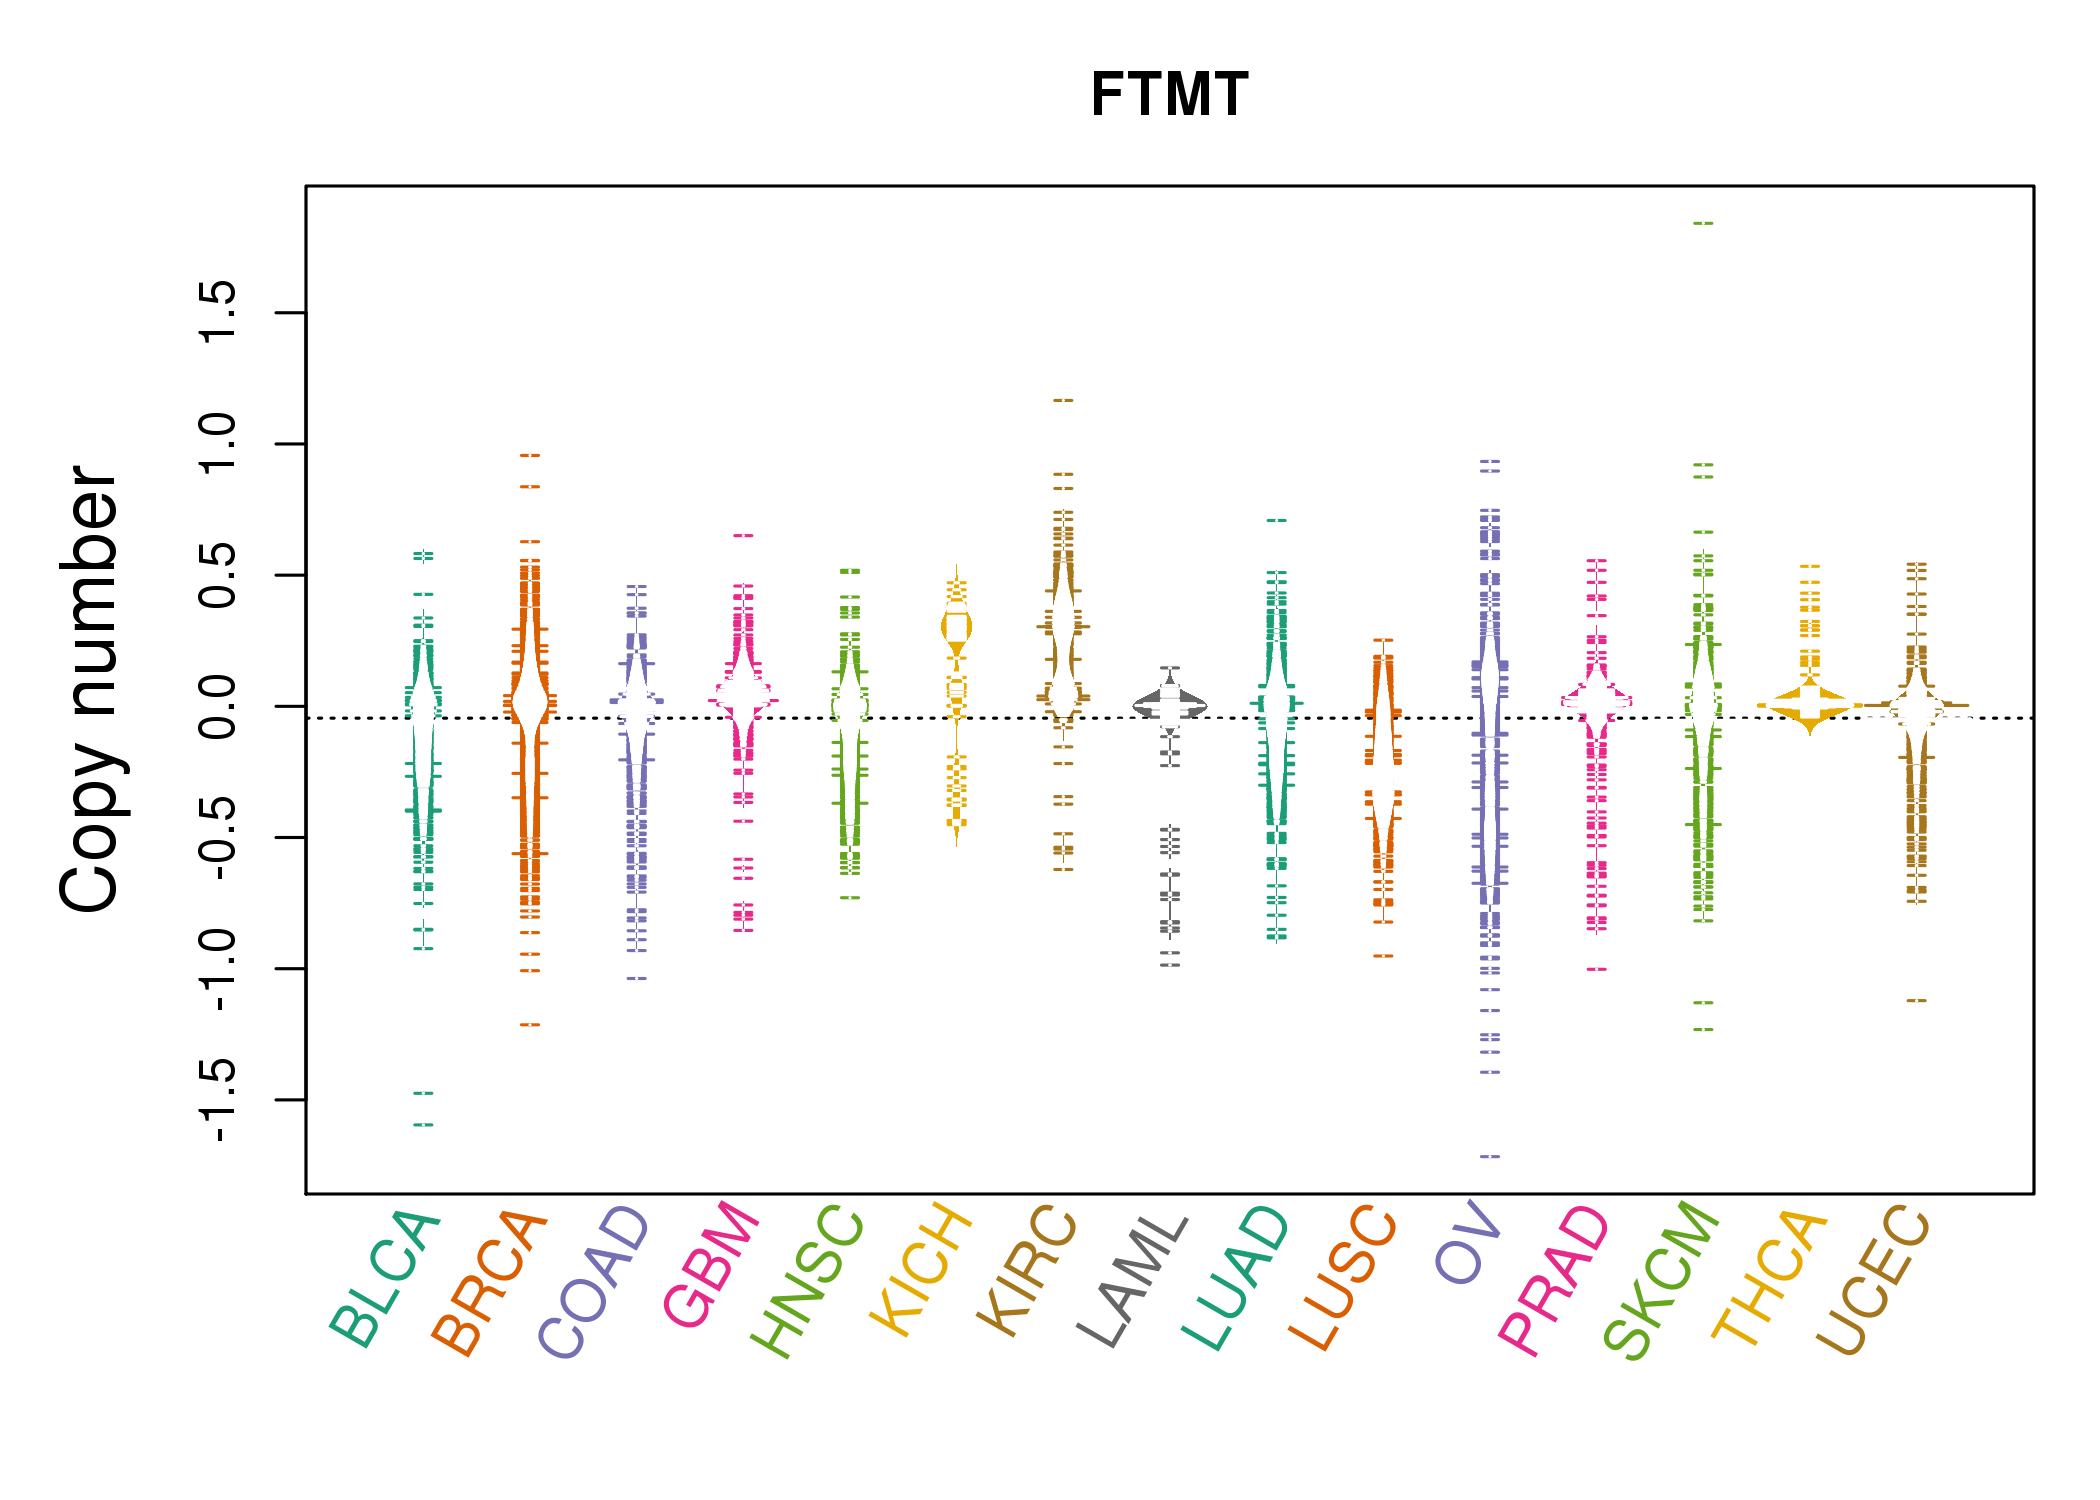 |
| cf) Tissue ID[Tissue type]: BLCA[Bladder Urothelial Carcinoma], BRCA[Breast invasive carcinoma], CESC[Cervical squamous cell carcinoma and endocervical adenocarcinoma], COAD[Colon adenocarcinoma], GBM[Glioblastoma multiforme], Glioma Low Grade, HNSC[Head and Neck squamous cell carcinoma], KICH[Kidney Chromophobe], KIRC[Kidney renal clear cell carcinoma], KIRP[Kidney renal papillary cell carcinoma], LAML[Acute Myeloid Leukemia], LUAD[Lung adenocarcinoma], LUSC[Lung squamous cell carcinoma], OV[Ovarian serous cystadenocarcinoma ], PAAD[Pancreatic adenocarcinoma], PRAD[Prostate adenocarcinoma], SKCM[Skin Cutaneous Melanoma], STAD[Stomach adenocarcinoma], THCA[Thyroid carcinoma], UCEC[Uterine Corpus Endometrial Carcinoma] |
| Top |
| Gene Expression for FTMT |
| * CCLE gene expression data were extracted from CCLE_Expression_Entrez_2012-10-18.res: Gene-centric RMA-normalized mRNA expression data. |
 |
| * Normalized gene expression data of RNASeqV2 was extracted from TCGA using R package TCGA-Assembler. The URLs of all public data files on TCGA DCC data server were gathered at Jan-05-2015. Only eight cancer types have enough normal control samples for differential expression analysis. (t test, adjusted p<0.05 (using Benjamini-Hochberg FDR)) |
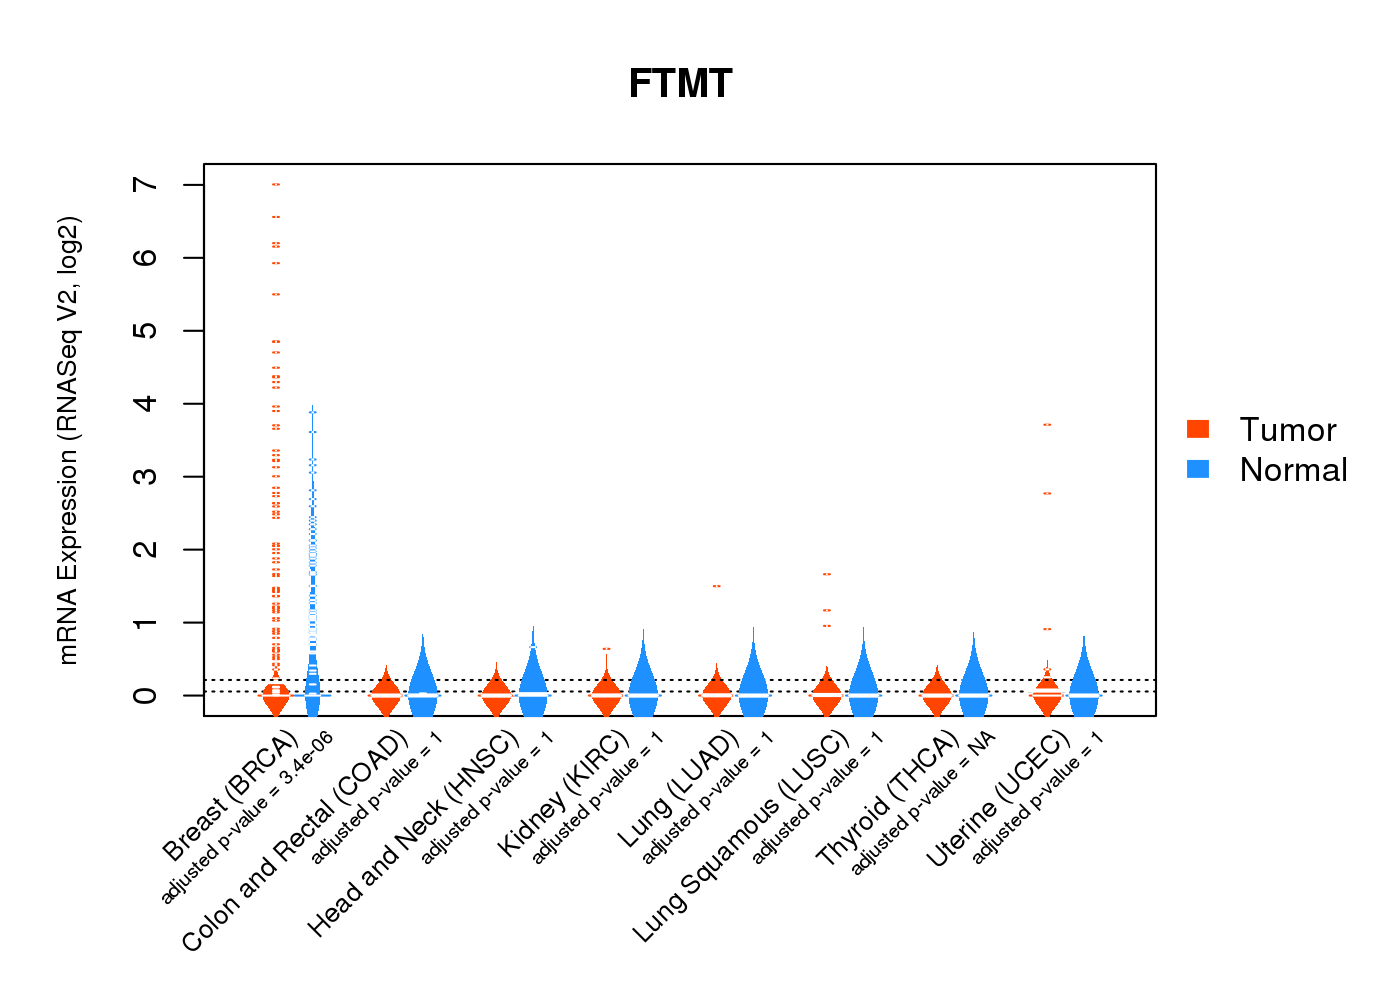 |
| Top |
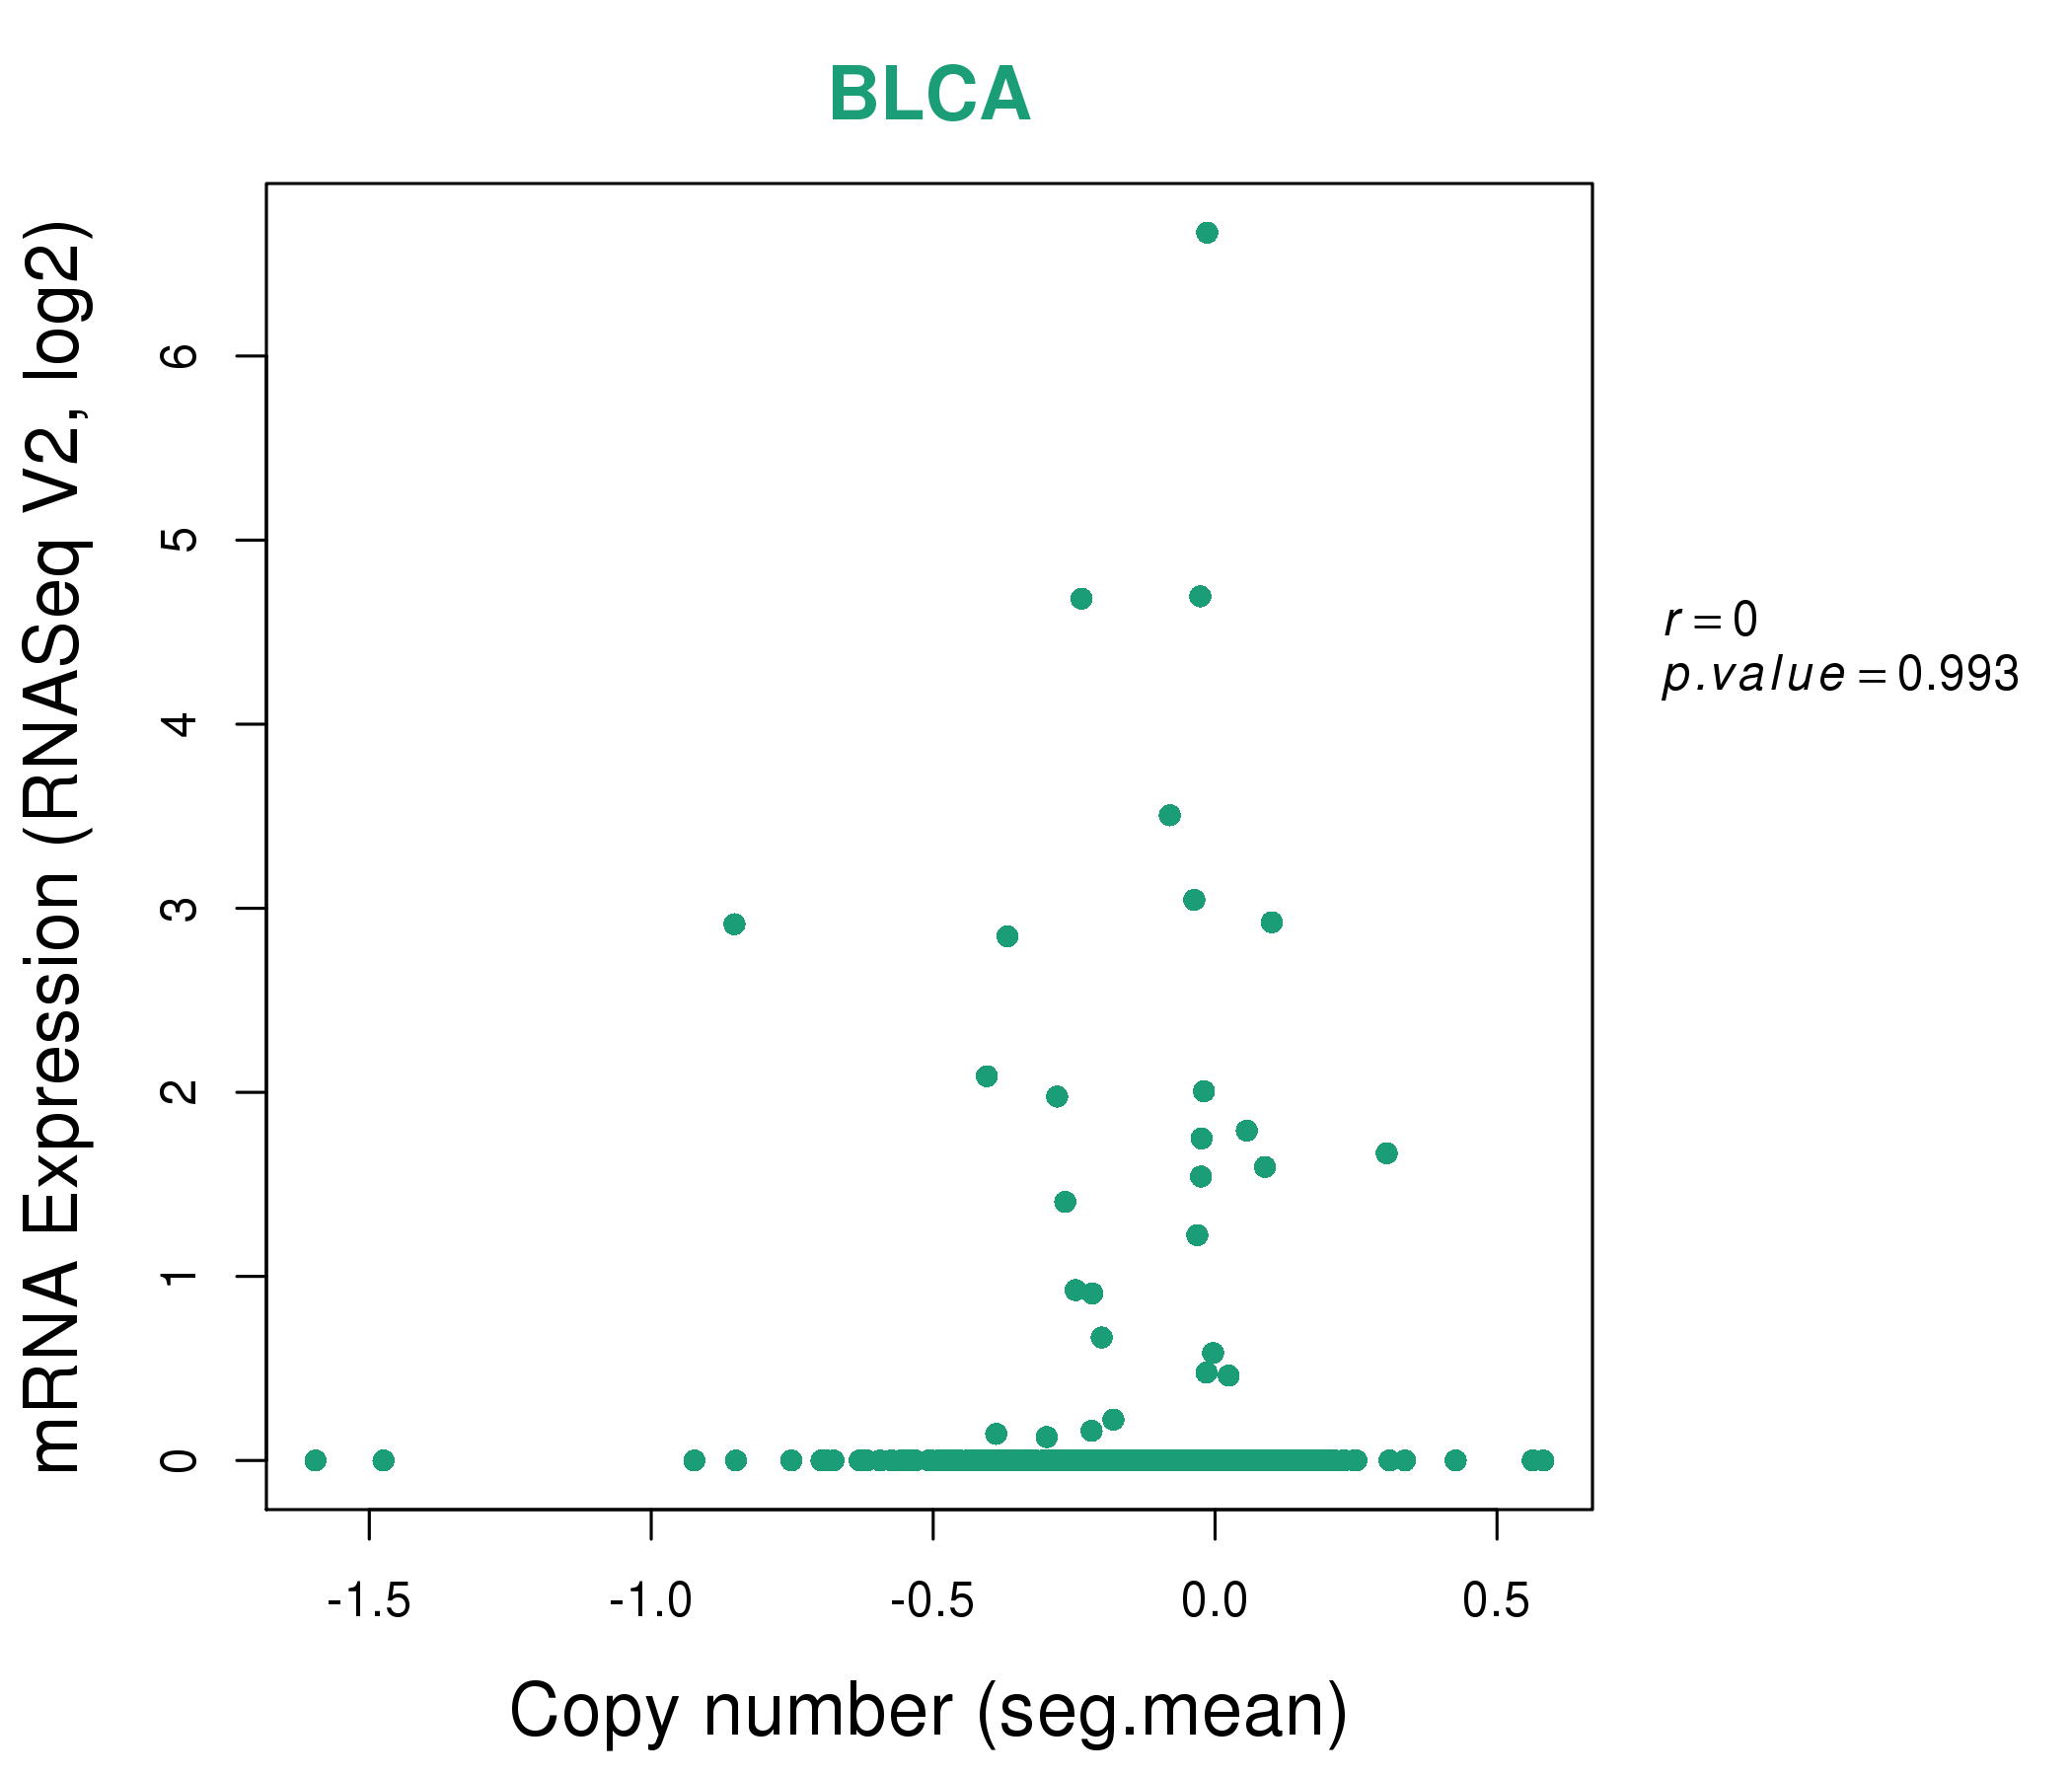
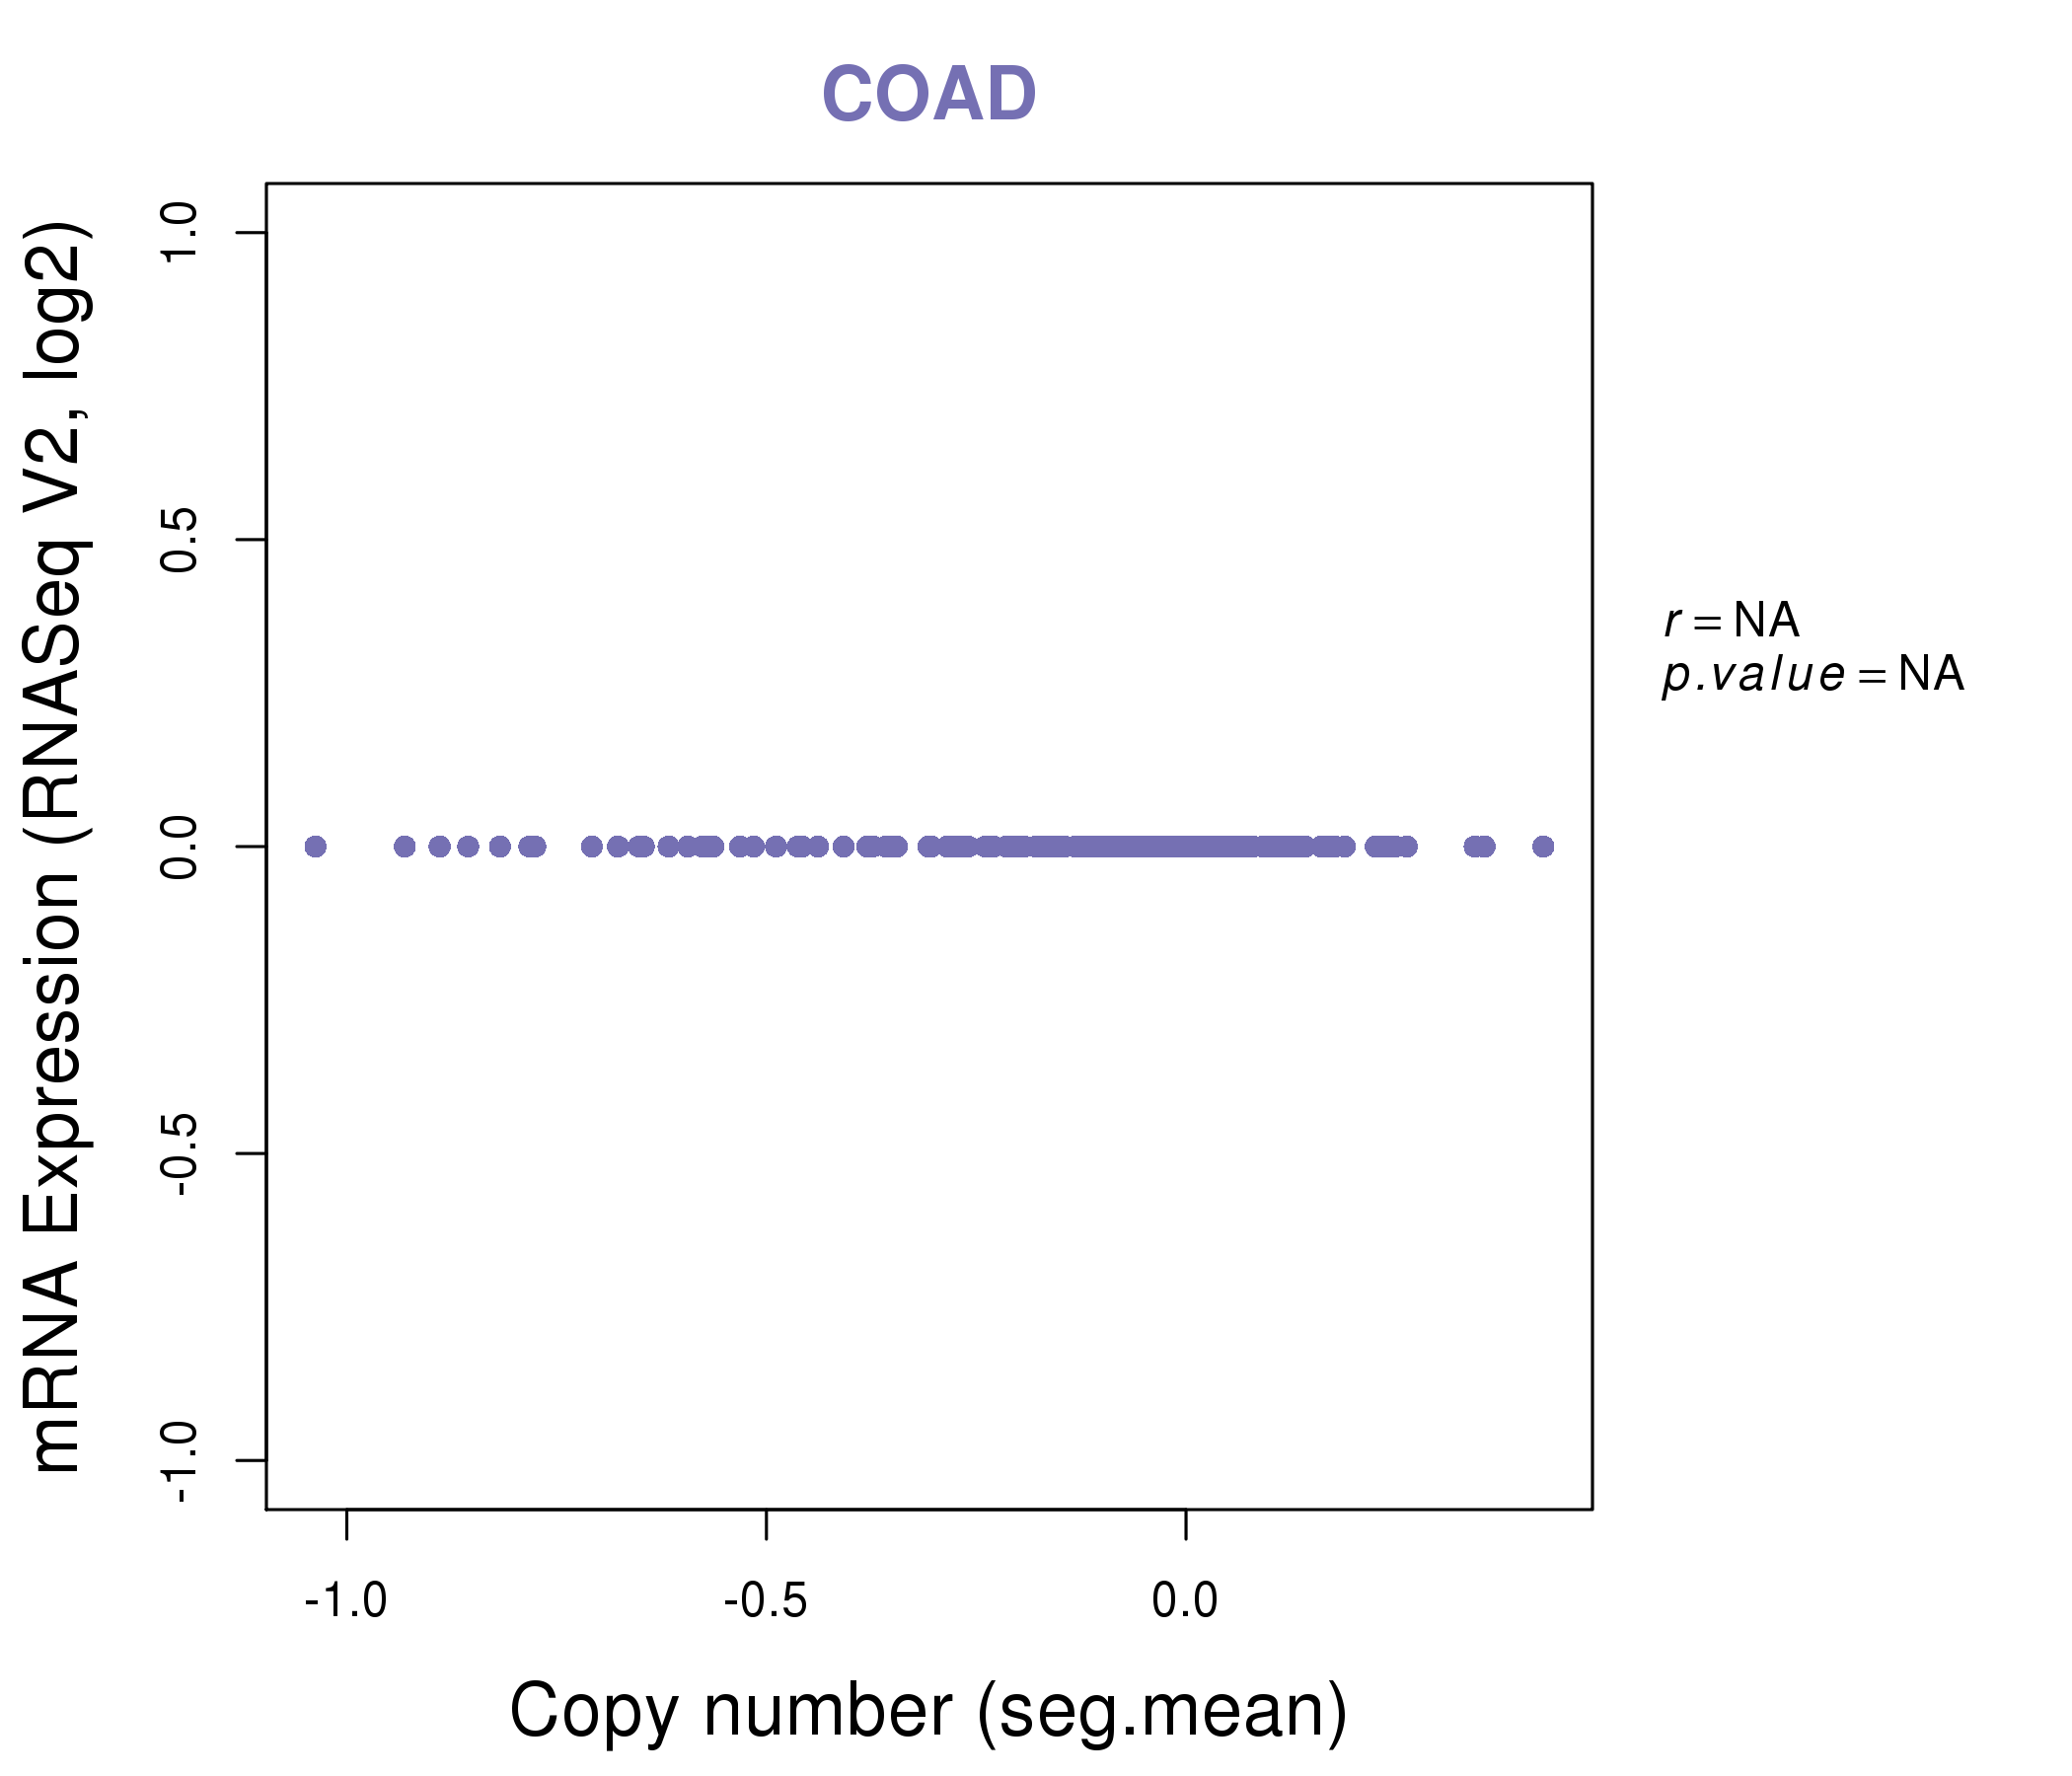
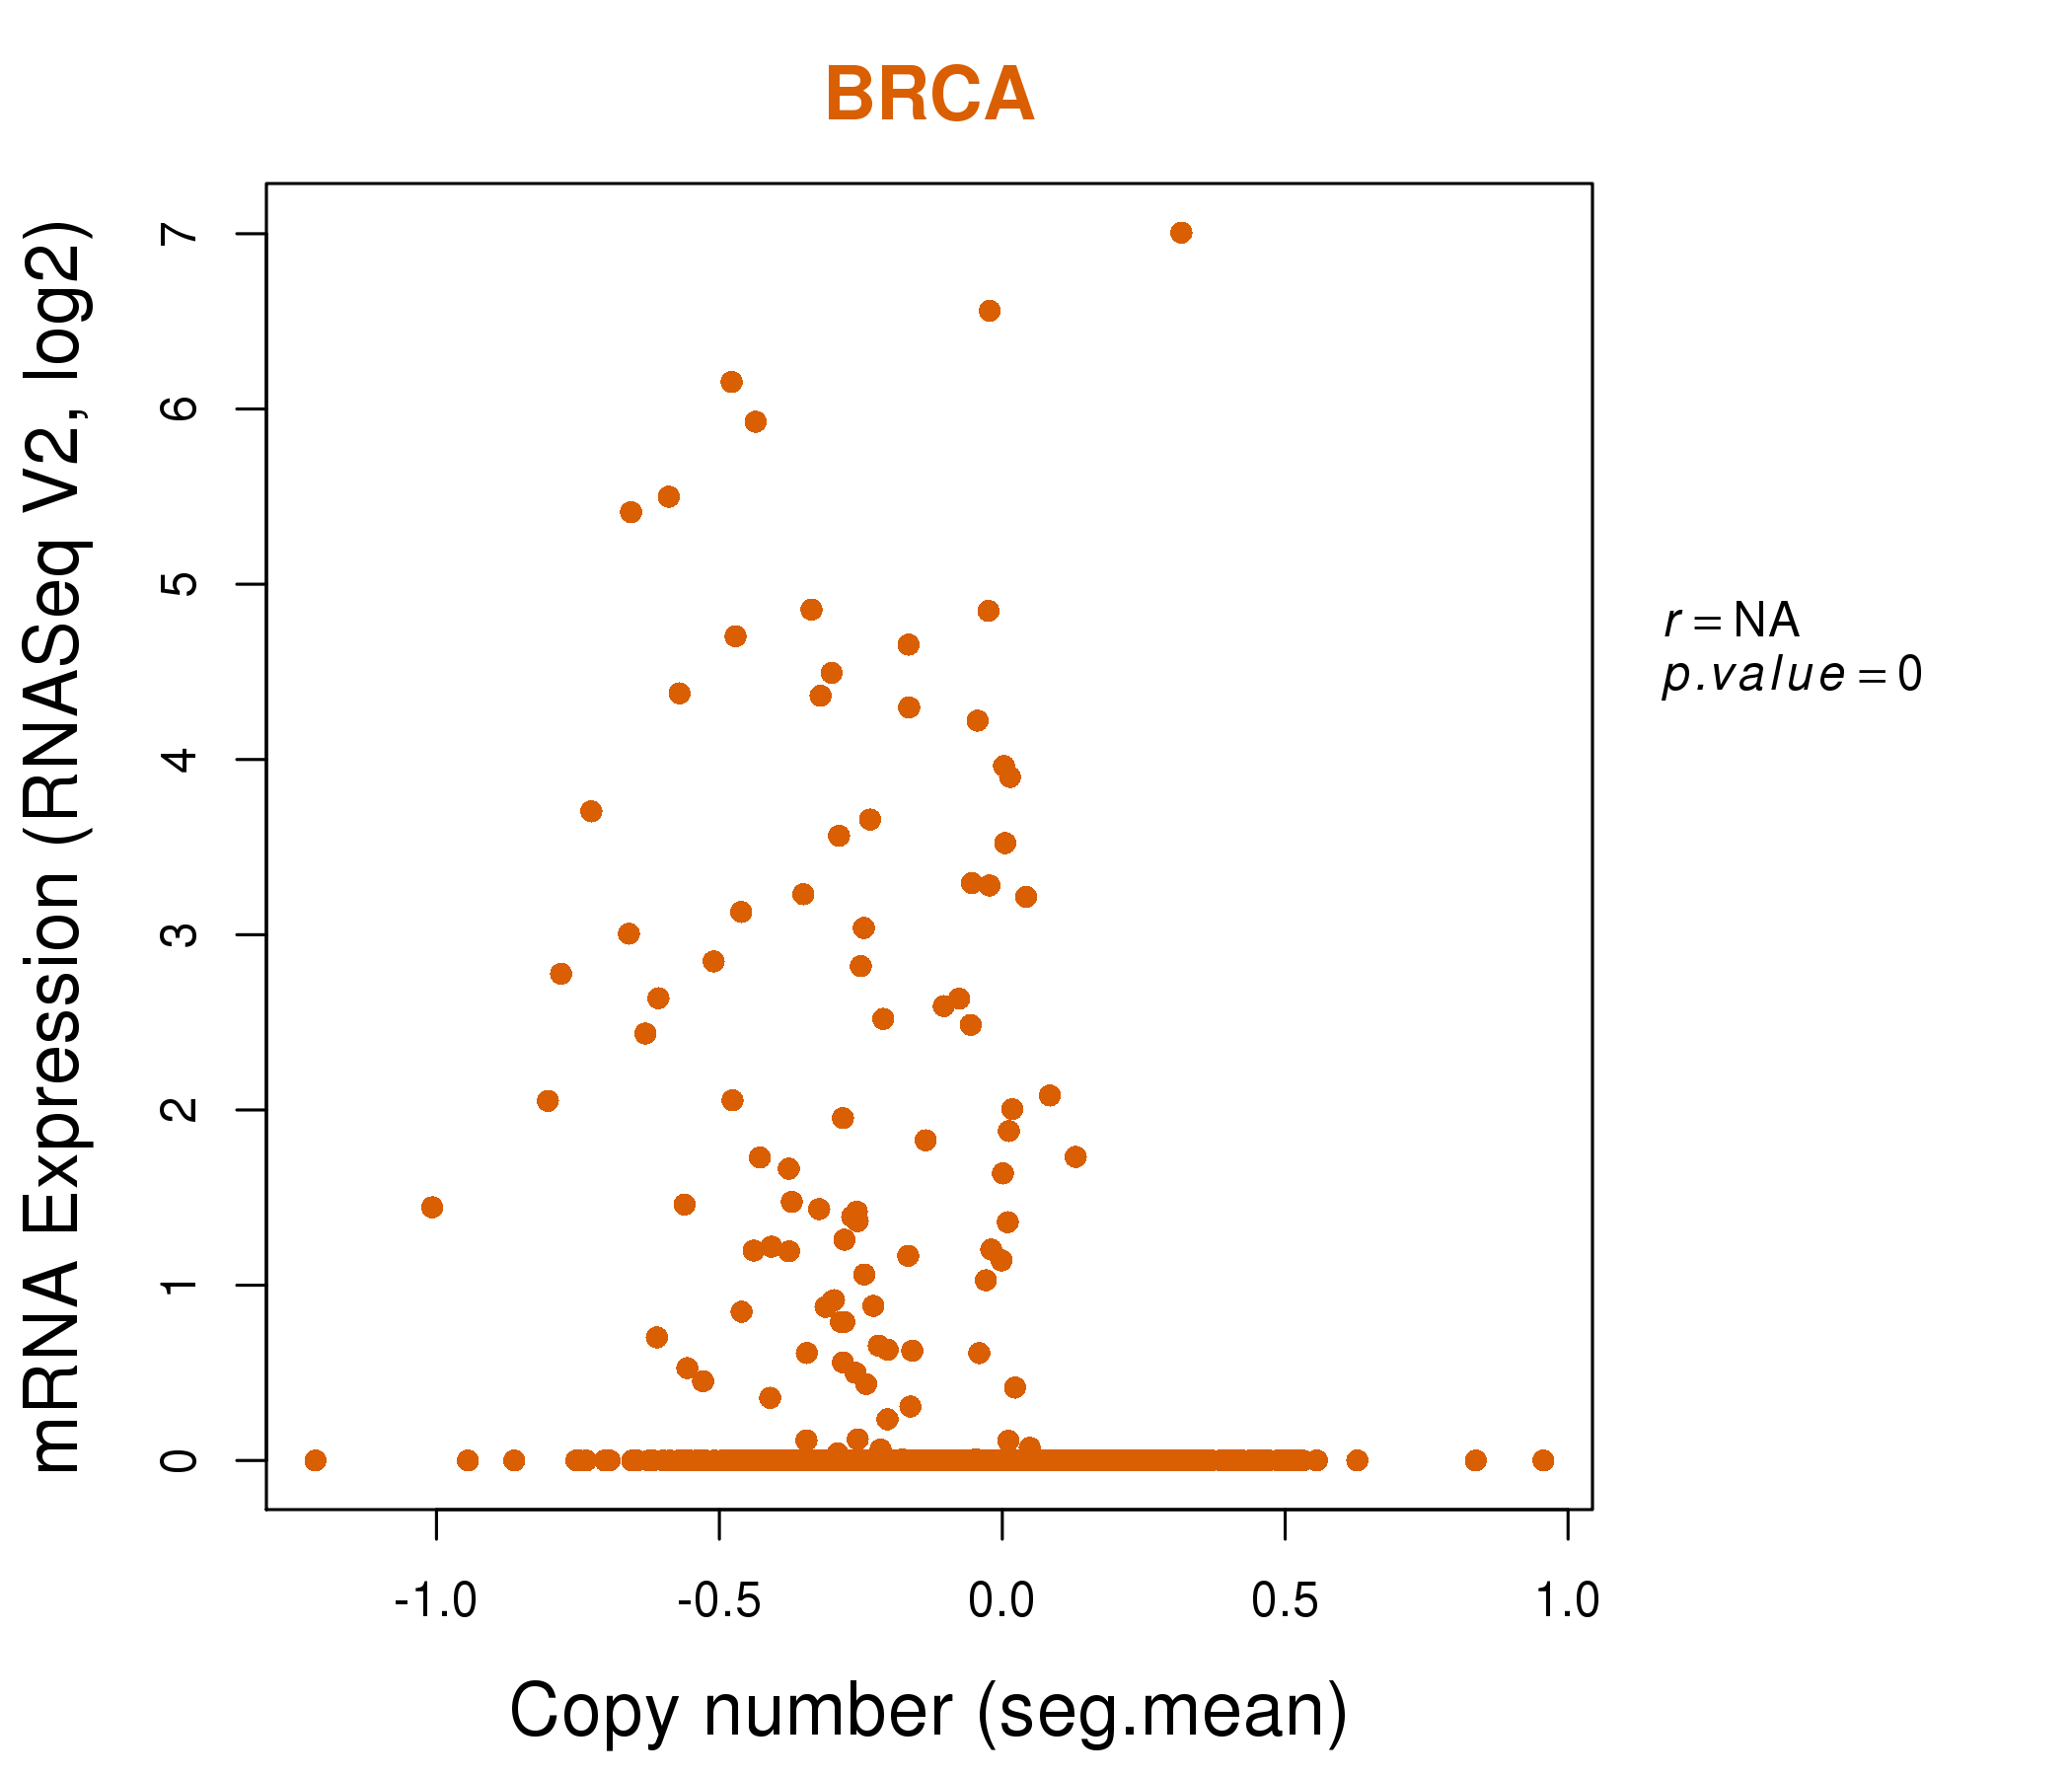
| * This plots show the correlation between CNV and gene expression. |
: Open all plots for all cancer types
 |
|
 |
|

| Top |
| Gene-Gene Network Information |
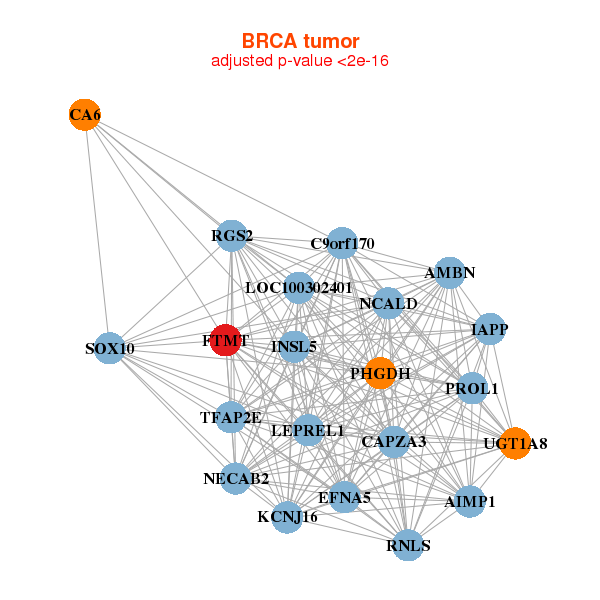
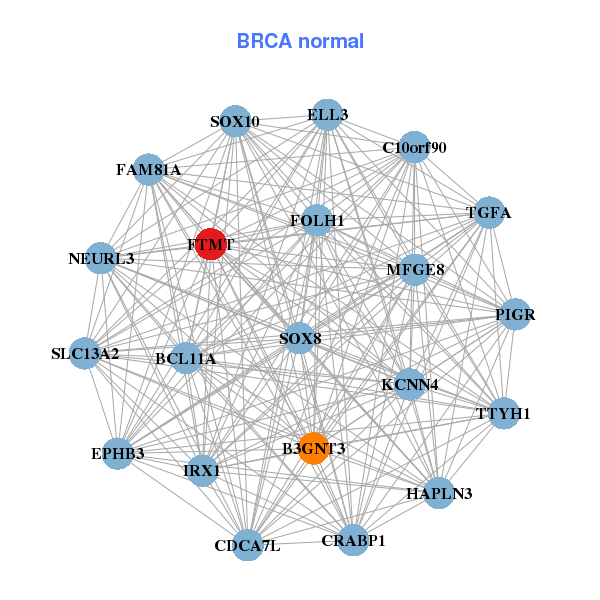
| * Co-Expression network figures were drawn using R package igraph. Only the top 20 genes with the highest correlations were shown. Red circle: input gene, orange circle: cell metabolism gene, sky circle: other gene |
: Open all plots for all cancer types
 |
|
| AIMP1,AMBN,C9orf170,CA6,CAPZA3,EFNA5,FTMT, IAPP,INSL5,KCNJ16,LEPREL1,LOC100302401,NCALD,NECAB2, PHGDH,PROL1,RGS2,RNLS,SOX10,TFAP2E,UGT1A8 | B3GNT3,BCL11A,C10orf90,CDCA7L,CRABP1,ELL3,EPHB3, FAM81A,FOLH1,FTMT,HAPLN3,IRX1,KCNN4,MFGE8, NEURL3,PIGR,SLC13A2,SOX10,SOX8,TGFA,TTYH1 |
 |
|
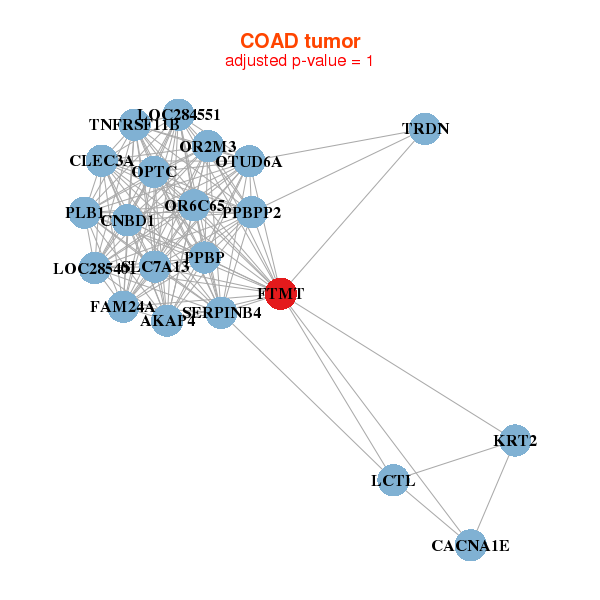
| AKAP4,CACNA1E,CLEC3A,CNBD1,FAM24A,FTMT,KRT2, LCTL,LOC284551,LOC285401,OPTC,OR2M3,OR6C65,OTUD6A, PLB1,PPBP,PPBPP2,SERPINB4,SLC7A13,TNFRSF11B,TRDN | C15orf32,C2orf78,FAM9B,FTMT,GOLGA6L1,HP,HTR1A, IQCF3,LCE1E,MAGEC3,MOGAT1,ORM1,ORM2,PRINS, PRR25,SCGB2A2,SNORA71C,SPINK6,TPD52L3,UBE2DNL,UBQLN3 |
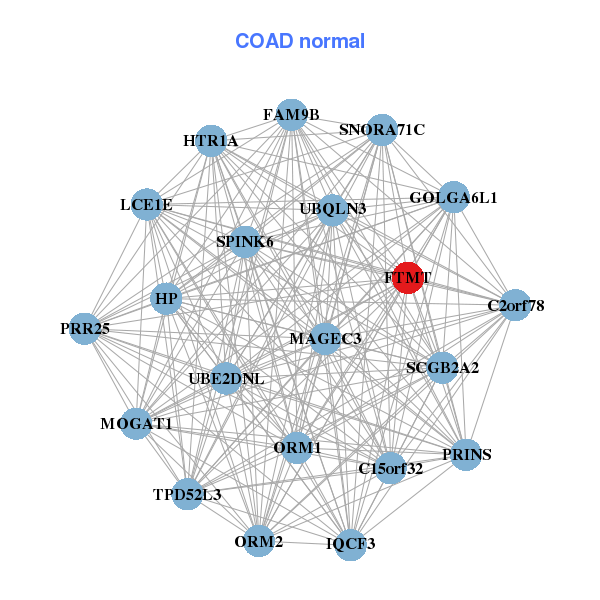
| * Co-Expression network figures were drawn using R package igraph. Only the top 20 genes with the highest correlations were shown. Red circle: input gene, orange circle: cell metabolism gene, sky circle: other gene |
: Open all plots for all cancer types
| Top |
: Open all interacting genes' information including KEGG pathway for all interacting genes from DAVID
| Top |
| Pharmacological Information for FTMT |
| There's no related Drug. |
| Top |
| Cross referenced IDs for FTMT |
| * We obtained these cross-references from Uniprot database. It covers 150 different DBs, 18 categories. http://www.uniprot.org/help/cross_references_section |
: Open all cross reference information
|
Copyright © 2016-Present - The Univsersity of Texas Health Science Center at Houston @ |