|
||||||||||||||||||||
| |
| Phenotypic Information (metabolism pathway, cancer, disease, phenome) |
| |
| |
| Gene-Gene Network Information: Co-Expression Network, Interacting Genes & KEGG |
| |
|


| Gene Summary for FADS2 |
| Basic gene info. | Gene symbol | FADS2 |
| Gene name | fatty acid desaturase 2 | |
| Synonyms | D6D|DES6|FADSD6|LLCDL2|SLL0262|TU13 | |
| Cytomap | UCSC genome browser: 11q12.2 | |
| Genomic location | chr11 :61595712-61634825 | |
| Type of gene | protein-coding | |
| RefGenes | NM_001281501.1, NM_001281502.1,NM_004265.3, | |
| Ensembl id | ENSG00000134824 | |
| Description | delta(6) desaturasedelta(6) fatty acid desaturasedelta-6 desaturasedelta-6 fatty acid desaturasedelta-6-desaturaselinoleoyl-CoA desaturase (delta-6-desaturase)-like 2 | |
| Modification date | 20141211 | |
| dbXrefs | MIM : 606149 | |
| HGNC : HGNC | ||
| Ensembl : ENSG00000134824 | ||
| HPRD : 05854 | ||
| Vega : OTTHUMG00000163794 | ||
| Protein | UniProt: go to UniProt's Cross Reference DB Table | |
| Expression | CleanEX: HS_FADS2 | |
| BioGPS: 9415 | ||
| Gene Expression Atlas: ENSG00000134824 | ||
| The Human Protein Atlas: ENSG00000134824 | ||
| Pathway | NCI Pathway Interaction Database: FADS2 | |
| KEGG: FADS2 | ||
| REACTOME: FADS2 | ||
| ConsensusPathDB | ||
| Pathway Commons: FADS2 | ||
| Metabolism | MetaCyc: FADS2 | |
| HUMANCyc: FADS2 | ||
| Regulation | Ensembl's Regulation: ENSG00000134824 | |
| miRBase: chr11 :61,595,712-61,634,825 | ||
| TargetScan: NM_001281501 | ||
| cisRED: ENSG00000134824 | ||
| Context | iHOP: FADS2 | |
| cancer metabolism search in PubMed: FADS2 | ||
| UCL Cancer Institute: FADS2 | ||
| Assigned class in ccmGDB | C | |
| Top |
| Phenotypic Information for FADS2(metabolism pathway, cancer, disease, phenome) |
| Cancer | CGAP: FADS2 |
| Familial Cancer Database: FADS2 | |
| * This gene is included in those cancer gene databases. |
|
|
|
|
|
| . | ||||||||||||||
Oncogene 1 | Significant driver gene in | |||||||||||||||||||
| cf) number; DB name 1 Oncogene; http://nar.oxfordjournals.org/content/35/suppl_1/D721.long, 2 Tumor Suppressor gene; https://bioinfo.uth.edu/TSGene/, 3 Cancer Gene Census; http://www.nature.com/nrc/journal/v4/n3/abs/nrc1299.html, 4 CancerGenes; http://nar.oxfordjournals.org/content/35/suppl_1/D721.long, 5 Network of Cancer Gene; http://ncg.kcl.ac.uk/index.php, 1Therapeutic Vulnerabilities in Cancer; http://cbio.mskcc.org/cancergenomics/statius/ |
| KEGG_ALPHA_LINOLENIC_ACID_METABOLISM REACTOME_METABOLISM_OF_LIPIDS_AND_LIPOPROTEINS | |
| OMIM | |
| Orphanet | |
| Disease | KEGG Disease: FADS2 |
| MedGen: FADS2 (Human Medical Genetics with Condition) | |
| ClinVar: FADS2 | |
| Phenotype | MGI: FADS2 (International Mouse Phenotyping Consortium) |
| PhenomicDB: FADS2 | |
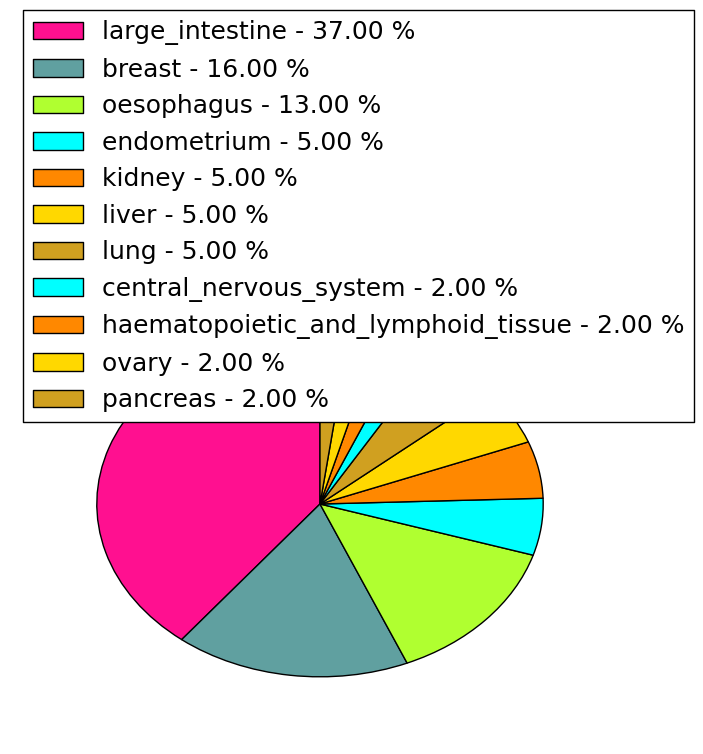
| Mutations for FADS2 |
| * Under tables are showing count per each tissue to give us broad intuition about tissue specific mutation patterns.You can go to the detailed page for each mutation database's web site. |
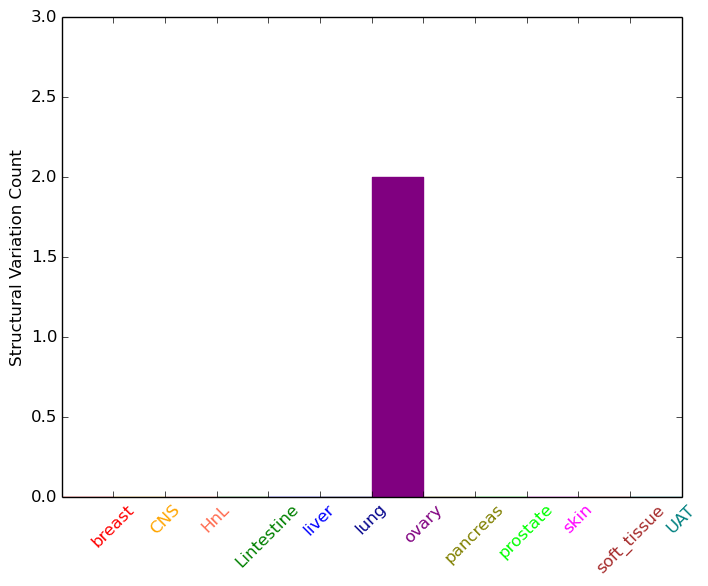
| - Statistics for Tissue and Mutation type | Top |
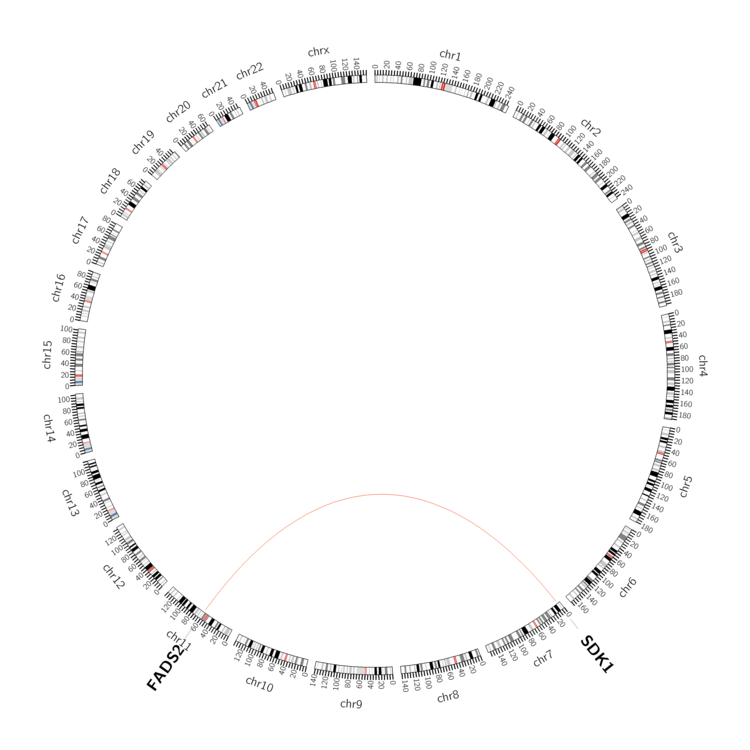 |
| - For Inter-chromosomal Variations |
| * Inter-chromosomal variantions includes 'interchromosomal amplicon to amplicon', 'interchromosomal amplicon to non-amplified dna', 'interchromosomal insertion', 'Interchromosomal unknown type'. |
 |
| - For Intra-chromosomal Variations |
| There's no intra-chromosomal structural variation. |
| Sample | Symbol_a | Chr_a | Start_a | End_a | Symbol_b | Chr_b | Start_b | End_b |
| cf) Tissue number; Tissue name (1;Breast, 2;Central_nervous_system, 3;Haematopoietic_and_lymphoid_tissue, 4;Large_intestine, 5;Liver, 6;Lung, 7;Ovary, 8;Pancreas, 9;Prostate, 10;Skin, 11;Soft_tissue, 12;Upper_aerodigestive_tract) |
| * From mRNA Sanger sequences, Chitars2.0 arranged chimeric transcripts. This table shows FADS2 related fusion information. |
| ID | Head Gene | Tail Gene | Accession | Gene_a | qStart_a | qEnd_a | Chromosome_a | tStart_a | tEnd_a | Gene_a | qStart_a | qEnd_a | Chromosome_a | tStart_a | tEnd_a |
| BQ189008 | EZR | 1 | 88 | 6 | 159190821 | 159190908 | FADS2 | 86 | 270 | 11 | 61634636 | 61634820 | |
| BQ184412 | FADS2 | 18 | 204 | 11 | 61634636 | 61634820 | EZR | 202 | 289 | 6 | 159190821 | 159190908 | |
| BU623713 | BOLA2 | 18 | 283 | 16 | 30004316 | 30004581 | FADS2 | 279 | 688 | 11 | 61630754 | 61633216 | |
| CX787277 | SSRP1 | 1 | 172 | 11 | 57093553 | 57093724 | FADS2 | 165 | 606 | 11 | 61605334 | 61615745 | |
| CN283539 | SAMD11 | 40 | 113 | 1 | 867265 | 867338 | FADS2 | 97 | 572 | 11 | 61634353 | 61634823 | |
| BG742639 | GUK1 | 1 | 498 | 1 | 228333052 | 228333551 | FADS2 | 492 | 907 | 11 | 61634285 | 61634704 | |
| Top |
| There's no copy number variation information in COSMIC data for this gene. |
| Top |
|
 |
| Top |
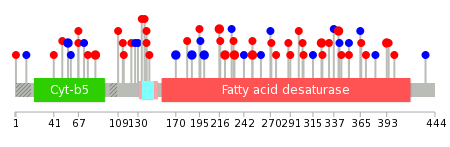
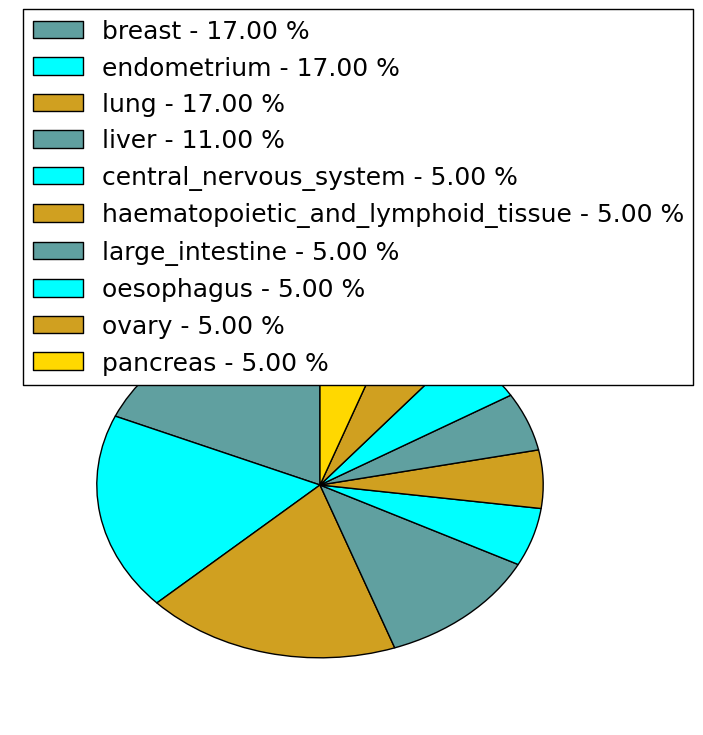
| Stat. for Non-Synonymous SNVs (# total SNVs=37) | (# total SNVs=17) |
 |  |
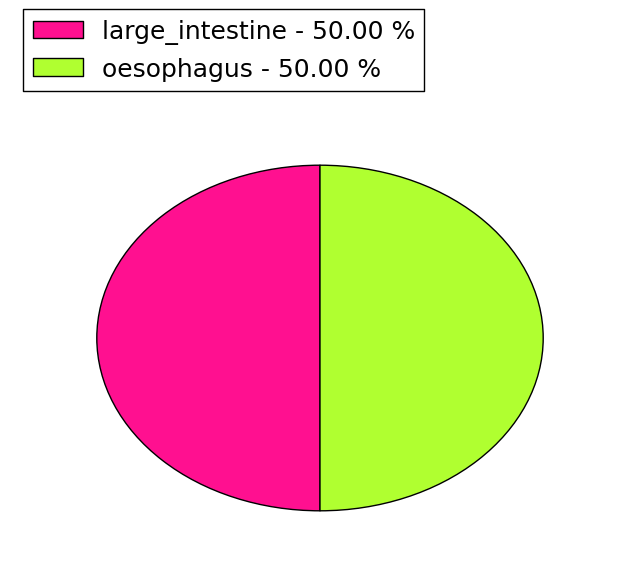
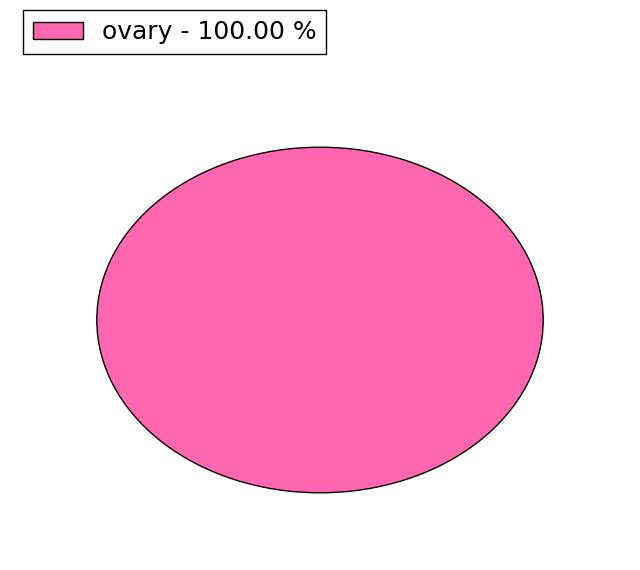
(# total SNVs=2) | (# total SNVs=1) |
 |  |
| Top |
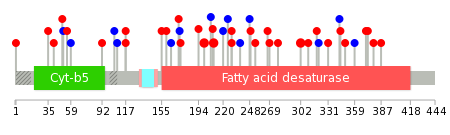
| * When you move the cursor on each content, you can see more deailed mutation information on the Tooltip. Those are primary_site,primary_histology,mutation(aa),pubmedID. |
| GRCh37 position | Mutation(aa) | Unique sampleID count |
| chr11:61608140-61608140 | p.V187V | 2 |
| chr11:61624491-61624491 | p.K251N | 2 |
| chr11:61630533-61630533 | p.N324K | 2 |
| chr11:61596030-61596030 | p.G56G | 2 |
| chr11:61608179-61608179 | p.F200F | 2 |
| chr11:61615659-61615659 | p.R216H | 2 |
| chr11:61596061-61596061 | p.D67Y | 2 |
| chr11:61630798-61630798 | p.H342P | 2 |
| chr11:61615676-61615676 | p.A222T | 2 |
| chr11:61632644-61632644 | p.R393Q | 2 |
| Top |
|
 |
| Point Mutation/ Tissue ID | 1 | 2 | 3 | 4 | 5 | 6 | 7 | 8 | 9 | 10 | 11 | 12 | 13 | 14 | 15 | 16 | 17 | 18 | 19 | 20 |
| # sample | 1 | 7 | 12 | 1 | 1 | 2 | 4 | 1 | 1 | 1 | 6 | 6 | 5 | |||||||
| # mutation | 1 | 7 | 11 | 1 | 1 | 2 | 4 | 1 | 1 | 1 | 6 | 6 | 5 | |||||||
| nonsynonymous SNV | 1 | 4 | 10 | 1 | 2 | 3 | 1 | 1 | 1 | 3 | 4 | 2 | ||||||||
| synonymous SNV | 3 | 1 | 1 | 1 | 3 | 2 | 3 |
| cf) Tissue ID; Tissue type (1; BLCA[Bladder Urothelial Carcinoma], 2; BRCA[Breast invasive carcinoma], 3; CESC[Cervical squamous cell carcinoma and endocervical adenocarcinoma], 4; COAD[Colon adenocarcinoma], 5; GBM[Glioblastoma multiforme], 6; Glioma Low Grade, 7; HNSC[Head and Neck squamous cell carcinoma], 8; KICH[Kidney Chromophobe], 9; KIRC[Kidney renal clear cell carcinoma], 10; KIRP[Kidney renal papillary cell carcinoma], 11; LAML[Acute Myeloid Leukemia], 12; LUAD[Lung adenocarcinoma], 13; LUSC[Lung squamous cell carcinoma], 14; OV[Ovarian serous cystadenocarcinoma ], 15; PAAD[Pancreatic adenocarcinoma], 16; PRAD[Prostate adenocarcinoma], 17; SKCM[Skin Cutaneous Melanoma], 18:STAD[Stomach adenocarcinoma], 19:THCA[Thyroid carcinoma], 20:UCEC[Uterine Corpus Endometrial Carcinoma]) |
| Top |
| * We represented just top 10 SNVs. When you move the cursor on each content, you can see more deailed mutation information on the Tooltip. Those are primary_site, primary_histology, mutation(aa), pubmedID. |
| Genomic Position | Mutation(aa) | Unique sampleID count |
| chr11:61615676 | p.D210N,FADS2 | 2 |
| chr11:61615706 | p.N302K,FADS2 | 2 |
| chr11:61630533 | p.A200T,FADS2 | 2 |
| chr11:61615753 | p.V59V | 1 |
| chr11:61596011 | p.K207K,FADS2 | 1 |
| chr11:61630767 | p.N319I,FADS2 | 1 |
| chr11:61608140 | p.R51R,FADS2 | 1 |
| chr11:61632693 | p.P209L,FADS2 | 1 |
| chr11:61624490 | p.I321I,FADS2 | 1 |
| chr11:61596039 | p.P55R,FADS2 | 1 |
| * Copy number data were extracted from TCGA using R package TCGA-Assembler. The URLs of all public data files on TCGA DCC data server were gathered on Jan-05-2015. Function ProcessCNAData in TCGA-Assembler package was used to obtain gene-level copy number value which is calculated as the average copy number of the genomic region of a gene. |
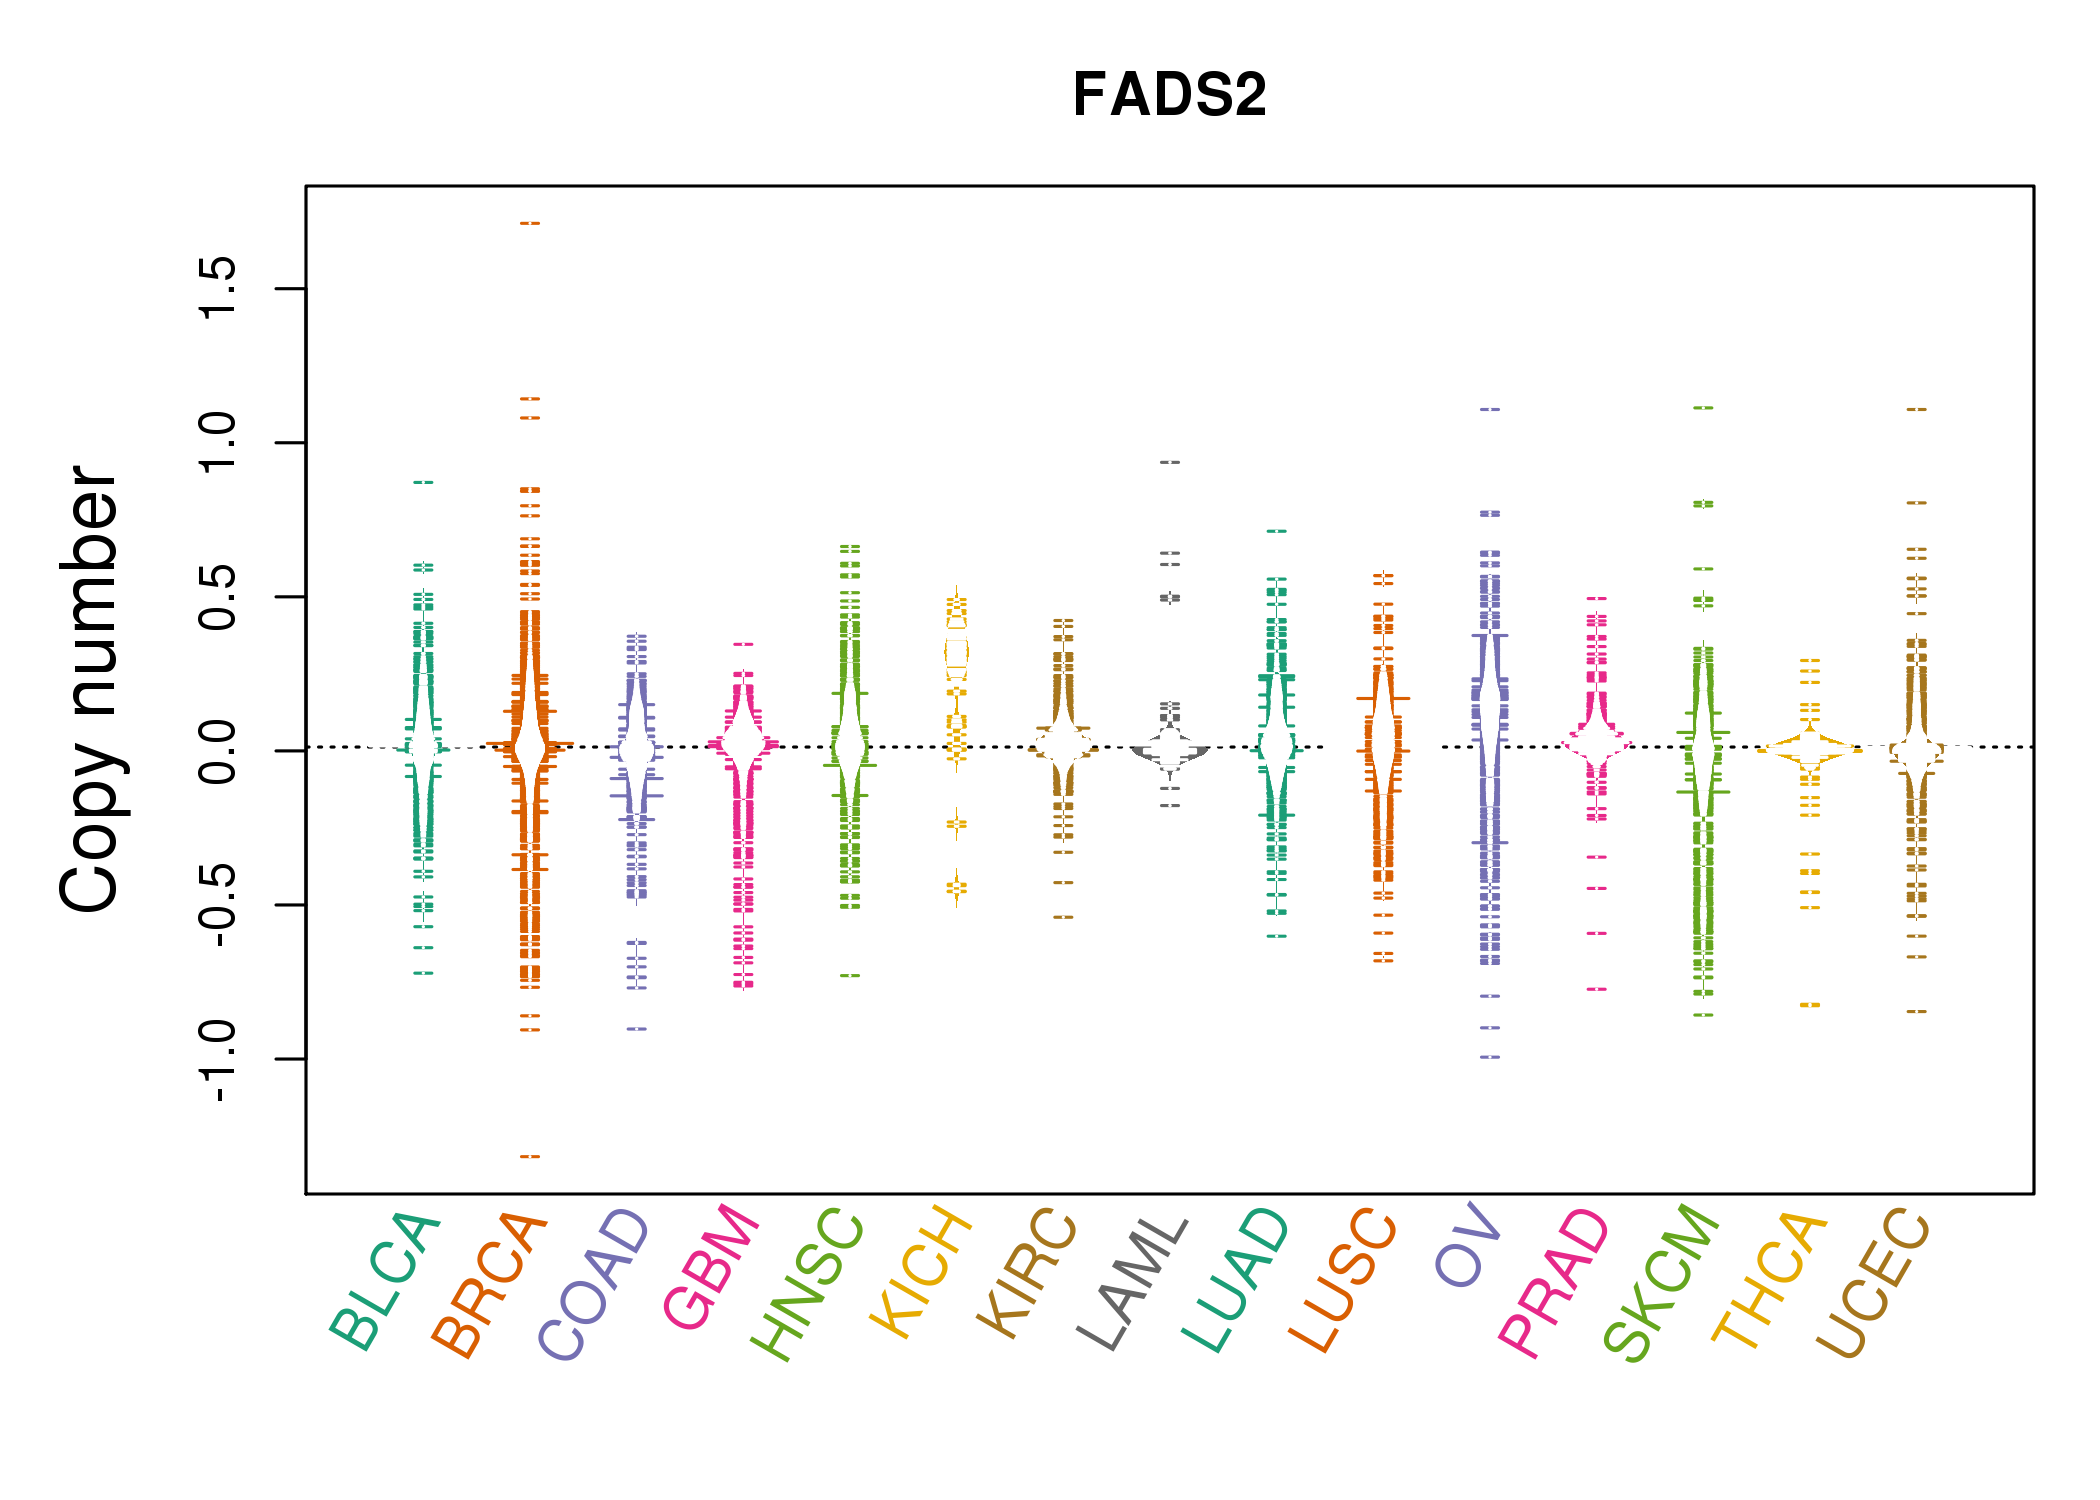 |
| cf) Tissue ID[Tissue type]: BLCA[Bladder Urothelial Carcinoma], BRCA[Breast invasive carcinoma], CESC[Cervical squamous cell carcinoma and endocervical adenocarcinoma], COAD[Colon adenocarcinoma], GBM[Glioblastoma multiforme], Glioma Low Grade, HNSC[Head and Neck squamous cell carcinoma], KICH[Kidney Chromophobe], KIRC[Kidney renal clear cell carcinoma], KIRP[Kidney renal papillary cell carcinoma], LAML[Acute Myeloid Leukemia], LUAD[Lung adenocarcinoma], LUSC[Lung squamous cell carcinoma], OV[Ovarian serous cystadenocarcinoma ], PAAD[Pancreatic adenocarcinoma], PRAD[Prostate adenocarcinoma], SKCM[Skin Cutaneous Melanoma], STAD[Stomach adenocarcinoma], THCA[Thyroid carcinoma], UCEC[Uterine Corpus Endometrial Carcinoma] |
| Top |
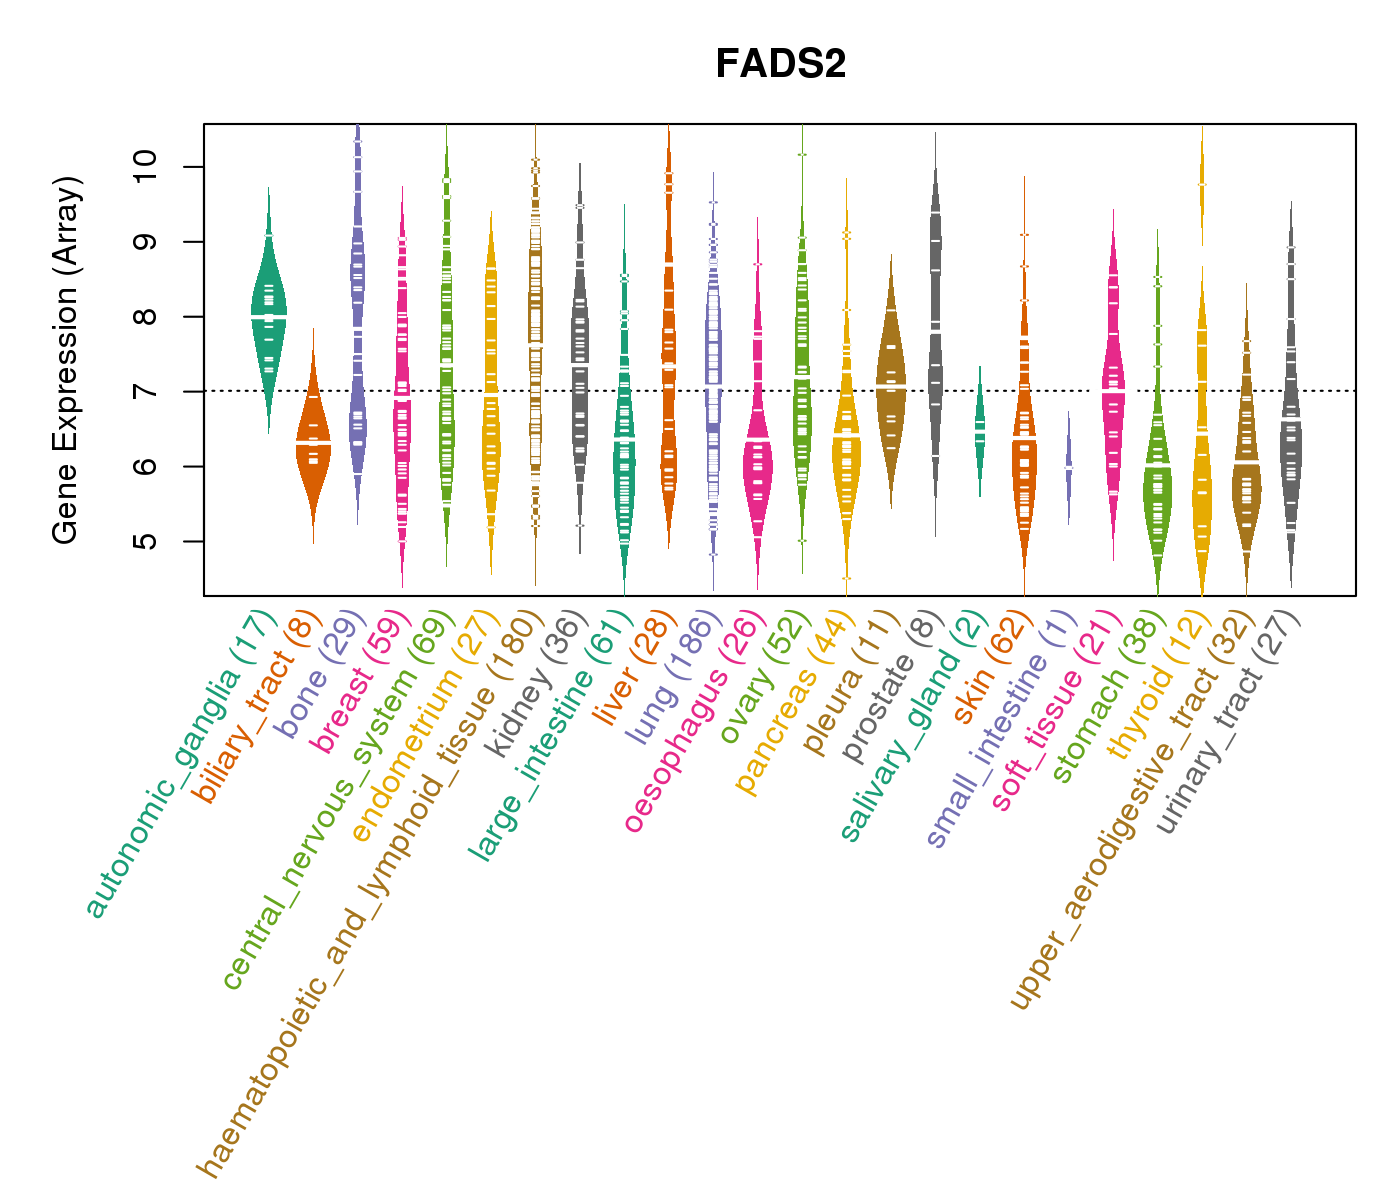
| Gene Expression for FADS2 |
| * CCLE gene expression data were extracted from CCLE_Expression_Entrez_2012-10-18.res: Gene-centric RMA-normalized mRNA expression data. |
 |
| * Normalized gene expression data of RNASeqV2 was extracted from TCGA using R package TCGA-Assembler. The URLs of all public data files on TCGA DCC data server were gathered at Jan-05-2015. Only eight cancer types have enough normal control samples for differential expression analysis. (t test, adjusted p<0.05 (using Benjamini-Hochberg FDR)) |
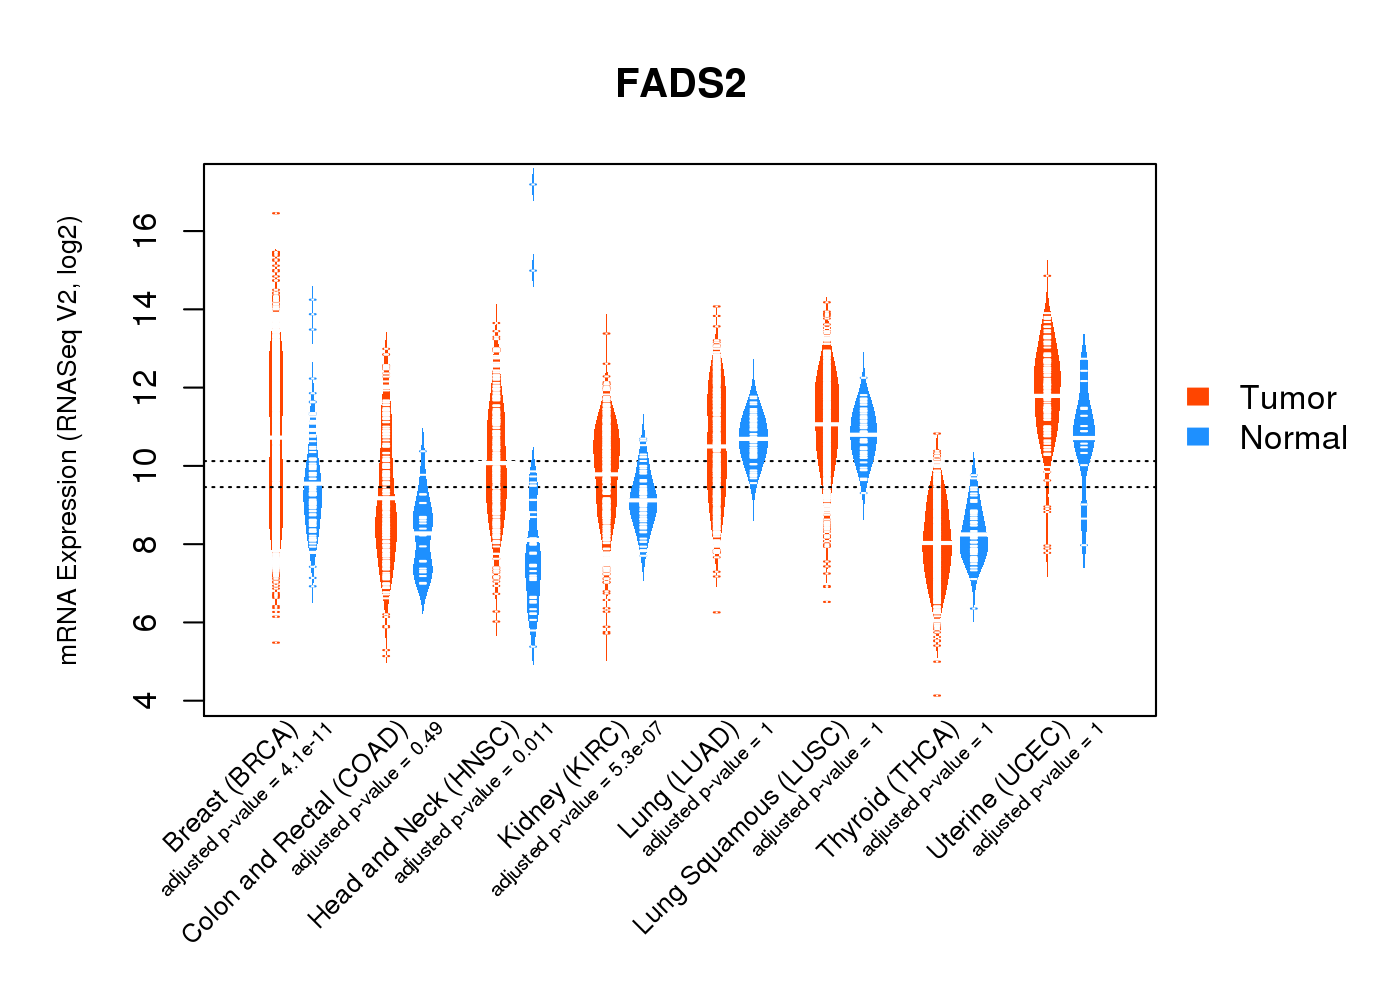 |
| Top |
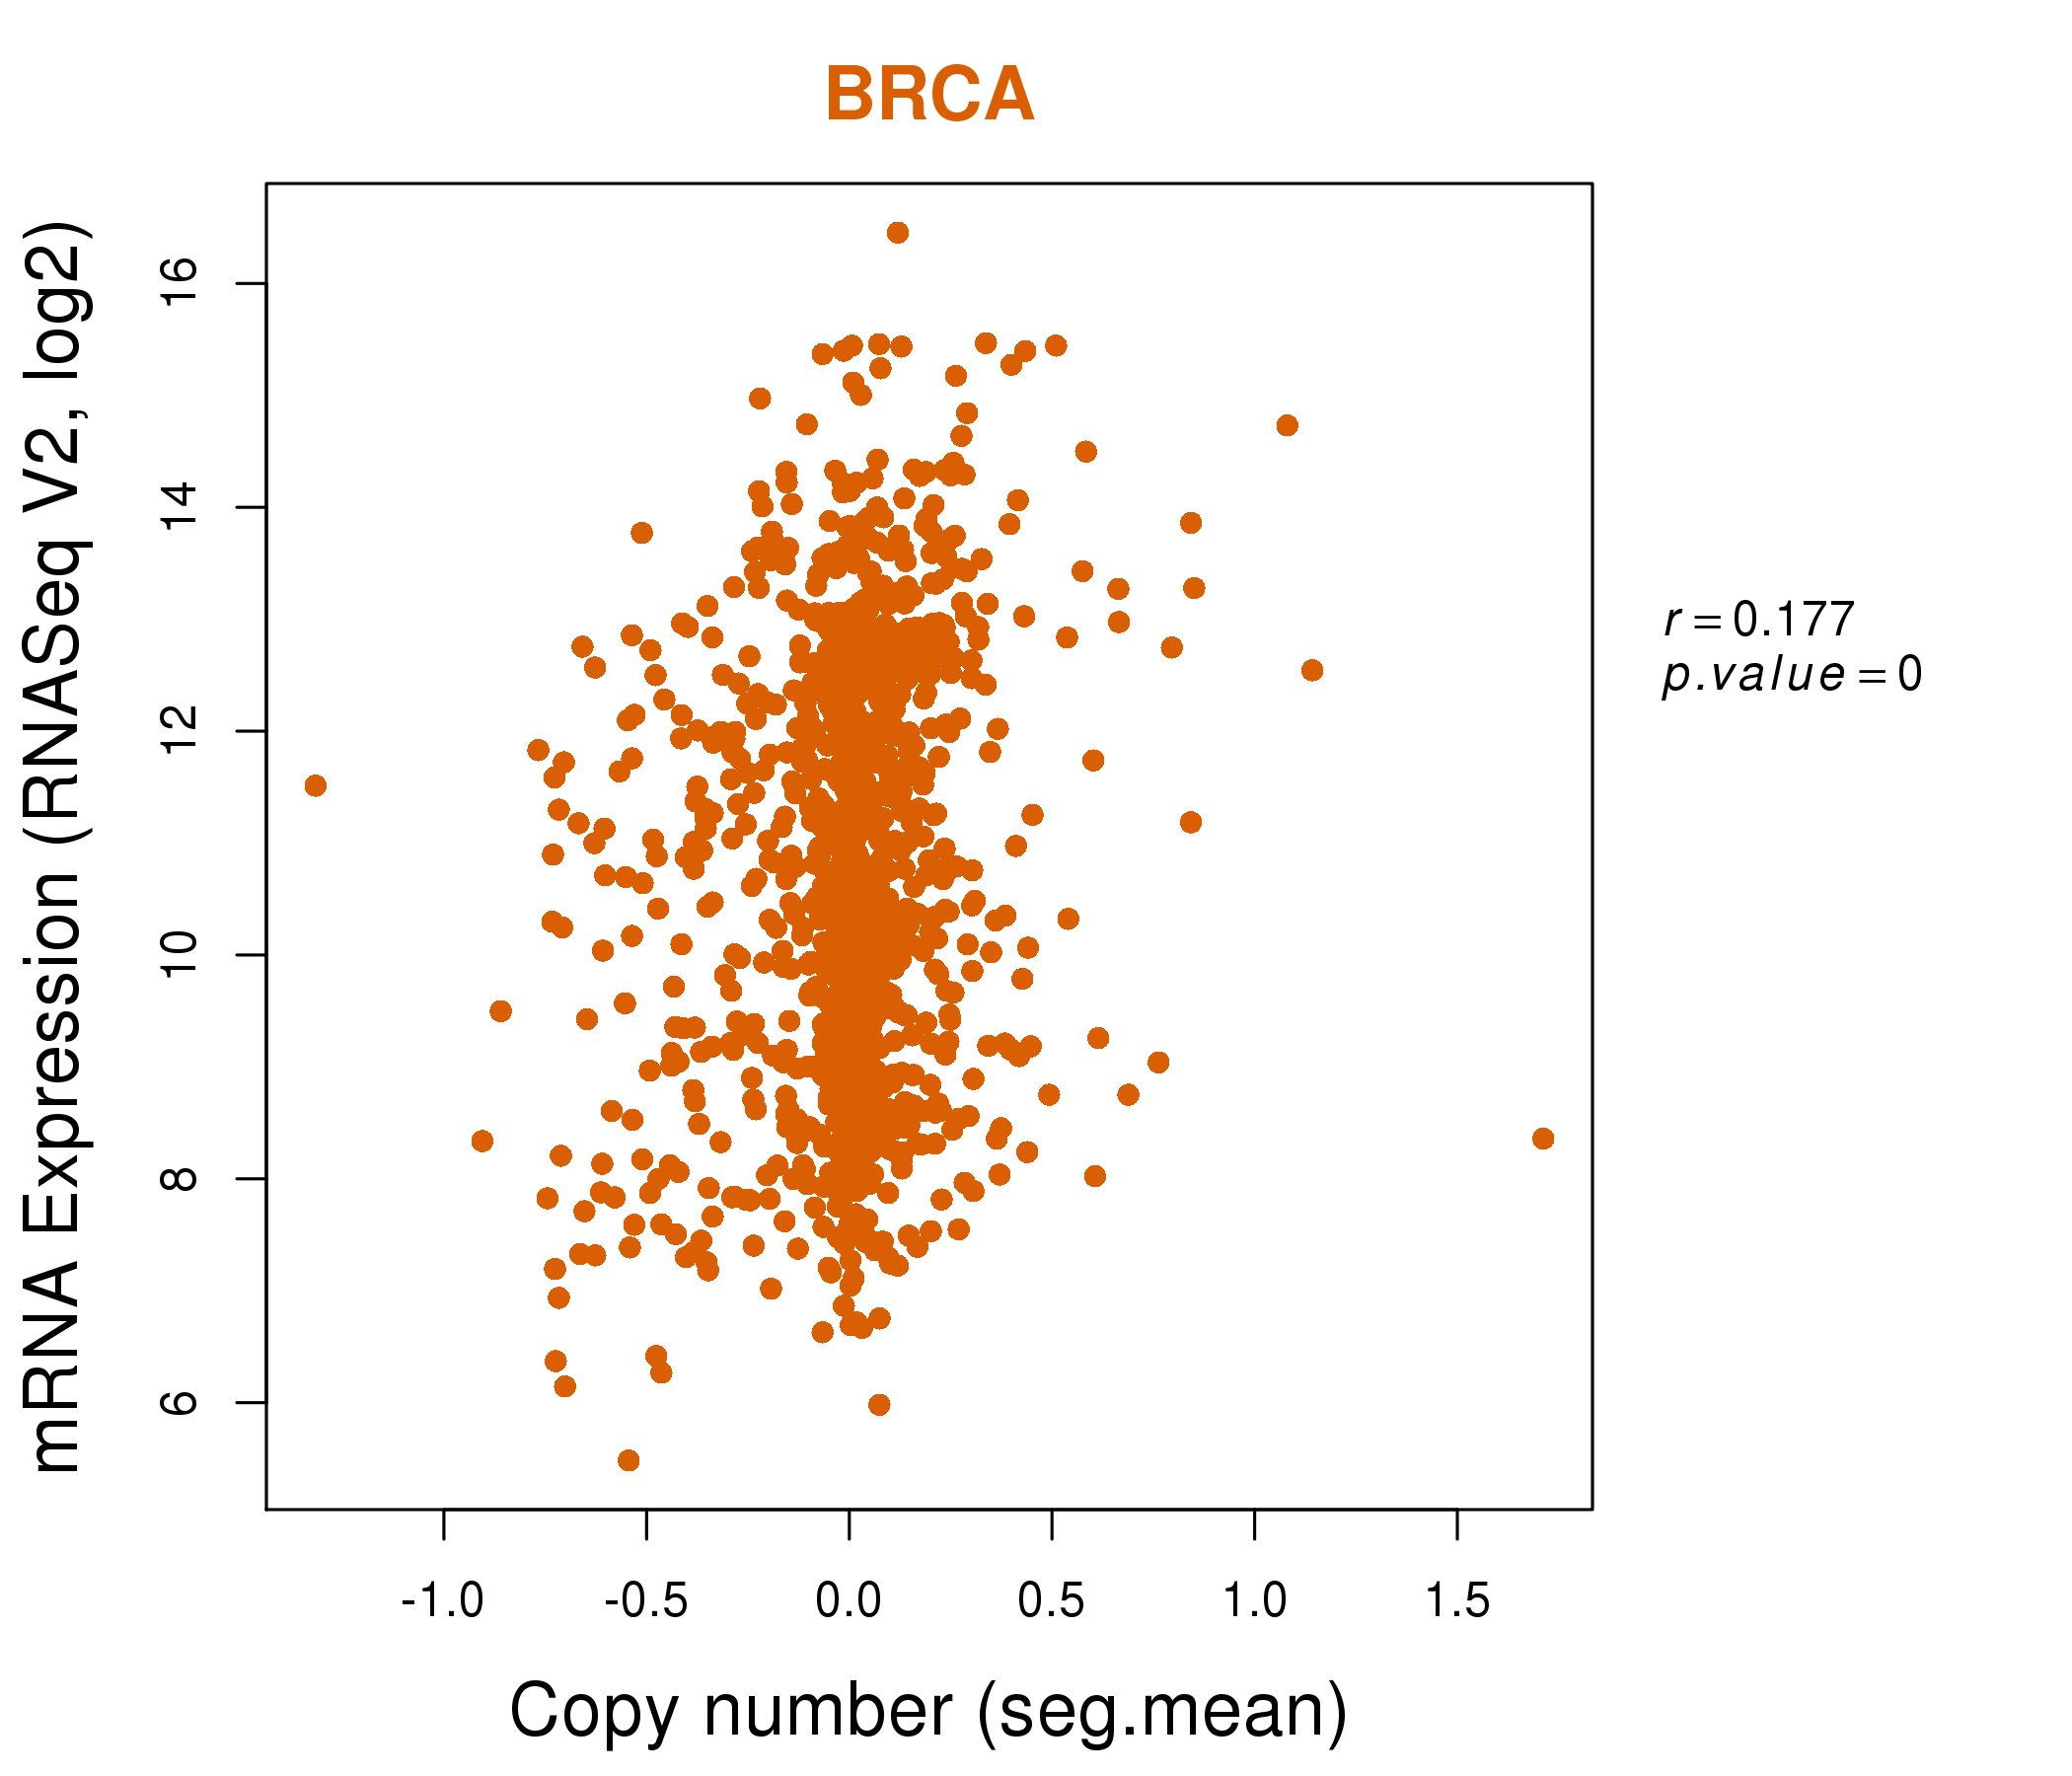
| * This plots show the correlation between CNV and gene expression. |
: Open all plots for all cancer types
 |
|
 |
|

| Top |
| Gene-Gene Network Information |
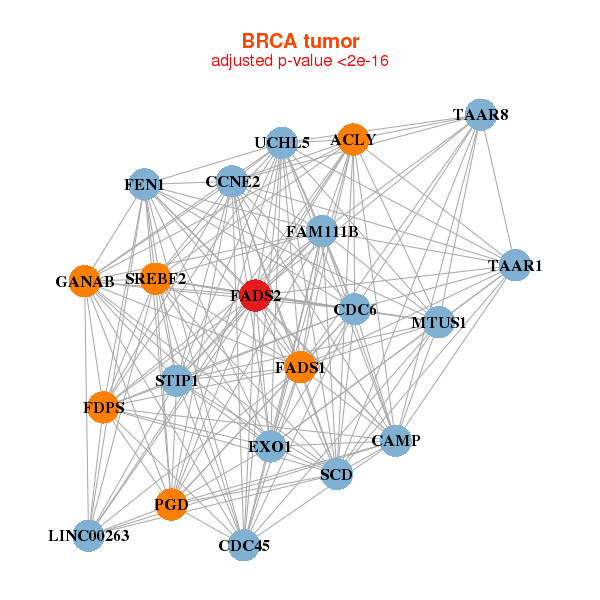
| * Co-Expression network figures were drawn using R package igraph. Only the top 20 genes with the highest correlations were shown. Red circle: input gene, orange circle: cell metabolism gene, sky circle: other gene |
: Open all plots for all cancer types
 |
| ||||
| ACLY,LINC00263,CAMP,CCNE2,CDC45,CDC6,EXO1, FADS1,FADS2,FAM111B,FDPS,FEN1,GANAB,MTUS1, PGD,SCD,SREBF2,STIP1,TAAR1,TAAR8,UCHL5 | ABCC12,ACSL3,ADAM2,AKR1D1,ALOX15B,APOD,C15orf43, DHRS2,EPS8L3,FADS2,GGT1,HIST1H2AG,HPGD,IDI1, IYD,LST-3TM12,RNASE12,SERHL,SRD5A1,TMPRSS11F,ZP2 | ||||
 |
| ||||
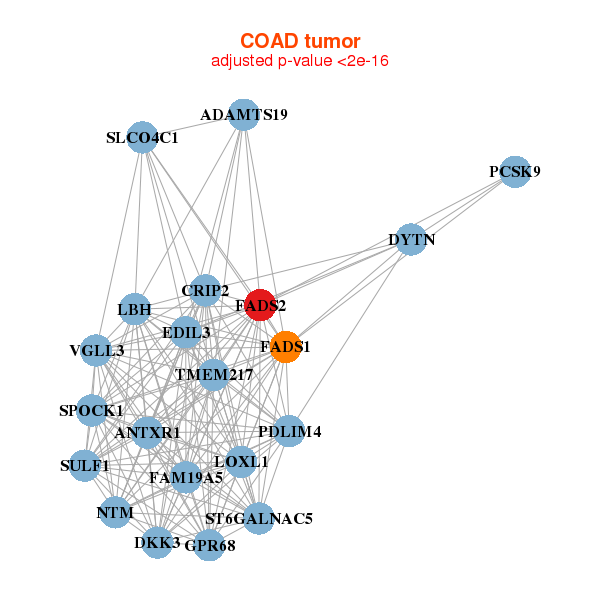
| ADAMTS19,ANTXR1,CRIP2,DKK3,DYTN,EDIL3,FADS1, FADS2,FAM19A5,GPR68,LBH,LOXL1,NTM,PCSK9, PDLIM4,SLCO4C1,SPOCK1,ST6GALNAC5,SULF1,TMEM217,VGLL3 | ABCC9,ANXA6,BOC,MIR99AHG,CPEB1,EMP3,FADS2, FRMD6,ITPR1,LGI2,MSN,PCDHGA2,PHGDH,PRAF2, SCARA3,SEZ6L,SLC16A2,SULF1,SV2A,TACR1,VWA1 |
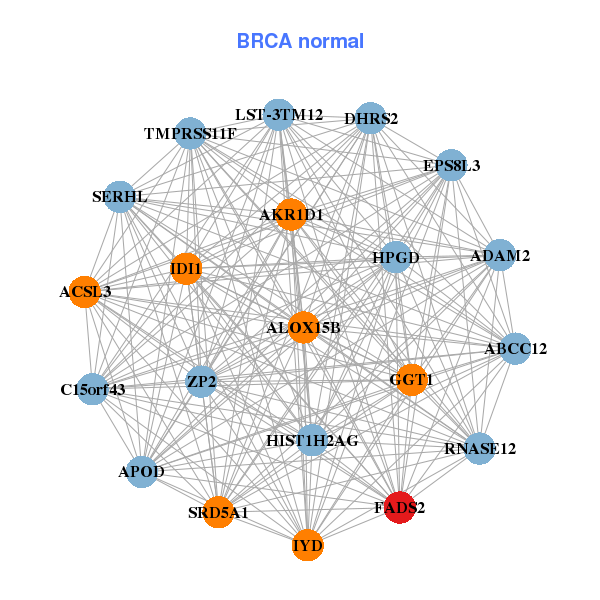
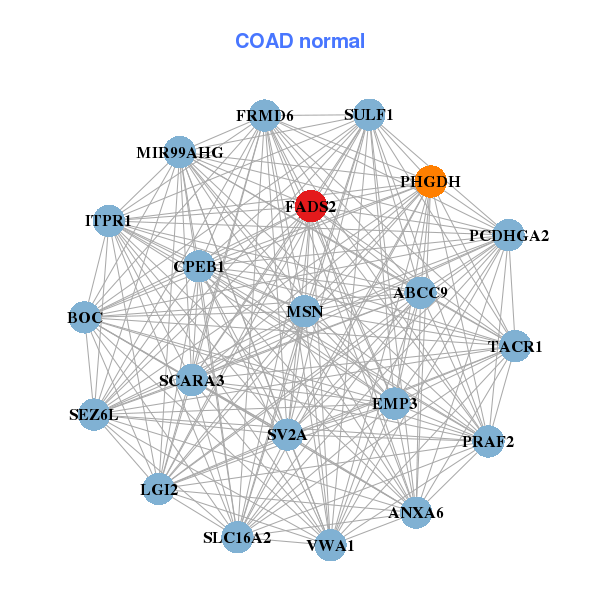
| * Co-Expression network figures were drawn using R package igraph. Only the top 20 genes with the highest correlations were shown. Red circle: input gene, orange circle: cell metabolism gene, sky circle: other gene |
: Open all plots for all cancer types
| Top |
: Open all interacting genes' information including KEGG pathway for all interacting genes from DAVID
| Top |
| Pharmacological Information for FADS2 |
| DB Category | DB Name | DB's ID and Url link |
| * Gene Centered Interaction Network. |
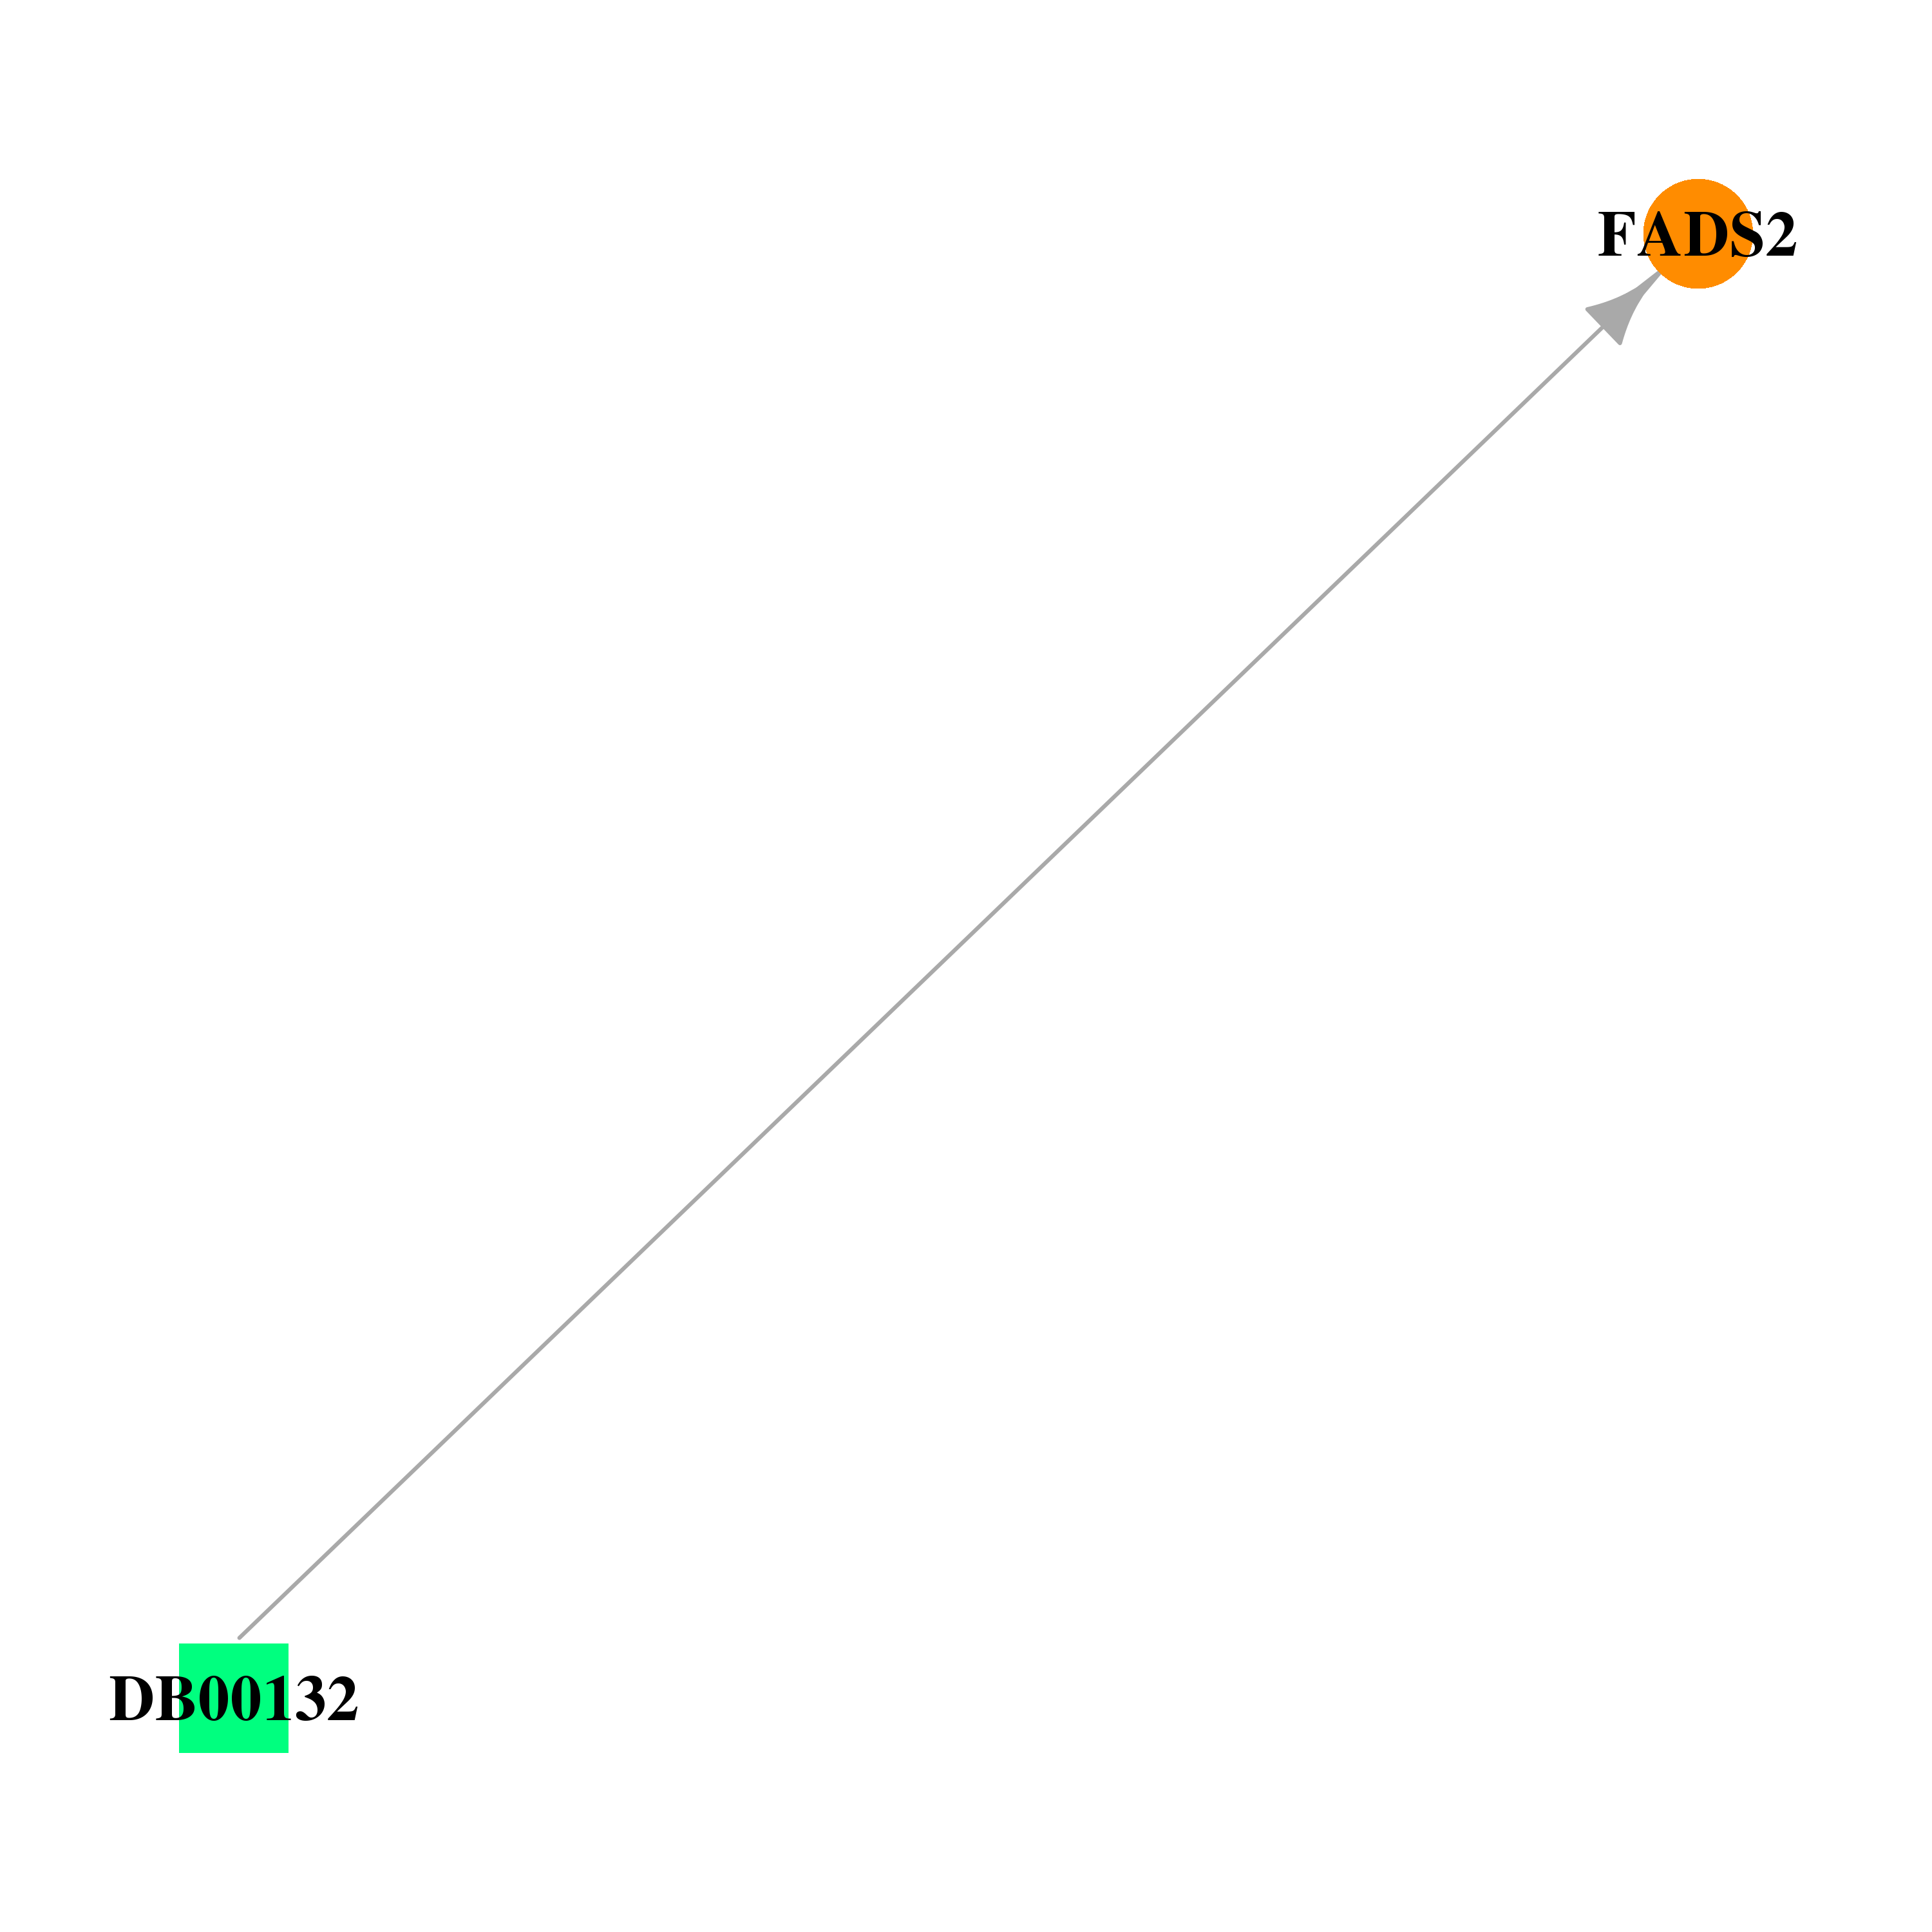 |
| * Drug Centered Interaction Network. |
| DrugBank ID | Target Name | Drug Groups | Generic Name | Drug Centered Network | Drug Structure |
| DB00132 | fatty acid desaturase 2 | approved; nutraceutical | Alpha-Linolenic Acid |  | 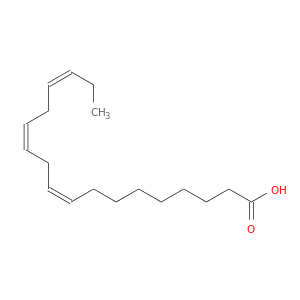 |
| Top |
| Cross referenced IDs for FADS2 |
| * We obtained these cross-references from Uniprot database. It covers 150 different DBs, 18 categories. http://www.uniprot.org/help/cross_references_section |
: Open all cross reference information
|
Copyright © 2016-Present - The Univsersity of Texas Health Science Center at Houston @ |