|
||||||||||||||||||||||||||||||||||||||||||||||||||||||||||||||||||||||||||||||||||||||||||||||||||||||||||||||||||||||||||||||||||||||||||||||||||||||||||||||||||||||||||||||||||||||||||||||||||||||||||||||||||||||||||||||||||||||||||||||||||||||||||||||||||||||||||||||||||||||||||||||||||||||||||||||||||||||||||
| |
| Phenotypic Information (metabolism pathway, cancer, disease, phenome) |
| |
| |
| Gene-Gene Network Information: Co-Expression Network, Interacting Genes & KEGG |
| |
|


| Gene Summary for MED26 |
| Basic gene info. | Gene symbol | MED26 |
| Gene name | mediator complex subunit 26 | |
| Synonyms | CRSP7|CRSP70 | |
| Cytomap | UCSC genome browser: 19p13.11 | |
| Genomic location | chr19 :16685717-16739015 | |
| Type of gene | protein-coding | |
| RefGenes | NM_004831.3, | |
| Ensembl id | ENSG00000105085 | |
| Description | ARC70CRSP complex subunit 7activator-recruited cofactor 70 kDa componentcofactor required for Sp1 transcriptional activation subunit 7cofactor required for Sp1 transcriptional activation, subunit 7 (70kD)cofactor required for Sp1 transcriptional acti | |
| Modification date | 20141207 | |
| dbXrefs | MIM : 605043 | |
| HGNC : HGNC | ||
| Ensembl : ENSG00000105085 | ||
| HPRD : 05437 | ||
| Vega : OTTHUMG00000182433 | ||
| Protein | UniProt: go to UniProt's Cross Reference DB Table | |
| Expression | CleanEX: HS_MED26 | |
| BioGPS: 9441 | ||
| Gene Expression Atlas: ENSG00000105085 | ||
| The Human Protein Atlas: ENSG00000105085 | ||
| Pathway | NCI Pathway Interaction Database: MED26 | |
| KEGG: MED26 | ||
| REACTOME: MED26 | ||
| ConsensusPathDB | ||
| Pathway Commons: MED26 | ||
| Metabolism | MetaCyc: MED26 | |
| HUMANCyc: MED26 | ||
| Regulation | Ensembl's Regulation: ENSG00000105085 | |
| miRBase: chr19 :16,685,717-16,739,015 | ||
| TargetScan: NM_004831 | ||
| cisRED: ENSG00000105085 | ||
| Context | iHOP: MED26 | |
| cancer metabolism search in PubMed: MED26 | ||
| UCL Cancer Institute: MED26 | ||
| Assigned class in ccmGDB | C | |
| Top |
| Phenotypic Information for MED26(metabolism pathway, cancer, disease, phenome) |
| Cancer | CGAP: MED26 |
| Familial Cancer Database: MED26 | |
| * This gene is included in those cancer gene databases. |
|
|
|
|
|
| . | ||||||||||||||||||||||||||||||||||||||||||||||||||||||||||||||||||||||||||||||||||||||||||||||||||||||||||||||||||||||||||||||||||||||||||||||||||||||||||||||||||||||||||||||||||||||||||||||||||||||||||||||||||||||||||||||||||||||||||||||||||||||||||||||||||||||||||||||||||||||||||||||||||||||||||||||||||||
Oncogene 1 | Significant driver gene in | |||||||||||||||||||||||||||||||||||||||||||||||||||||||||||||||||||||||||||||||||||||||||||||||||||||||||||||||||||||||||||||||||||||||||||||||||||||||||||||||||||||||||||||||||||||||||||||||||||||||||||||||||||||||||||||||||||||||||||||||||||||||||||||||||||||||||||||||||||||||||||||||||||||||||||||||||||||||||
| cf) number; DB name 1 Oncogene; http://nar.oxfordjournals.org/content/35/suppl_1/D721.long, 2 Tumor Suppressor gene; https://bioinfo.uth.edu/TSGene/, 3 Cancer Gene Census; http://www.nature.com/nrc/journal/v4/n3/abs/nrc1299.html, 4 CancerGenes; http://nar.oxfordjournals.org/content/35/suppl_1/D721.long, 5 Network of Cancer Gene; http://ncg.kcl.ac.uk/index.php, 1Therapeutic Vulnerabilities in Cancer; http://cbio.mskcc.org/cancergenomics/statius/ |
| REACTOME_METABOLISM_OF_LIPIDS_AND_LIPOPROTEINS | |
| OMIM | |
| Orphanet | |
| Disease | KEGG Disease: MED26 |
| MedGen: MED26 (Human Medical Genetics with Condition) | |
| ClinVar: MED26 | |
| Phenotype | MGI: MED26 (International Mouse Phenotyping Consortium) |
| PhenomicDB: MED26 | |
| Mutations for MED26 |
| * Under tables are showing count per each tissue to give us broad intuition about tissue specific mutation patterns.You can go to the detailed page for each mutation database's web site. |
| - Statistics for Tissue and Mutation type | Top |
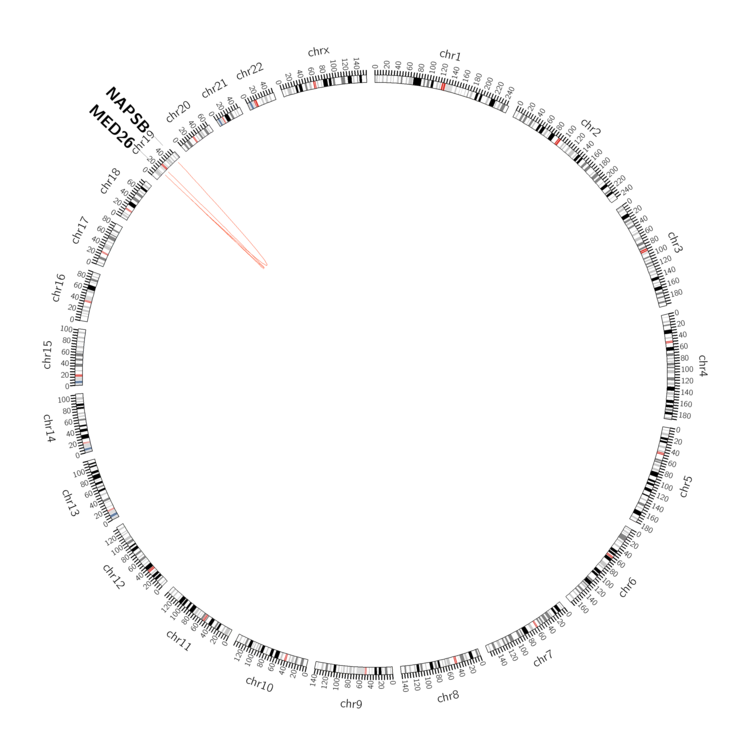 |
| - For Inter-chromosomal Variations |
| There's no inter-chromosomal structural variation. |
| - For Intra-chromosomal Variations |
| There's no intra-chromosomal structural variation. |
| Sample | Symbol_a | Chr_a | Start_a | End_a | Symbol_b | Chr_b | Start_b | End_b |
| central_nervous_system | MED26 | chr19 | 16707988 | 16707988 | MED26 | chr19 | 16709424 | 16709424 |
| ovary | MED26 | chr19 | 16688463 | 16688483 | NAPSB | chr19 | 50845046 | 50845066 |
| ovary | MED26 | chr19 | 16697219 | 16697239 | MED26 | chr19 | 16701807 | 16701827 |
| ovary | MED26 | chr19 | 16712638 | 16712658 | chr19 | 24588434 | 24588454 | |
| pancreas | MED26 | chr19 | 16707890 | 16707910 | MED26 | chr19 | 16710065 | 16710085 |
| cf) Tissue number; Tissue name (1;Breast, 2;Central_nervous_system, 3;Haematopoietic_and_lymphoid_tissue, 4;Large_intestine, 5;Liver, 6;Lung, 7;Ovary, 8;Pancreas, 9;Prostate, 10;Skin, 11;Soft_tissue, 12;Upper_aerodigestive_tract) |
| * From mRNA Sanger sequences, Chitars2.0 arranged chimeric transcripts. This table shows MED26 related fusion information. |
| ID | Head Gene | Tail Gene | Accession | Gene_a | qStart_a | qEnd_a | Chromosome_a | tStart_a | tEnd_a | Gene_a | qStart_a | qEnd_a | Chromosome_a | tStart_a | tEnd_a |
| BQ009863 | CARM1 | 18 | 164 | 19 | 11033302 | 11033448 | MED26 | 158 | 724 | 19 | 16629046 | 16629612 | |
| AL516980 | MED26 | 1 | 459 | 19 | 16636283 | 16640538 | MED26 | 455 | 546 | 19 | 16646281 | 16646372 | |
| BI019721 | PTPRJ | 1 | 283 | 11 | 48018145 | 48018427 | MED26 | 277 | 424 | 19 | 16706253 | 16706400 | |
| BG953012 | MED26 | 11 | 70 | 19 | 16695951 | 16696010 | MED26 | 65 | 316 | 19 | 16695675 | 16695926 | |
| BF885437 | MED26 | 27 | 116 | 19 | 16664537 | 16664626 | CEP164 | 112 | 317 | 11 | 117261985 | 117262190 | |
| BC032658 | MED26 | 24 | 1872 | 19 | 16663449 | 16682389 | KIF18B | 1867 | 2361 | 17 | 43002079 | 43002577 | |
| DA456356 | MED26 | 1 | 402 | 19 | 16683435 | 16683835 | USP36 | 401 | 565 | 17 | 76834669 | 76834833 | |
| Top |
| Mutation type/ Tissue ID | brca | cns | cerv | endome | haematopo | kidn | Lintest | liver | lung | ns | ovary | pancre | prost | skin | stoma | thyro | urina | |||
| Total # sample | 1 | 1 | ||||||||||||||||||
| GAIN (# sample) | 1 | 1 | ||||||||||||||||||
| LOSS (# sample) |
| cf) Tissue ID; Tissue type (1; Breast, 2; Central_nervous_system, 3; Cervix, 4; Endometrium, 5; Haematopoietic_and_lymphoid_tissue, 6; Kidney, 7; Large_intestine, 8; Liver, 9; Lung, 10; NS, 11; Ovary, 12; Pancreas, 13; Prostate, 14; Skin, 15; Stomach, 16; Thyroid, 17; Urinary_tract) |
| Top |
|
 |
| Top |
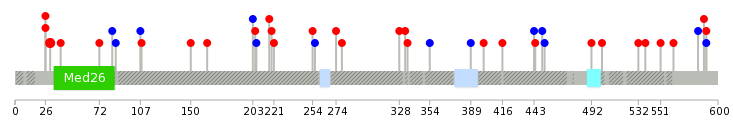
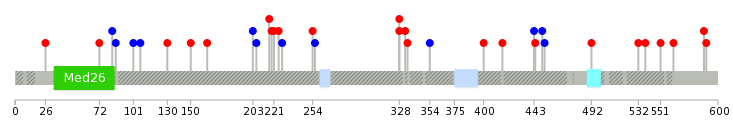
| Stat. for Non-Synonymous SNVs (# total SNVs=19) | (# total SNVs=9) |
 |  |
(# total SNVs=0) | (# total SNVs=0) |
| Top |
| * When you move the cursor on each content, you can see more deailed mutation information on the Tooltip. Those are primary_site,primary_histology,mutation(aa),pubmedID. |
| GRCh37 position | Mutation(aa) | Unique sampleID count |
| chr19:16689204-16689204 | p.A30V | 3 |
| chr19:16686879-16686879 | p.D588N | 1 |
| chr19:16688319-16688319 | p.A108T | 1 |
| chr19:16687312-16687312 | p.V443V | 1 |
| chr19:16687880-16687880 | p.D254G | 1 |
| chr19:16686892-16686892 | p.D583D | 1 |
| chr19:16688320-16688320 | p.G107G | 1 |
| chr19:16687395-16687395 | p.K416Q | 1 |
| chr19:16687979-16687979 | p.I221S | 1 |
| chr19:16686957-16686957 | p.G562R | 1 |
| Top |
|
 |
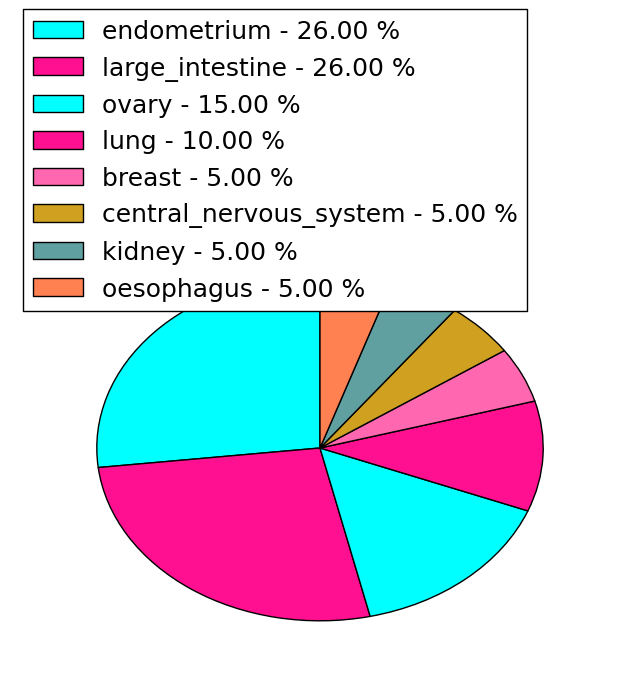
| Point Mutation/ Tissue ID | 1 | 2 | 3 | 4 | 5 | 6 | 7 | 8 | 9 | 10 | 11 | 12 | 13 | 14 | 15 | 16 | 17 | 18 | 19 | 20 |
| # sample | 2 | 1 | 4 | 3 | 1 | 1 | 2 | 1 | 2 | 9 | 7 | |||||||||
| # mutation | 2 | 1 | 4 | 3 | 1 | 1 | 2 | 1 | 2 | 9 | 8 | |||||||||
| nonsynonymous SNV | 1 | 1 | 2 | 2 | 1 | 1 | 1 | 2 | 8 | 5 | ||||||||||
| synonymous SNV | 1 | 2 | 1 | 1 | 1 | 1 | 3 |
| cf) Tissue ID; Tissue type (1; BLCA[Bladder Urothelial Carcinoma], 2; BRCA[Breast invasive carcinoma], 3; CESC[Cervical squamous cell carcinoma and endocervical adenocarcinoma], 4; COAD[Colon adenocarcinoma], 5; GBM[Glioblastoma multiforme], 6; Glioma Low Grade, 7; HNSC[Head and Neck squamous cell carcinoma], 8; KICH[Kidney Chromophobe], 9; KIRC[Kidney renal clear cell carcinoma], 10; KIRP[Kidney renal papillary cell carcinoma], 11; LAML[Acute Myeloid Leukemia], 12; LUAD[Lung adenocarcinoma], 13; LUSC[Lung squamous cell carcinoma], 14; OV[Ovarian serous cystadenocarcinoma ], 15; PAAD[Pancreatic adenocarcinoma], 16; PRAD[Prostate adenocarcinoma], 17; SKCM[Skin Cutaneous Melanoma], 18:STAD[Stomach adenocarcinoma], 19:THCA[Thyroid carcinoma], 20:UCEC[Uterine Corpus Endometrial Carcinoma]) |
| Top |
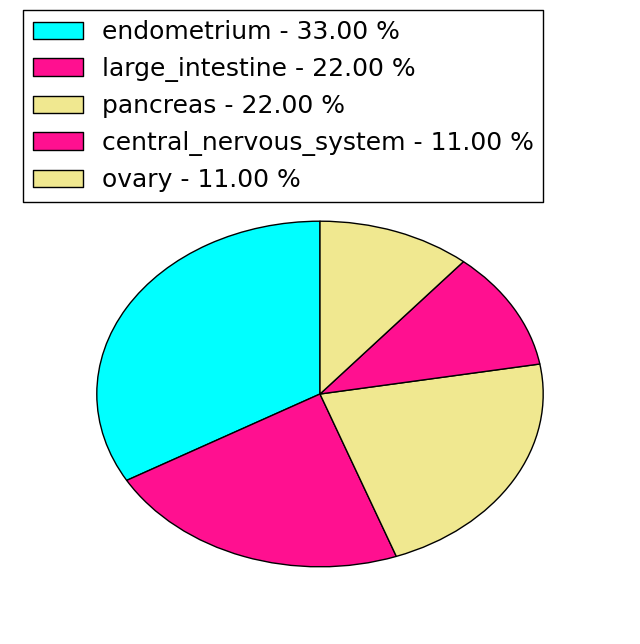
| * We represented just top 10 SNVs. When you move the cursor on each content, you can see more deailed mutation information on the Tooltip. Those are primary_site, primary_histology, mutation(aa), pubmedID. |
| Genomic Position | Mutation(aa) | Unique sampleID count |
| chr19:16686957 | p.D551Y | 1 |
| chr19:16688427 | p.D254G | 1 |
| chr19:16687579 | p.R26Q | 1 |
| chr19:16687990 | p.T538M | 1 |
| chr19:16686990 | p.P228P | 1 |
| chr19:16689216 | p.V532L | 1 |
| chr19:16687637 | p.A225T | 1 |
| chr19:16688023 | p.R492W | 1 |
| chr19:16687028 | p.I221S | 1 |
| chr19:16687644 | p.E452E | 1 |
| * Copy number data were extracted from TCGA using R package TCGA-Assembler. The URLs of all public data files on TCGA DCC data server were gathered on Jan-05-2015. Function ProcessCNAData in TCGA-Assembler package was used to obtain gene-level copy number value which is calculated as the average copy number of the genomic region of a gene. |
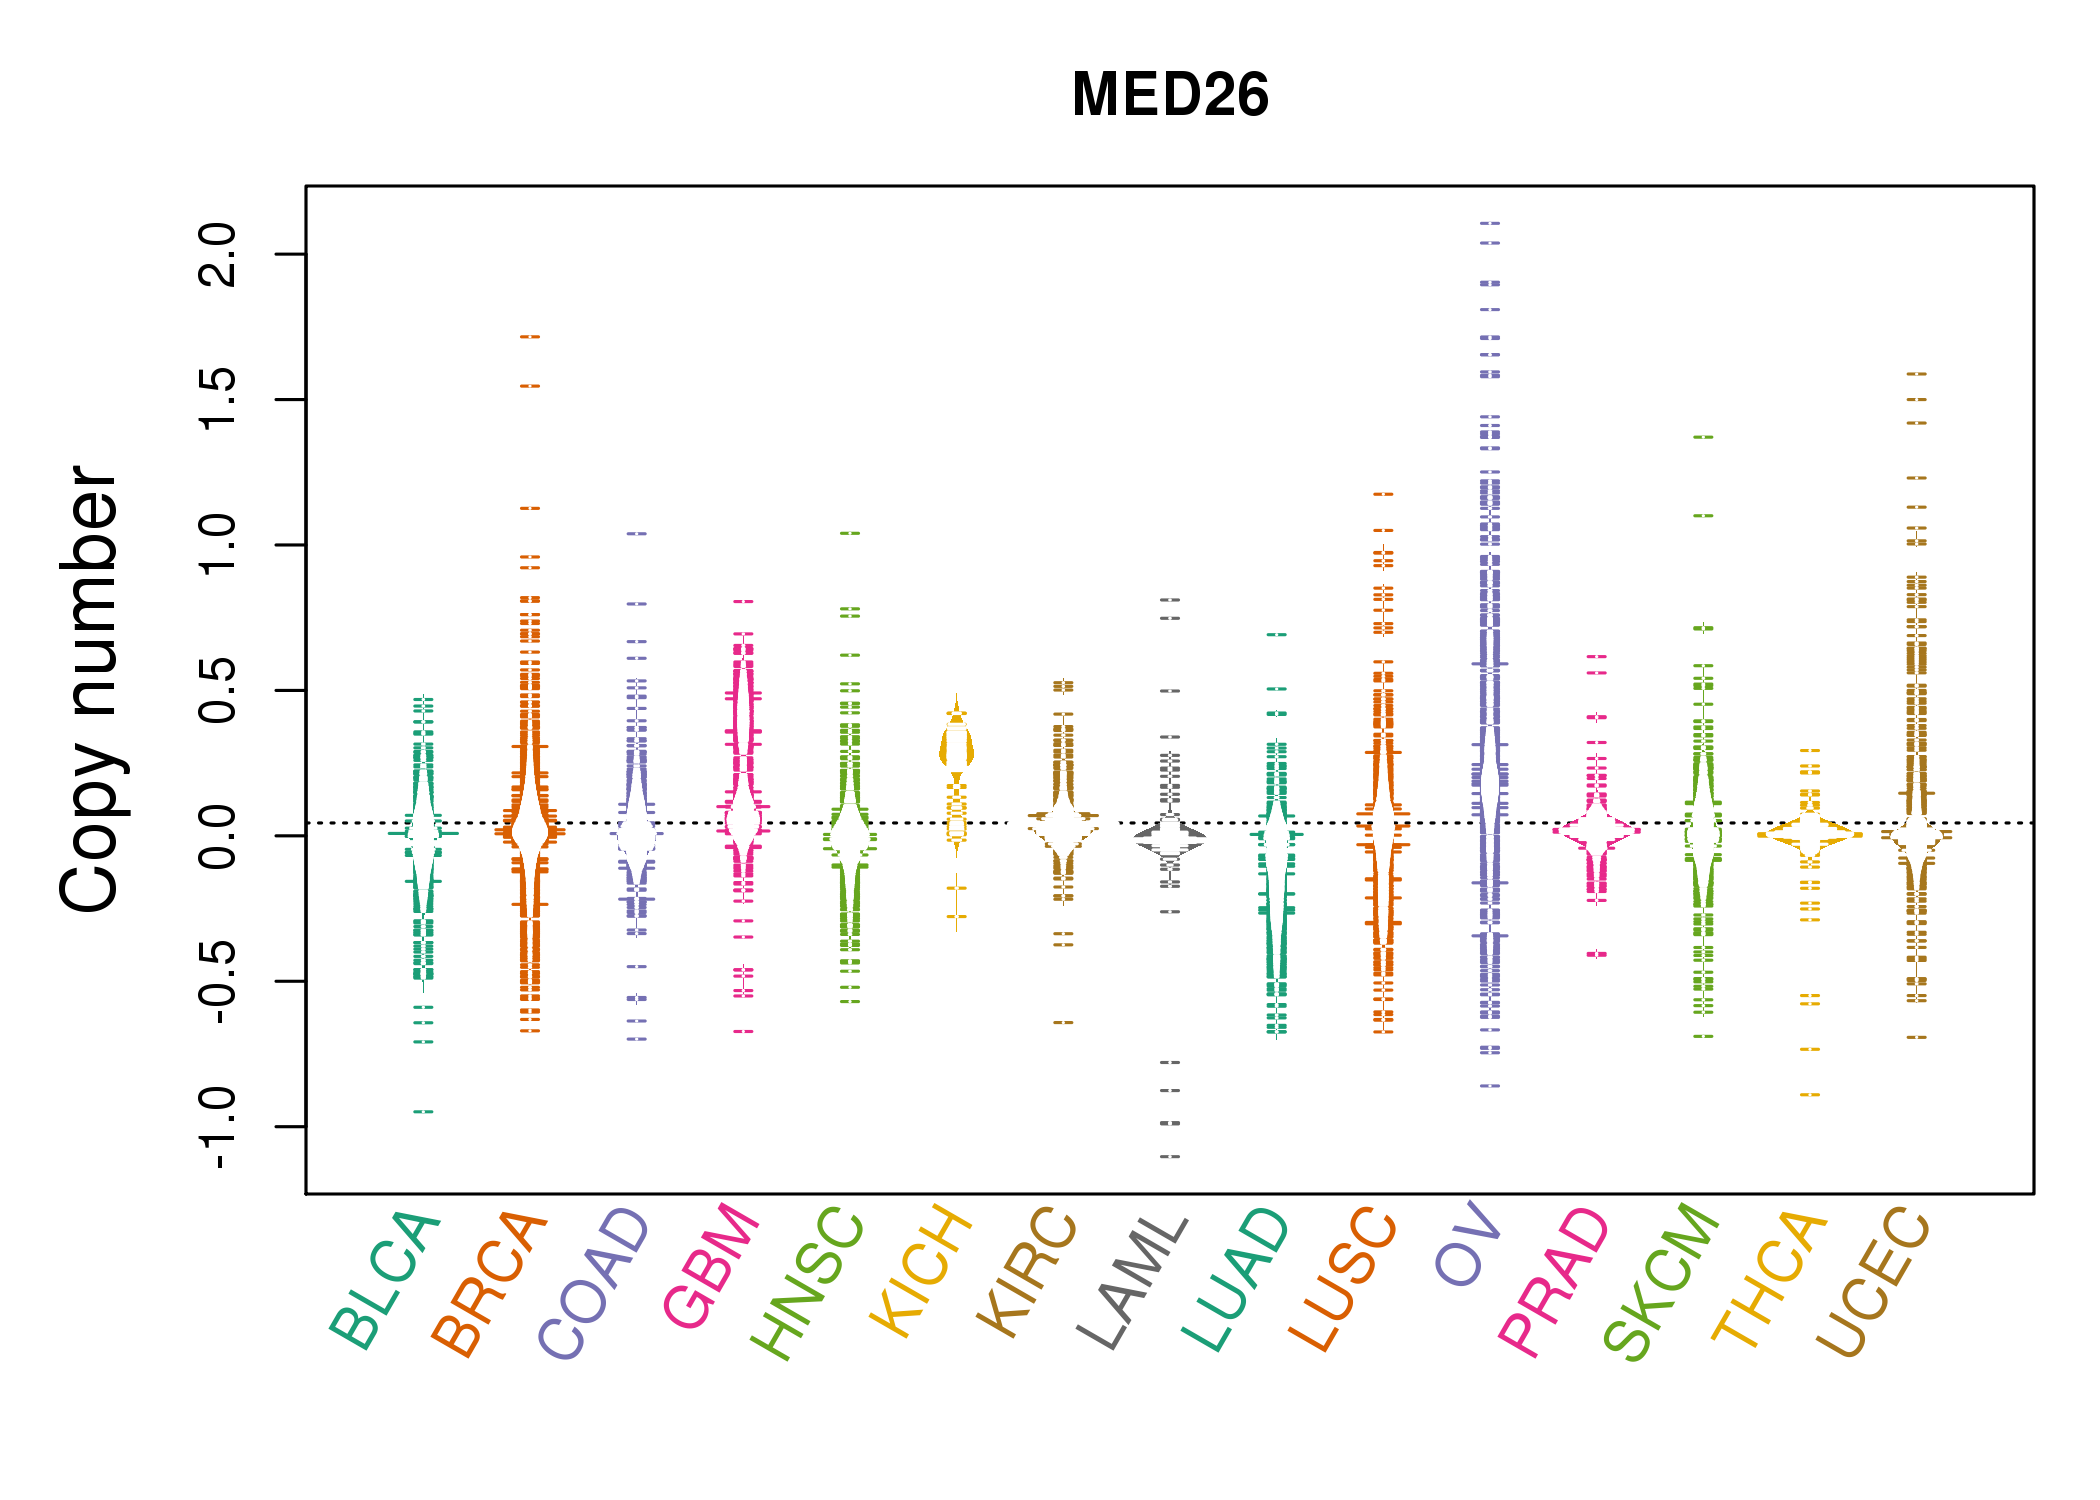 |
| cf) Tissue ID[Tissue type]: BLCA[Bladder Urothelial Carcinoma], BRCA[Breast invasive carcinoma], CESC[Cervical squamous cell carcinoma and endocervical adenocarcinoma], COAD[Colon adenocarcinoma], GBM[Glioblastoma multiforme], Glioma Low Grade, HNSC[Head and Neck squamous cell carcinoma], KICH[Kidney Chromophobe], KIRC[Kidney renal clear cell carcinoma], KIRP[Kidney renal papillary cell carcinoma], LAML[Acute Myeloid Leukemia], LUAD[Lung adenocarcinoma], LUSC[Lung squamous cell carcinoma], OV[Ovarian serous cystadenocarcinoma ], PAAD[Pancreatic adenocarcinoma], PRAD[Prostate adenocarcinoma], SKCM[Skin Cutaneous Melanoma], STAD[Stomach adenocarcinoma], THCA[Thyroid carcinoma], UCEC[Uterine Corpus Endometrial Carcinoma] |
| Top |
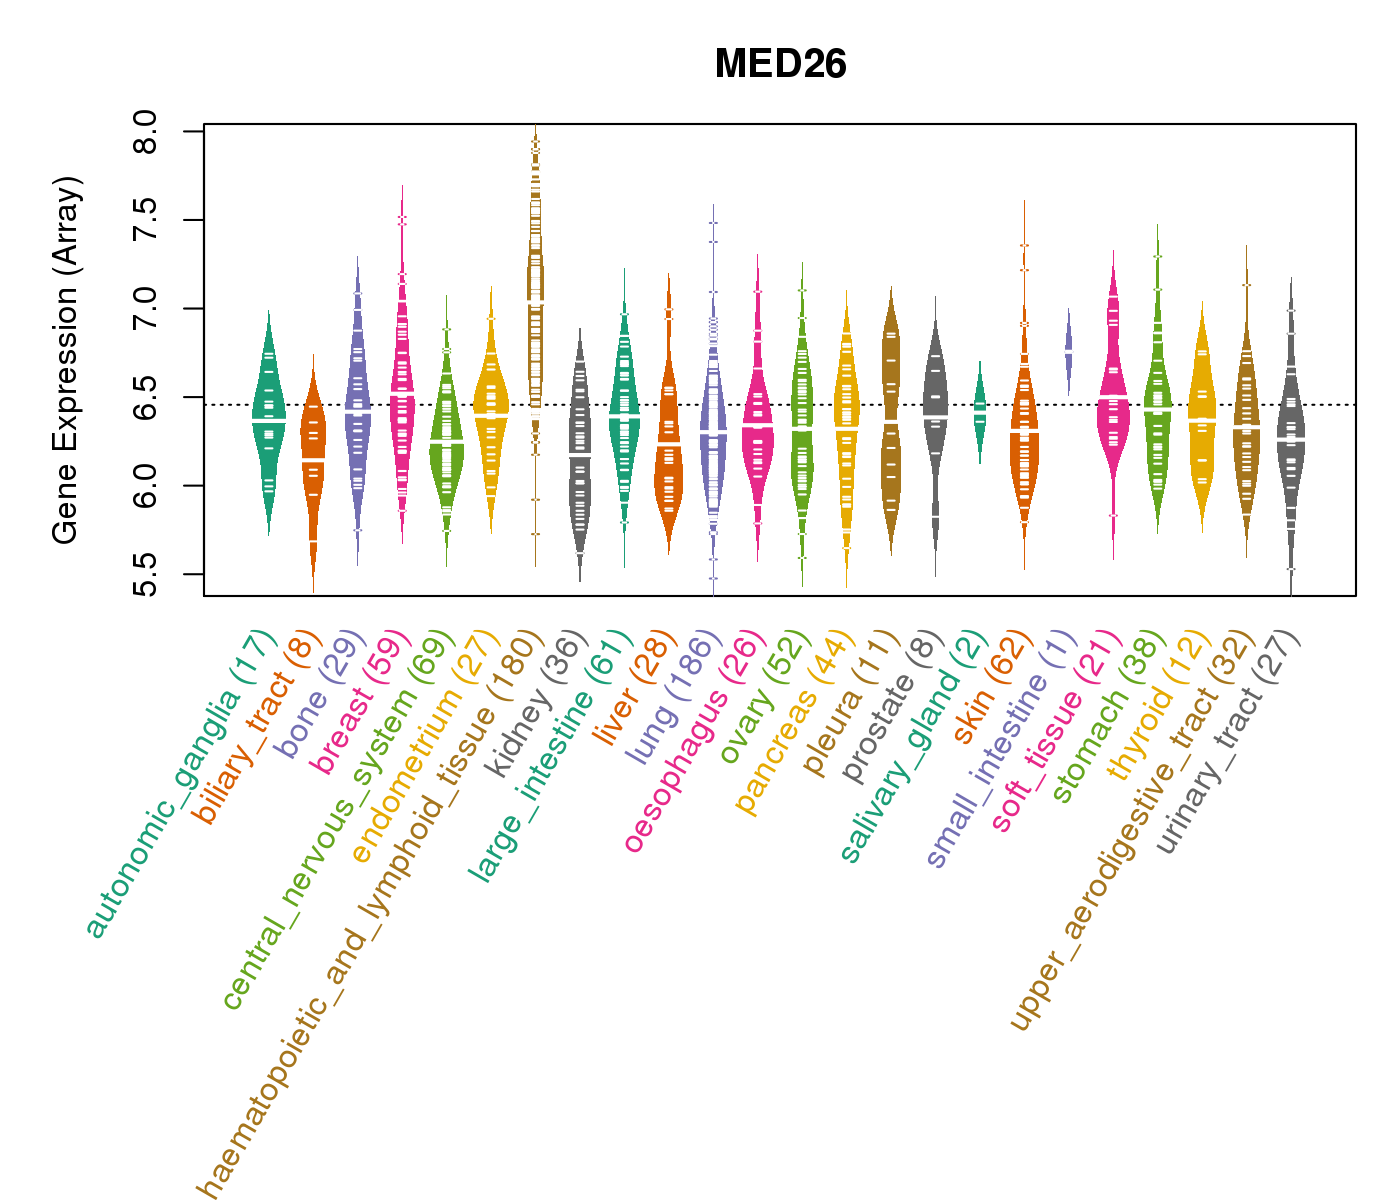
| Gene Expression for MED26 |
| * CCLE gene expression data were extracted from CCLE_Expression_Entrez_2012-10-18.res: Gene-centric RMA-normalized mRNA expression data. |
 |
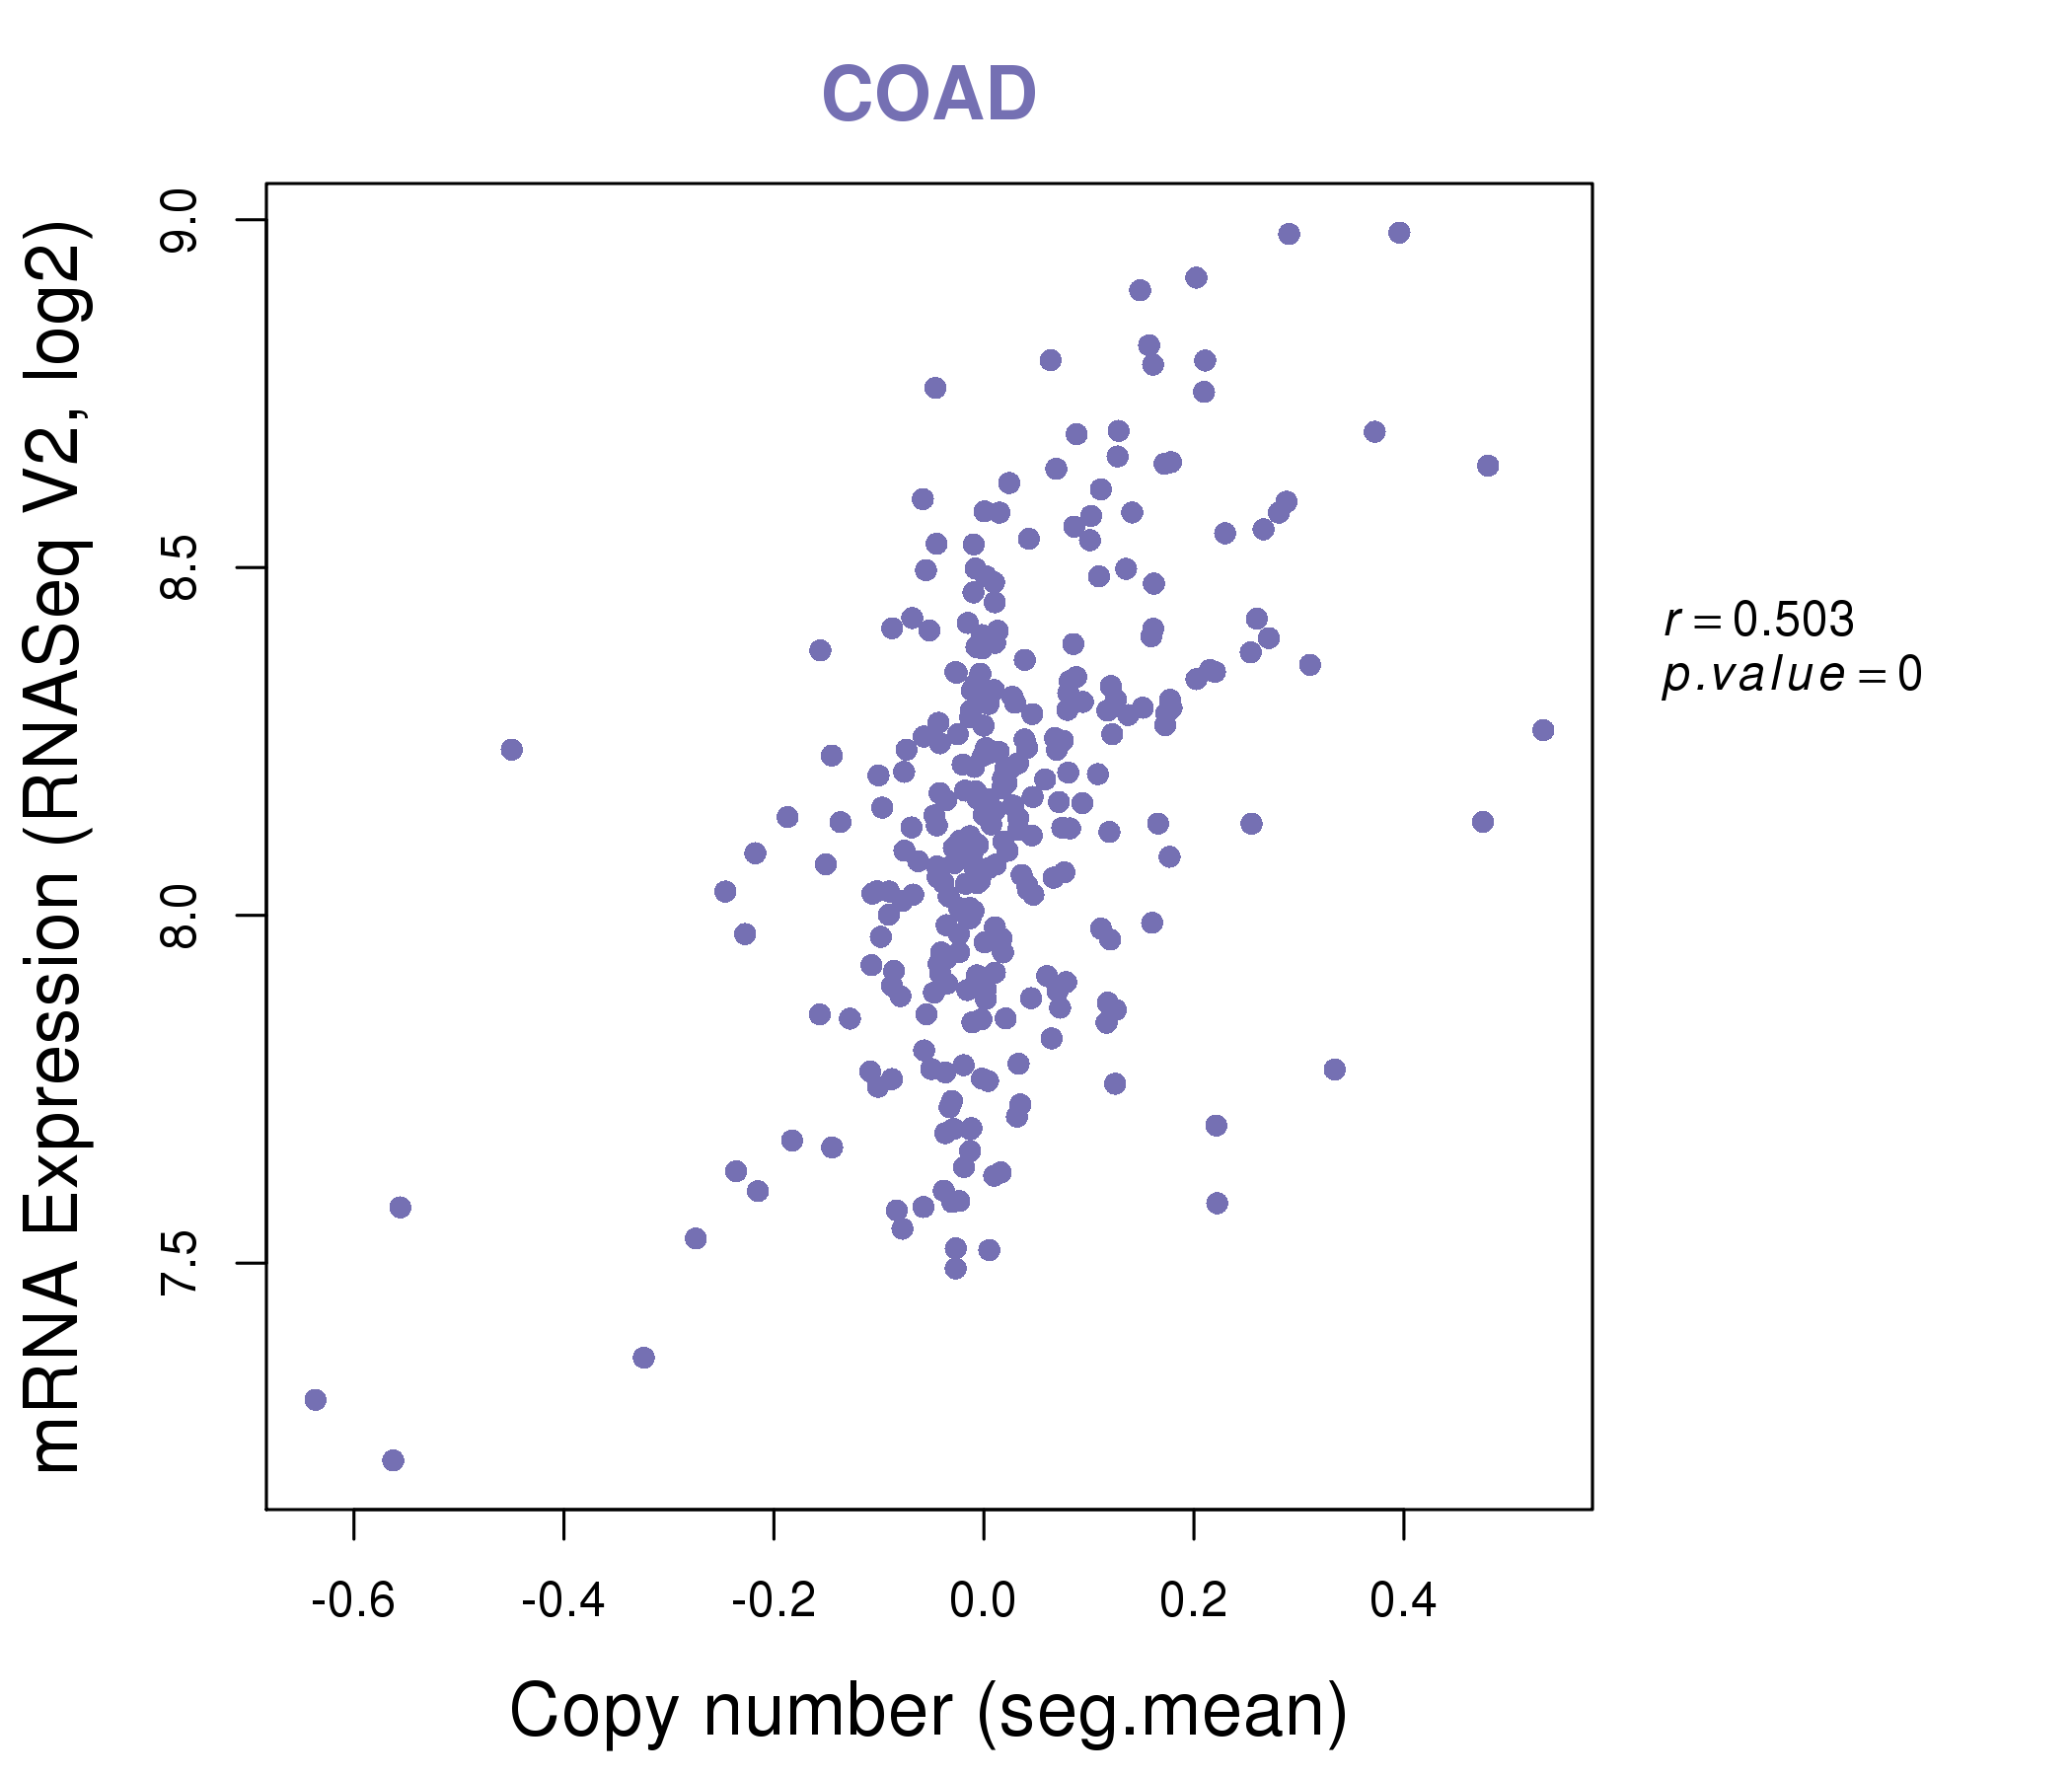
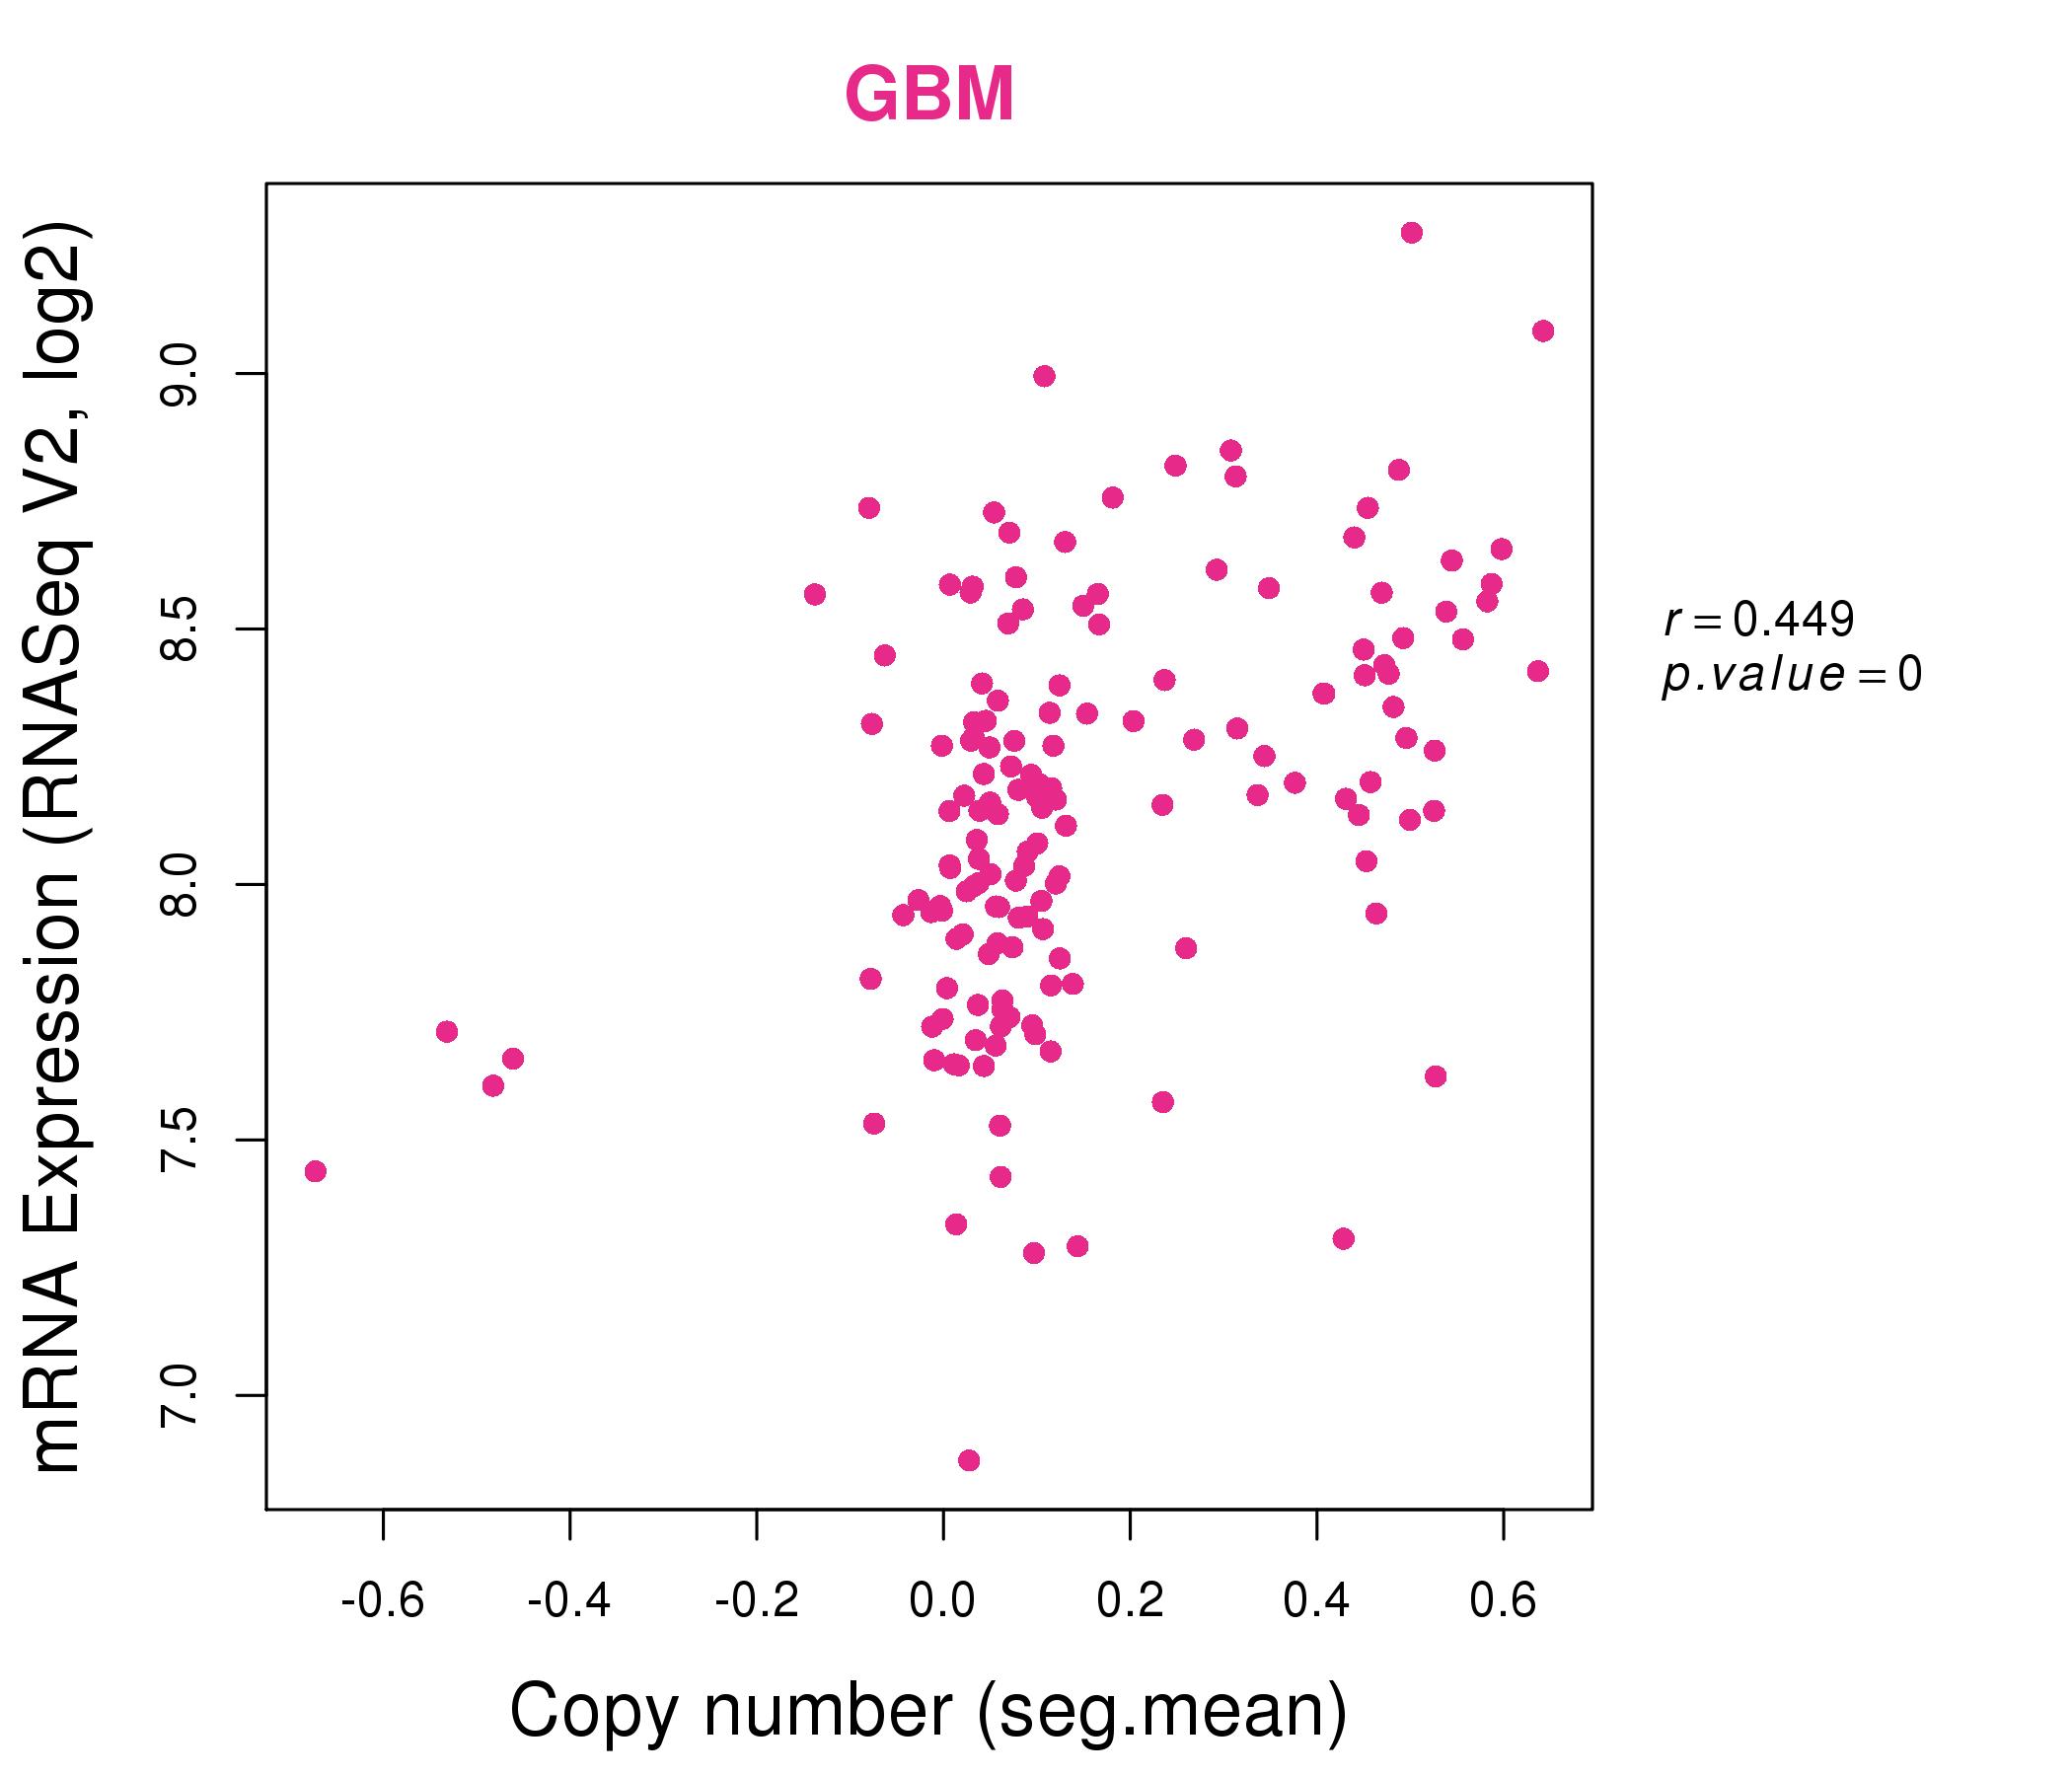
| * Normalized gene expression data of RNASeqV2 was extracted from TCGA using R package TCGA-Assembler. The URLs of all public data files on TCGA DCC data server were gathered at Jan-05-2015. Only eight cancer types have enough normal control samples for differential expression analysis. (t test, adjusted p<0.05 (using Benjamini-Hochberg FDR)) |
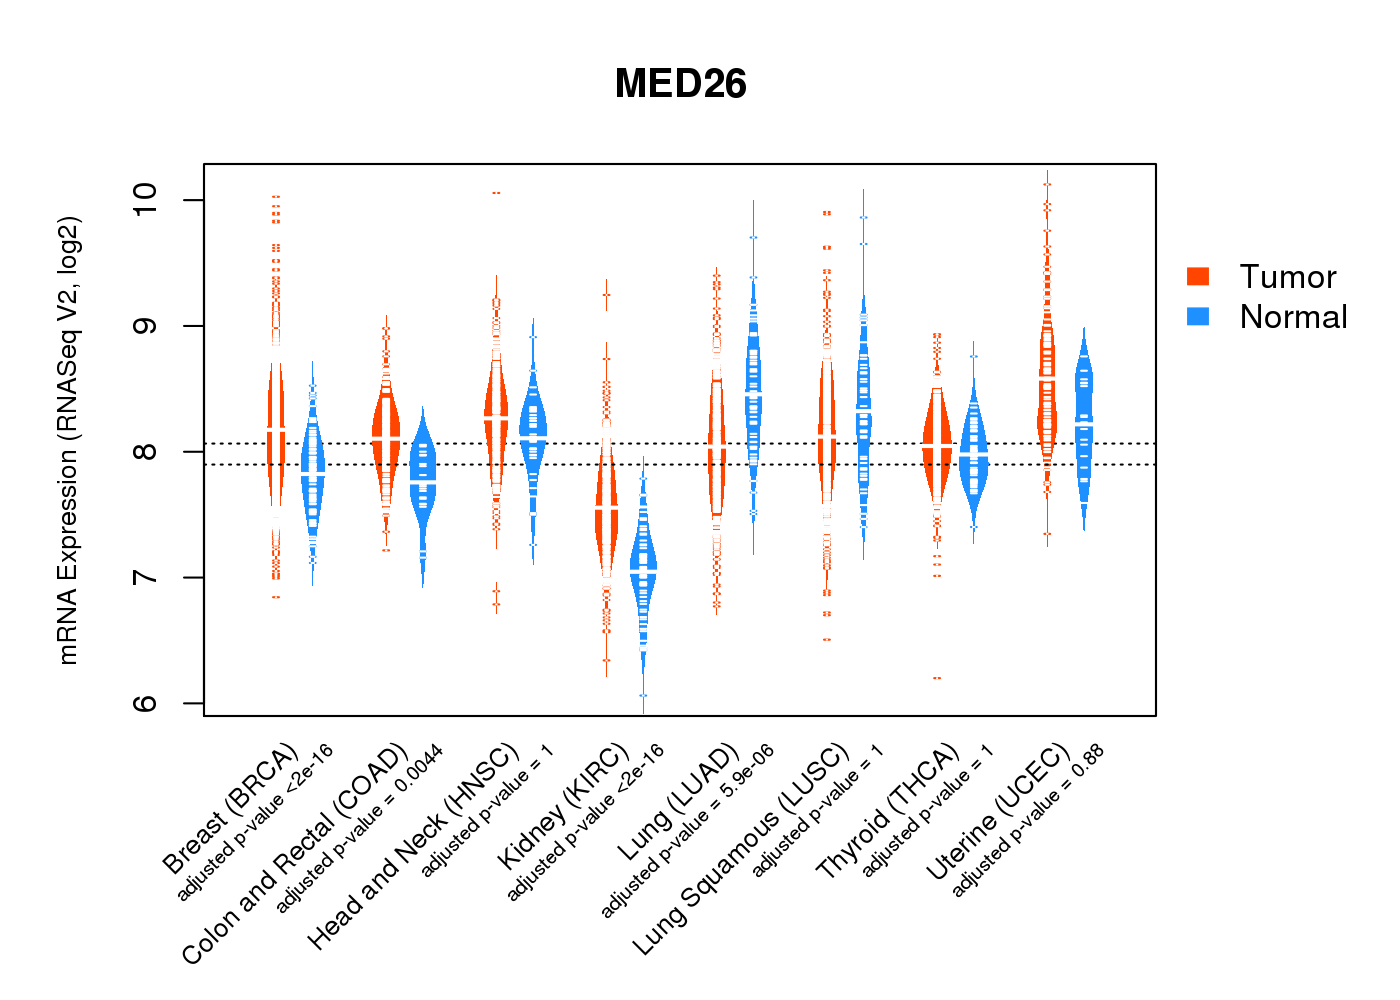 |
| Top |
| * This plots show the correlation between CNV and gene expression. |
: Open all plots for all cancer types
 |
|
 |
|

| Top |
| Gene-Gene Network Information |
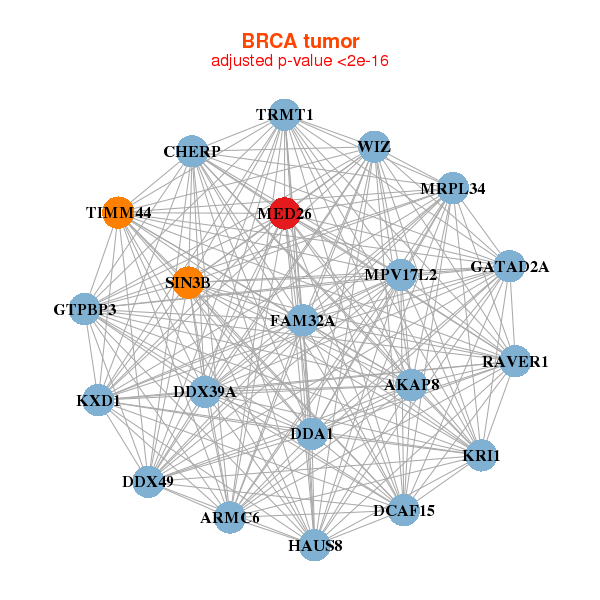
| * Co-Expression network figures were drawn using R package igraph. Only the top 20 genes with the highest correlations were shown. Red circle: input gene, orange circle: cell metabolism gene, sky circle: other gene |
: Open all plots for all cancer types
 |
|
| AKAP8,ARMC6,KXD1,CHERP,DCAF15,DDA1,DDX39A, DDX49,FAM32A,GATAD2A,GTPBP3,HAUS8,KRI1,MED26, MPV17L2,MRPL34,RAVER1,SIN3B,TIMM44,TRMT1,WIZ | CCDC9,DUS3L,FBXO46,FZR1,GTPBP3,MED26,NOXA1, PPAN,RAB40C,REXO1,RRP9,CLASRP,AKAP17A,SNAPC4, STX1A,TRMT1,NELFA,ZBTB48,ZNF446,ZNF653,ZNF777 |
 |
|
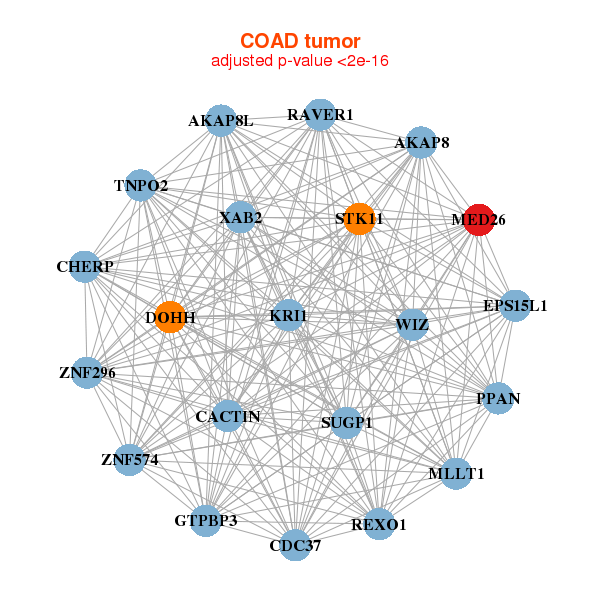
| AKAP8,AKAP8L,CACTIN,CDC37,CHERP,DOHH,EPS15L1, GTPBP3,KRI1,MED26,MLLT1,PPAN,RAVER1,REXO1, SUGP1,STK11,TNPO2,WIZ,XAB2,ZNF296,ZNF574 | ARID3B,BAG6,CLEC16A,CORO7,CYTH1,ELL,ERCC5, GMEB2,LEMD2,MCM3AP,MED26,MICAL1,PHRF1,PRKD2, REPS1,REXO1,RFX1,SKIV2L,SMARCD1,TATDN2,TRIM11 |

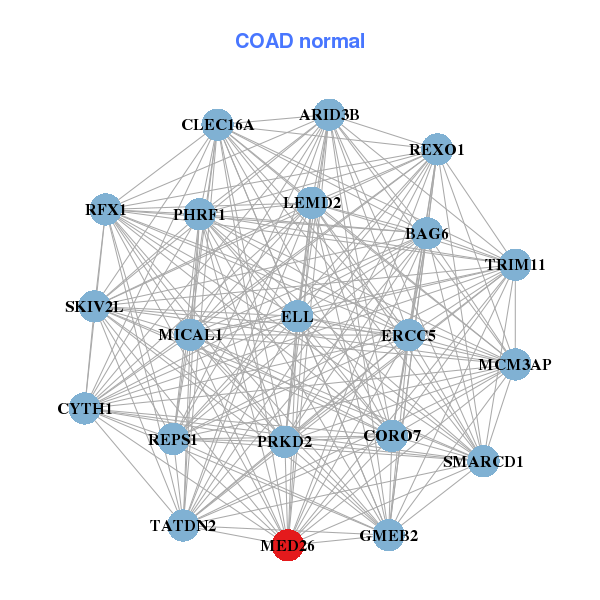
| * Co-Expression network figures were drawn using R package igraph. Only the top 20 genes with the highest correlations were shown. Red circle: input gene, orange circle: cell metabolism gene, sky circle: other gene |
: Open all plots for all cancer types
| Top |
: Open all interacting genes' information including KEGG pathway for all interacting genes from DAVID
| Top |
| Pharmacological Information for MED26 |
| There's no related Drug. |
| Top |
| Cross referenced IDs for MED26 |
| * We obtained these cross-references from Uniprot database. It covers 150 different DBs, 18 categories. http://www.uniprot.org/help/cross_references_section |
: Open all cross reference information
|
Copyright © 2016-Present - The Univsersity of Texas Health Science Center at Houston @ |