|
|||||||||||||||||||||||||||||||||||||||||||||||||||||||||||||||||||||||||||||||||||||||||||||||||||||||||||||||||||||||||||||||||||||||||||||||||||||||||||||||||||||||||||||||||||||||||||||||||||||||||||||||||||||||||||||||||||||||||||||||||||||||||||||||||||||||||||||||||||||||||||||||||||||||||||||||||||||||||||||||||||||||||||||||||||||||||
| |
| Phenotypic Information (metabolism pathway, cancer, disease, phenome) |
| |
| |
| Gene-Gene Network Information: Co-Expression Network, Interacting Genes & KEGG |
| |
|


| Gene Summary for GSTO1 |
| Basic gene info. | Gene symbol | GSTO1 |
| Gene name | glutathione S-transferase omega 1 | |
| Synonyms | GSTO 1-1|GSTTLp28|HEL-S-21|P28|SPG-R | |
| Cytomap | UCSC genome browser: 10q25.1 | |
| Genomic location | chr10 :106013951-106027222 | |
| Type of gene | protein-coding | |
| RefGenes | NM_001191002.1, NM_001191003.1,NM_004832.2, | |
| Ensembl id | ENSG00000148834 | |
| Description | GSTO-1MMA(V) reductaseS-(Phenacyl)glutathione reductaseepididymis secretory protein Li 21glutathione S-transferase omega 1-1glutathione S-transferase omega-1glutathione-S-transferase likeglutathione-dependent dehydroascorbate reductasemonomethylar | |
| Modification date | 20141207 | |
| dbXrefs | MIM : 605482 | |
| HGNC : HGNC | ||
| Ensembl : ENSG00000148834 | ||
| HPRD : 10401 | ||
| Vega : OTTHUMG00000019001 | ||
| Protein | UniProt: go to UniProt's Cross Reference DB Table | |
| Expression | CleanEX: HS_GSTO1 | |
| BioGPS: 9446 | ||
| Gene Expression Atlas: ENSG00000148834 | ||
| The Human Protein Atlas: ENSG00000148834 | ||
| Pathway | NCI Pathway Interaction Database: GSTO1 | |
| KEGG: GSTO1 | ||
| REACTOME: GSTO1 | ||
| ConsensusPathDB | ||
| Pathway Commons: GSTO1 | ||
| Metabolism | MetaCyc: GSTO1 | |
| HUMANCyc: GSTO1 | ||
| Regulation | Ensembl's Regulation: ENSG00000148834 | |
| miRBase: chr10 :106,013,951-106,027,222 | ||
| TargetScan: NM_001191002 | ||
| cisRED: ENSG00000148834 | ||
| Context | iHOP: GSTO1 | |
| cancer metabolism search in PubMed: GSTO1 | ||
| UCL Cancer Institute: GSTO1 | ||
| Assigned class in ccmGDB | C | |
| Top |
| Phenotypic Information for GSTO1(metabolism pathway, cancer, disease, phenome) |
| Cancer | CGAP: GSTO1 |
| Familial Cancer Database: GSTO1 | |
| * This gene is included in those cancer gene databases. |
|
|
|
|
|
|
| |||||||||||||||||||||||||||||||||||||||||||||||||||||||||||||||||||||||||||||||||||||||||||||||||||||||||||||||||||||||||||||||||||||||||||||||||||||||||||||||||||||||||||||||||||||||||||||||||||||||||||||||||||||||||||||||||||||||||||||||||||||||||||||||||||||||||||||||||||||||||||||||||||||||||||||||||||||||||||||||||||||||||||||||||||
Oncogene 1 | Significant driver gene in | ||||||||||||||||||||||||||||||||||||||||||||||||||||||||||||||||||||||||||||||||||||||||||||||||||||||||||||||||||||||||||||||||||||||||||||||||||||||||||||||||||||||||||||||||||||||||||||||||||||||||||||||||||||||||||||||||||||||||||||||||||||||||||||||||||||||||||||||||||||||||||||||||||||||||||||||||||||||||||||||||||||||||||||||||||||||||
| cf) number; DB name 1 Oncogene; http://nar.oxfordjournals.org/content/35/suppl_1/D721.long, 2 Tumor Suppressor gene; https://bioinfo.uth.edu/TSGene/, 3 Cancer Gene Census; http://www.nature.com/nrc/journal/v4/n3/abs/nrc1299.html, 4 CancerGenes; http://nar.oxfordjournals.org/content/35/suppl_1/D721.long, 5 Network of Cancer Gene; http://ncg.kcl.ac.uk/index.php, 1Therapeutic Vulnerabilities in Cancer; http://cbio.mskcc.org/cancergenomics/statius/ |
| KEGG_GLUTATHIONE_METABOLISM KEGG_METABOLISM_OF_XENOBIOTICS_BY_CYTOCHROME_P450 KEGG_DRUG_METABOLISM_CYTOCHROME_P450 REACTOME_METABOLISM_OF_VITAMINS_AND_COFACTORS | |
| OMIM | |
| Orphanet | |
| Disease | KEGG Disease: GSTO1 |
| MedGen: GSTO1 (Human Medical Genetics with Condition) | |
| ClinVar: GSTO1 | |
| Phenotype | MGI: GSTO1 (International Mouse Phenotyping Consortium) |
| PhenomicDB: GSTO1 | |
| Mutations for GSTO1 |
| * Under tables are showing count per each tissue to give us broad intuition about tissue specific mutation patterns.You can go to the detailed page for each mutation database's web site. |
| There's no structural variation information in COSMIC data for this gene. |
| * From mRNA Sanger sequences, Chitars2.0 arranged chimeric transcripts. This table shows GSTO1 related fusion information. |
| ID | Head Gene | Tail Gene | Accession | Gene_a | qStart_a | qEnd_a | Chromosome_a | tStart_a | tEnd_a | Gene_a | qStart_a | qEnd_a | Chromosome_a | tStart_a | tEnd_a |
| AA234313 | CPD | 1 | 140 | 17 | 28758847 | 28766081 | GSTO1 | 131 | 383 | 10 | 106019490 | 106025928 | |
| BG314836 | GSTO1 | 6 | 183 | 10 | 106014951 | 106019431 | PLIN2 | 175 | 556 | 9 | 19115888 | 19116268 | |
| BC082963 | HS3ST3A1 | 22 | 2058 | 17 | 13399487 | 13505235 | GSTO1 | 2058 | 2858 | 10 | 106014662 | 106027213 | |
| Top |
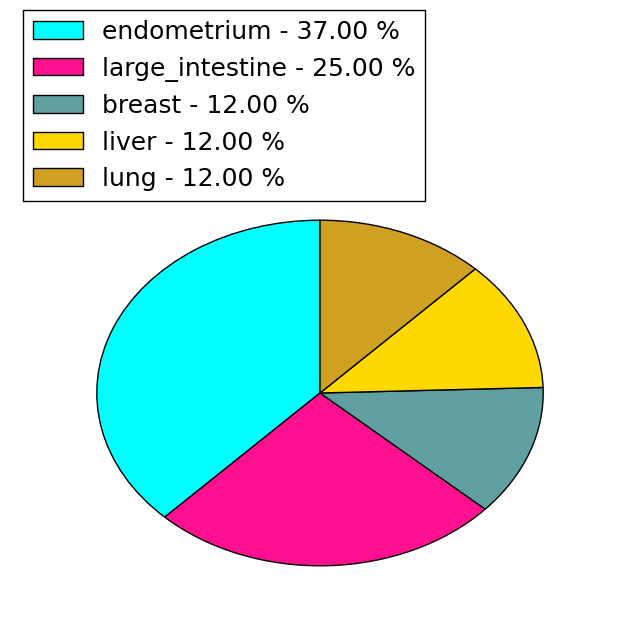
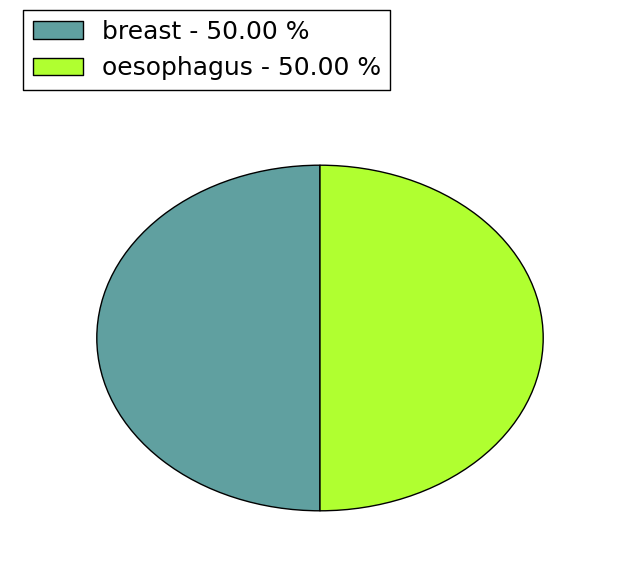
| Mutation type/ Tissue ID | brca | cns | cerv | endome | haematopo | kidn | Lintest | liver | lung | ns | ovary | pancre | prost | skin | stoma | thyro | urina | |||
| Total # sample | 1 | |||||||||||||||||||
| GAIN (# sample) | ||||||||||||||||||||
| LOSS (# sample) | 1 |
| cf) Tissue ID; Tissue type (1; Breast, 2; Central_nervous_system, 3; Cervix, 4; Endometrium, 5; Haematopoietic_and_lymphoid_tissue, 6; Kidney, 7; Large_intestine, 8; Liver, 9; Lung, 10; NS, 11; Ovary, 12; Pancreas, 13; Prostate, 14; Skin, 15; Stomach, 16; Thyroid, 17; Urinary_tract) |
| Top |
|
 |
| Top |
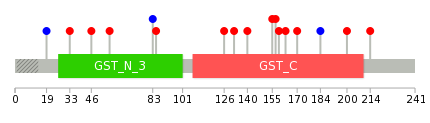
| Stat. for Non-Synonymous SNVs (# total SNVs=8) | (# total SNVs=2) |
 |  |
(# total SNVs=0) | (# total SNVs=0) |
| Top |
| * When you move the cursor on each content, you can see more deailed mutation information on the Tooltip. Those are primary_site,primary_histology,mutation(aa),pubmedID. |
| GRCh37 position | Mutation(aa) | Unique sampleID count |
| chr10:106022834-106022836 | p.? | 3 |
| chr10:106019360-106019360 | p.K57T | 1 |
| chr10:106025884-106025884 | p.I170V | 1 |
| chr10:106019439-106019439 | p.I83I | 1 |
| chr10:106025928-106025928 | p.L184L | 1 |
| chr10:106019443-106019443 | p.E85K | 1 |
| chr10:106027036-106027036 | p.K200T | 1 |
| chr10:106022748-106022748 | p.L126F | 1 |
| chr10:106027078-106027078 | p.A214V | 1 |
| chr10:106022765-106022765 | p.R132K | 1 |
| Top |
|
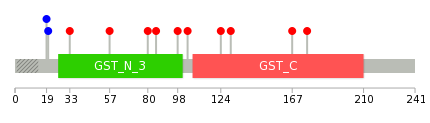 |
| Point Mutation/ Tissue ID | 1 | 2 | 3 | 4 | 5 | 6 | 7 | 8 | 9 | 10 | 11 | 12 | 13 | 14 | 15 | 16 | 17 | 18 | 19 | 20 |
| # sample | 1 | 1 | 1 | 3 | 1 | 2 | 3 | |||||||||||||
| # mutation | 1 | 1 | 1 | 3 | 1 | 2 | 3 | |||||||||||||
| nonsynonymous SNV | 1 | 1 | 2 | 1 | 2 | 3 | ||||||||||||||
| synonymous SNV | 1 | 1 |
| cf) Tissue ID; Tissue type (1; BLCA[Bladder Urothelial Carcinoma], 2; BRCA[Breast invasive carcinoma], 3; CESC[Cervical squamous cell carcinoma and endocervical adenocarcinoma], 4; COAD[Colon adenocarcinoma], 5; GBM[Glioblastoma multiforme], 6; Glioma Low Grade, 7; HNSC[Head and Neck squamous cell carcinoma], 8; KICH[Kidney Chromophobe], 9; KIRC[Kidney renal clear cell carcinoma], 10; KIRP[Kidney renal papillary cell carcinoma], 11; LAML[Acute Myeloid Leukemia], 12; LUAD[Lung adenocarcinoma], 13; LUSC[Lung squamous cell carcinoma], 14; OV[Ovarian serous cystadenocarcinoma ], 15; PAAD[Pancreatic adenocarcinoma], 16; PRAD[Prostate adenocarcinoma], 17; SKCM[Skin Cutaneous Melanoma], 18:STAD[Stomach adenocarcinoma], 19:THCA[Thyroid carcinoma], 20:UCEC[Uterine Corpus Endometrial Carcinoma]) |
| Top |
| * We represented just top 10 SNVs. When you move the cursor on each content, you can see more deailed mutation information on the Tooltip. Those are primary_site, primary_histology, mutation(aa), pubmedID. |
| Genomic Position | Mutation(aa) | Unique sampleID count |
| chr10:106027036 | p.V19V,GSTO1 | 1 |
| chr10:106014943 | p.P20P,GSTO1 | 1 |
| chr10:106027062 | p.P33L,GSTO1 | 1 |
| chr10:106014946 | p.K57T,GSTO1 | 1 |
| chr10:106014984 | p.G80S,GSTO1 | 1 |
| chr10:106019360 | p.E85K,GSTO1 | 1 |
| chr10:106019428 | p.L98F,GSTO1 | 1 |
| chr10:106019443 | p.R104K,GSTO1 | 1 |
| chr10:106022748 | p.L124P,GSTO1 | 1 |
| chr10:106022765 | p.T130I,GSTO1 | 1 |
| * Copy number data were extracted from TCGA using R package TCGA-Assembler. The URLs of all public data files on TCGA DCC data server were gathered on Jan-05-2015. Function ProcessCNAData in TCGA-Assembler package was used to obtain gene-level copy number value which is calculated as the average copy number of the genomic region of a gene. |
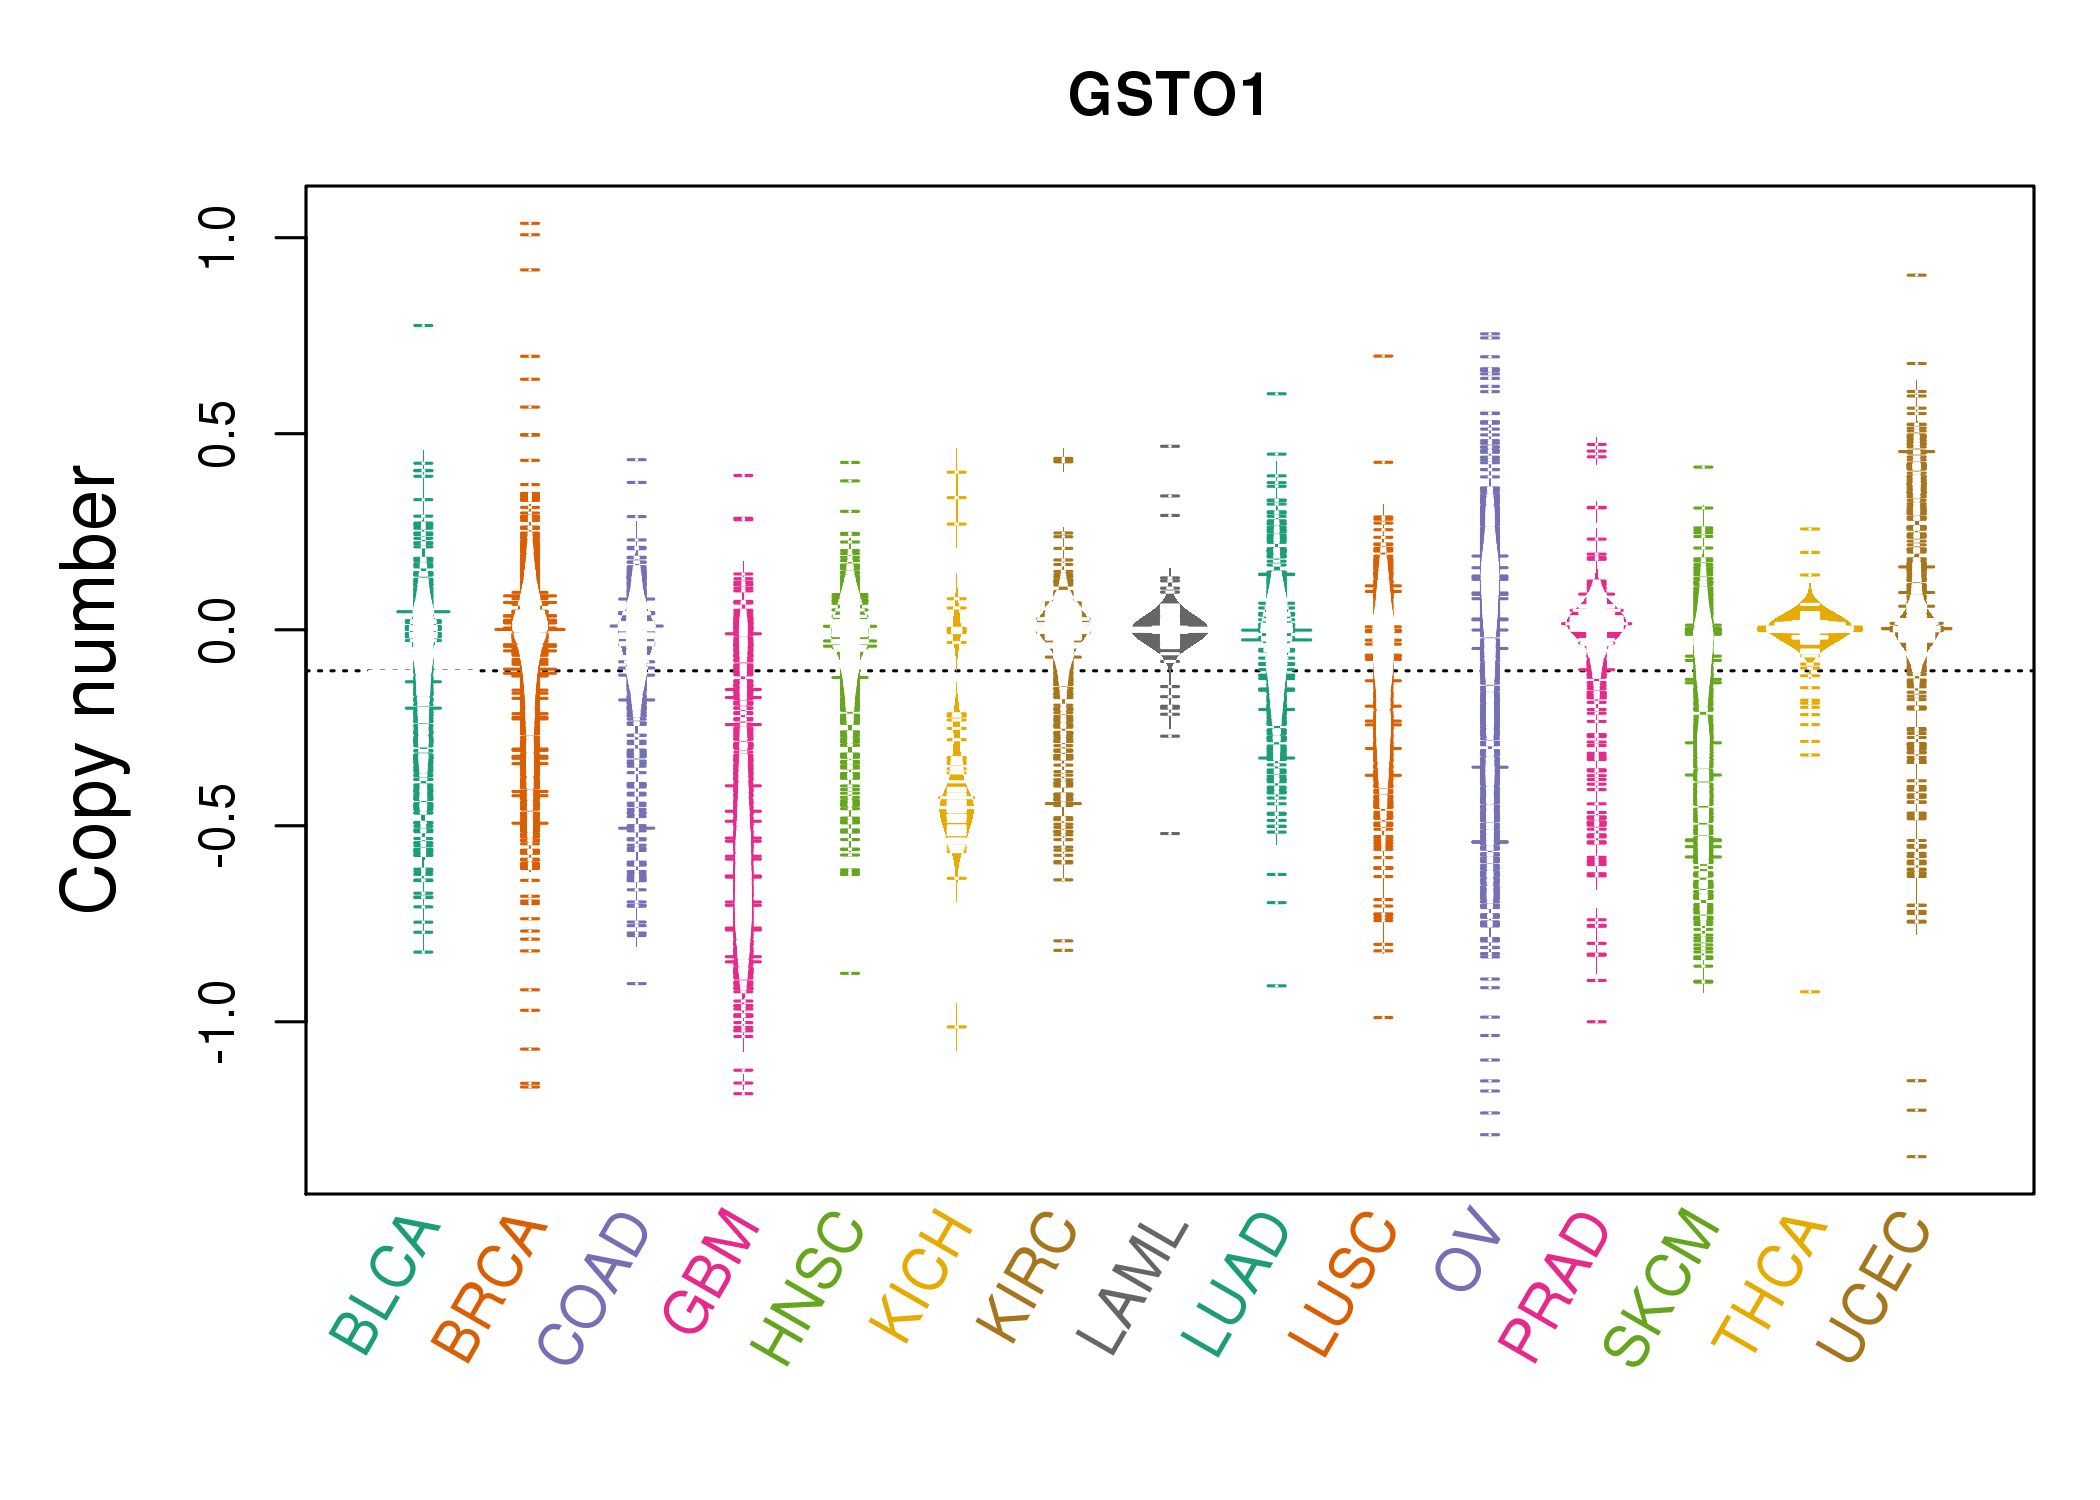 |
| cf) Tissue ID[Tissue type]: BLCA[Bladder Urothelial Carcinoma], BRCA[Breast invasive carcinoma], CESC[Cervical squamous cell carcinoma and endocervical adenocarcinoma], COAD[Colon adenocarcinoma], GBM[Glioblastoma multiforme], Glioma Low Grade, HNSC[Head and Neck squamous cell carcinoma], KICH[Kidney Chromophobe], KIRC[Kidney renal clear cell carcinoma], KIRP[Kidney renal papillary cell carcinoma], LAML[Acute Myeloid Leukemia], LUAD[Lung adenocarcinoma], LUSC[Lung squamous cell carcinoma], OV[Ovarian serous cystadenocarcinoma ], PAAD[Pancreatic adenocarcinoma], PRAD[Prostate adenocarcinoma], SKCM[Skin Cutaneous Melanoma], STAD[Stomach adenocarcinoma], THCA[Thyroid carcinoma], UCEC[Uterine Corpus Endometrial Carcinoma] |
| Top |
| Gene Expression for GSTO1 |
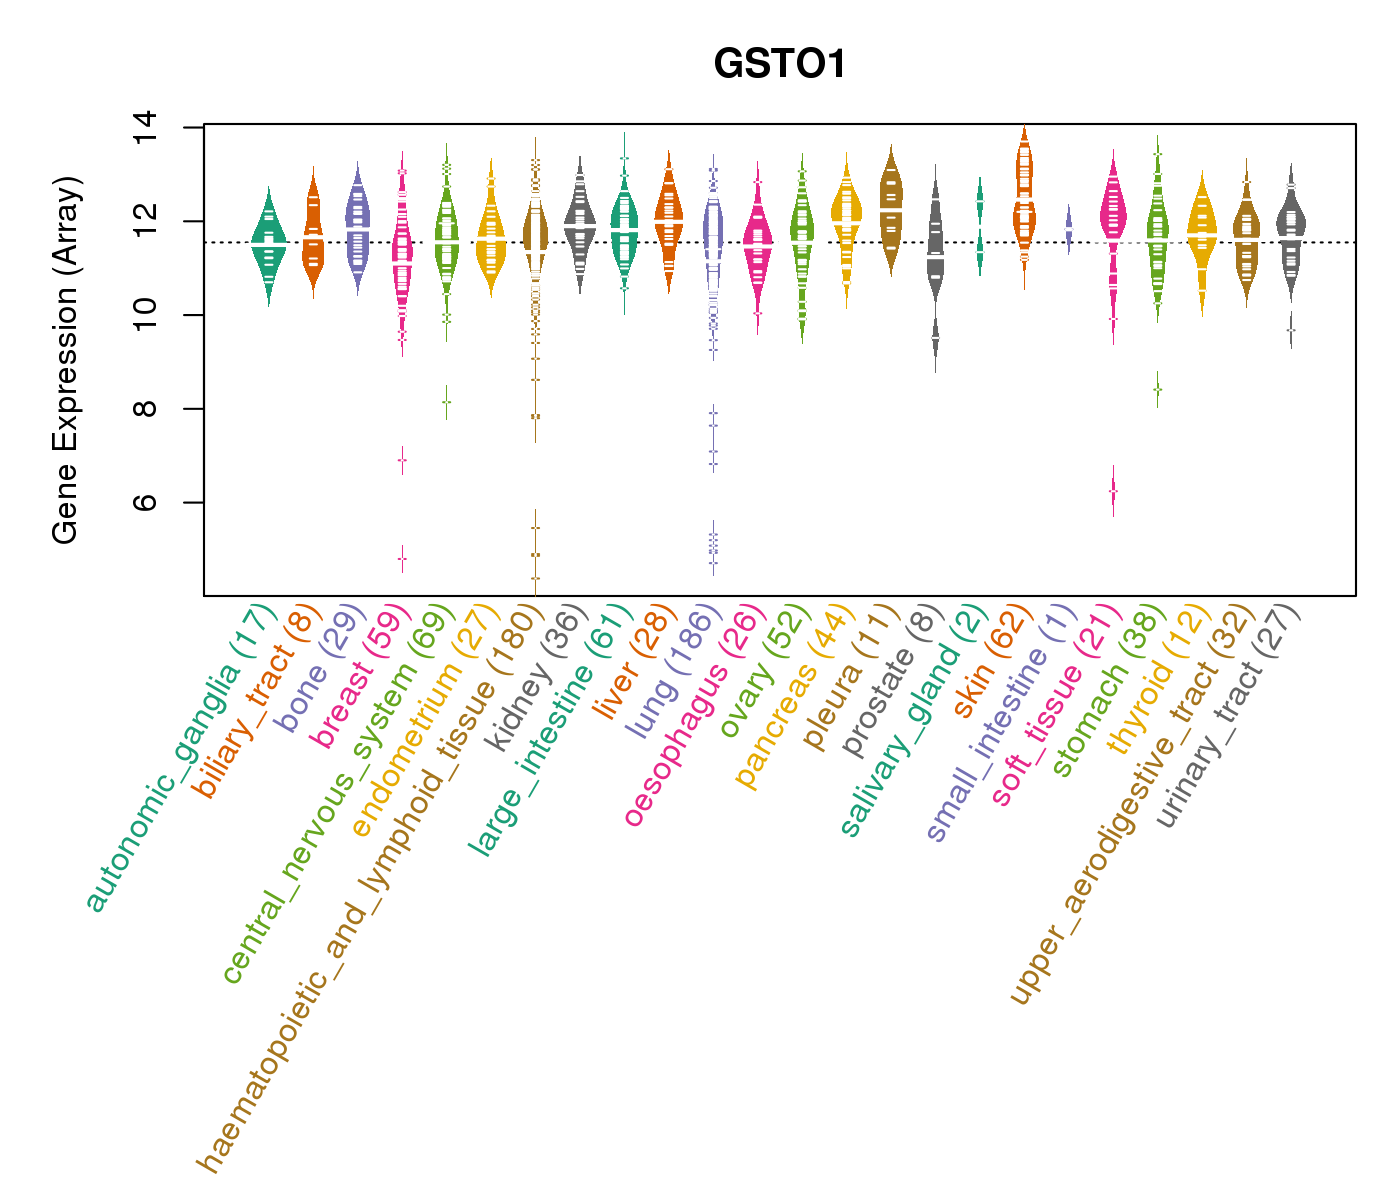
| * CCLE gene expression data were extracted from CCLE_Expression_Entrez_2012-10-18.res: Gene-centric RMA-normalized mRNA expression data. |
 |
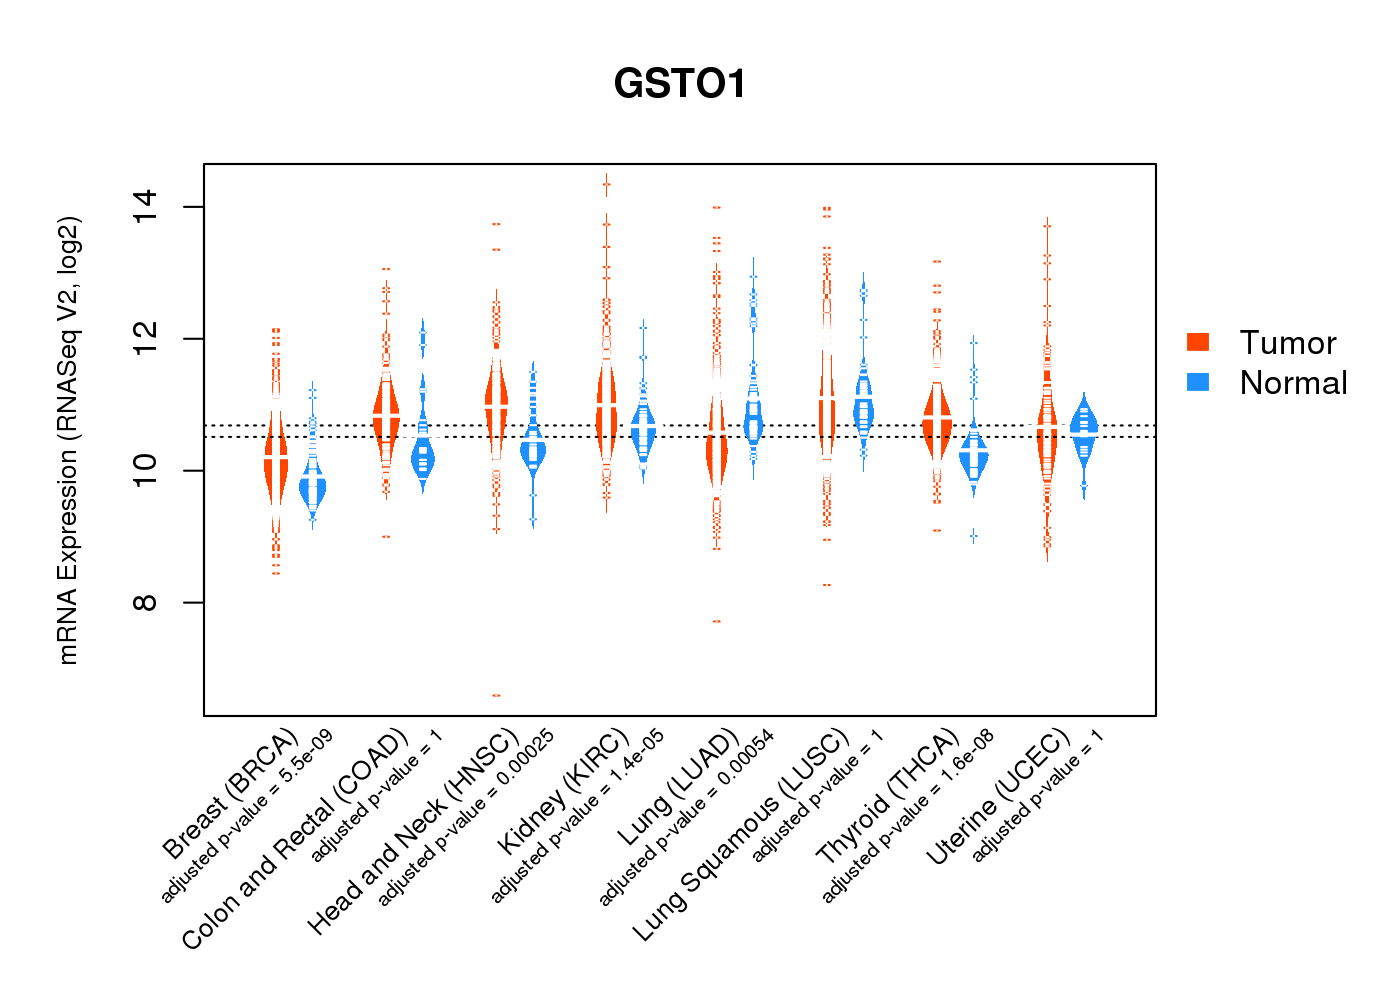
| * Normalized gene expression data of RNASeqV2 was extracted from TCGA using R package TCGA-Assembler. The URLs of all public data files on TCGA DCC data server were gathered at Jan-05-2015. Only eight cancer types have enough normal control samples for differential expression analysis. (t test, adjusted p<0.05 (using Benjamini-Hochberg FDR)) |
 |
| Top |
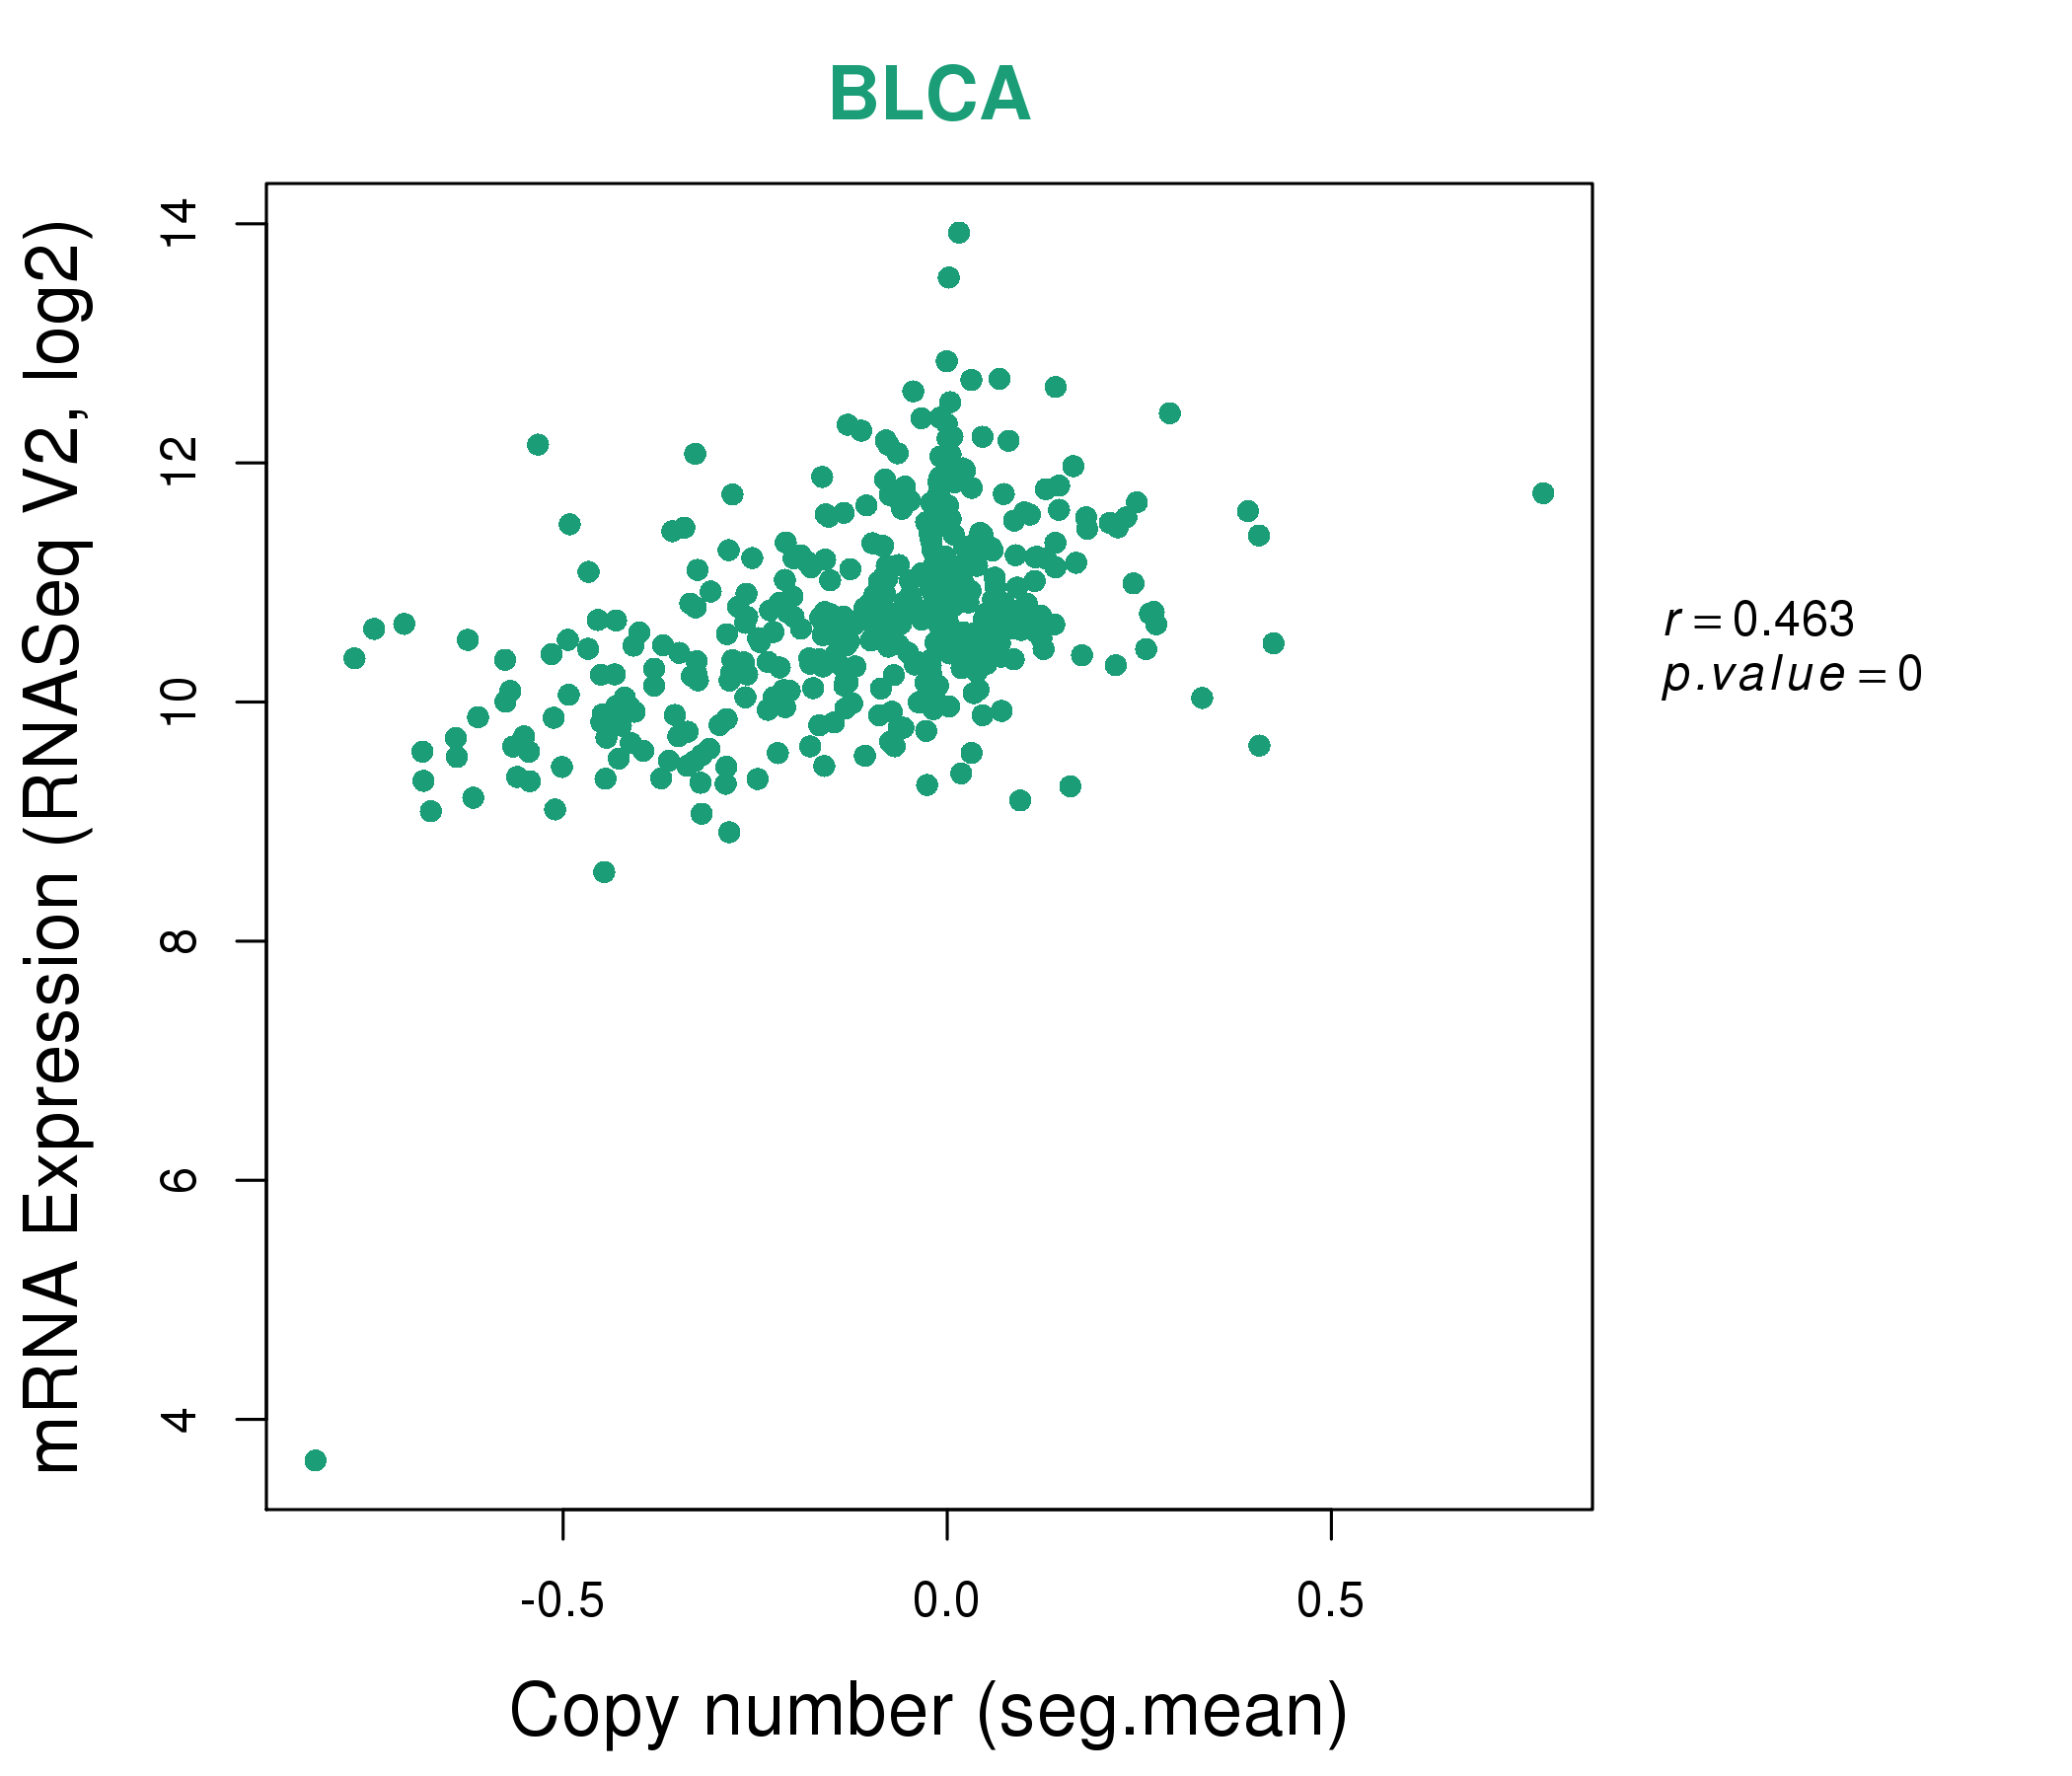
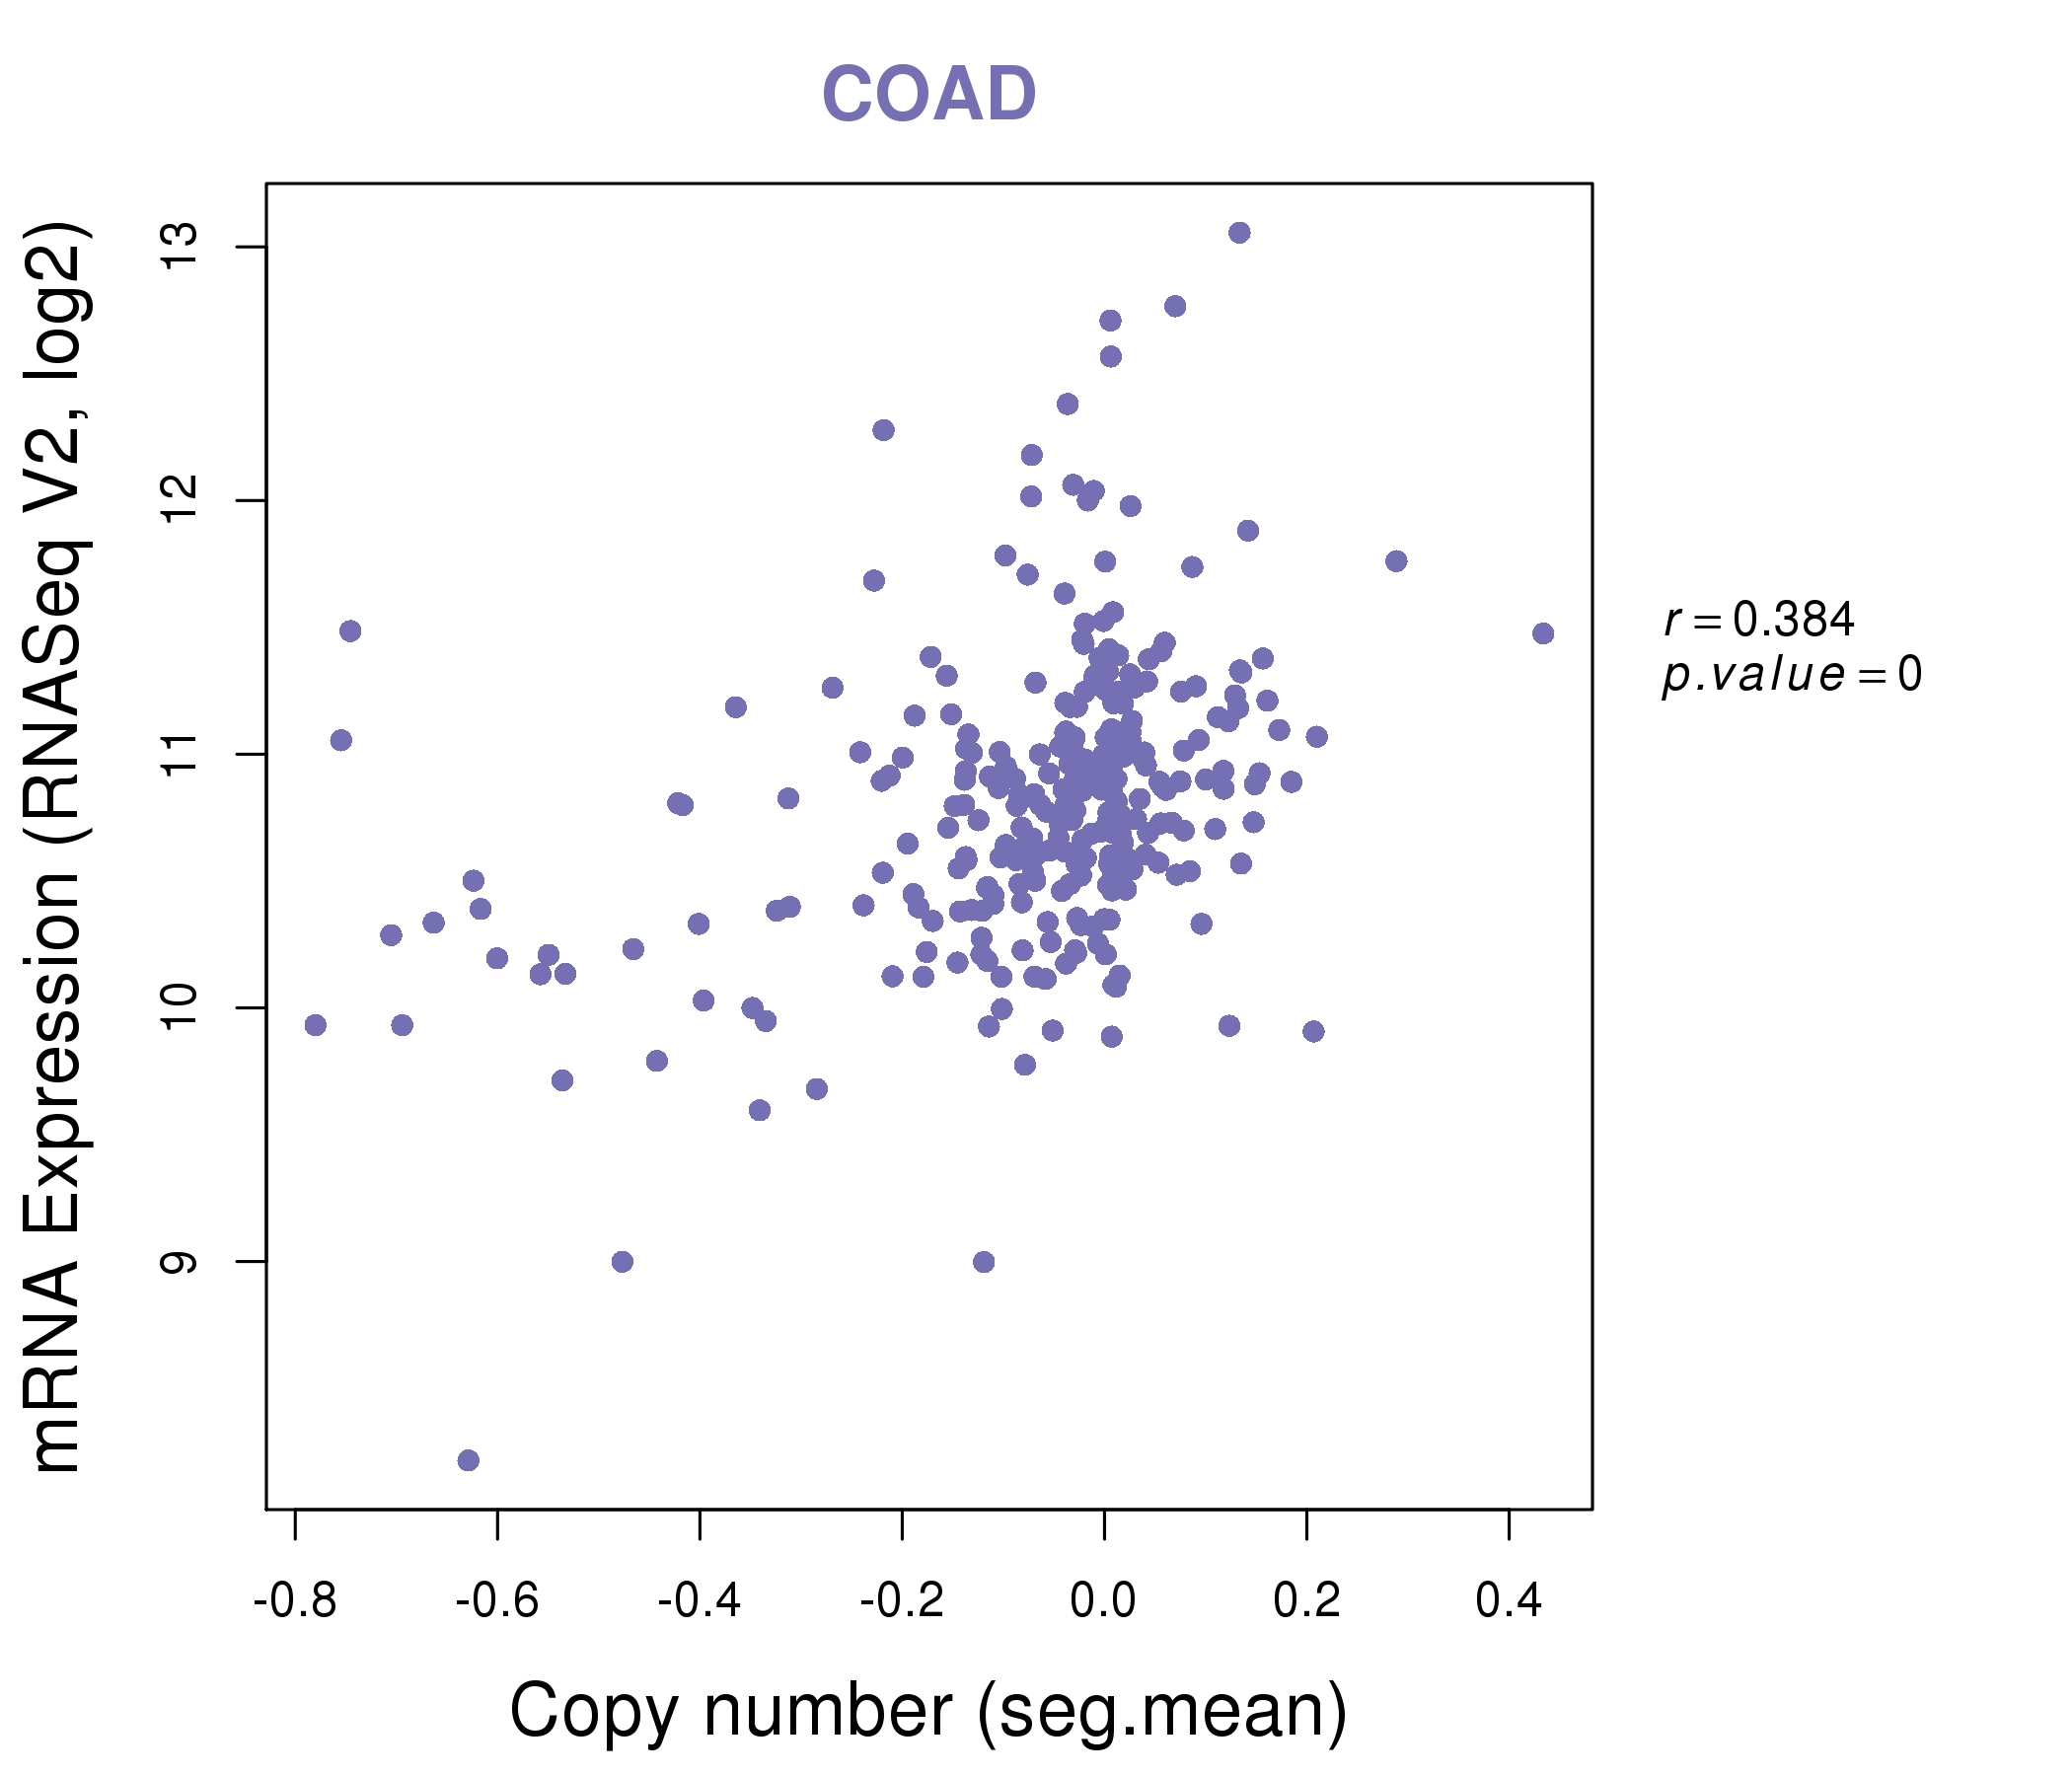
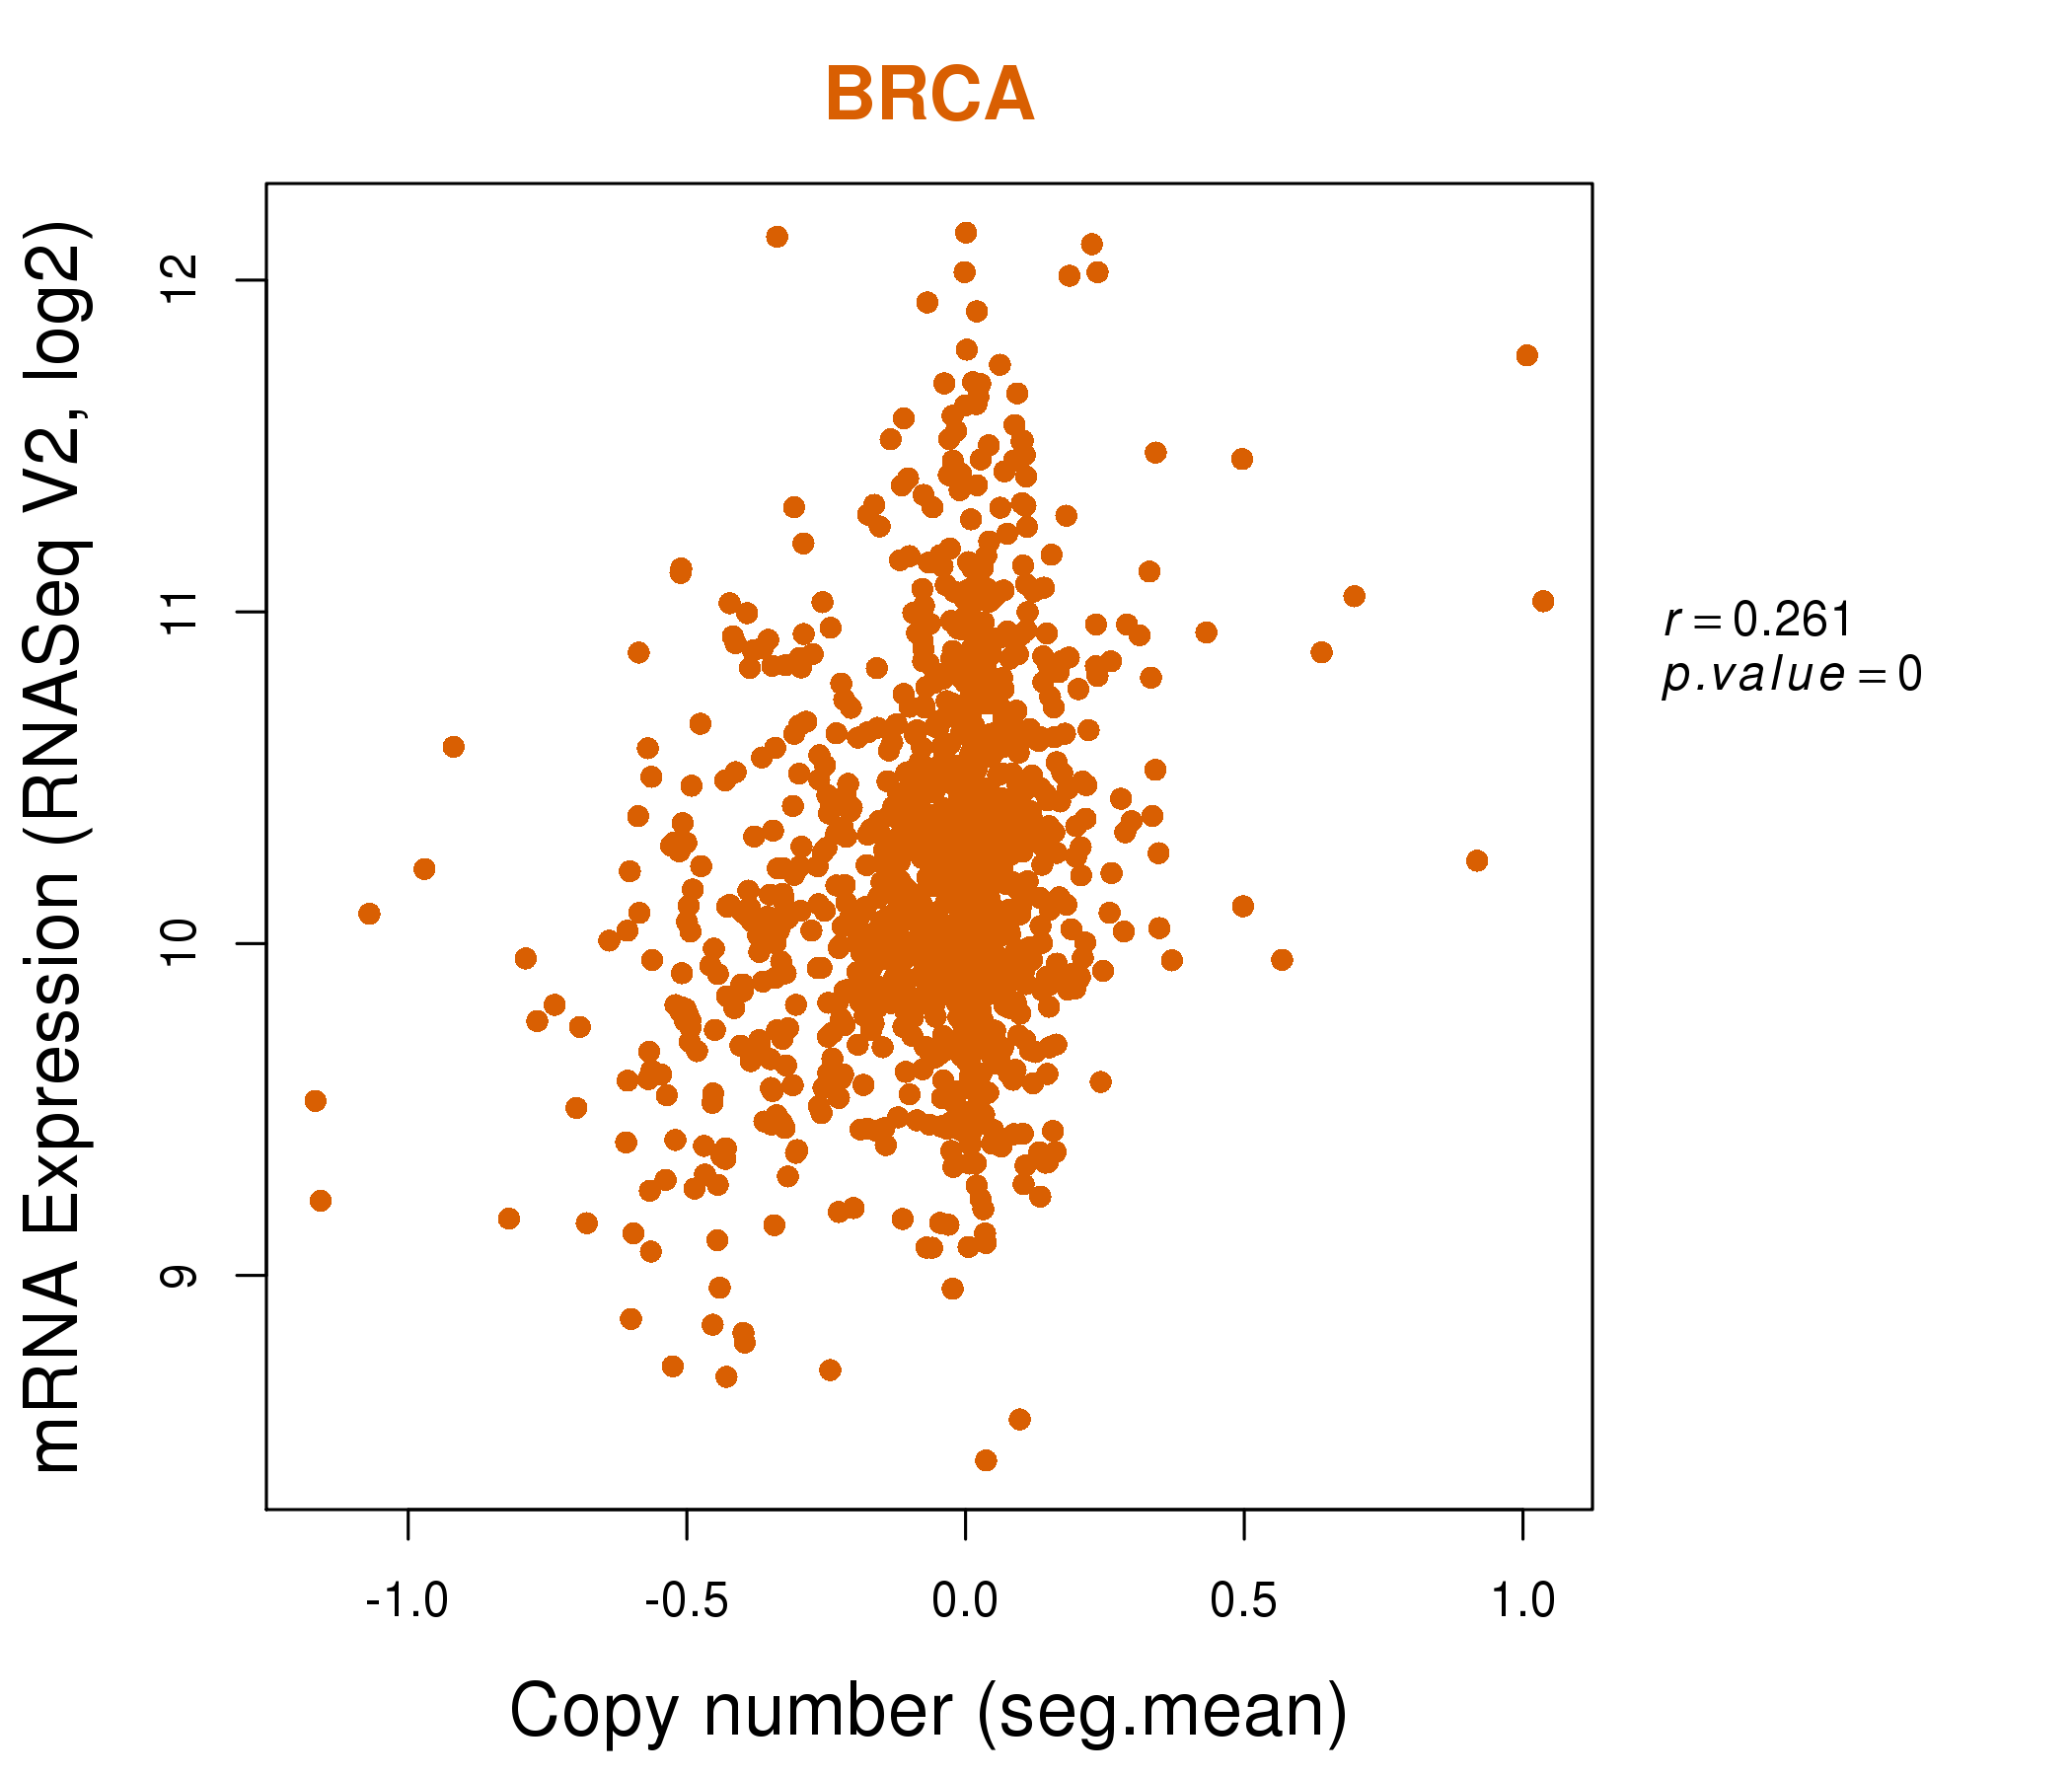
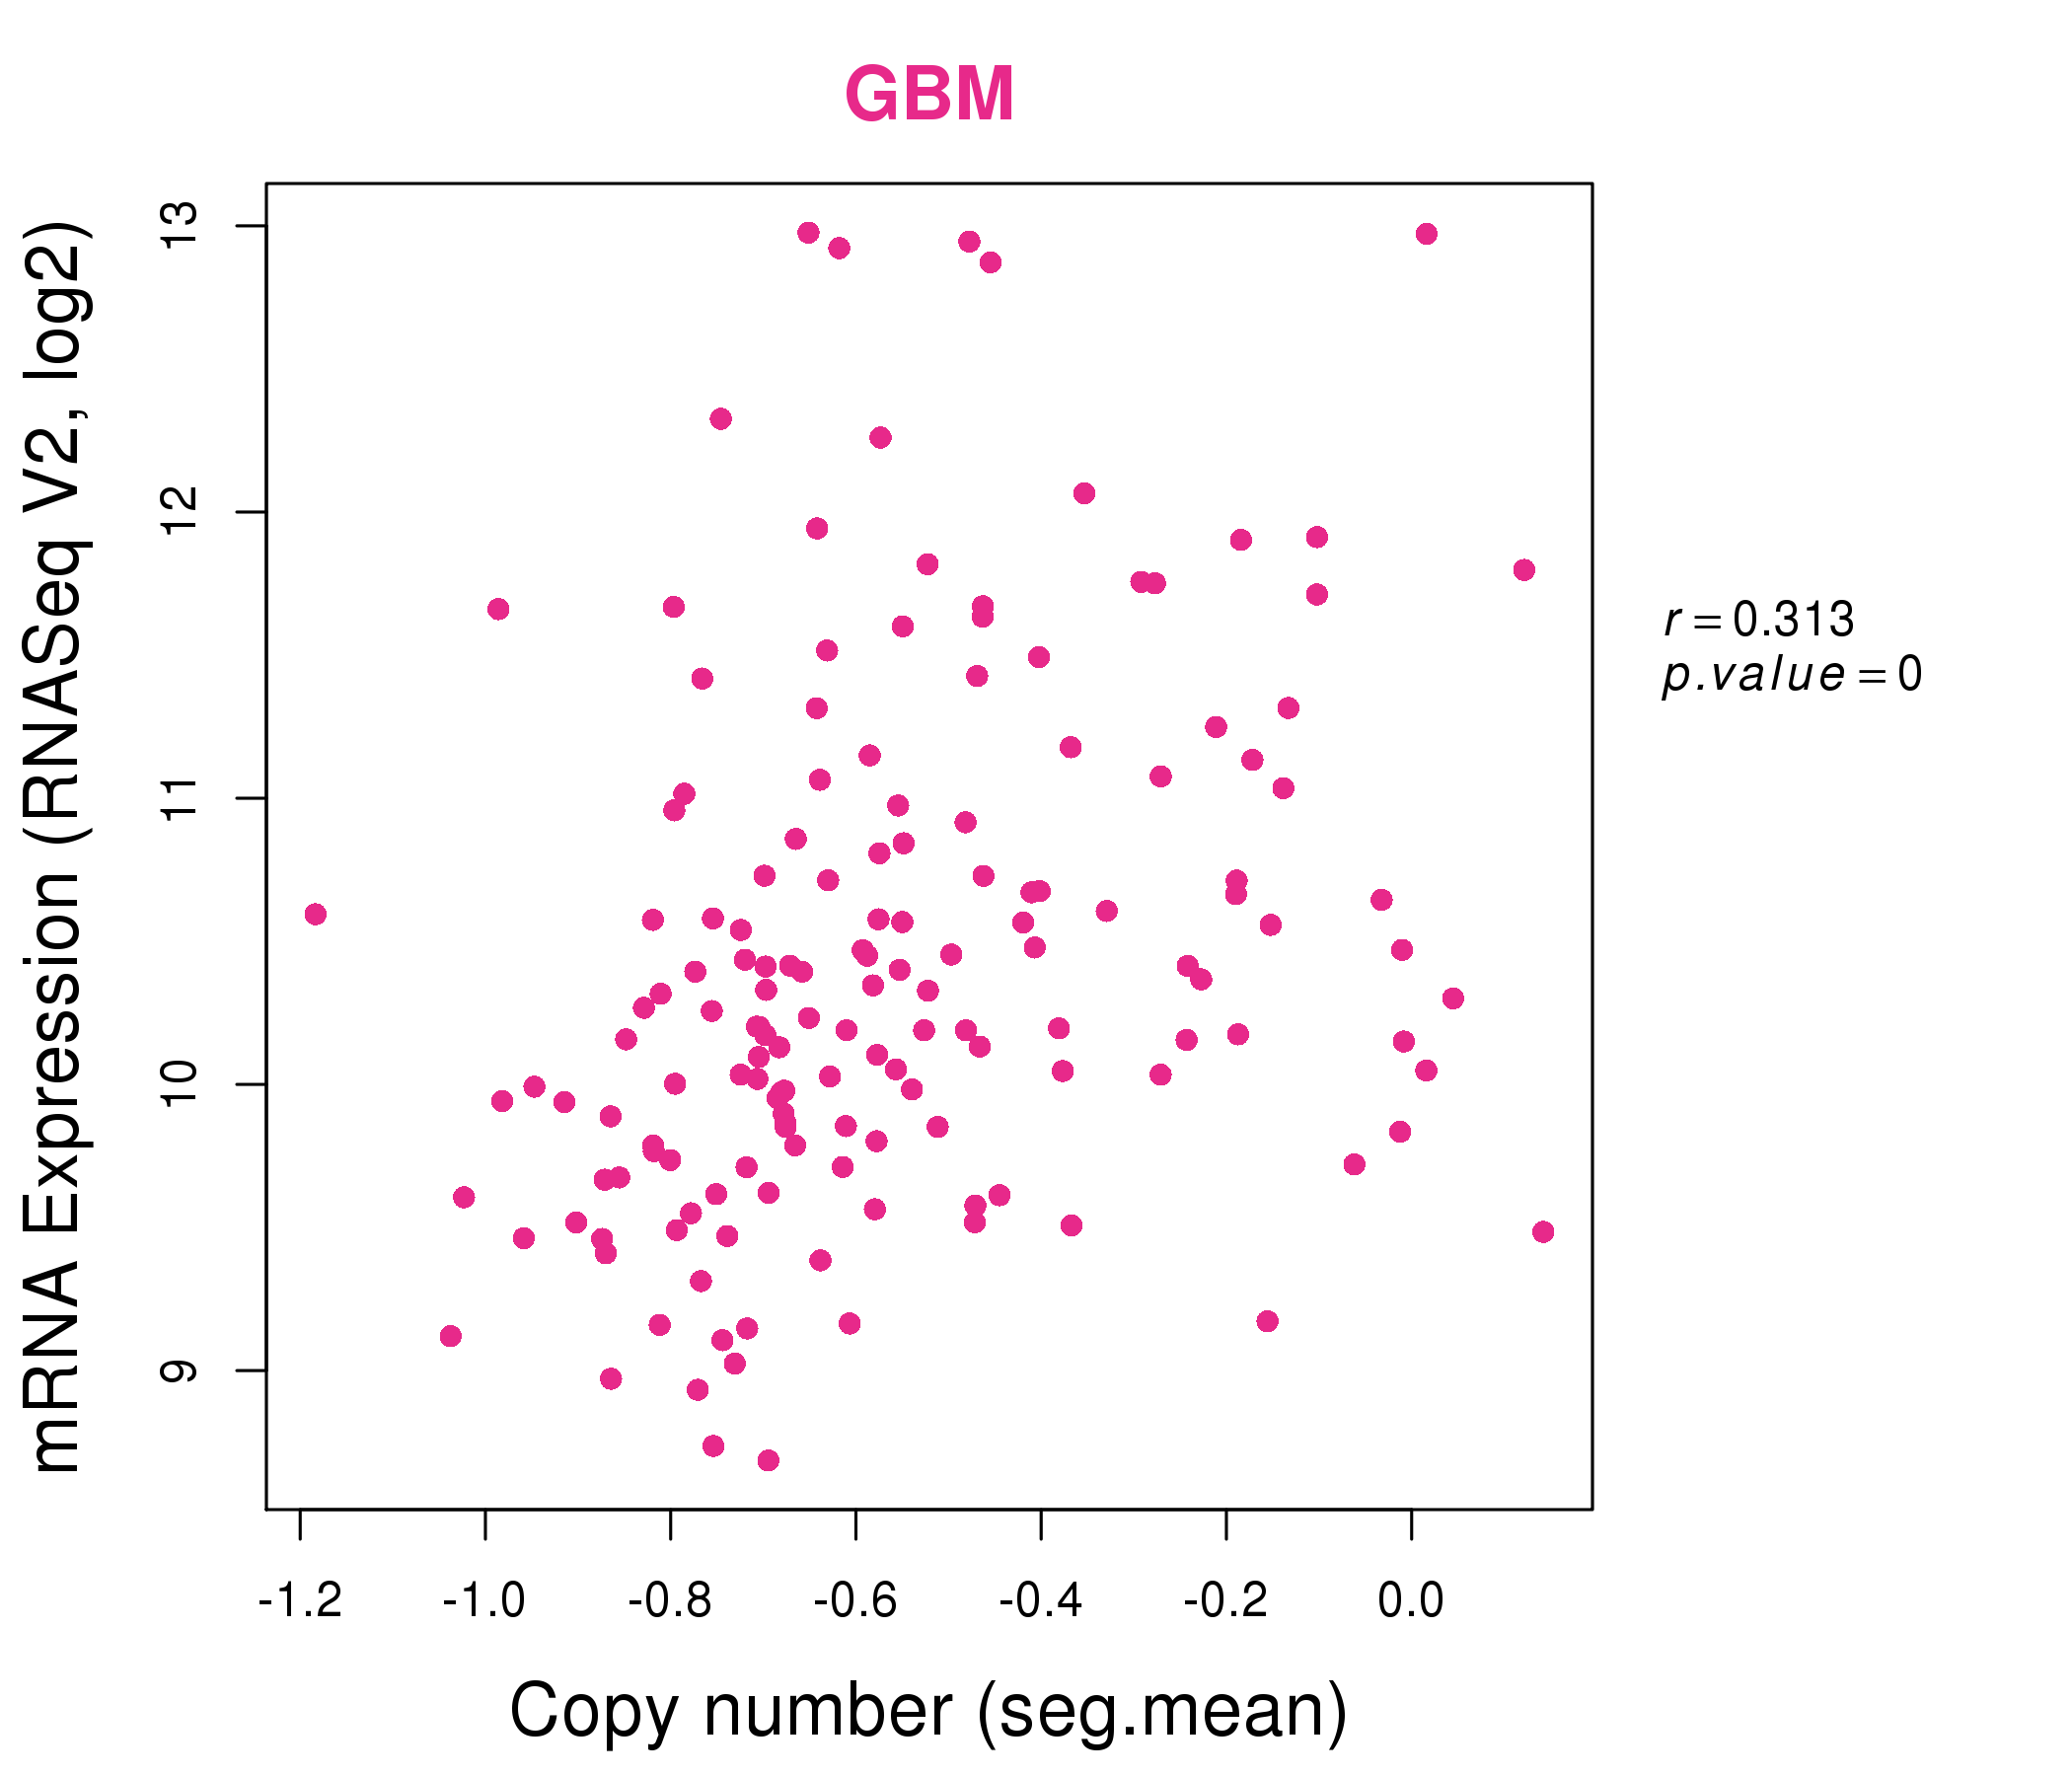
| * This plots show the correlation between CNV and gene expression. |
: Open all plots for all cancer types
 |
|
 |
|
| Top |
| Gene-Gene Network Information |
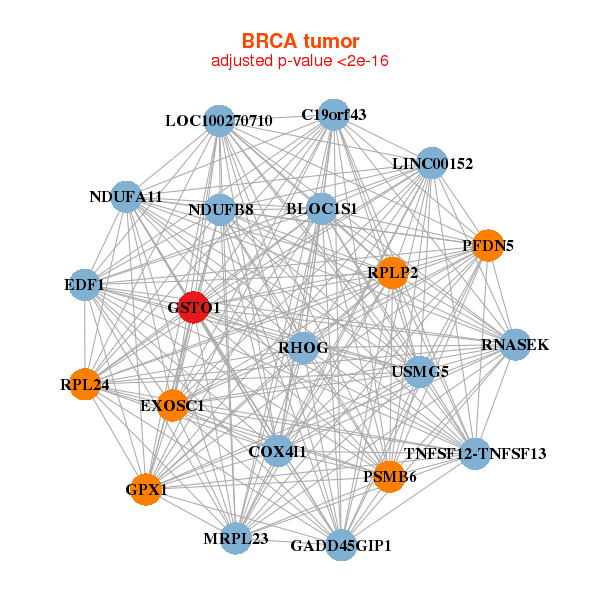
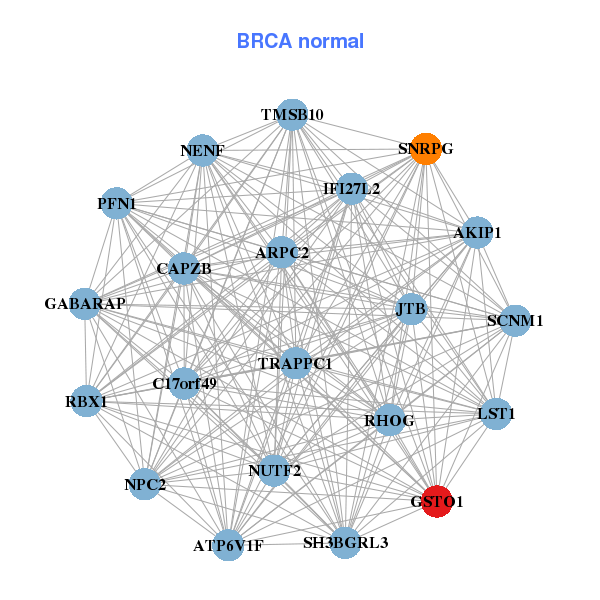
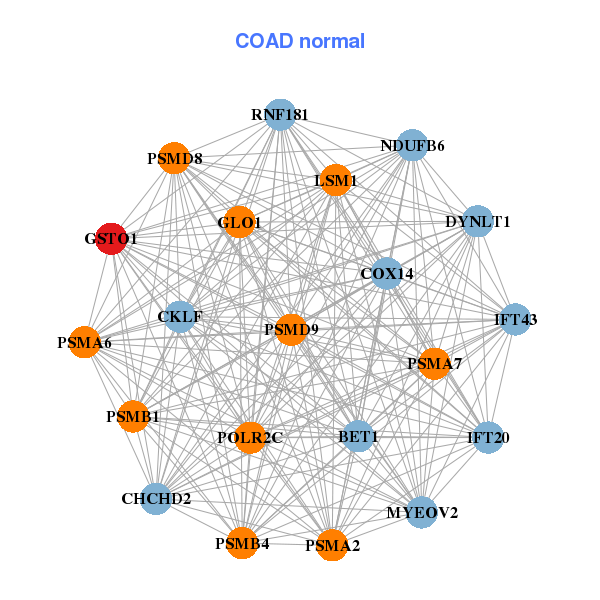
| * Co-Expression network figures were drawn using R package igraph. Only the top 20 genes with the highest correlations were shown. Red circle: input gene, orange circle: cell metabolism gene, sky circle: other gene |
: Open all plots for all cancer types
 |
| ||||
| BLOC1S1,C19orf43,COX4I1,EDF1,EXOSC1,GADD45GIP1,GPX1, GSTO1,LOC100270710,MRPL23,LINC00152,NDUFA11,NDUFB8,PFDN5, PSMB6,RHOG,RNASEK,RPL24,RPLP2,TNFSF12-TNFSF13,USMG5 | ARPC2,ATP6V1F,AKIP1,C17orf49,CAPZB,GABARAP,GSTO1, IFI27L2,JTB,LST1,NENF,NPC2,NUTF2,PFN1, RBX1,RHOG,SCNM1,SH3BGRL3,SNRPG,TMSB10,TRAPPC1 | ||||
 |
| ||||
| ASNA1,FAM204A,COX7A2,GADD45GIP1,GLRX3,GPX1,GSTO1, LSM2,MED31,MRPL43,MRPL54,MYEOV2,NDUFA11,NDUFA13, NDUFB7,NDUFB8,PFDN5,SNRPG,TIMM8B,TOMM22,VPS29 | BET1,COX14,IFT43,CHCHD2,CKLF,DYNLT1,GLO1, GSTO1,IFT20,LSM1,MYEOV2,NDUFB6,POLR2C,PSMA2, PSMA6,PSMA7,PSMB1,PSMB4,PSMD8,PSMD9,RNF181 |
| * Co-Expression network figures were drawn using R package igraph. Only the top 20 genes with the highest correlations were shown. Red circle: input gene, orange circle: cell metabolism gene, sky circle: other gene |
: Open all plots for all cancer types
| Top |
: Open all interacting genes' information including KEGG pathway for all interacting genes from DAVID
| Top |
| Pharmacological Information for GSTO1 |
| DB Category | DB Name | DB's ID and Url link |
| * Gene Centered Interaction Network. |
 |
| * Drug Centered Interaction Network. |
| DrugBank ID | Target Name | Drug Groups | Generic Name | Drug Centered Network | Drug Structure |
| DB00143 | glutathione S-transferase omega 1 | approved; nutraceutical | Glutathione |  |  |
| DB00515 | glutathione S-transferase omega 1 | approved | Cisplatin |  |  |
| DB01169 | glutathione S-transferase omega 1 | approved; investigational | Arsenic trioxide | 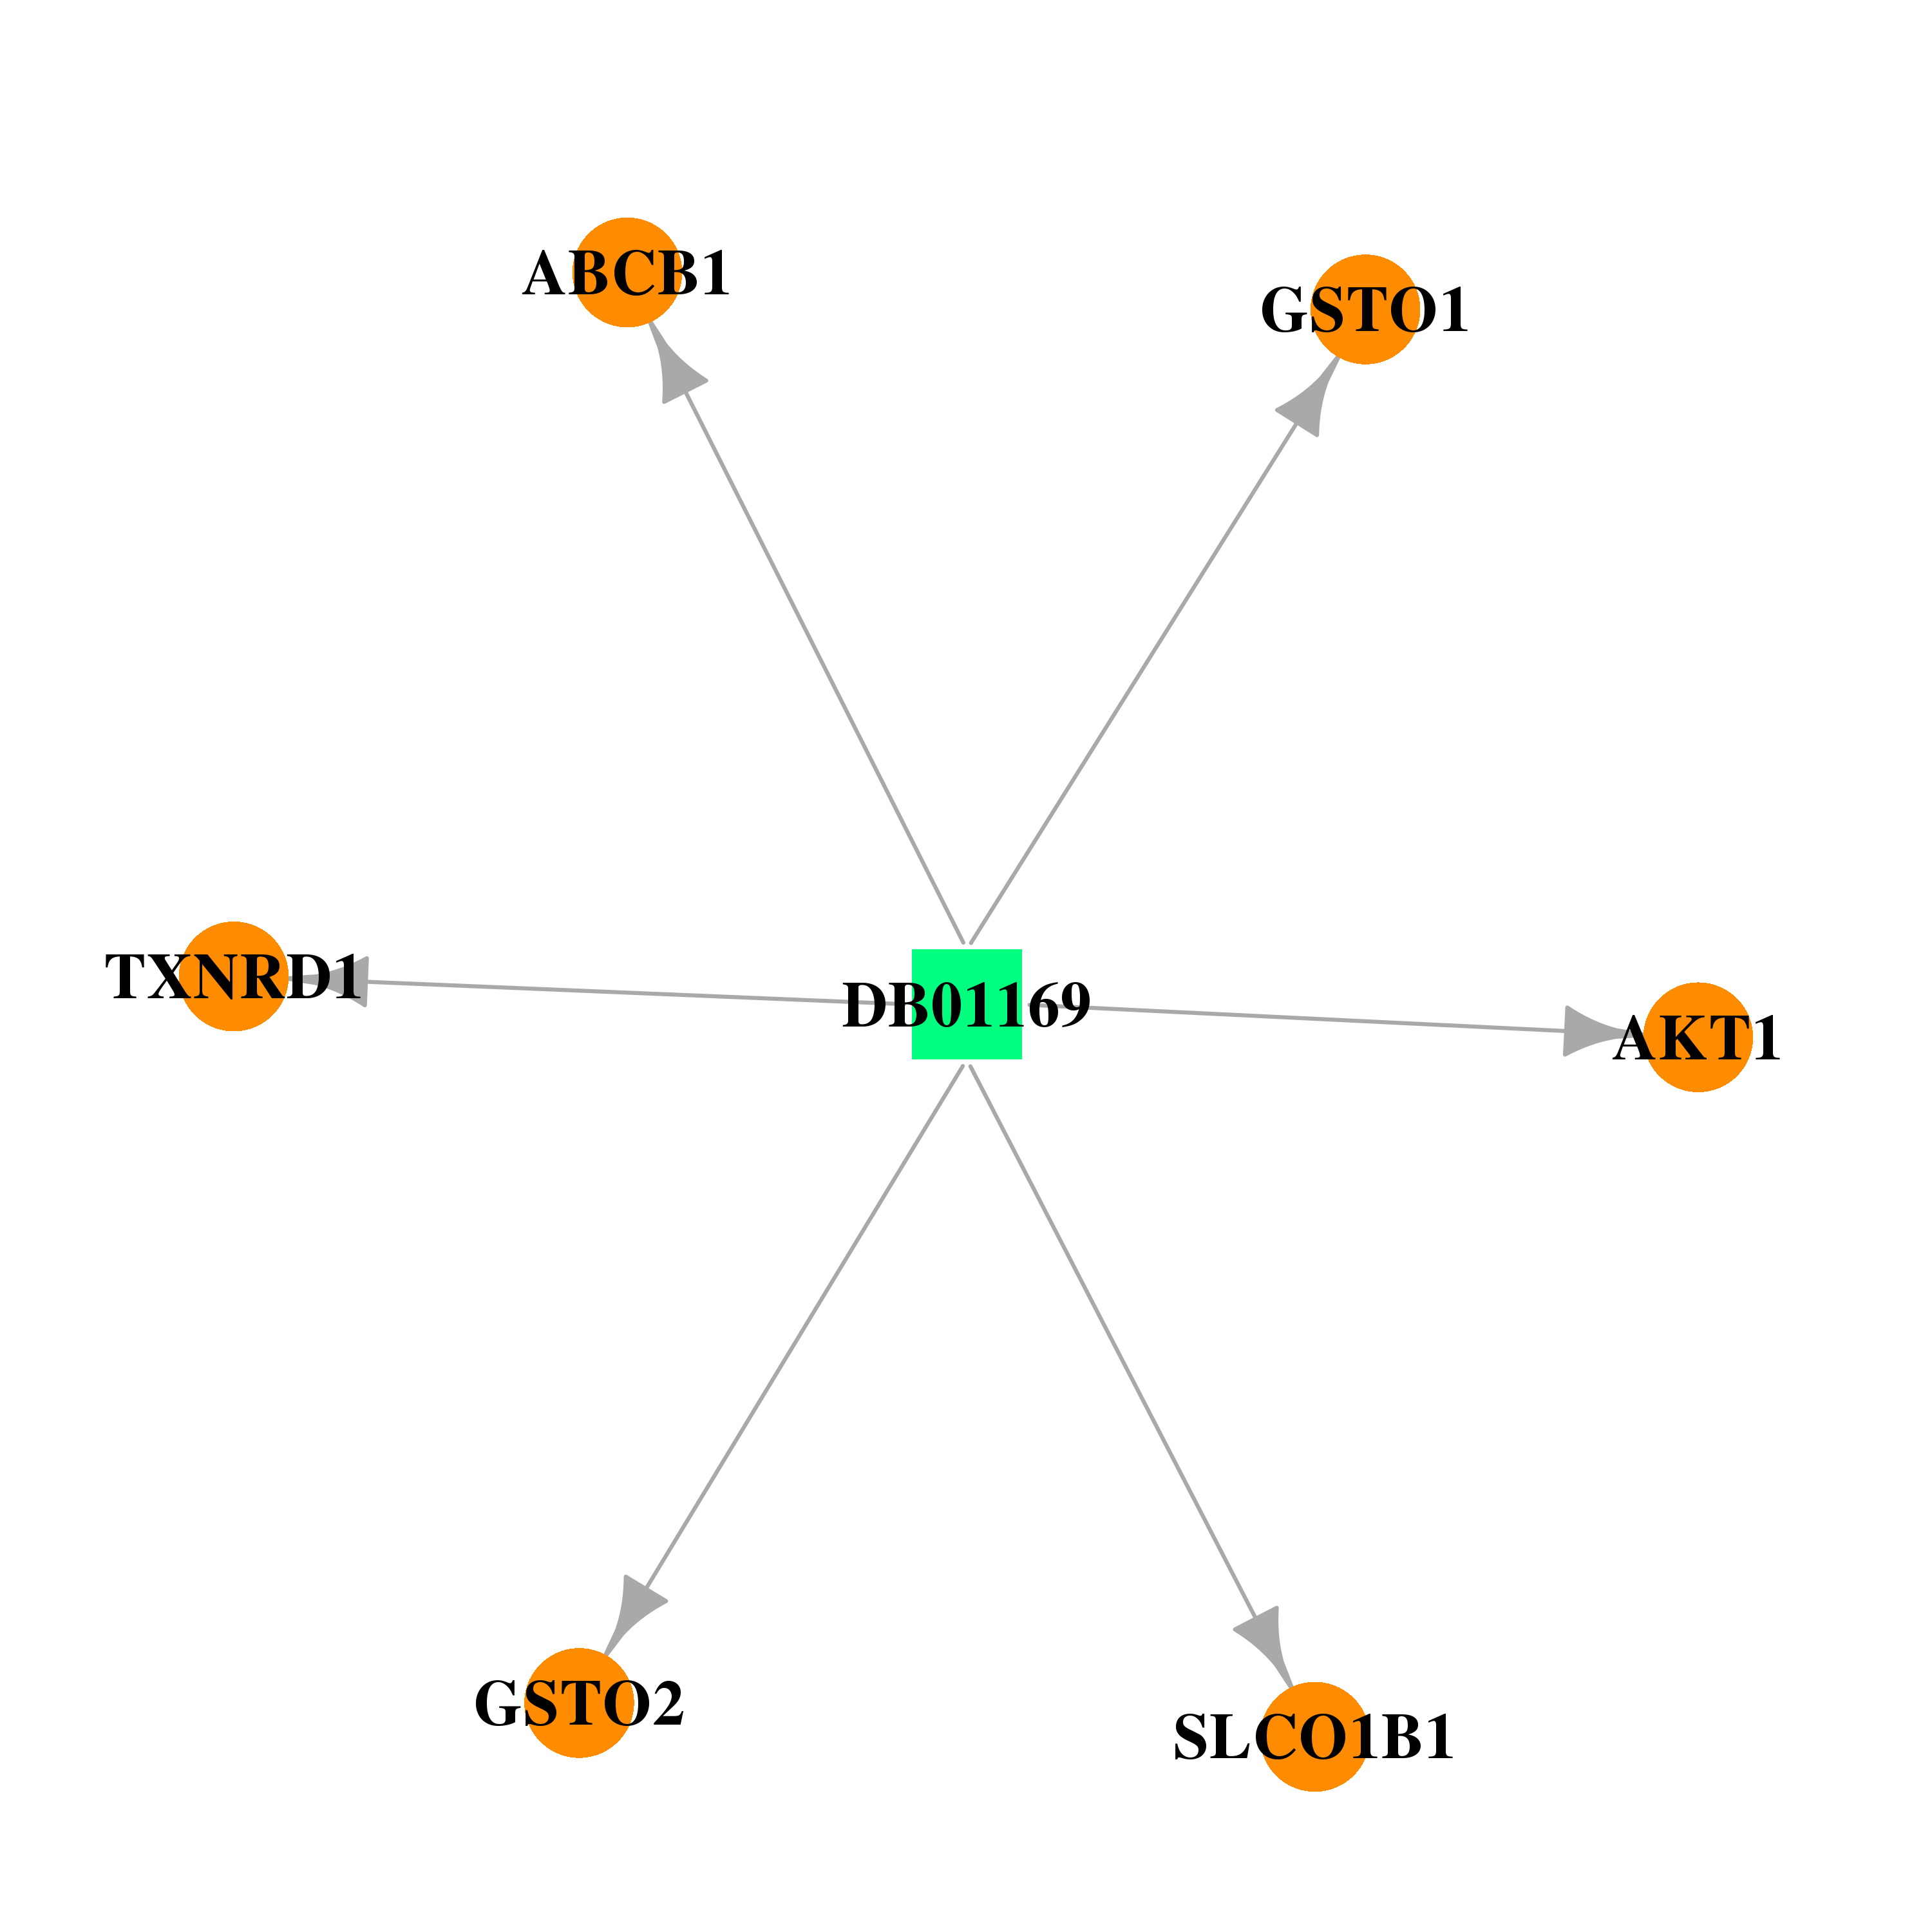 | 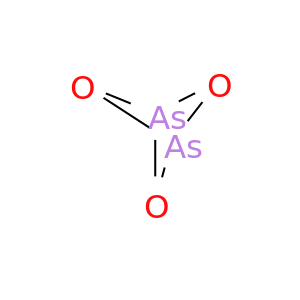 |
| Top |
| Cross referenced IDs for GSTO1 |
| * We obtained these cross-references from Uniprot database. It covers 150 different DBs, 18 categories. http://www.uniprot.org/help/cross_references_section |
: Open all cross reference information
|
Copyright © 2016-Present - The Univsersity of Texas Health Science Center at Houston @ |