|
||||||||||||||||||||||||||||||||||||||||||||||||||||||||||||||||||||||||||||||||||||||||||||||||||||||||||||||||||||||||||||||||||||||||||||||||||||||||||||||||||||||||||||||||||||||||||||||||||||||||||||||||||||||||||||||||||||||||||||||||||||||||||||||||||||||||||||||||||||||||||||||||||||||||||||||||||||||||||
| |
| Phenotypic Information (metabolism pathway, cancer, disease, phenome) |
| |
| |
| Gene-Gene Network Information: Co-Expression Network, Interacting Genes & KEGG |
| |
|


| Gene Summary for CD36 |
| Basic gene info. | Gene symbol | CD36 |
| Gene name | CD36 molecule (thrombospondin receptor) | |
| Synonyms | BDPLT10|CHDS7|FAT|GP3B|GP4|GPIV|PASIV|SCARB3 | |
| Cytomap | UCSC genome browser: 7q11.2 | |
| Genomic location | chr7 :80231503-80303734 | |
| Type of gene | protein-coding | |
| RefGenes | NM_000072.3, NM_001001547.2,NM_001001548.2,NM_001127443.1,NM_001127444.1, NM_001289908.1,NM_001289909.1,NM_001289911.1,NR_110501.1, | |
| Ensembl id | ENSG00000135218 | |
| Description | CD36 antigen (collagen type I receptor, thrombospondin receptor)GPIIIBPAS IVPAS-4 proteincluster determinant 36fatty acid translocaseglycoprotein IIIbleukocyte differentiation antigen CD36platelet glycoprotein 4platelet glycoprotein IVscavenger | |
| Modification date | 20141222 | |
| dbXrefs | MIM : 173510 | |
| HGNC : HGNC | ||
| Ensembl : ENSG00000135218 | ||
| HPRD : 01430 | ||
| Vega : OTTHUMG00000155383 | ||
| Protein | UniProt: P16671 go to UniProt's Cross Reference DB Table | |
| Expression | CleanEX: HS_CD36 | |
| BioGPS: 948 | ||
| Gene Expression Atlas: ENSG00000135218 | ||
| The Human Protein Atlas: ENSG00000135218 | ||
| Pathway | NCI Pathway Interaction Database: CD36 | |
| KEGG: CD36 | ||
| REACTOME: CD36 | ||
| ConsensusPathDB | ||
| Pathway Commons: CD36 | ||
| Metabolism | MetaCyc: CD36 | |
| HUMANCyc: CD36 | ||
| Regulation | Ensembl's Regulation: ENSG00000135218 | |
| miRBase: chr7 :80,231,503-80,303,734 | ||
| TargetScan: NM_000072 | ||
| cisRED: ENSG00000135218 | ||
| Context | iHOP: CD36 | |
| cancer metabolism search in PubMed: CD36 | ||
| UCL Cancer Institute: CD36 | ||
| Assigned class in ccmGDB | A - This gene has a literature evidence and it belongs to cancer gene. | |
| References showing role of CD36 in cancer cell metabolism | 1. DeFilippis RA, Chang H, Dumont N, Rabban JT, Chen YY, et al. (2012) CD36 repression activates a multicellular stromal program shared by high mammographic density and tumor tissues. Cancer Discov 2: 826-839. doi: 10.1158/2159-8290.CD-12-0107. pmid: 3457705. go to article 2. Hale JS, Otvos B, Sinyuk M, Alvarado AG, Hitomi M, et al. (2014) Cancer stem cell-specific scavenger receptor 36 drives glioblastoma progression. Stem Cells 32: 1746-1758. doi: 10.1002/stem.1716. pmid: 4063873. go to article 3. Achiwa Y, Hasegawa K, Udagawa Y (2013) Effect of ursolic acid on MAPK in cyclin D1 signaling and RING-type E3 ligase (SCF E3s) in two endometrial cancer cell lines. Nutr Cancer 65: 1026-1033. doi: 10.1080/01635581.2013.810292. go to article | |
| Top |
| Phenotypic Information for CD36(metabolism pathway, cancer, disease, phenome) |
| Cancer | CGAP: CD36 |
| Familial Cancer Database: CD36 | |
| * This gene is included in those cancer gene databases. |
|
|
|
|
|
| . | ||||||||||||||||||||||||||||||||||||||||||||||||||||||||||||||||||||||||||||||||||||||||||||||||||||||||||||||||||||||||||||||||||||||||||||||||||||||||||||||||||||||||||||||||||||||||||||||||||||||||||||||||||||||||||||||||||||||||||||||||||||||||||||||||||||||||||||||||||||||||||||||||||||||||||||||||||||
Oncogene 1 | Significant driver gene in | |||||||||||||||||||||||||||||||||||||||||||||||||||||||||||||||||||||||||||||||||||||||||||||||||||||||||||||||||||||||||||||||||||||||||||||||||||||||||||||||||||||||||||||||||||||||||||||||||||||||||||||||||||||||||||||||||||||||||||||||||||||||||||||||||||||||||||||||||||||||||||||||||||||||||||||||||||||||||
| cf) number; DB name 1 Oncogene; http://nar.oxfordjournals.org/content/35/suppl_1/D721.long, 2 Tumor Suppressor gene; https://bioinfo.uth.edu/TSGene/, 3 Cancer Gene Census; http://www.nature.com/nrc/journal/v4/n3/abs/nrc1299.html, 4 CancerGenes; http://nar.oxfordjournals.org/content/35/suppl_1/D721.long, 5 Network of Cancer Gene; http://ncg.kcl.ac.uk/index.php, 1Therapeutic Vulnerabilities in Cancer; http://cbio.mskcc.org/cancergenomics/statius/ |
| REACTOME_METABOLISM_OF_LIPIDS_AND_LIPOPROTEINS | |
| OMIM | 173510; gene. 173510; gene. 248310; phenotype. 248310; phenotype. 608404; phenotype. 608404; phenotype. 610938; phenotype. 610938; phenotype. 611162; phenotype. 611162; phenotype. |
| Orphanet | |
| Disease | KEGG Disease: CD36 |
| MedGen: CD36 (Human Medical Genetics with Condition) | |
| ClinVar: CD36 | |
| Phenotype | MGI: CD36 (International Mouse Phenotyping Consortium) |
| PhenomicDB: CD36 | |
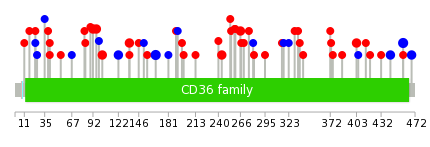
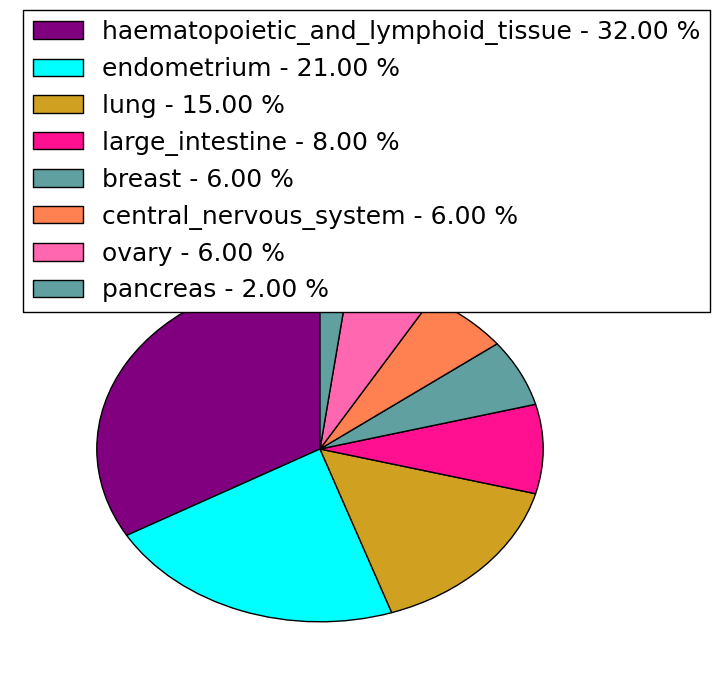
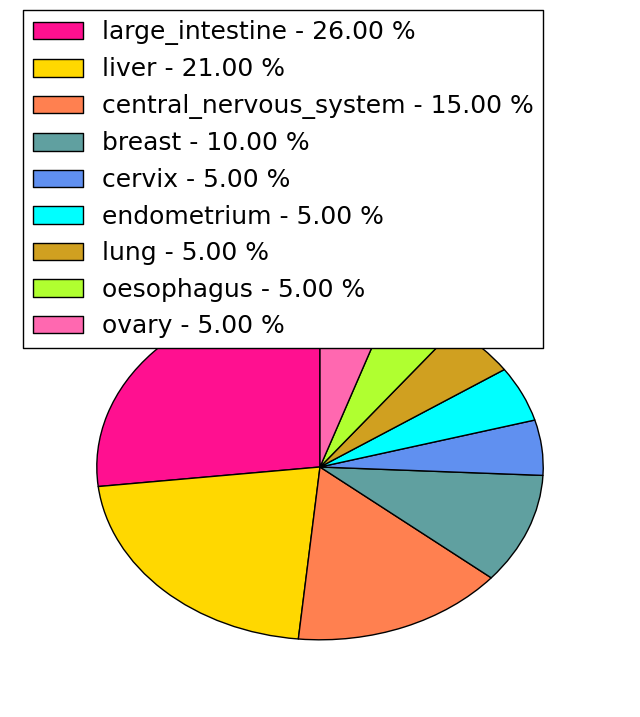
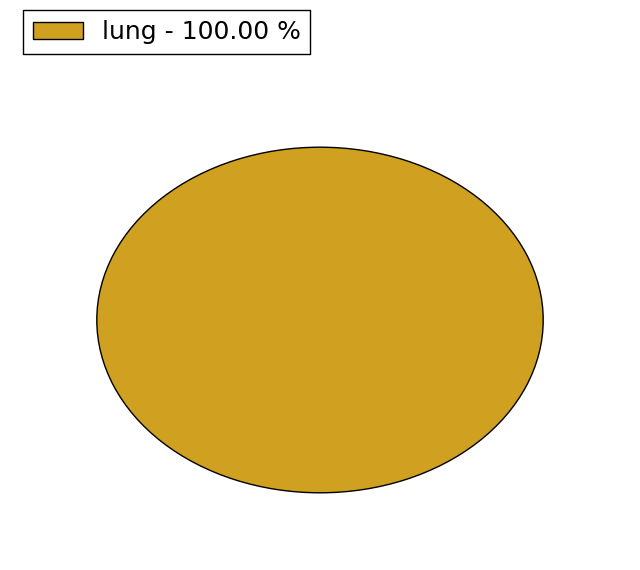
| Mutations for CD36 |
| * Under tables are showing count per each tissue to give us broad intuition about tissue specific mutation patterns.You can go to the detailed page for each mutation database's web site. |
| - Statistics for Tissue and Mutation type | Top |
 |
| - For Inter-chromosomal Variations |
| There's no inter-chromosomal structural variation. |
| - For Intra-chromosomal Variations |
| * Intra-chromosomal variantions includes 'intrachromosomal amplicon to amplicon', 'intrachromosomal amplicon to non-amplified dna', 'intrachromosomal deletion', 'intrachromosomal fold-back inversion', 'intrachromosomal inversion', 'intrachromosomal tandem duplication', 'Intrachromosomal unknown type', 'intrachromosomal with inverted orientation', 'intrachromosomal with non-inverted orientation'. |
 |
| Sample | Symbol_a | Chr_a | Start_a | End_a | Symbol_b | Chr_b | Start_b | End_b |
| ovary | CD36 | chr7 | 80257950 | 80257970 | CD36 | chr7 | 80276911 | 80276931 |
| cf) Tissue number; Tissue name (1;Breast, 2;Central_nervous_system, 3;Haematopoietic_and_lymphoid_tissue, 4;Large_intestine, 5;Liver, 6;Lung, 7;Ovary, 8;Pancreas, 9;Prostate, 10;Skin, 11;Soft_tissue, 12;Upper_aerodigestive_tract) |
| * From mRNA Sanger sequences, Chitars2.0 arranged chimeric transcripts. This table shows CD36 related fusion information. |
| ID | Head Gene | Tail Gene | Accession | Gene_a | qStart_a | qEnd_a | Chromosome_a | tStart_a | tEnd_a | Gene_a | qStart_a | qEnd_a | Chromosome_a | tStart_a | tEnd_a |
| BF359477 | CD36 | 40 | 149 | 7 | 80224003 | 80224112 | TRANK1 | 135 | 154 | 3 | 36870216 | 36870235 | |
| DR979449 | CD36 | 1 | 103 | 7 | 80289884 | 80289988 | DCN | 98 | 148 | 12 | 91539474 | 91539530 | |
| F12469 | NCOA3 | 1 | 114 | 20 | 46132899 | 46133012 | CD36 | 112 | 152 | 7 | 80125707 | 80125747 | |
| Top |
| Mutation type/ Tissue ID | brca | cns | cerv | endome | haematopo | kidn | Lintest | liver | lung | ns | ovary | pancre | prost | skin | stoma | thyro | urina | |||
| Total # sample | 2 | |||||||||||||||||||
| GAIN (# sample) | 2 | |||||||||||||||||||
| LOSS (# sample) |
| cf) Tissue ID; Tissue type (1; Breast, 2; Central_nervous_system, 3; Cervix, 4; Endometrium, 5; Haematopoietic_and_lymphoid_tissue, 6; Kidney, 7; Large_intestine, 8; Liver, 9; Lung, 10; NS, 11; Ovary, 12; Pancreas, 13; Prostate, 14; Skin, 15; Stomach, 16; Thyroid, 17; Urinary_tract) |
| Top |
|
 |
| Top |
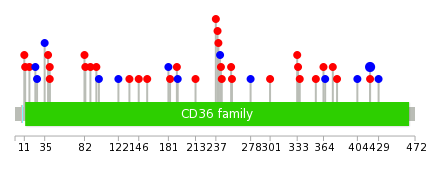
| Stat. for Non-Synonymous SNVs (# total SNVs=46) | (# total SNVs=19) |
 |  |
(# total SNVs=1) | (# total SNVs=0) |
 |
| Top |
| * When you move the cursor on each content, you can see more deailed mutation information on the Tooltip. Those are primary_site,primary_histology,mutation(aa),pubmedID. |
| GRCh37 position | Mutation(aa) | Unique sampleID count |
| chr7:80292374-80292374 | p.K166K | 3 |
| chr7:80303418-80303418 | p.A458A | 3 |
| chr7:80286010-80286010 | p.T92M | 2 |
| chr7:80303448-80303448 | p.S468S | 2 |
| chr7:80290383-80290383 | p.R96C | 2 |
| chr7:80299318-80299318 | p.F266L | 2 |
| chr7:80302680-80302680 | p.K403N | 2 |
| chr7:80290405-80290405 | p.V103A | 2 |
| chr7:80290463-80290463 | p.F122F | 2 |
| chr7:80290500-80290500 | p.F135L | 2 |
| Top |
|
 |
| Point Mutation/ Tissue ID | 1 | 2 | 3 | 4 | 5 | 6 | 7 | 8 | 9 | 10 | 11 | 12 | 13 | 14 | 15 | 16 | 17 | 18 | 19 | 20 |
| # sample | 1 | 2 | 1 | 6 | 3 | 3 | 2 | 3 | 8 | 4 | 9 | |||||||||
| # mutation | 1 | 2 | 1 | 6 | 3 | 4 | 2 | 3 | 8 | 4 | 10 | |||||||||
| nonsynonymous SNV | 1 | 1 | 3 | 1 | 4 | 1 | 2 | 4 | 3 | 9 | ||||||||||
| synonymous SNV | 1 | 1 | 3 | 2 | 1 | 1 | 4 | 1 | 1 |
| cf) Tissue ID; Tissue type (1; BLCA[Bladder Urothelial Carcinoma], 2; BRCA[Breast invasive carcinoma], 3; CESC[Cervical squamous cell carcinoma and endocervical adenocarcinoma], 4; COAD[Colon adenocarcinoma], 5; GBM[Glioblastoma multiforme], 6; Glioma Low Grade, 7; HNSC[Head and Neck squamous cell carcinoma], 8; KICH[Kidney Chromophobe], 9; KIRC[Kidney renal clear cell carcinoma], 10; KIRP[Kidney renal papillary cell carcinoma], 11; LAML[Acute Myeloid Leukemia], 12; LUAD[Lung adenocarcinoma], 13; LUSC[Lung squamous cell carcinoma], 14; OV[Ovarian serous cystadenocarcinoma ], 15; PAAD[Pancreatic adenocarcinoma], 16; PRAD[Prostate adenocarcinoma], 17; SKCM[Skin Cutaneous Melanoma], 18:STAD[Stomach adenocarcinoma], 19:THCA[Thyroid carcinoma], 20:UCEC[Uterine Corpus Endometrial Carcinoma]) |
| Top |
| * We represented just top 10 SNVs. When you move the cursor on each content, you can see more deailed mutation information on the Tooltip. Those are primary_site, primary_histology, mutation(aa), pubmedID. |
| Genomic Position | Mutation(aa) | Unique sampleID count |
| chr7:80303418 | p.A419A,CD36 | 3 |
| chr7:80276105 | p.G24G,CD36 | 1 |
| chr7:80301348 | p.R183K,CD36 | 1 |
| chr7:80290394 | p.P336H,CD36 | 1 |
| chr7:80295776 | p.L26L,CD36 | 1 |
| chr7:80276128 | p.P191Q,CD36 | 1 |
| chr7:80301355 | p.K355R,CD36 | 1 |
| chr7:80290463 | p.Q35Q,CD36 | 1 |
| chr7:80295787 | p.Y192Y,CD36 | 1 |
| chr7:80276132 | p.K364N,CD36 | 1 |
| * Copy number data were extracted from TCGA using R package TCGA-Assembler. The URLs of all public data files on TCGA DCC data server were gathered on Jan-05-2015. Function ProcessCNAData in TCGA-Assembler package was used to obtain gene-level copy number value which is calculated as the average copy number of the genomic region of a gene. |
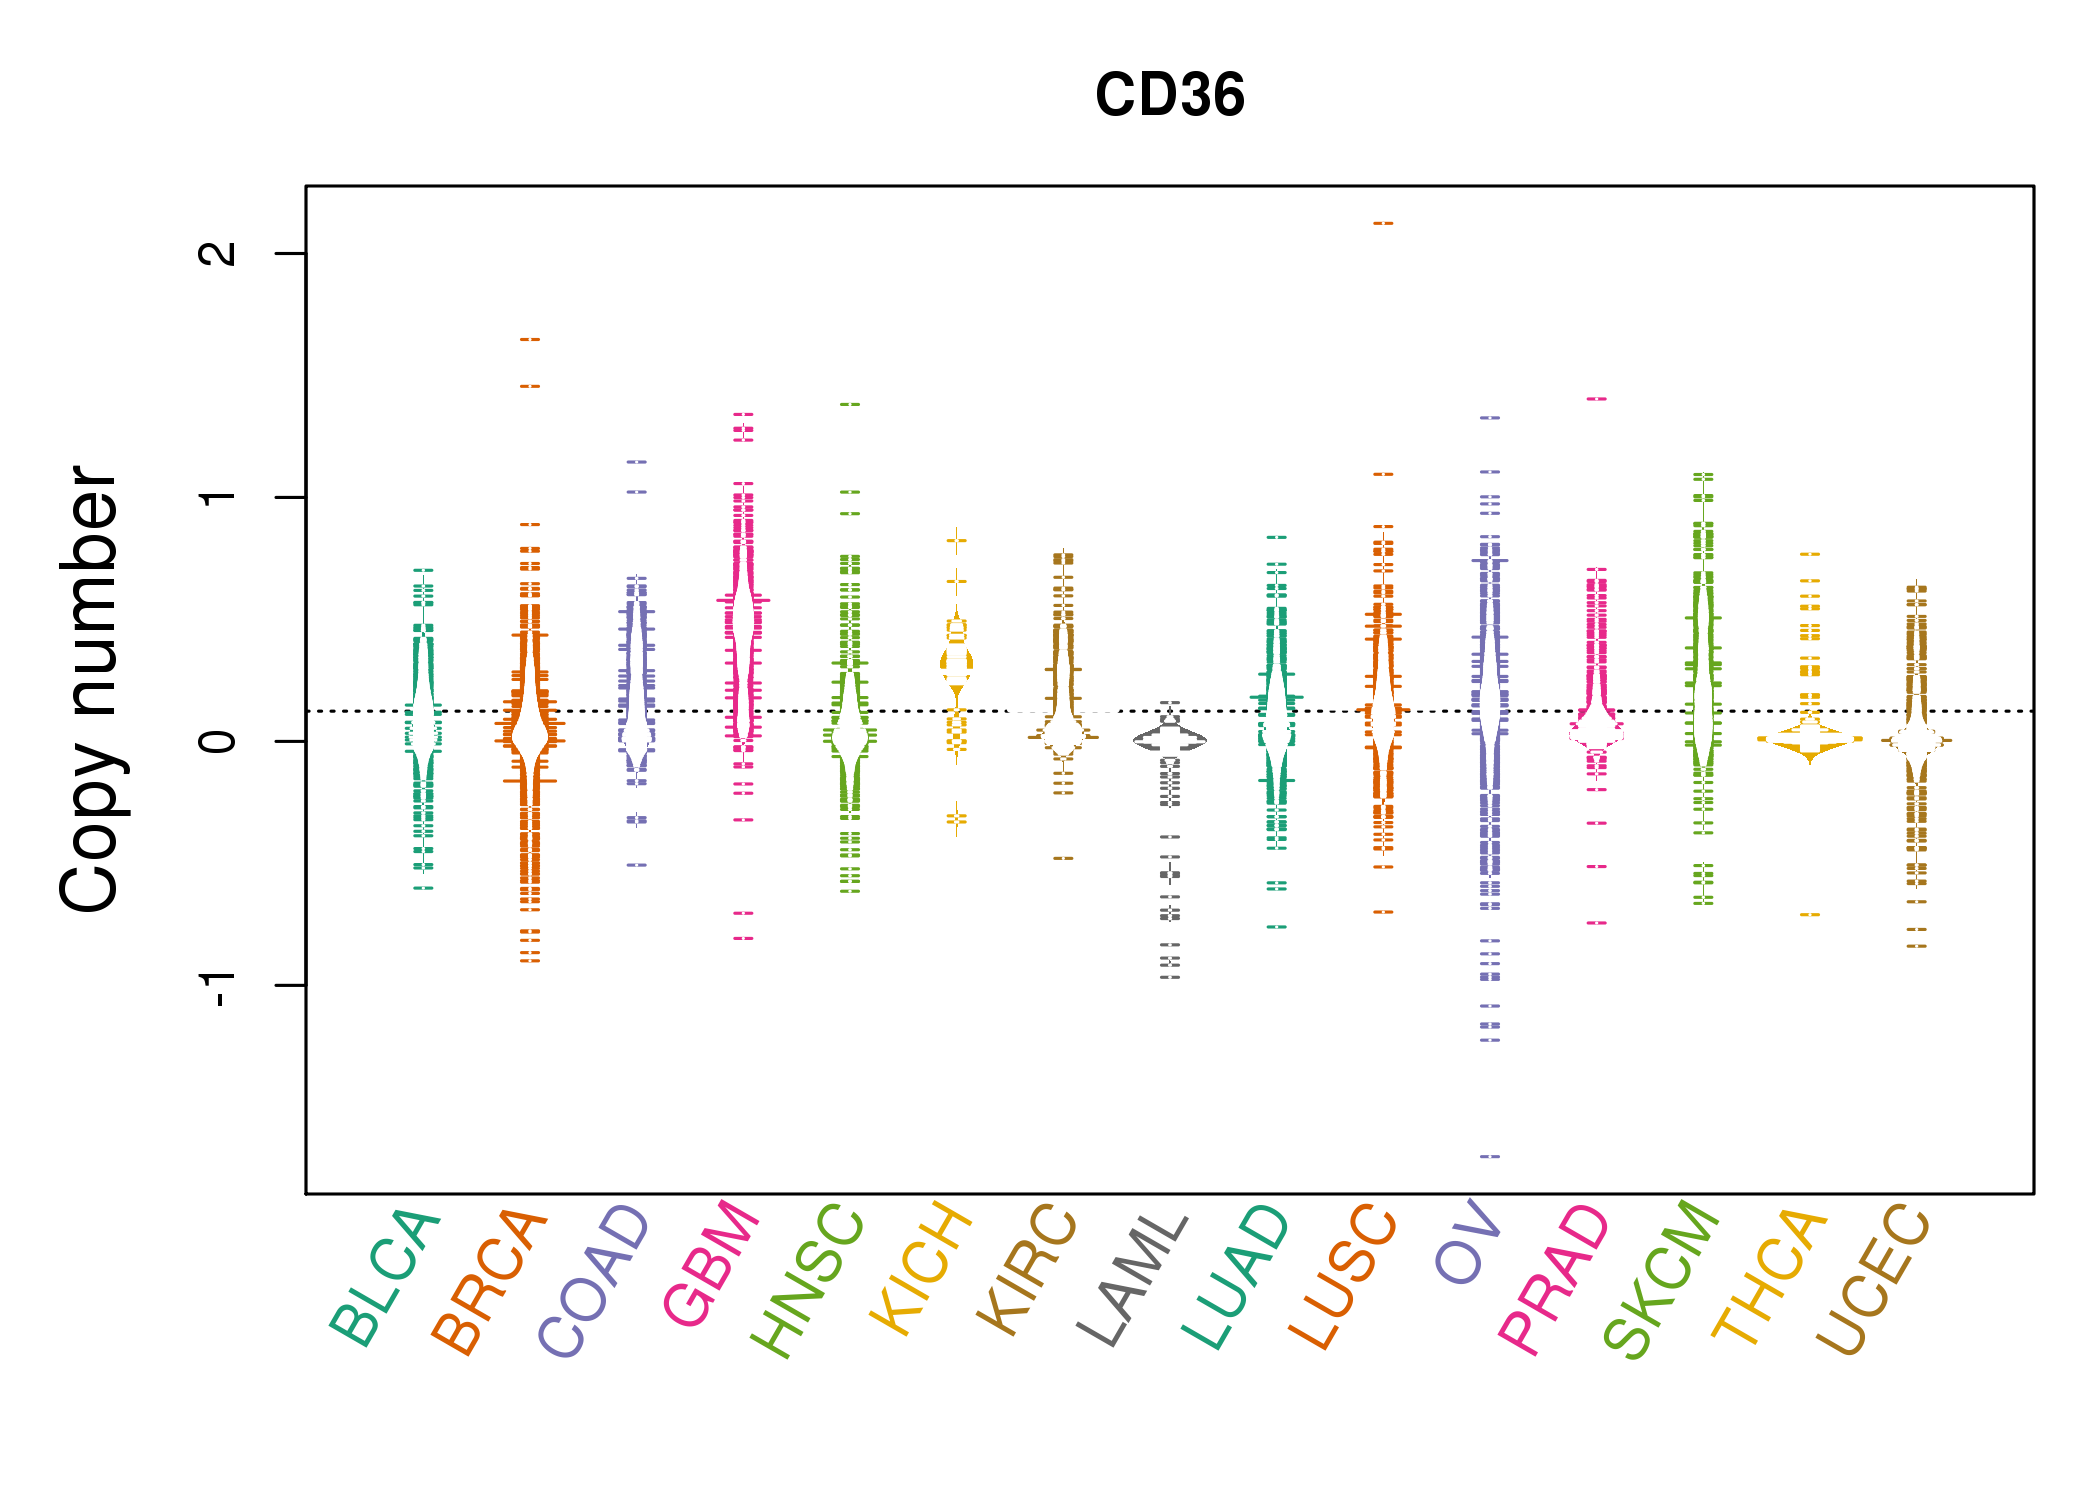 |
| cf) Tissue ID[Tissue type]: BLCA[Bladder Urothelial Carcinoma], BRCA[Breast invasive carcinoma], CESC[Cervical squamous cell carcinoma and endocervical adenocarcinoma], COAD[Colon adenocarcinoma], GBM[Glioblastoma multiforme], Glioma Low Grade, HNSC[Head and Neck squamous cell carcinoma], KICH[Kidney Chromophobe], KIRC[Kidney renal clear cell carcinoma], KIRP[Kidney renal papillary cell carcinoma], LAML[Acute Myeloid Leukemia], LUAD[Lung adenocarcinoma], LUSC[Lung squamous cell carcinoma], OV[Ovarian serous cystadenocarcinoma ], PAAD[Pancreatic adenocarcinoma], PRAD[Prostate adenocarcinoma], SKCM[Skin Cutaneous Melanoma], STAD[Stomach adenocarcinoma], THCA[Thyroid carcinoma], UCEC[Uterine Corpus Endometrial Carcinoma] |
| Top |
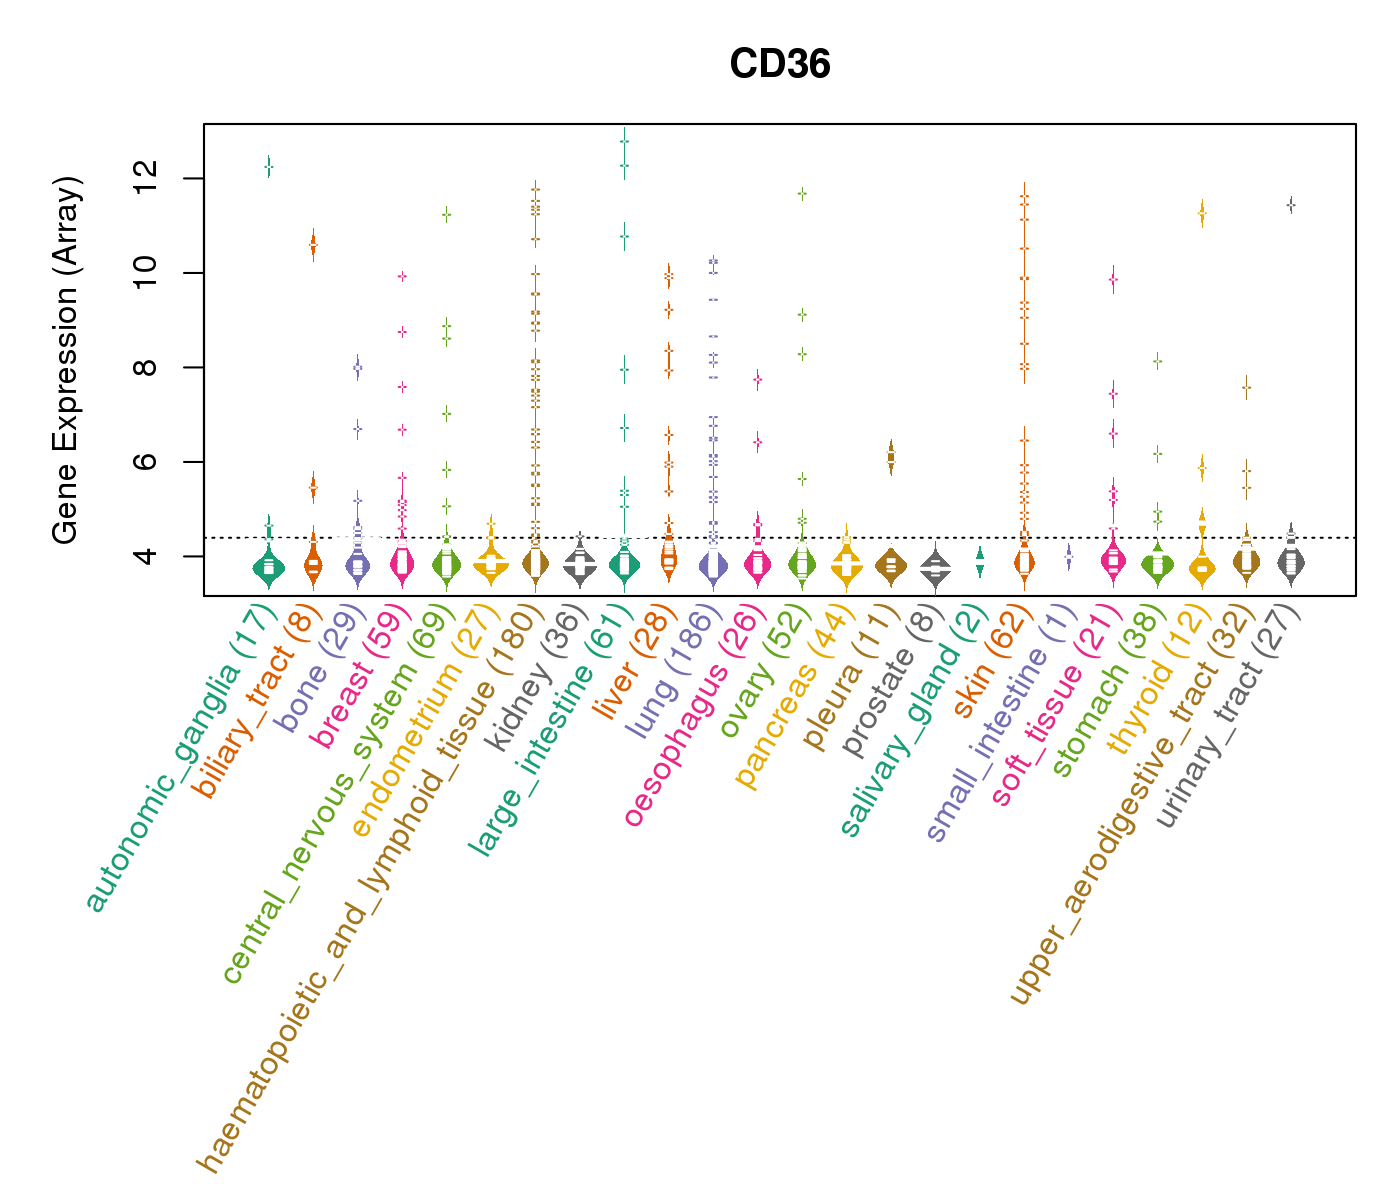
| Gene Expression for CD36 |
| * CCLE gene expression data were extracted from CCLE_Expression_Entrez_2012-10-18.res: Gene-centric RMA-normalized mRNA expression data. |
 |
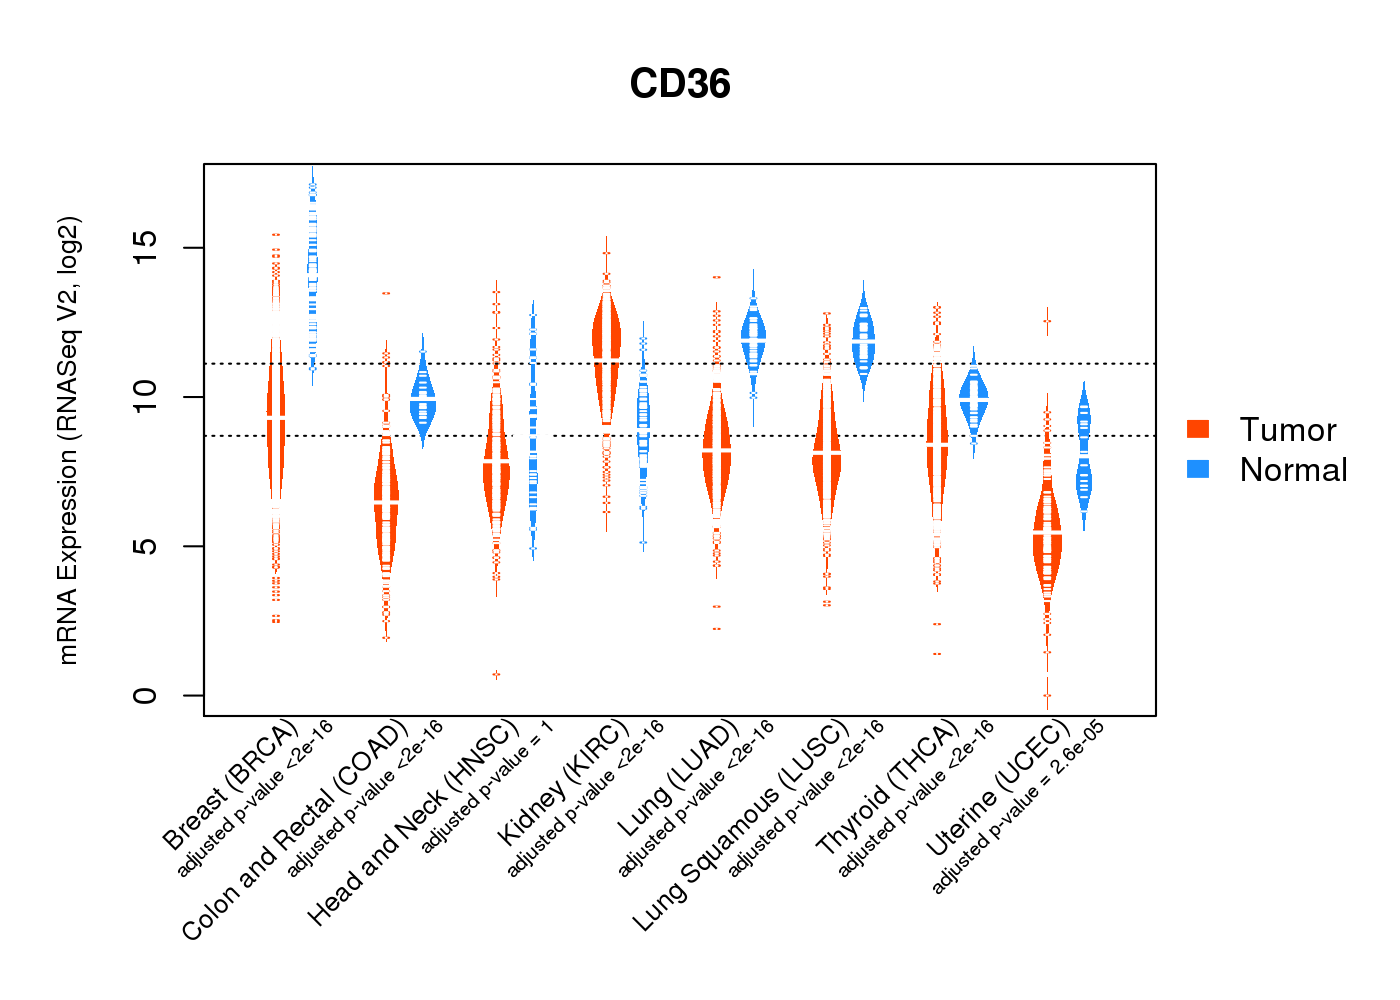
| * Normalized gene expression data of RNASeqV2 was extracted from TCGA using R package TCGA-Assembler. The URLs of all public data files on TCGA DCC data server were gathered at Jan-05-2015. Only eight cancer types have enough normal control samples for differential expression analysis. (t test, adjusted p<0.05 (using Benjamini-Hochberg FDR)) |
 |
| Top |
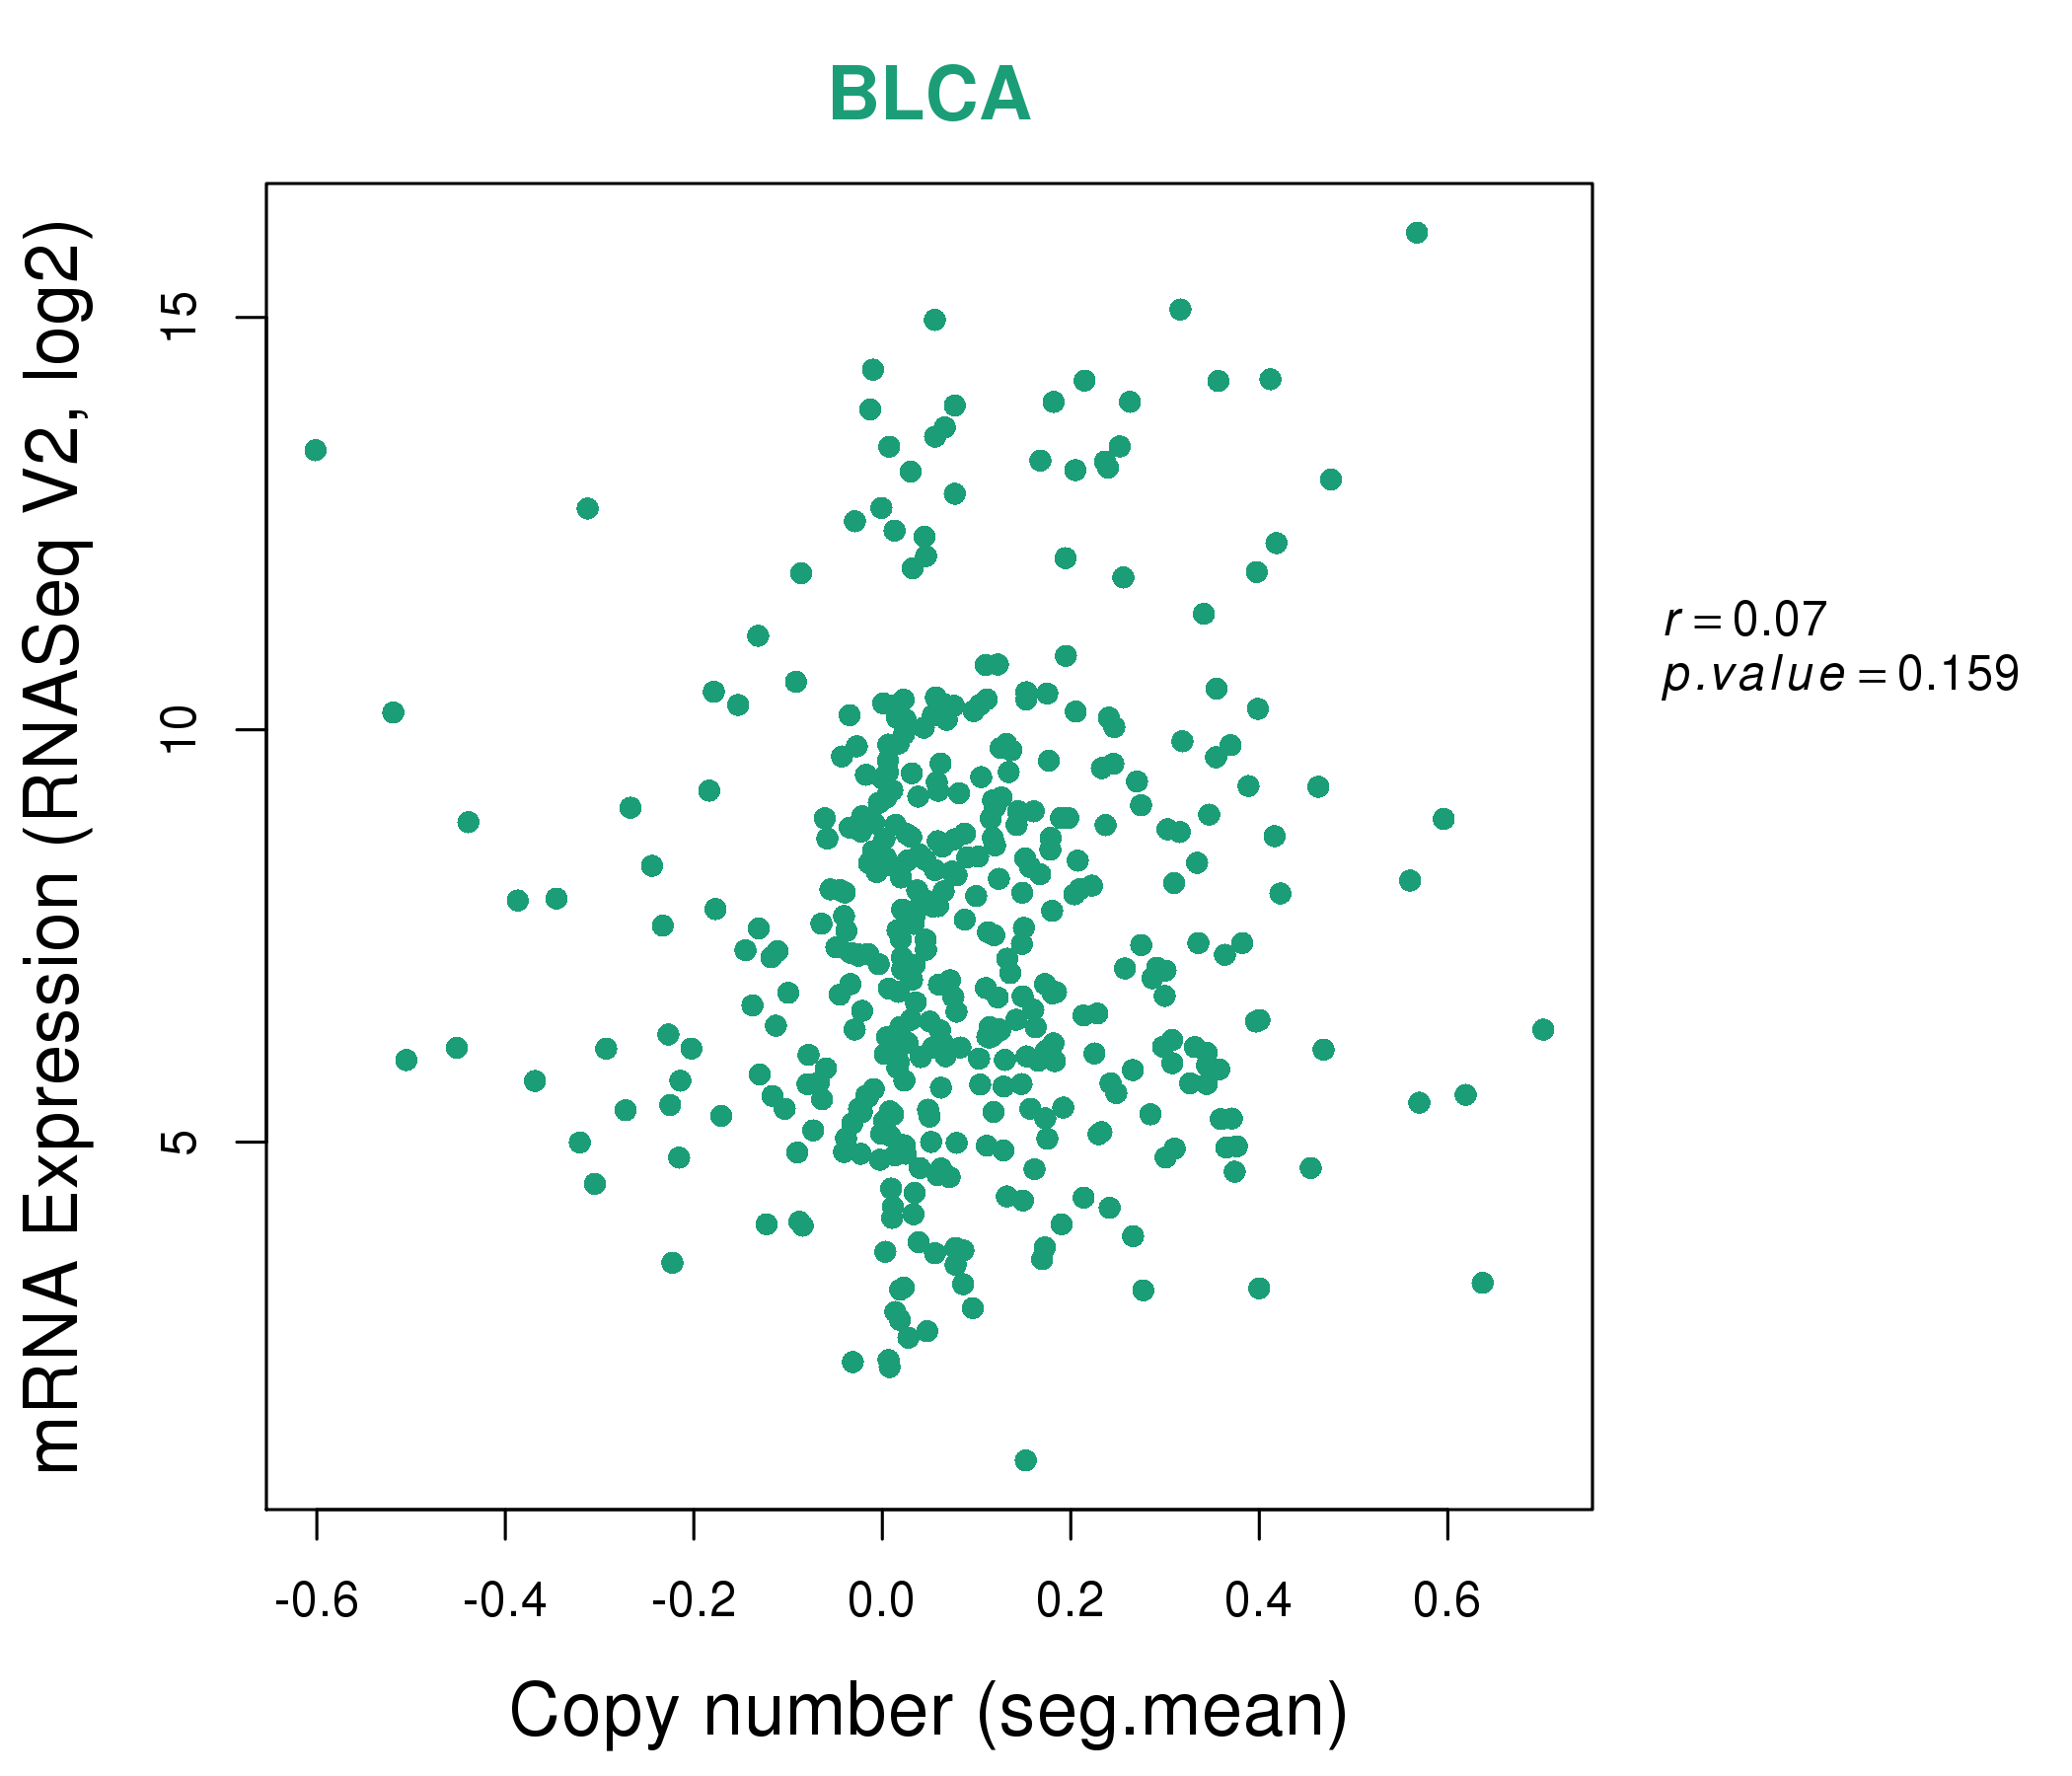
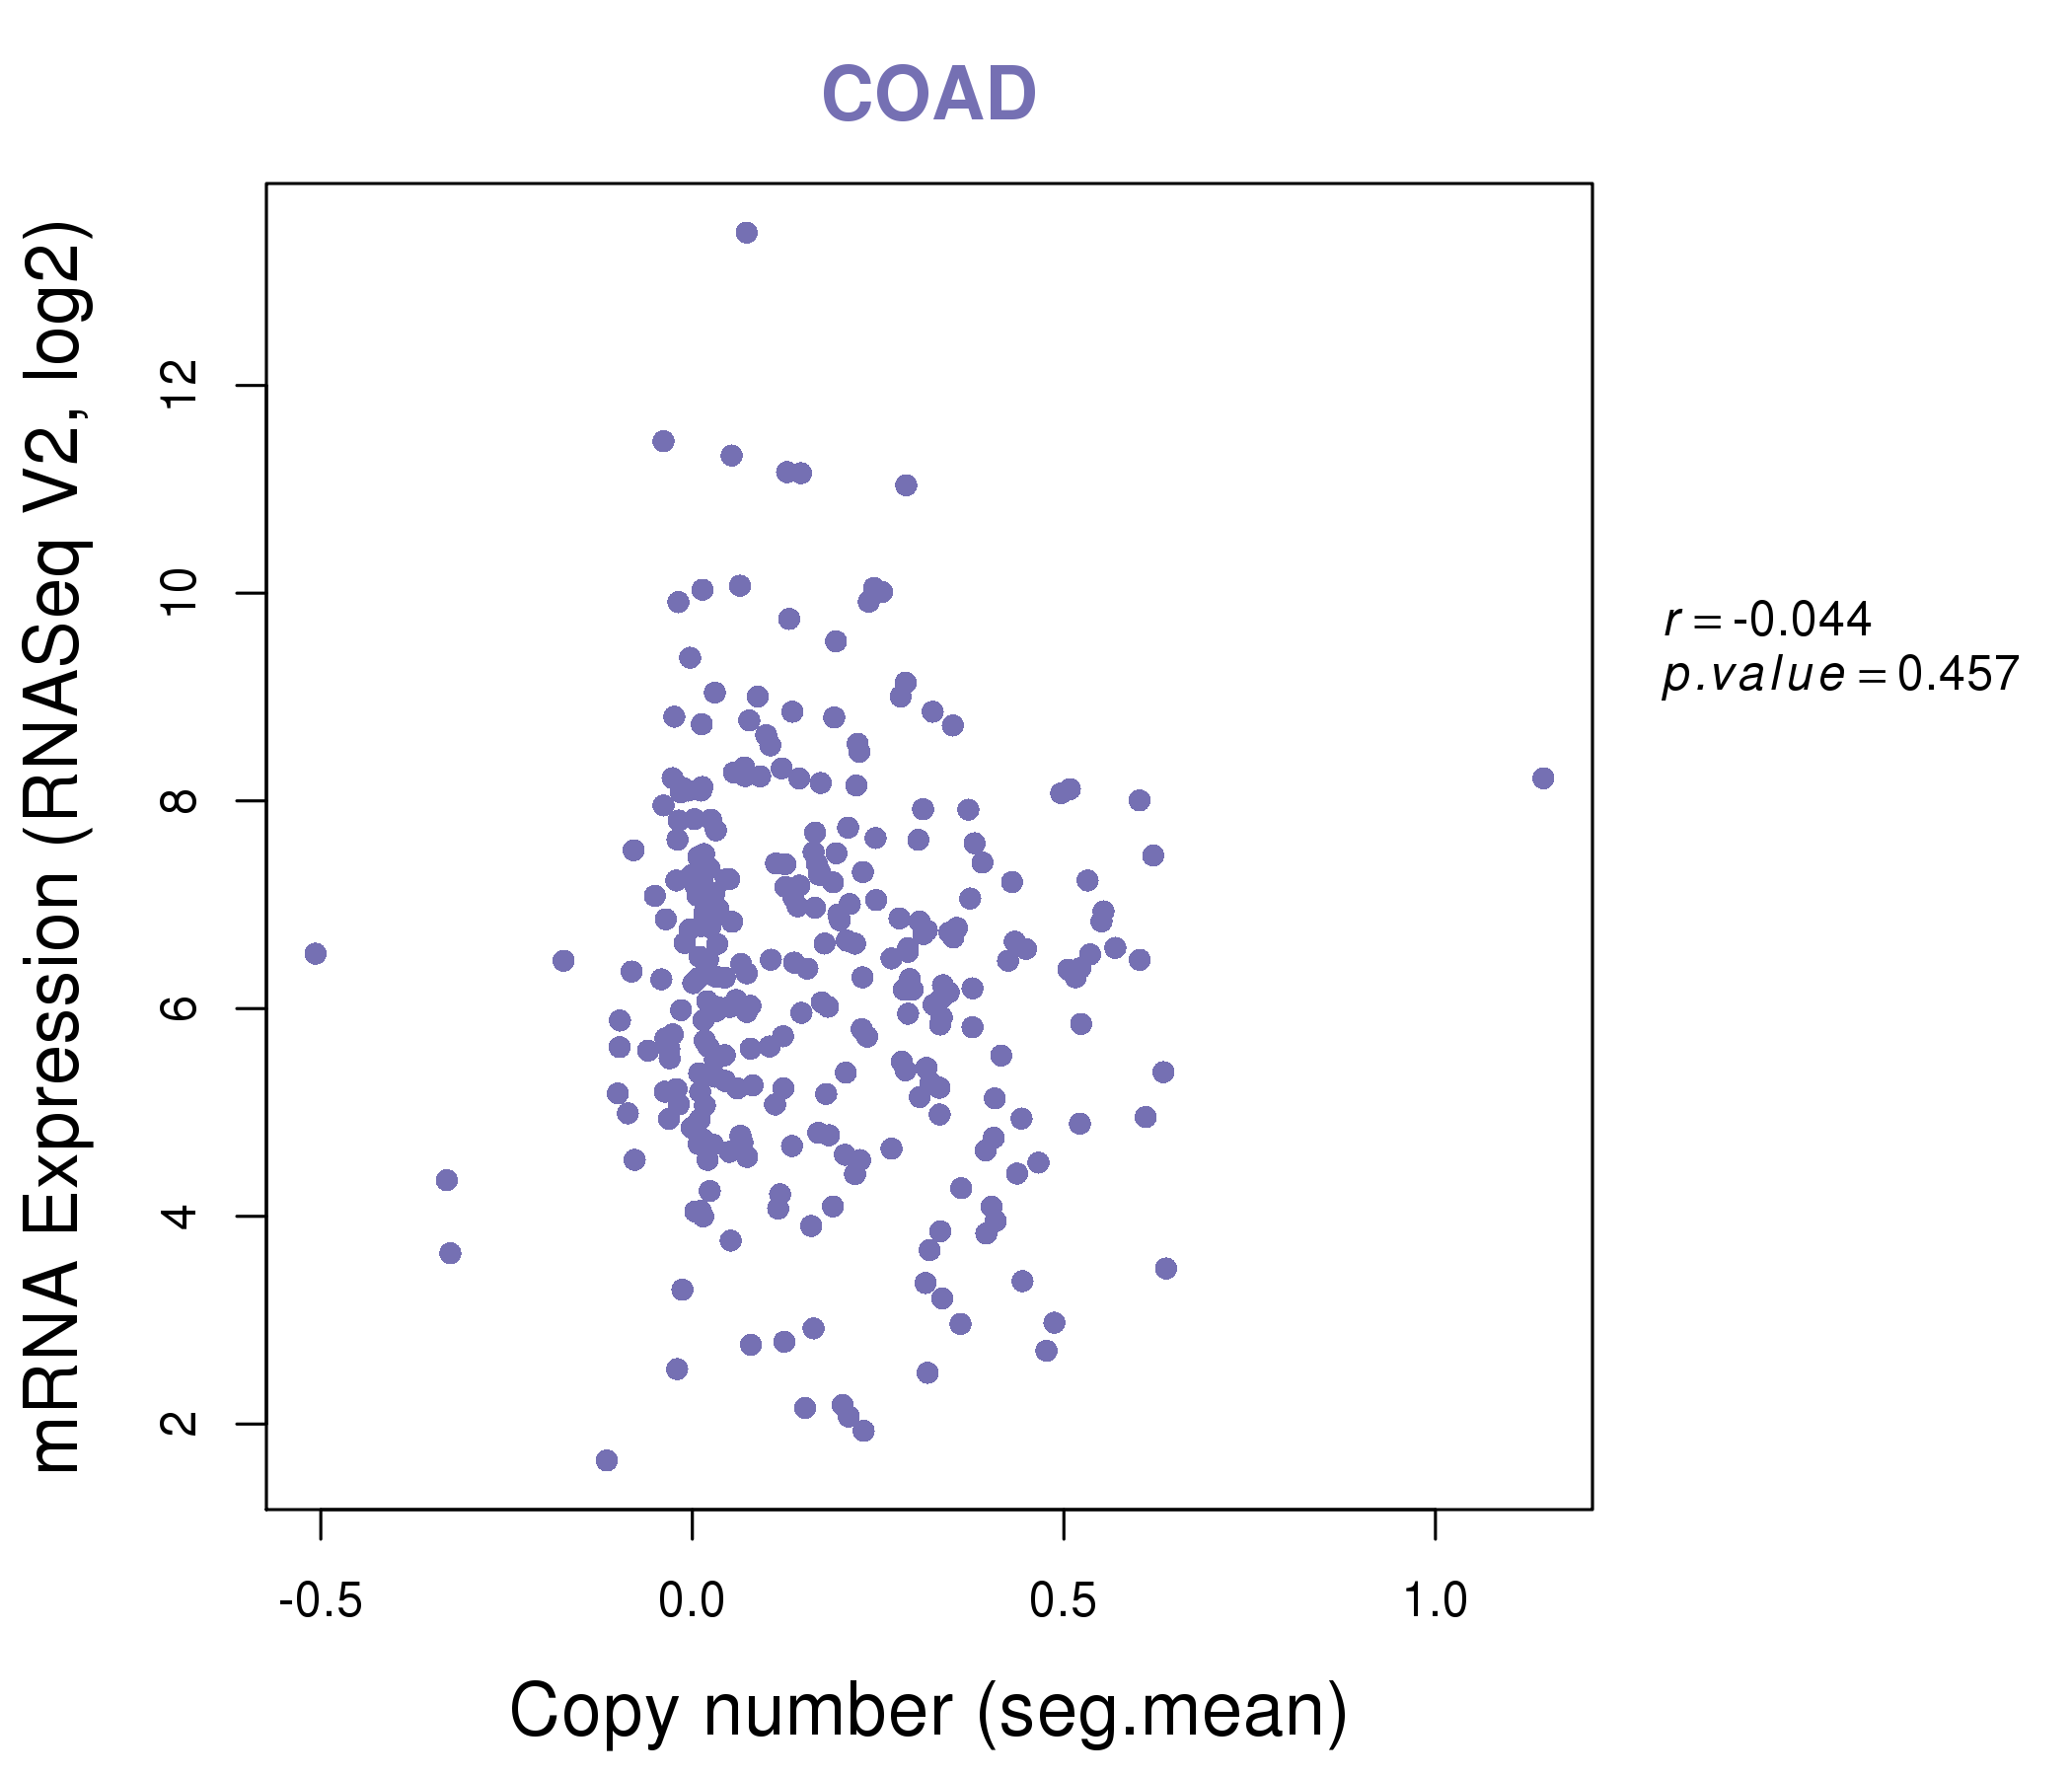
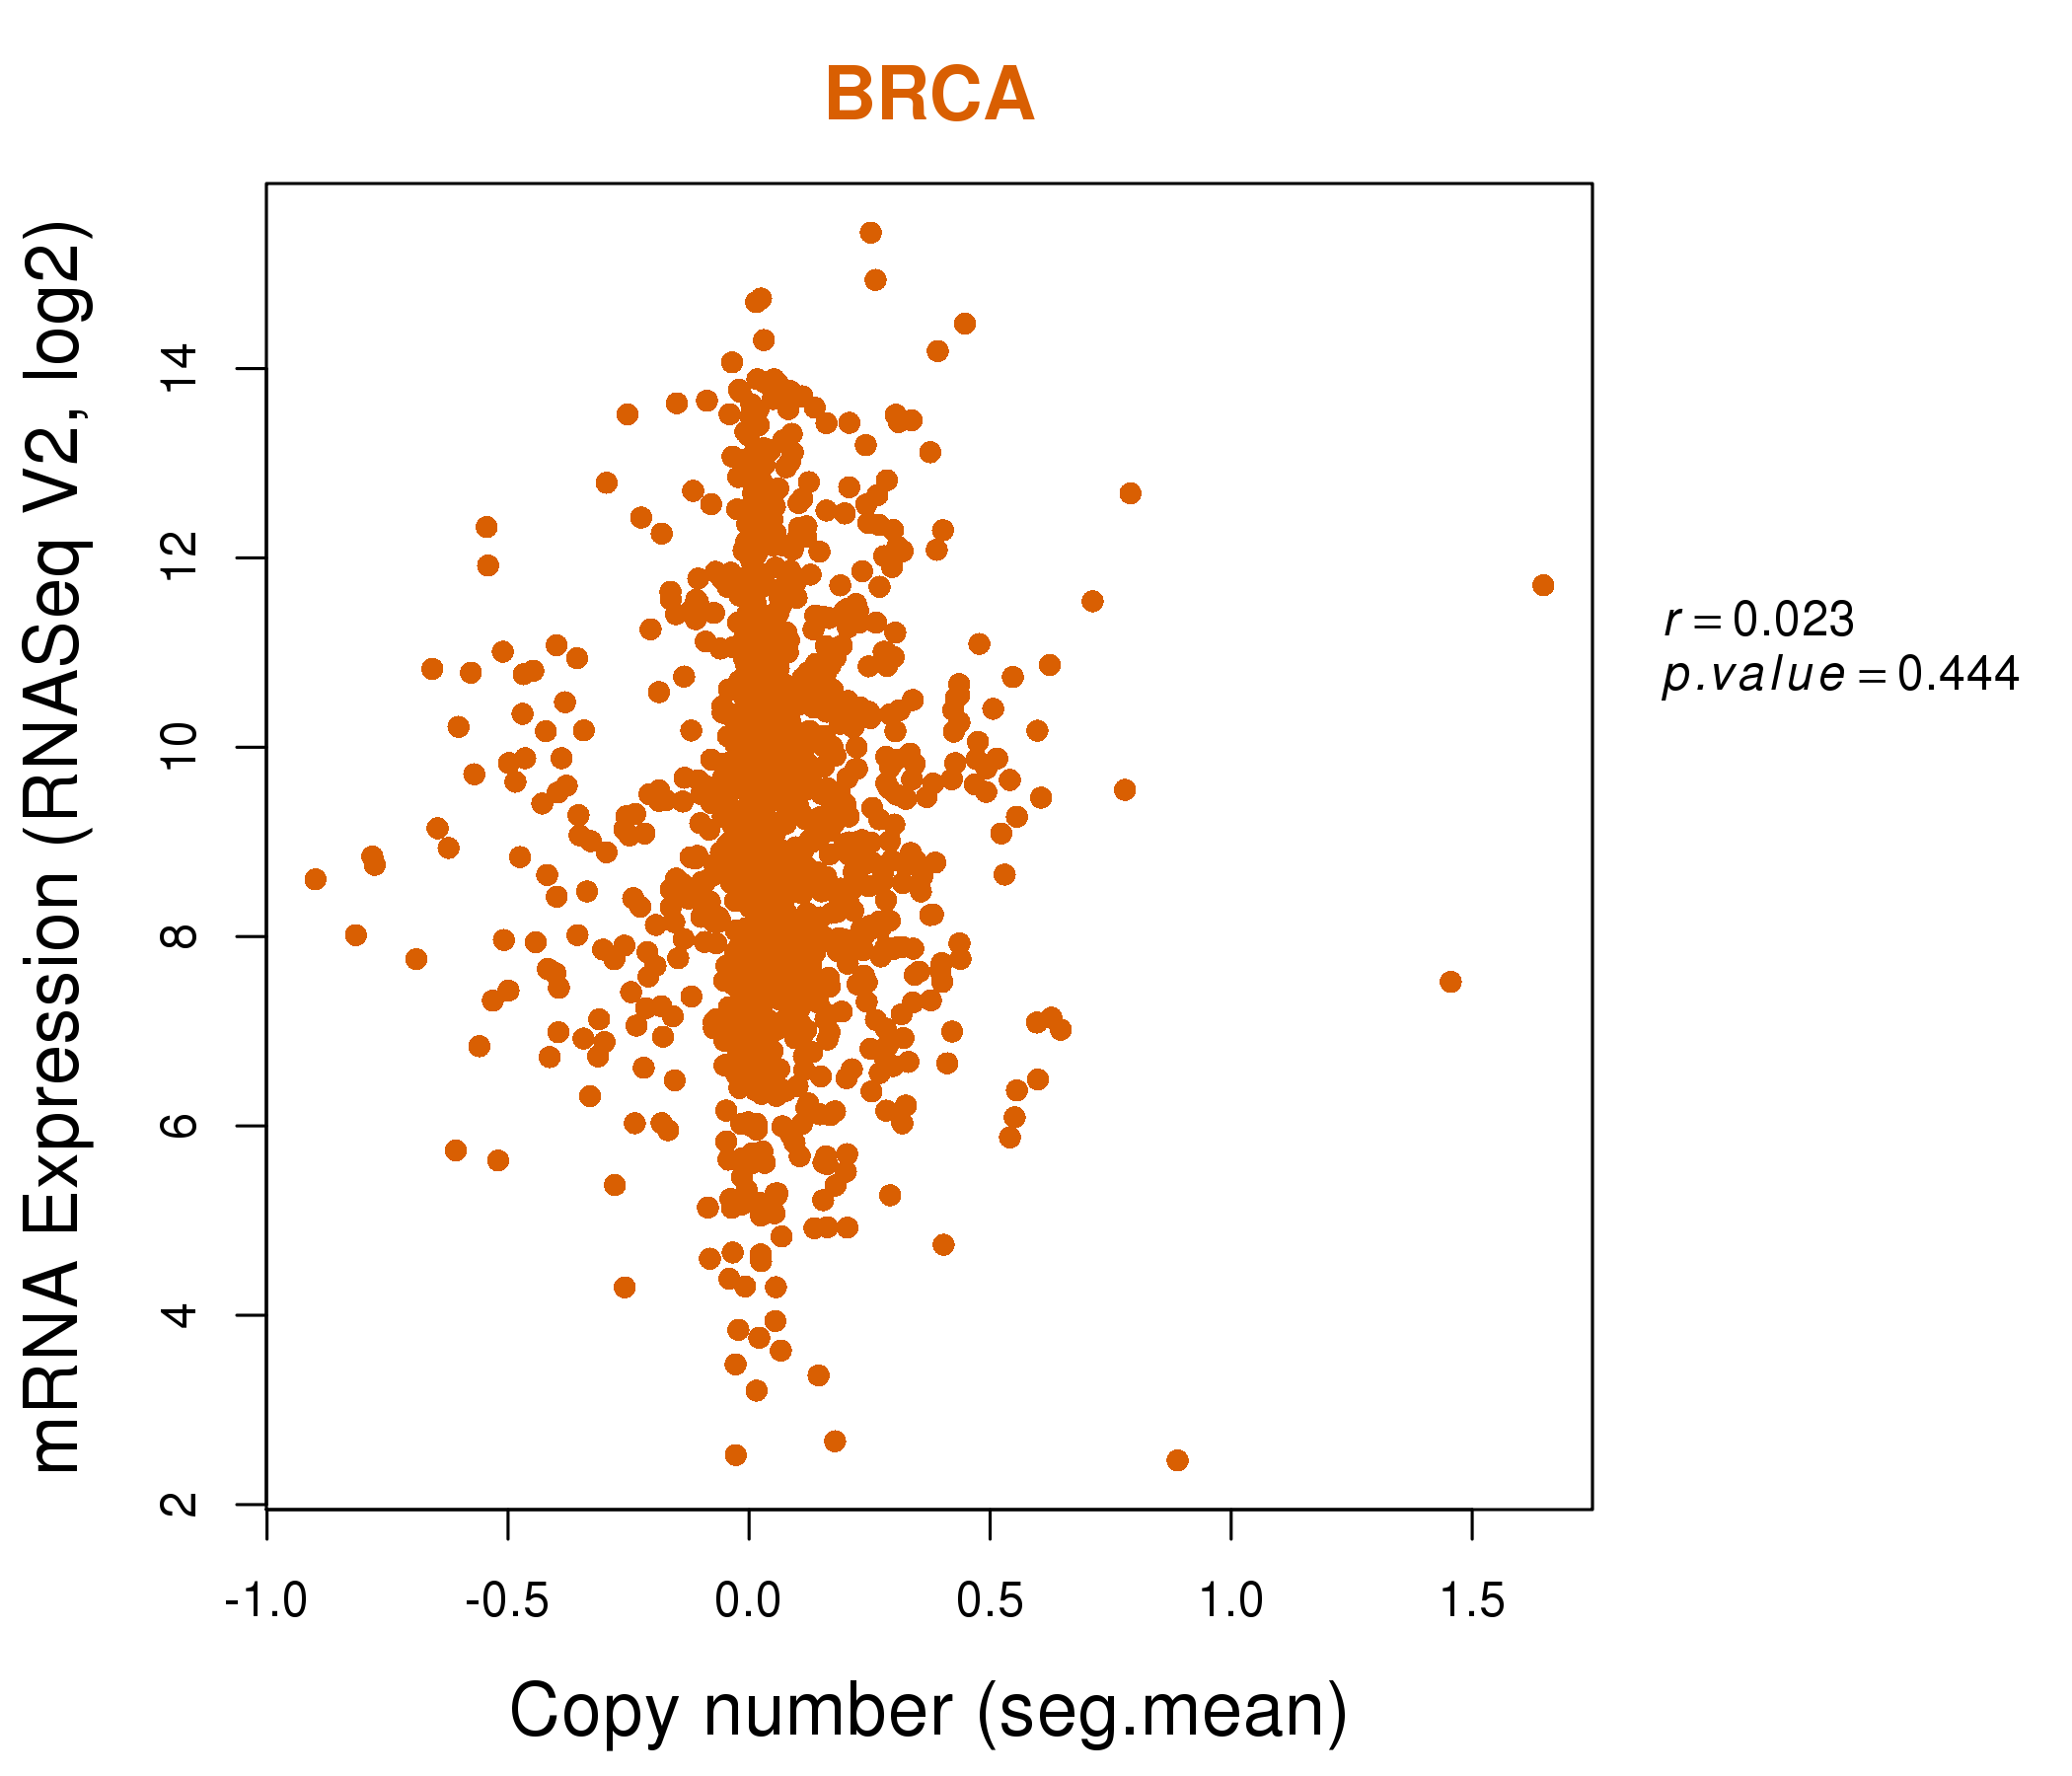
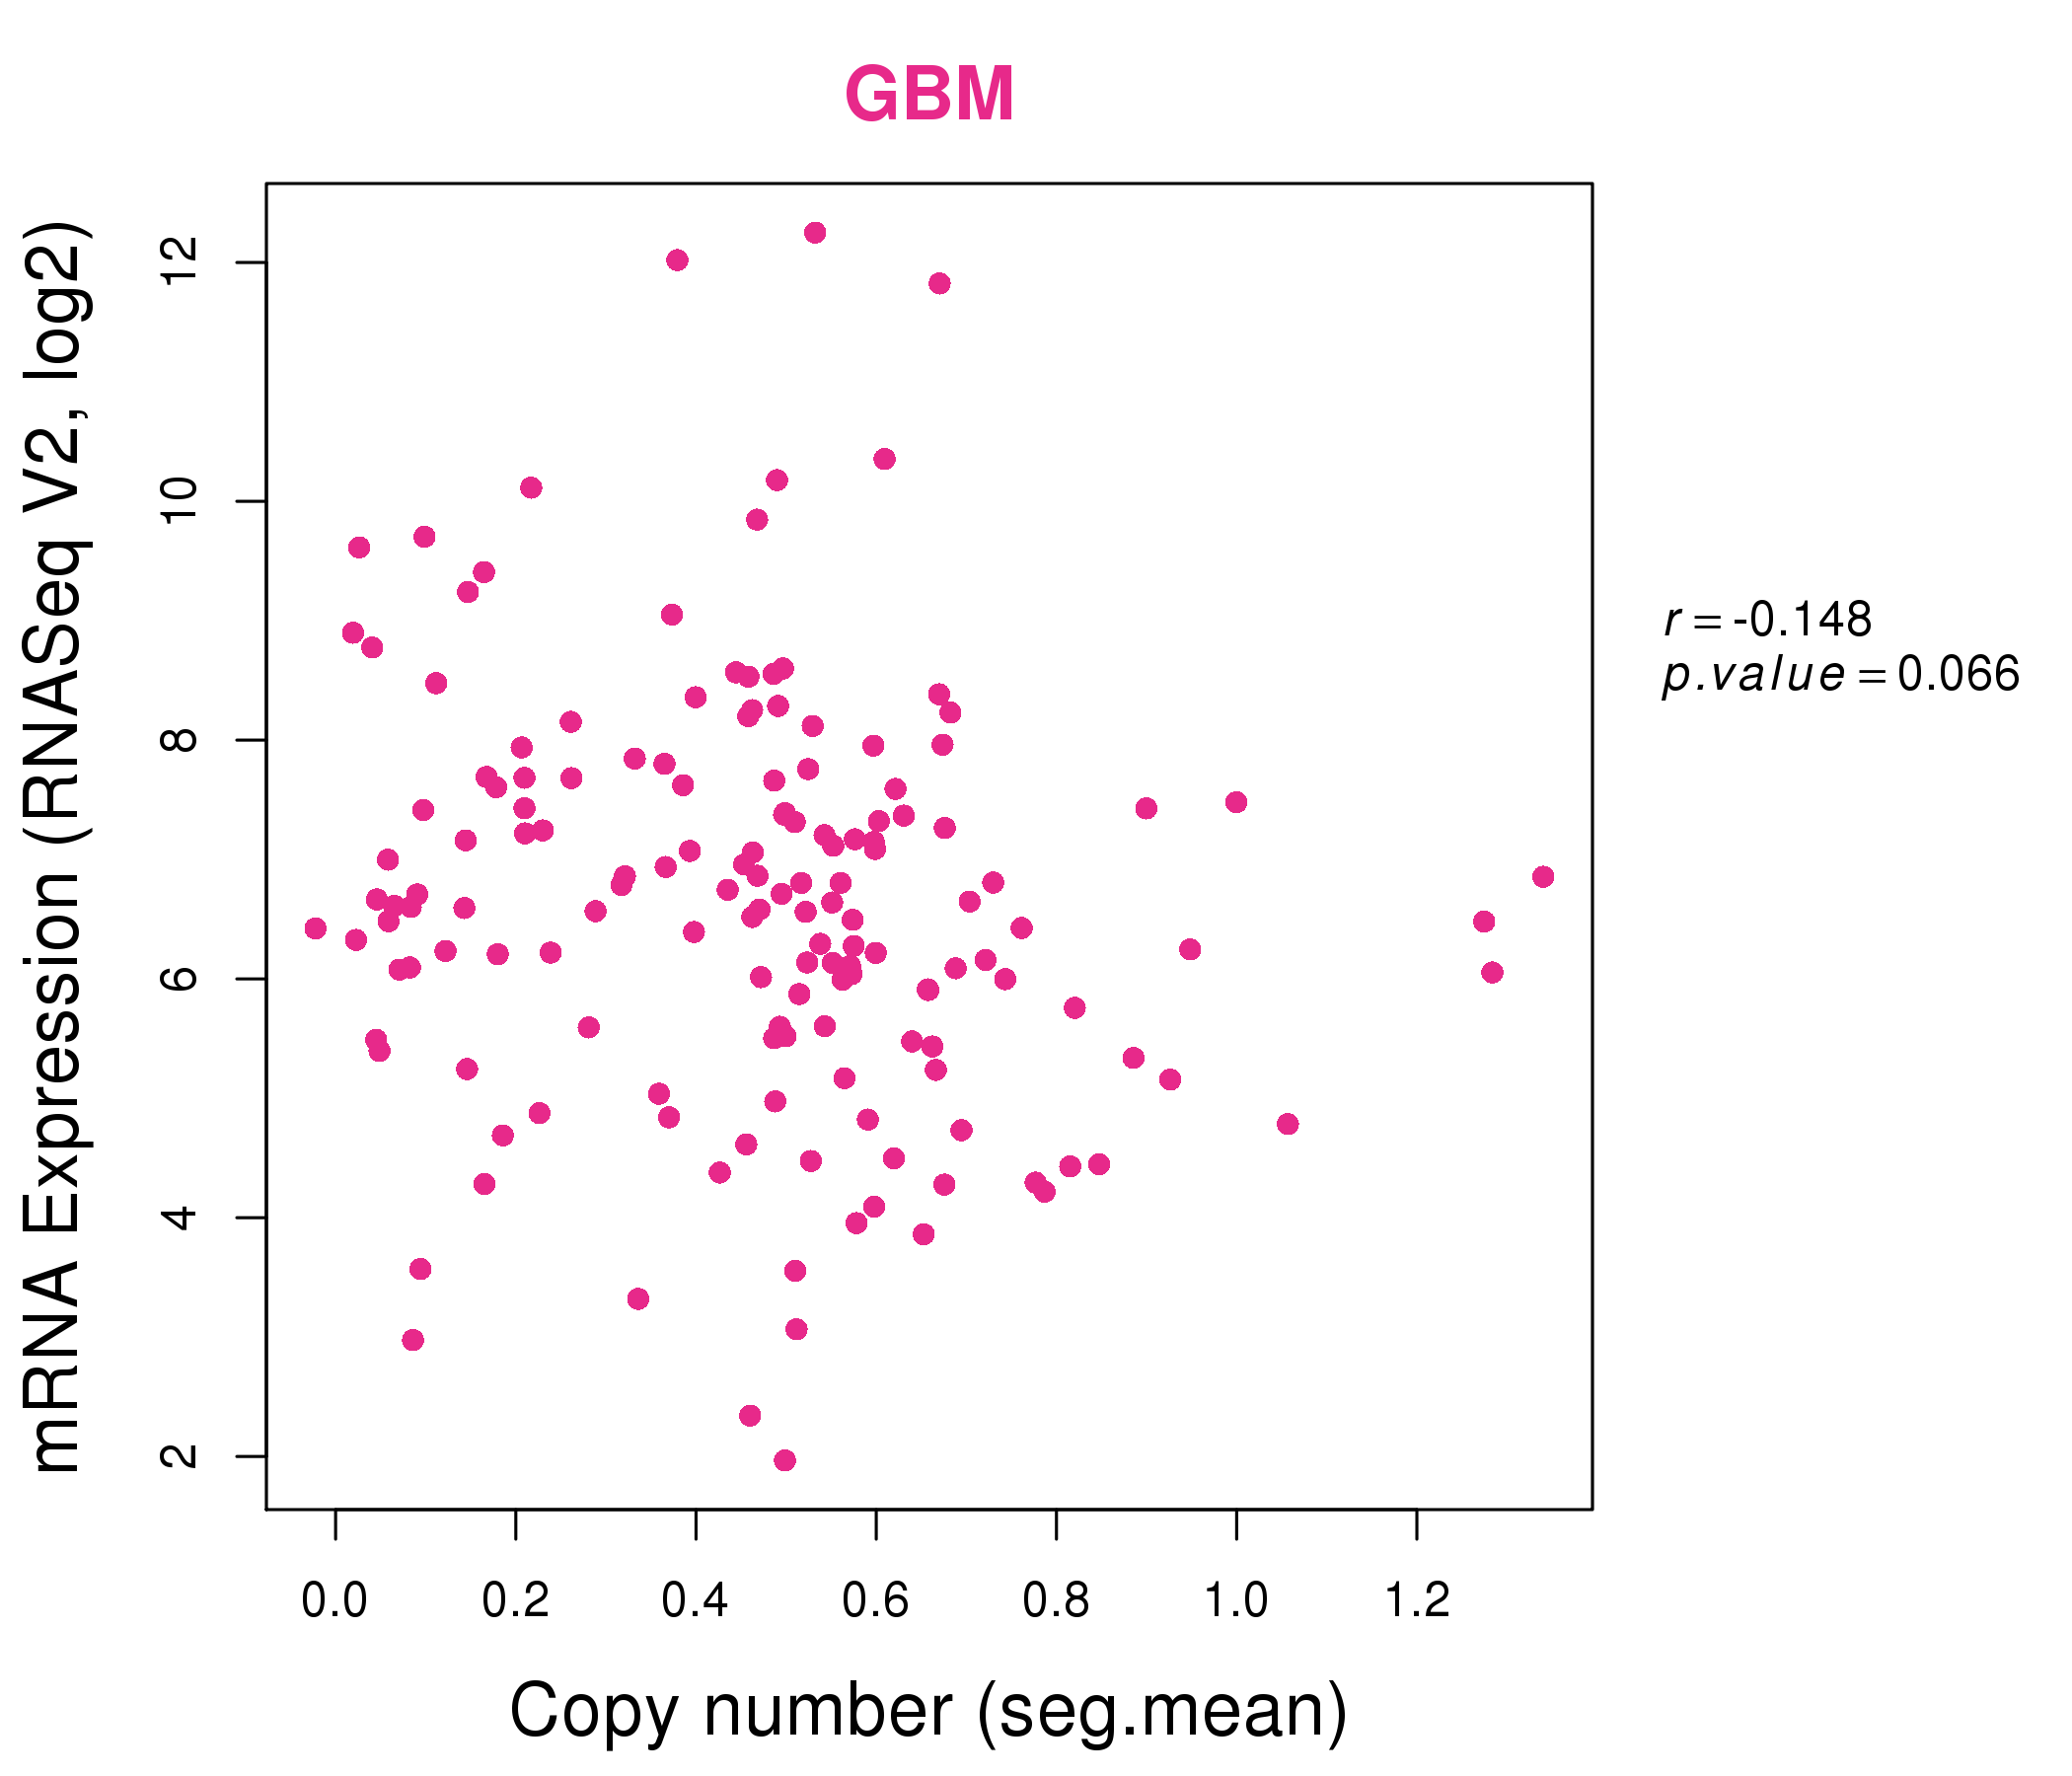
| * This plots show the correlation between CNV and gene expression. |
: Open all plots for all cancer types
 |
|
 |
|
| Top |
| Gene-Gene Network Information |
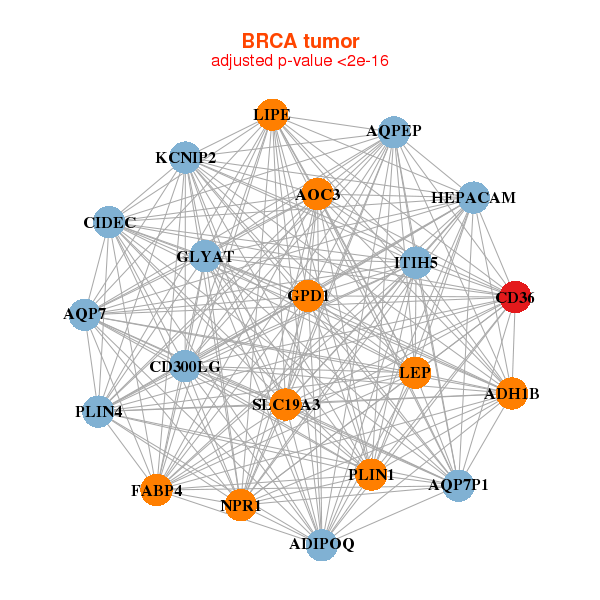
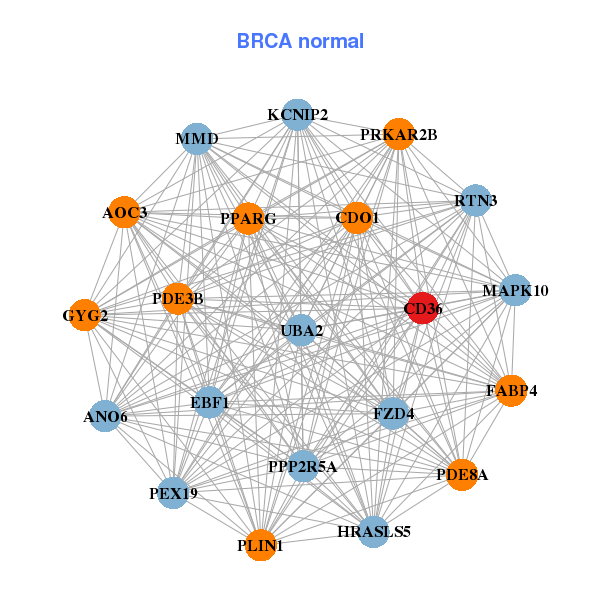
| * Co-Expression network figures were drawn using R package igraph. Only the top 20 genes with the highest correlations were shown. Red circle: input gene, orange circle: cell metabolism gene, sky circle: other gene |
: Open all plots for all cancer types
 |
|
| ADH1B,ADIPOQ,AOC3,AQP7,AQP7P1,AQPEP,CD300LG, CD36,CIDEC,FABP4,GLYAT,GPD1,HEPACAM,ITIH5, KCNIP2,LEP,LIPE,NPR1,PLIN1,PLIN4,SLC19A3 | ANO6,AOC3,CD36,CDO1,EBF1,FABP4,FZD4, GYG2,HRASLS5,KCNIP2,MAPK10,MMD,PDE3B,PDE8A, PEX19,PLIN1,PPARG,PPP2R5A,PRKAR2B,RTN3,UBA2 |
 |
|
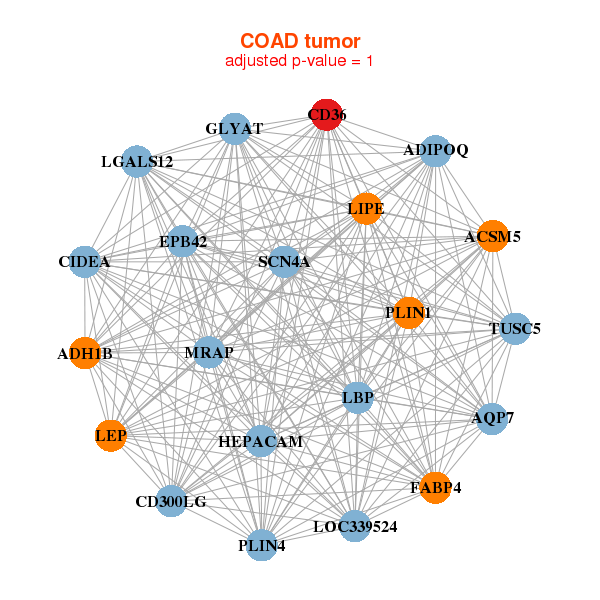
| ACSM5,ADH1B,ADIPOQ,AQP7,CD300LG,CD36,CIDEA, EPB42,FABP4,GLYAT,HEPACAM,LBP,LEP,LGALS12, LIPE,LOC339524,MRAP,PLIN1,PLIN4,SCN4A,TUSC5 | ACSM5,ADIPOQ,AQP7P1,CCDC144NL,CD300LG,CD36,CIDEA, DEFB132,DPYS,FABP4,FAM169B,FOLR2,KCNIP2,LPL, RBP7,RNASE2,SCPEP1,SLC7A10,TIMP4,TSPAN4,TUSC5 |
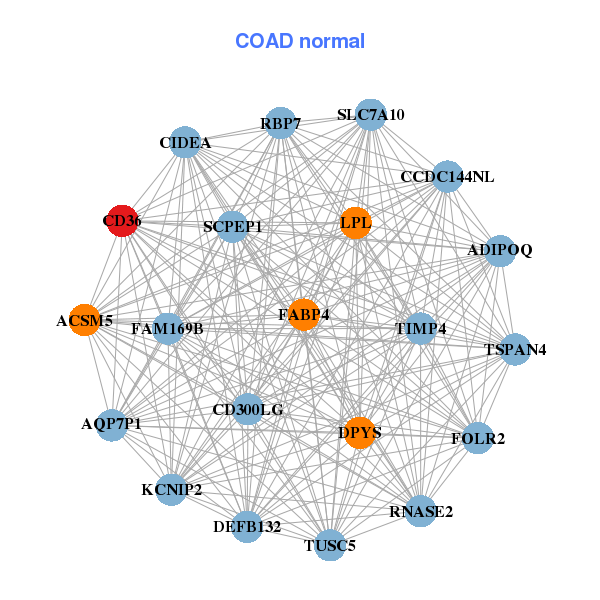
| * Co-Expression network figures were drawn using R package igraph. Only the top 20 genes with the highest correlations were shown. Red circle: input gene, orange circle: cell metabolism gene, sky circle: other gene |
: Open all plots for all cancer types
| Top |
: Open all interacting genes' information including KEGG pathway for all interacting genes from DAVID
| Top |
| Pharmacological Information for CD36 |
| There's no related Drug. |
| Top |
| Cross referenced IDs for CD36 |
| * We obtained these cross-references from Uniprot database. It covers 150 different DBs, 18 categories. http://www.uniprot.org/help/cross_references_section |
: Open all cross reference information
|
Copyright © 2016-Present - The Univsersity of Texas Health Science Center at Houston @ |