|
||||||||||||||||||||||||||||||||||||||||||||||||||||||||||||||||||||||||||||||||||||||||||||||||||||||||||||||||||||||||||||||||||||||||||||||||||||||||||||||||||||||||||||||||||||||||||||||||||||||||||||||||||||||||||||||||||||||||||||||||||||||||||||||||||||||||||||||||||||||||||||||||||||||||||||||||||||||||||
| |
| Phenotypic Information (metabolism pathway, cancer, disease, phenome) |
| |
| |
| Gene-Gene Network Information: Co-Expression Network, Interacting Genes & KEGG |
| |
|


| Gene Summary for PIGL |
| Basic gene info. | Gene symbol | PIGL |
| Gene name | phosphatidylinositol glycan anchor biosynthesis, class L | |
| Synonyms | CHIME | |
| Cytomap | UCSC genome browser: 17p12-p11.2 | |
| Genomic location | chr17 :16120508-16229573 | |
| Type of gene | protein-coding | |
| RefGenes | NM_004278.3, | |
| Ensembl id | ENSG00000108474 | |
| Description | N-acetylglucosaminyl-phosphatidylinositol de-N-acetylaseN-acetylglucosaminylphosphatidylinositol deacetylasePIG-Lphosphatidylinositol glycan, class Lphosphatidylinositol-glycan biosynthesis class L protein | |
| Modification date | 20141207 | |
| dbXrefs | MIM : 605947 | |
| HGNC : HGNC | ||
| Ensembl : ENSG00000108474 | ||
| HPRD : 12071 | ||
| Vega : OTTHUMG00000059346 | ||
| Protein | UniProt: go to UniProt's Cross Reference DB Table | |
| Expression | CleanEX: HS_PIGL | |
| BioGPS: 9487 | ||
| Gene Expression Atlas: ENSG00000108474 | ||
| The Human Protein Atlas: ENSG00000108474 | ||
| Pathway | NCI Pathway Interaction Database: PIGL | |
| KEGG: PIGL | ||
| REACTOME: PIGL | ||
| ConsensusPathDB | ||
| Pathway Commons: PIGL | ||
| Metabolism | MetaCyc: PIGL | |
| HUMANCyc: PIGL | ||
| Regulation | Ensembl's Regulation: ENSG00000108474 | |
| miRBase: chr17 :16,120,508-16,229,573 | ||
| TargetScan: NM_004278 | ||
| cisRED: ENSG00000108474 | ||
| Context | iHOP: PIGL | |
| cancer metabolism search in PubMed: PIGL | ||
| UCL Cancer Institute: PIGL | ||
| Assigned class in ccmGDB | C | |
| Top |
| Phenotypic Information for PIGL(metabolism pathway, cancer, disease, phenome) |
| Cancer | CGAP: PIGL |
| Familial Cancer Database: PIGL | |
| * This gene is included in those cancer gene databases. |
|
|
|
|
|
| . | ||||||||||||||||||||||||||||||||||||||||||||||||||||||||||||||||||||||||||||||||||||||||||||||||||||||||||||||||||||||||||||||||||||||||||||||||||||||||||||||||||||||||||||||||||||||||||||||||||||||||||||||||||||||||||||||||||||||||||||||||||||||||||||||||||||||||||||||||||||||||||||||||||||||||||||||||||||
Oncogene 1 | Significant driver gene in | |||||||||||||||||||||||||||||||||||||||||||||||||||||||||||||||||||||||||||||||||||||||||||||||||||||||||||||||||||||||||||||||||||||||||||||||||||||||||||||||||||||||||||||||||||||||||||||||||||||||||||||||||||||||||||||||||||||||||||||||||||||||||||||||||||||||||||||||||||||||||||||||||||||||||||||||||||||||||
| cf) number; DB name 1 Oncogene; http://nar.oxfordjournals.org/content/35/suppl_1/D721.long, 2 Tumor Suppressor gene; https://bioinfo.uth.edu/TSGene/, 3 Cancer Gene Census; http://www.nature.com/nrc/journal/v4/n3/abs/nrc1299.html, 4 CancerGenes; http://nar.oxfordjournals.org/content/35/suppl_1/D721.long, 5 Network of Cancer Gene; http://ncg.kcl.ac.uk/index.php, 1Therapeutic Vulnerabilities in Cancer; http://cbio.mskcc.org/cancergenomics/statius/ |
| REACTOME_METABOLISM_OF_PROTEINS | |
| OMIM | |
| Orphanet | |
| Disease | KEGG Disease: PIGL |
| MedGen: PIGL (Human Medical Genetics with Condition) | |
| ClinVar: PIGL | |
| Phenotype | MGI: PIGL (International Mouse Phenotyping Consortium) |
| PhenomicDB: PIGL | |
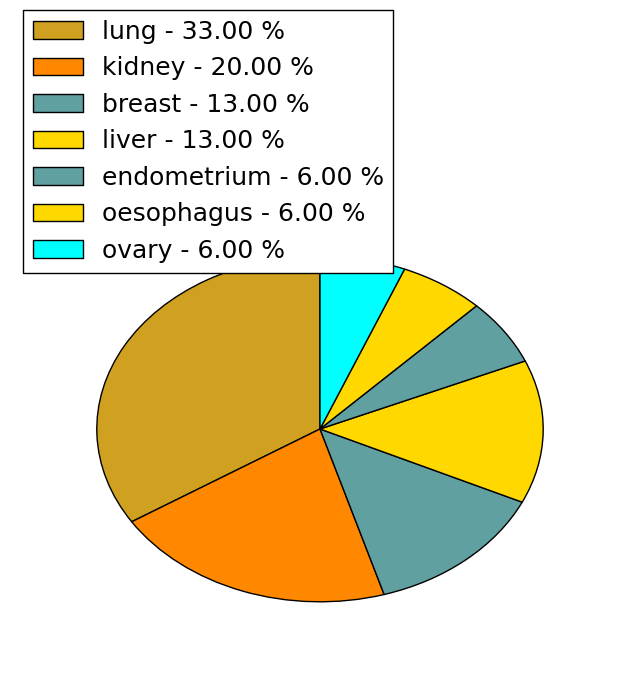
| Mutations for PIGL |
| * Under tables are showing count per each tissue to give us broad intuition about tissue specific mutation patterns.You can go to the detailed page for each mutation database's web site. |
| - Statistics for Tissue and Mutation type | Top |
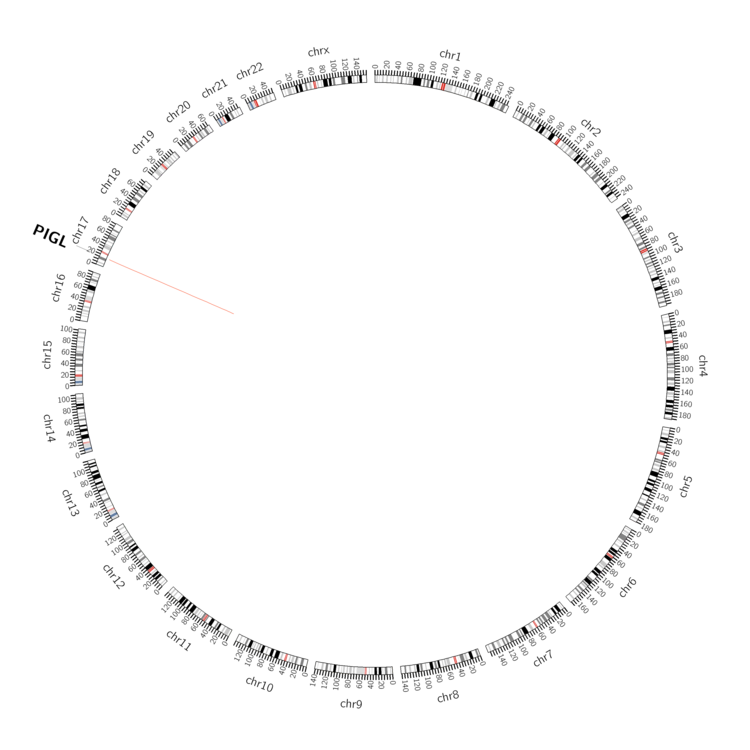 |
| - For Inter-chromosomal Variations |
| There's no inter-chromosomal structural variation. |
| - For Intra-chromosomal Variations |
| * Intra-chromosomal variantions includes 'intrachromosomal amplicon to amplicon', 'intrachromosomal amplicon to non-amplified dna', 'intrachromosomal deletion', 'intrachromosomal fold-back inversion', 'intrachromosomal inversion', 'intrachromosomal tandem duplication', 'Intrachromosomal unknown type', 'intrachromosomal with inverted orientation', 'intrachromosomal with non-inverted orientation'. |
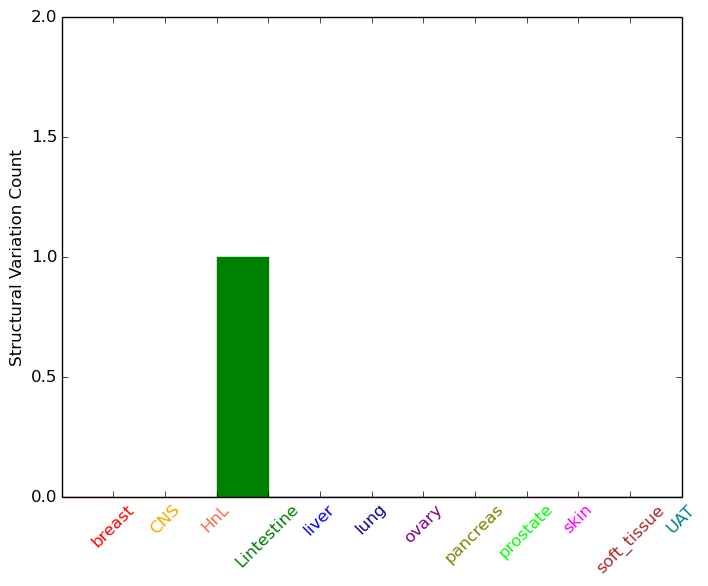 |
| Sample | Symbol_a | Chr_a | Start_a | End_a | Symbol_b | Chr_b | Start_b | End_b |
| large_intestine | PIGL | chr17 | 16138070 | 16138070 | PIGL | chr17 | 16162625 | 16162625 |
| cf) Tissue number; Tissue name (1;Breast, 2;Central_nervous_system, 3;Haematopoietic_and_lymphoid_tissue, 4;Large_intestine, 5;Liver, 6;Lung, 7;Ovary, 8;Pancreas, 9;Prostate, 10;Skin, 11;Soft_tissue, 12;Upper_aerodigestive_tract) |
| * From mRNA Sanger sequences, Chitars2.0 arranged chimeric transcripts. This table shows PIGL related fusion information. |
| ID | Head Gene | Tail Gene | Accession | Gene_a | qStart_a | qEnd_a | Chromosome_a | tStart_a | tEnd_a | Gene_a | qStart_a | qEnd_a | Chromosome_a | tStart_a | tEnd_a |
| BE706180 | FN1 | 10 | 157 | 2 | 216264037 | 216269224 | PIGL | 155 | 317 | 17 | 16167728 | 16167890 | |
| Top |
| Mutation type/ Tissue ID | brca | cns | cerv | endome | haematopo | kidn | Lintest | liver | lung | ns | ovary | pancre | prost | skin | stoma | thyro | urina | |||
| Total # sample | 4 | 1 | 3 | |||||||||||||||||
| GAIN (# sample) | 2 | 1 | ||||||||||||||||||
| LOSS (# sample) | 2 | 3 |
| cf) Tissue ID; Tissue type (1; Breast, 2; Central_nervous_system, 3; Cervix, 4; Endometrium, 5; Haematopoietic_and_lymphoid_tissue, 6; Kidney, 7; Large_intestine, 8; Liver, 9; Lung, 10; NS, 11; Ovary, 12; Pancreas, 13; Prostate, 14; Skin, 15; Stomach, 16; Thyroid, 17; Urinary_tract) |
| Top |
|
 |
| Top |
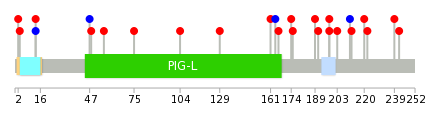
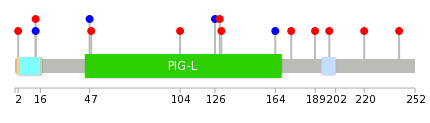
| Stat. for Non-Synonymous SNVs (# total SNVs=15) | (# total SNVs=3) |
 |  |
(# total SNVs=0) | (# total SNVs=0) |
| Top |
| * When you move the cursor on each content, you can see more deailed mutation information on the Tooltip. Those are primary_site,primary_histology,mutation(aa),pubmedID. |
| GRCh37 position | Mutation(aa) | Unique sampleID count |
| chr17:16216926-16216926 | p.V164V | 1 |
| chr17:16221198-16221198 | p.N212K | 1 |
| chr17:16120658-16120658 | p.E40* | 1 |
| chr17:16219996-16219996 | p.A166T | 1 |
| chr17:16221220-16221220 | p.K220Q | 1 |
| chr17:16120681-16120681 | p.I47I | 1 |
| chr17:16220021-16220021 | p.P174L | 1 |
| chr17:16229117-16229117 | p.A222T | 1 |
| chr17:16120682-16120682 | p.A48P | 1 |
| chr17:16220023-16220023 | p.K175Q | 1 |
| Top |
|
 |
| Point Mutation/ Tissue ID | 1 | 2 | 3 | 4 | 5 | 6 | 7 | 8 | 9 | 10 | 11 | 12 | 13 | 14 | 15 | 16 | 17 | 18 | 19 | 20 |
| # sample | 1 | 1 | 1 | 2 | 3 | 1 | 2 | 2 | 2 | |||||||||||
| # mutation | 1 | 1 | 1 | 2 | 3 | 1 | 2 | 2 | 2 | |||||||||||
| nonsynonymous SNV | 1 | 2 | 3 | 1 | 1 | 2 | 1 | |||||||||||||
| synonymous SNV | 1 | 1 | 1 | 1 |
| cf) Tissue ID; Tissue type (1; BLCA[Bladder Urothelial Carcinoma], 2; BRCA[Breast invasive carcinoma], 3; CESC[Cervical squamous cell carcinoma and endocervical adenocarcinoma], 4; COAD[Colon adenocarcinoma], 5; GBM[Glioblastoma multiforme], 6; Glioma Low Grade, 7; HNSC[Head and Neck squamous cell carcinoma], 8; KICH[Kidney Chromophobe], 9; KIRC[Kidney renal clear cell carcinoma], 10; KIRP[Kidney renal papillary cell carcinoma], 11; LAML[Acute Myeloid Leukemia], 12; LUAD[Lung adenocarcinoma], 13; LUSC[Lung squamous cell carcinoma], 14; OV[Ovarian serous cystadenocarcinoma ], 15; PAAD[Pancreatic adenocarcinoma], 16; PRAD[Prostate adenocarcinoma], 17; SKCM[Skin Cutaneous Melanoma], 18:STAD[Stomach adenocarcinoma], 19:THCA[Thyroid carcinoma], 20:UCEC[Uterine Corpus Endometrial Carcinoma]) |
| Top |
| * We represented just top 10 SNVs. When you move the cursor on each content, you can see more deailed mutation information on the Tooltip. Those are primary_site, primary_histology, mutation(aa), pubmedID. |
| Genomic Position | Mutation(aa) | Unique sampleID count |
| chr17:16229178 | p.A48P | 1 |
| chr17:16120682 | p.S104C | 1 |
| chr17:16137360 | p.H126H | 1 |
| chr17:16203244 | p.R129G | 1 |
| chr17:16203251 | p.V130G | 1 |
| chr17:16203255 | p.V164V | 1 |
| chr17:16216926 | p.P174L | 1 |
| chr17:16220021 | p.R189G | 1 |
| chr17:16120544 | p.P198S | 1 |
| chr17:16221127 | p.K220Q | 1 |
| * Copy number data were extracted from TCGA using R package TCGA-Assembler. The URLs of all public data files on TCGA DCC data server were gathered on Jan-05-2015. Function ProcessCNAData in TCGA-Assembler package was used to obtain gene-level copy number value which is calculated as the average copy number of the genomic region of a gene. |
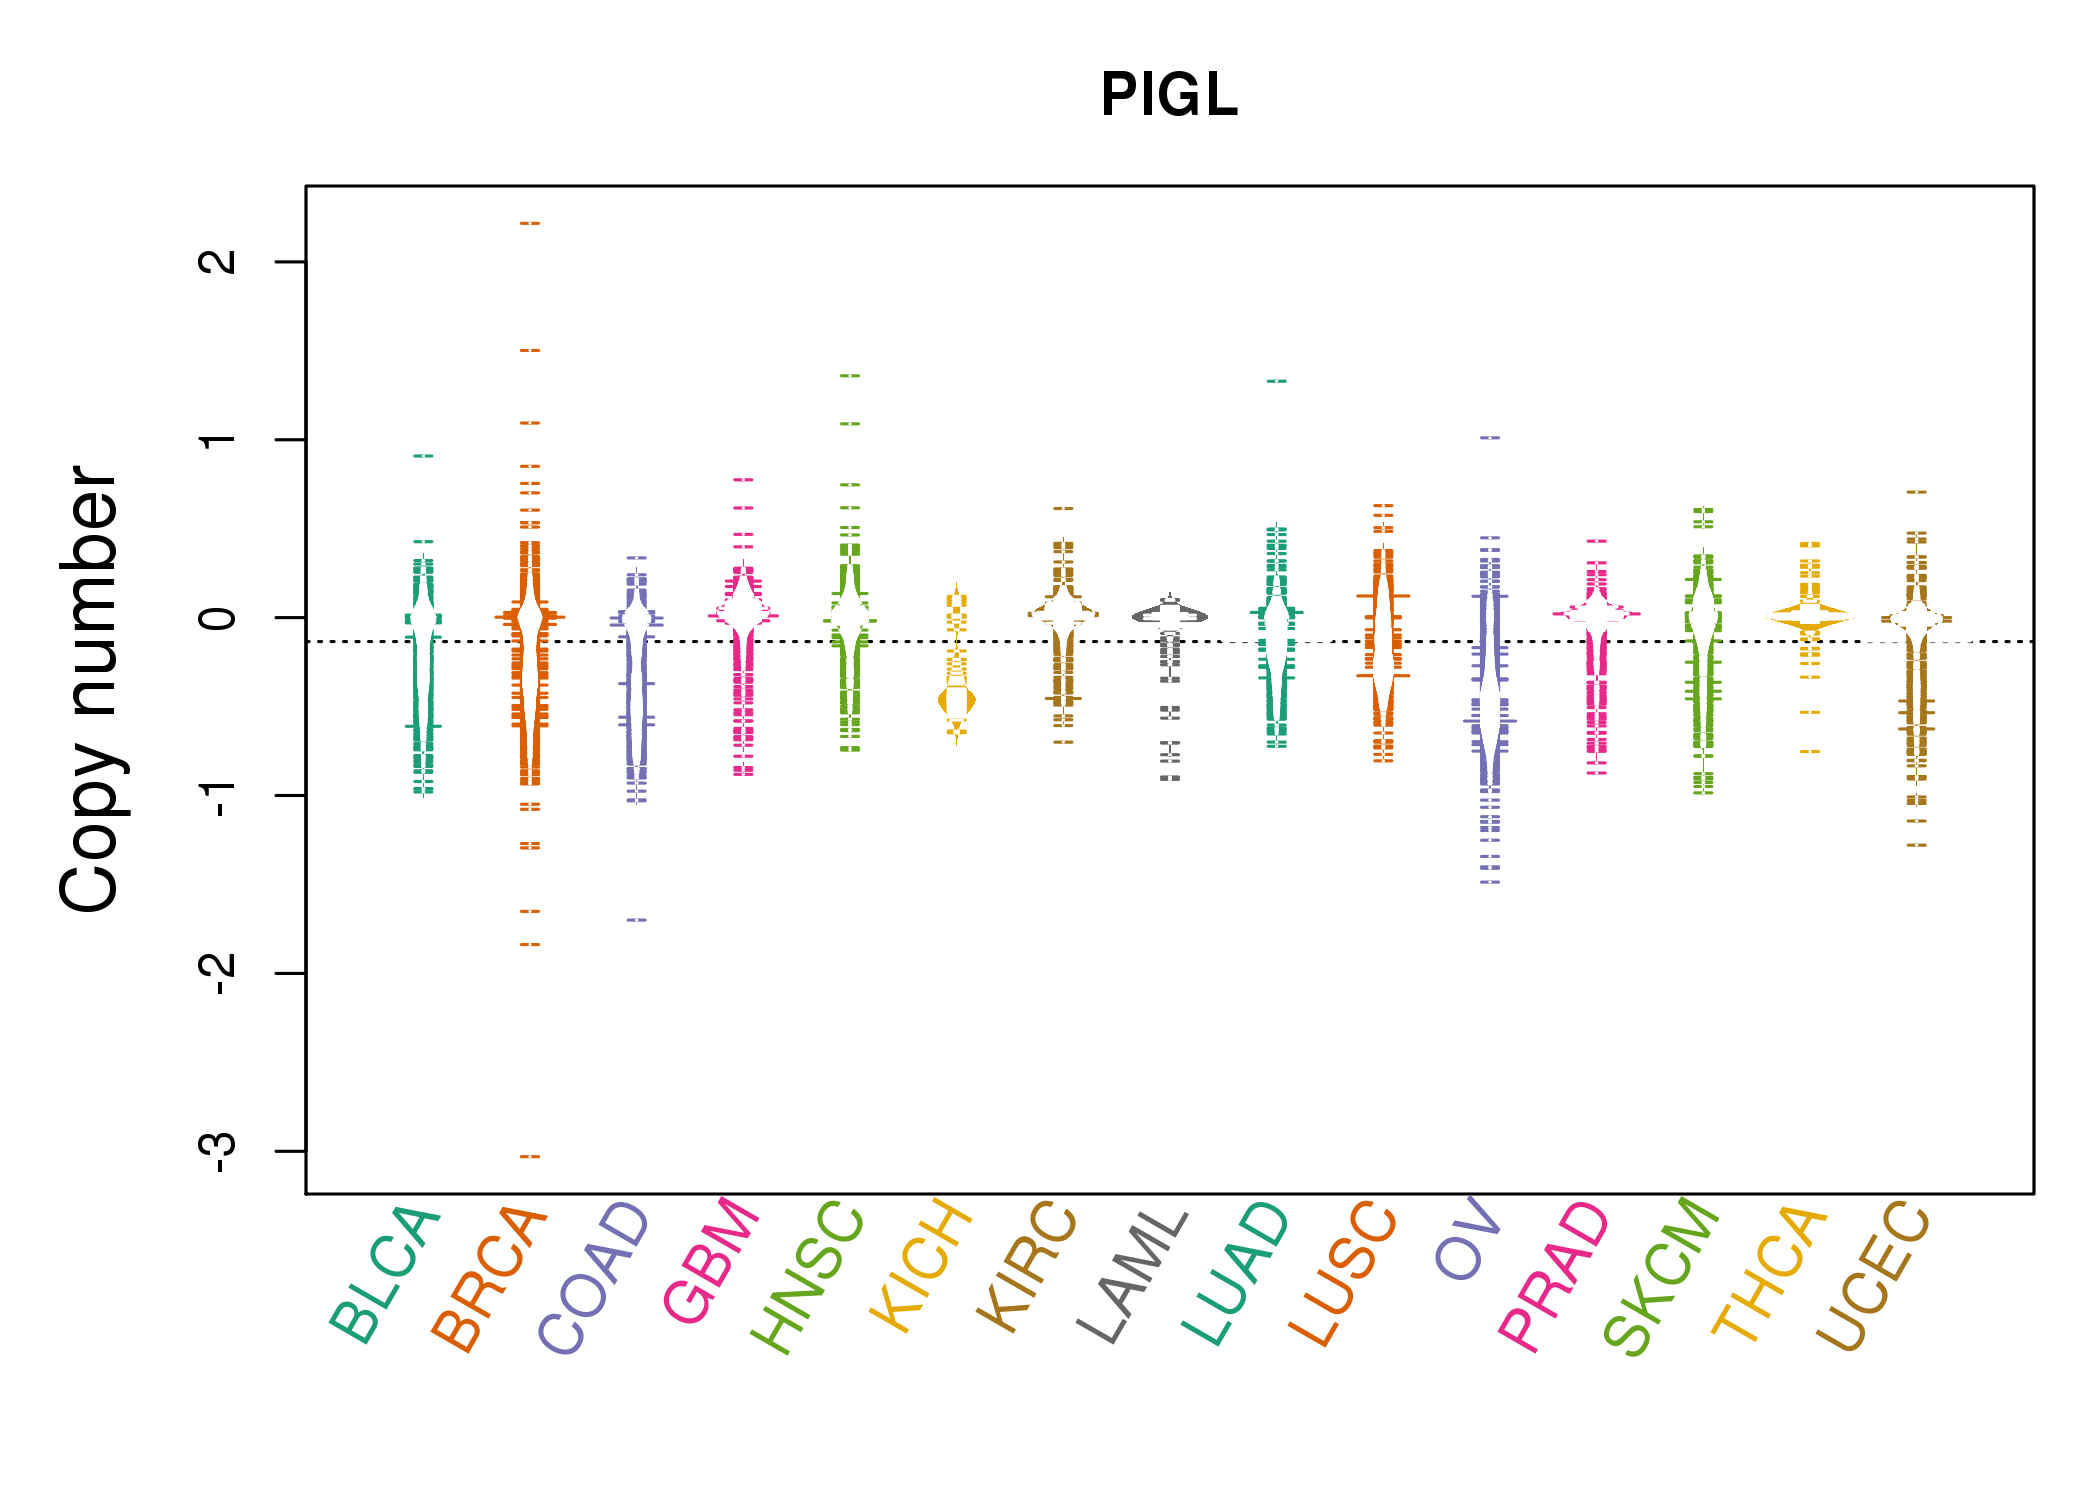 |
| cf) Tissue ID[Tissue type]: BLCA[Bladder Urothelial Carcinoma], BRCA[Breast invasive carcinoma], CESC[Cervical squamous cell carcinoma and endocervical adenocarcinoma], COAD[Colon adenocarcinoma], GBM[Glioblastoma multiforme], Glioma Low Grade, HNSC[Head and Neck squamous cell carcinoma], KICH[Kidney Chromophobe], KIRC[Kidney renal clear cell carcinoma], KIRP[Kidney renal papillary cell carcinoma], LAML[Acute Myeloid Leukemia], LUAD[Lung adenocarcinoma], LUSC[Lung squamous cell carcinoma], OV[Ovarian serous cystadenocarcinoma ], PAAD[Pancreatic adenocarcinoma], PRAD[Prostate adenocarcinoma], SKCM[Skin Cutaneous Melanoma], STAD[Stomach adenocarcinoma], THCA[Thyroid carcinoma], UCEC[Uterine Corpus Endometrial Carcinoma] |
| Top |
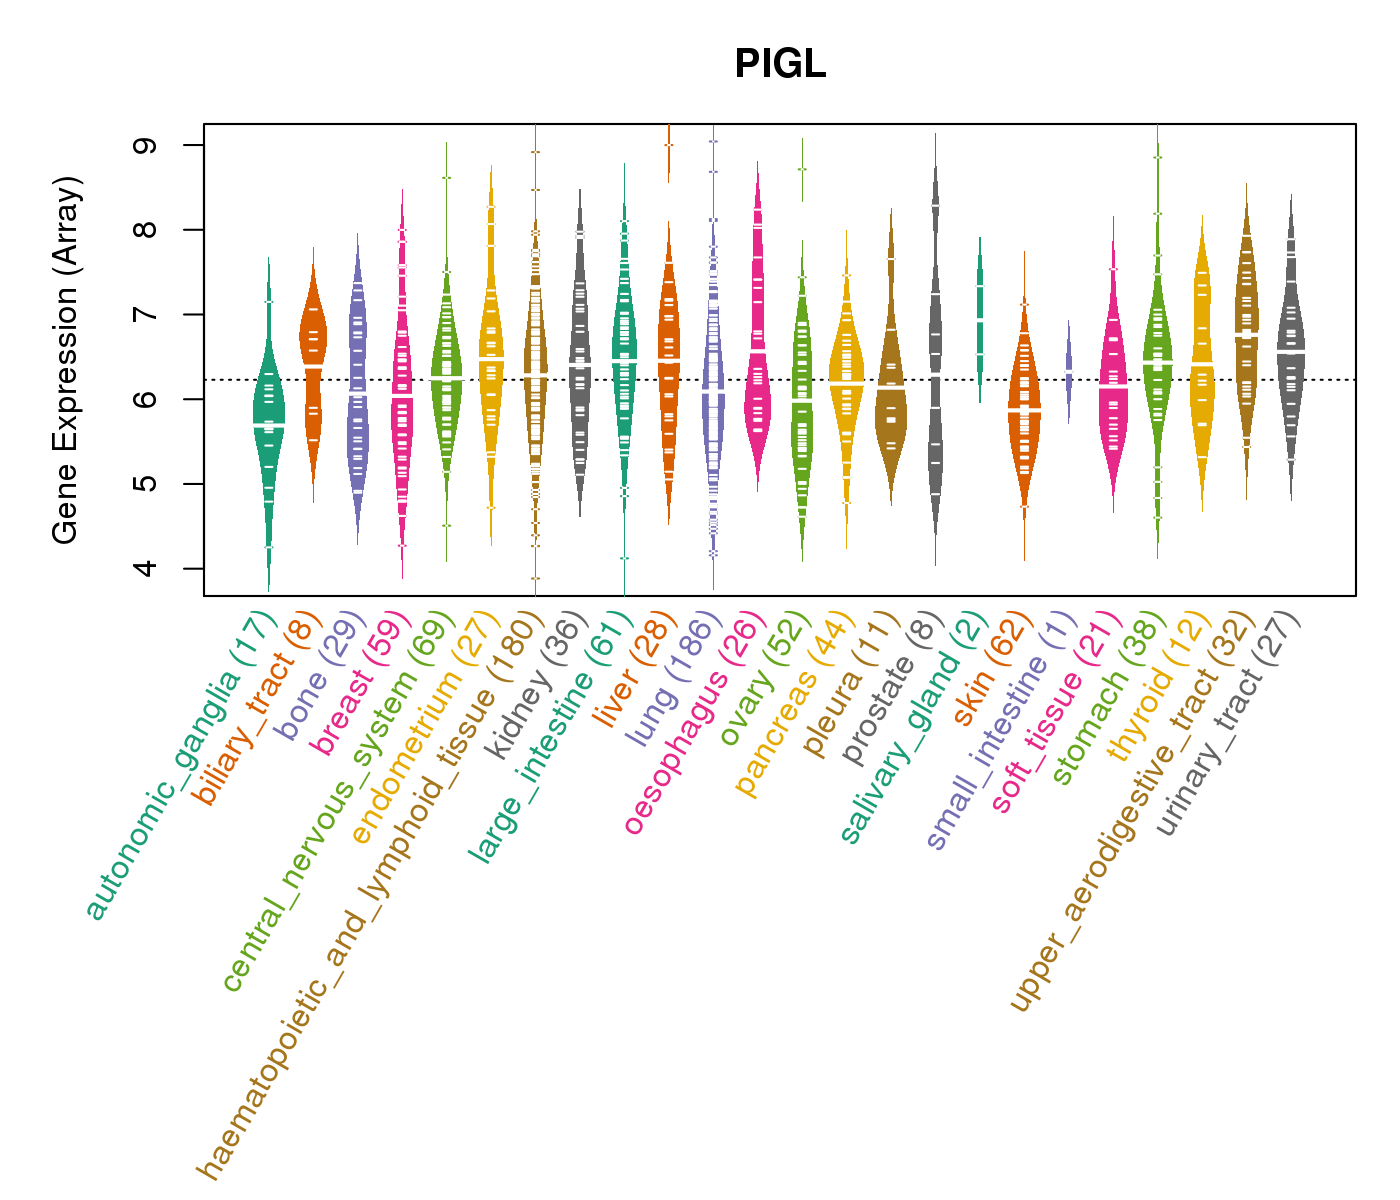
| Gene Expression for PIGL |
| * CCLE gene expression data were extracted from CCLE_Expression_Entrez_2012-10-18.res: Gene-centric RMA-normalized mRNA expression data. |
 |
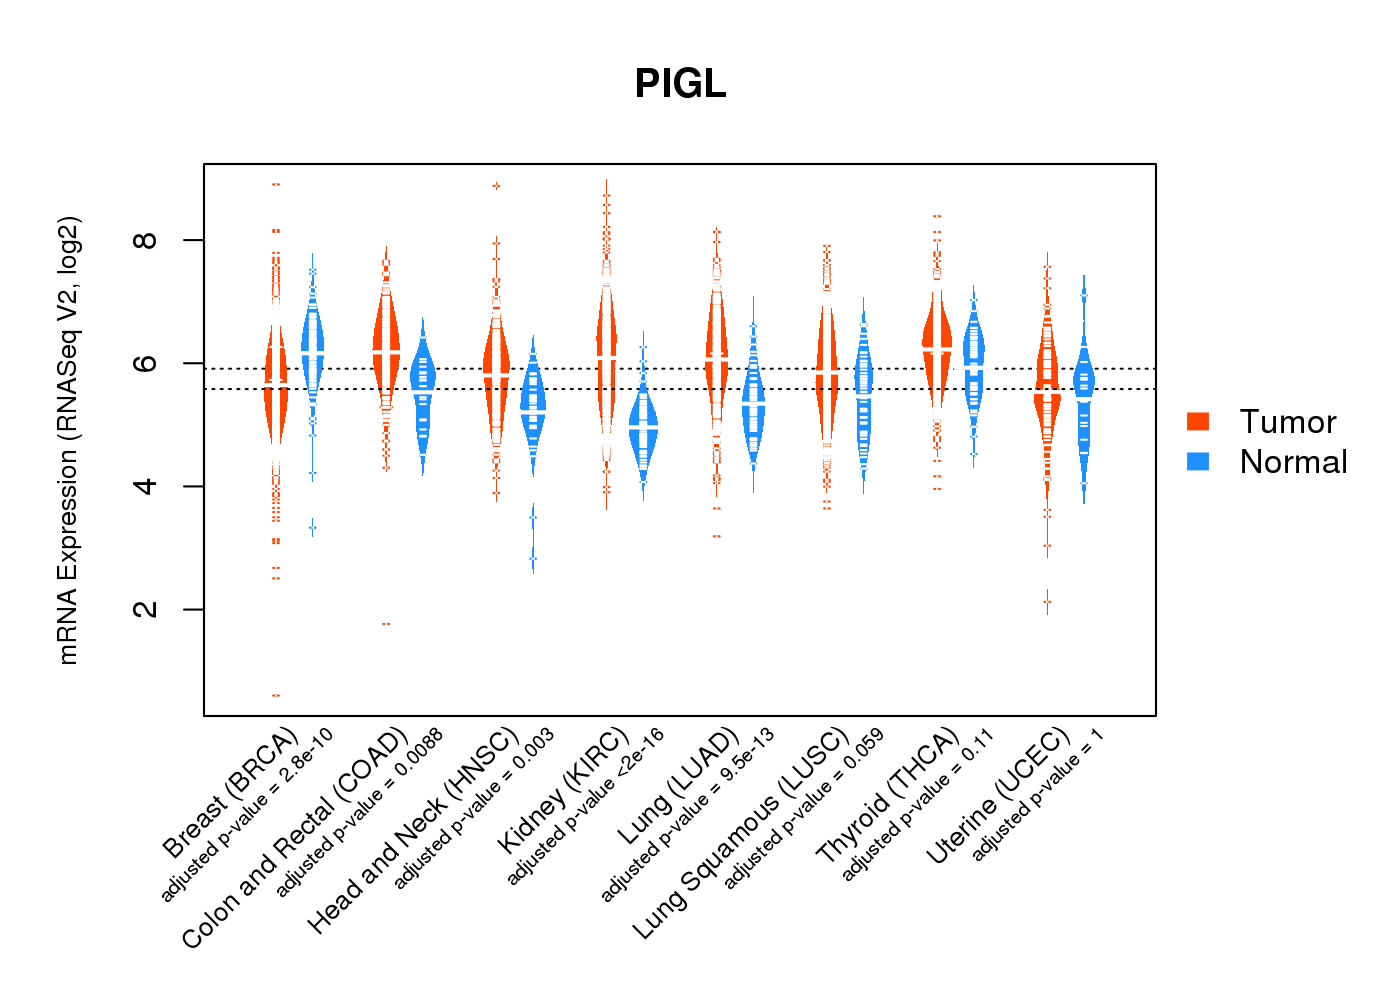
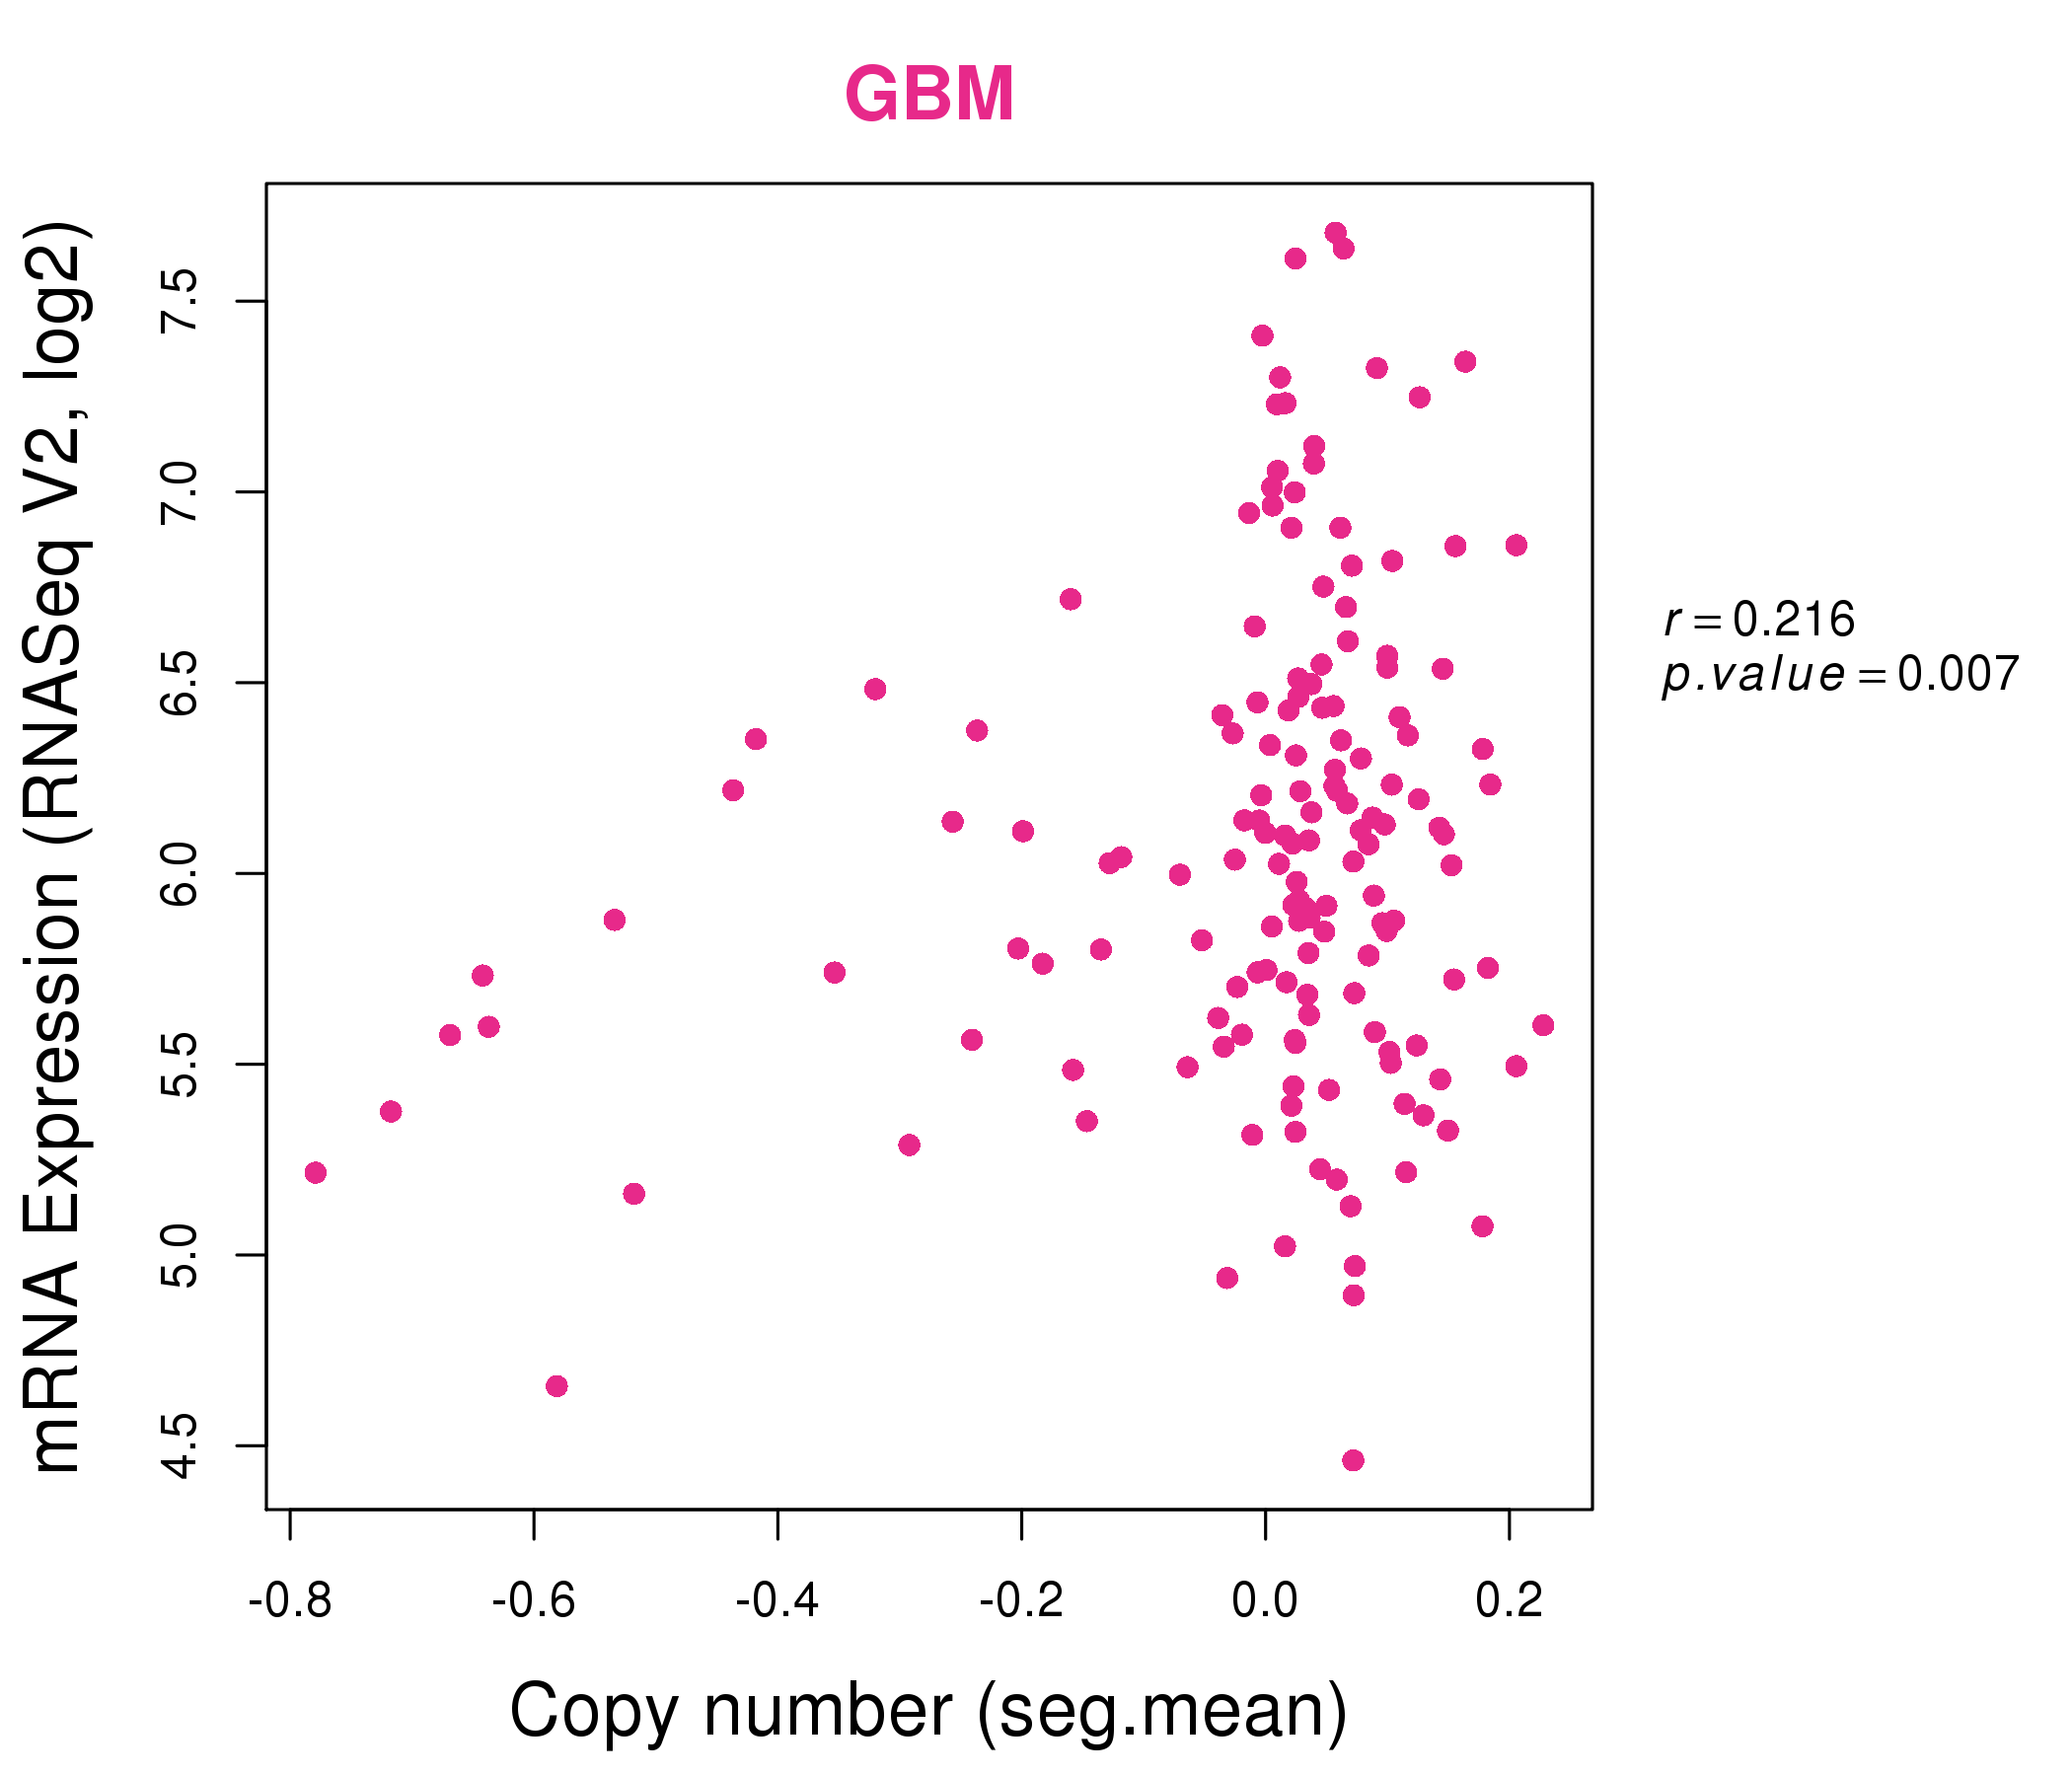
| * Normalized gene expression data of RNASeqV2 was extracted from TCGA using R package TCGA-Assembler. The URLs of all public data files on TCGA DCC data server were gathered at Jan-05-2015. Only eight cancer types have enough normal control samples for differential expression analysis. (t test, adjusted p<0.05 (using Benjamini-Hochberg FDR)) |
 |
| Top |
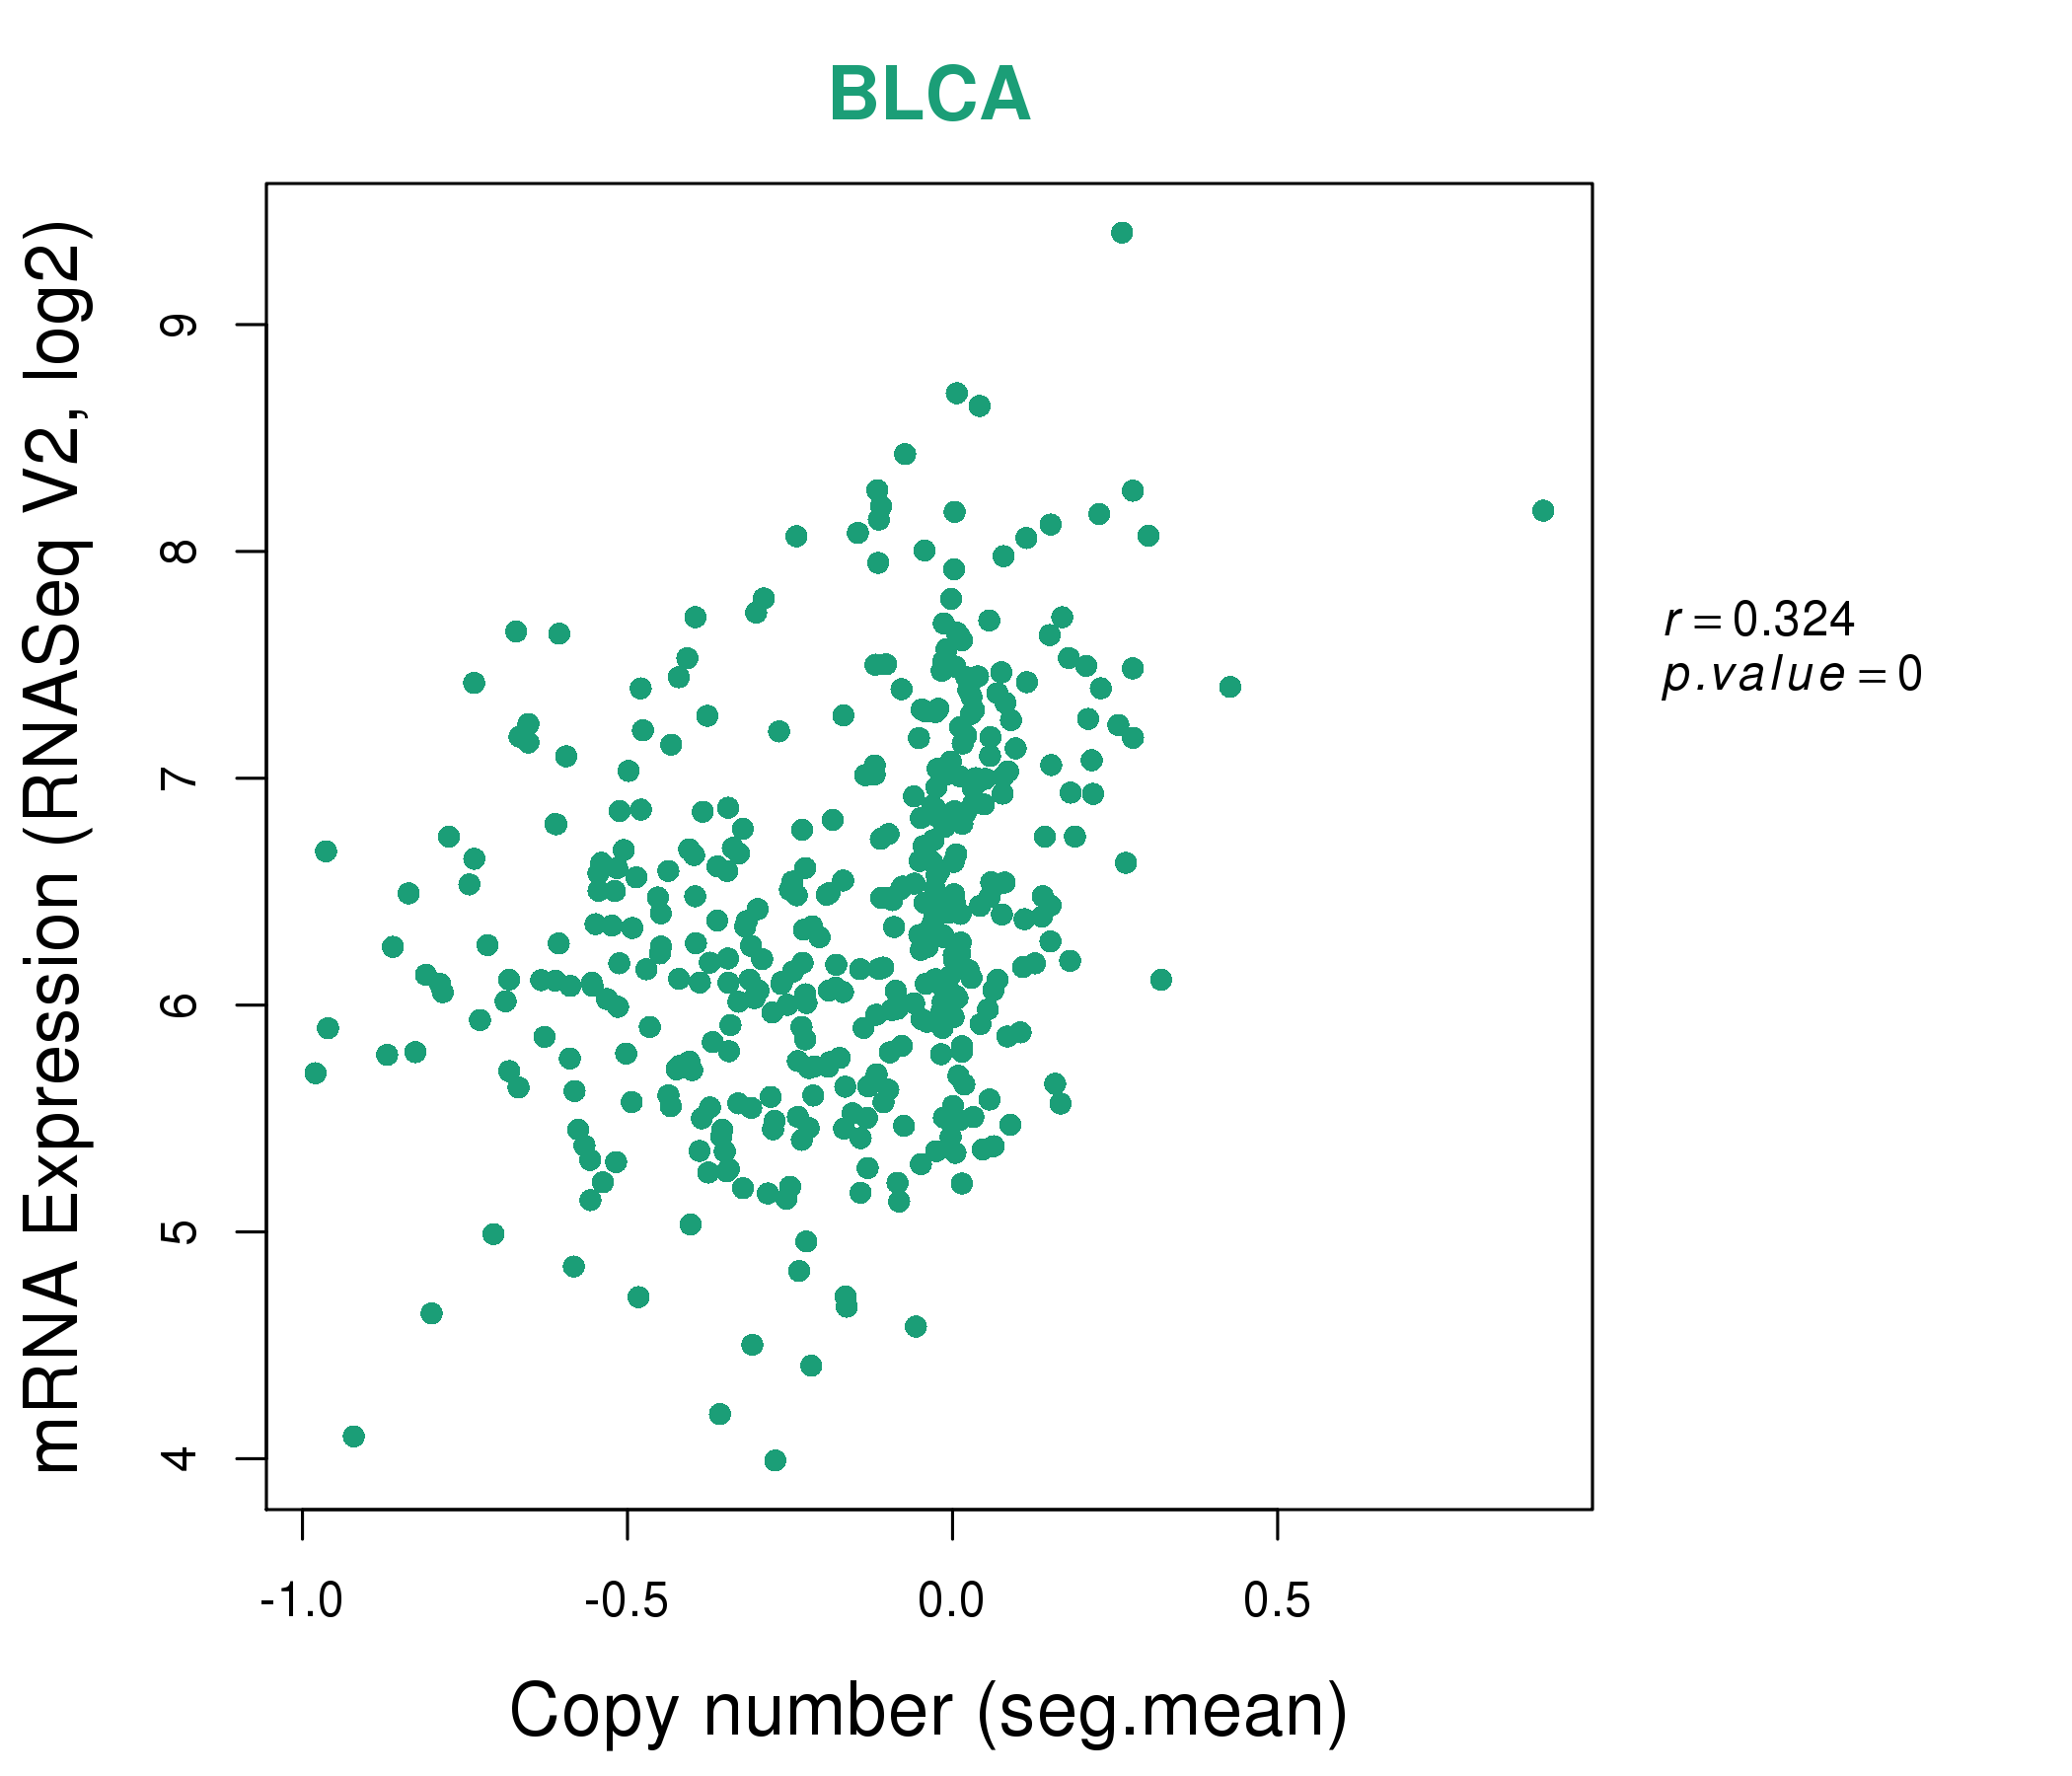
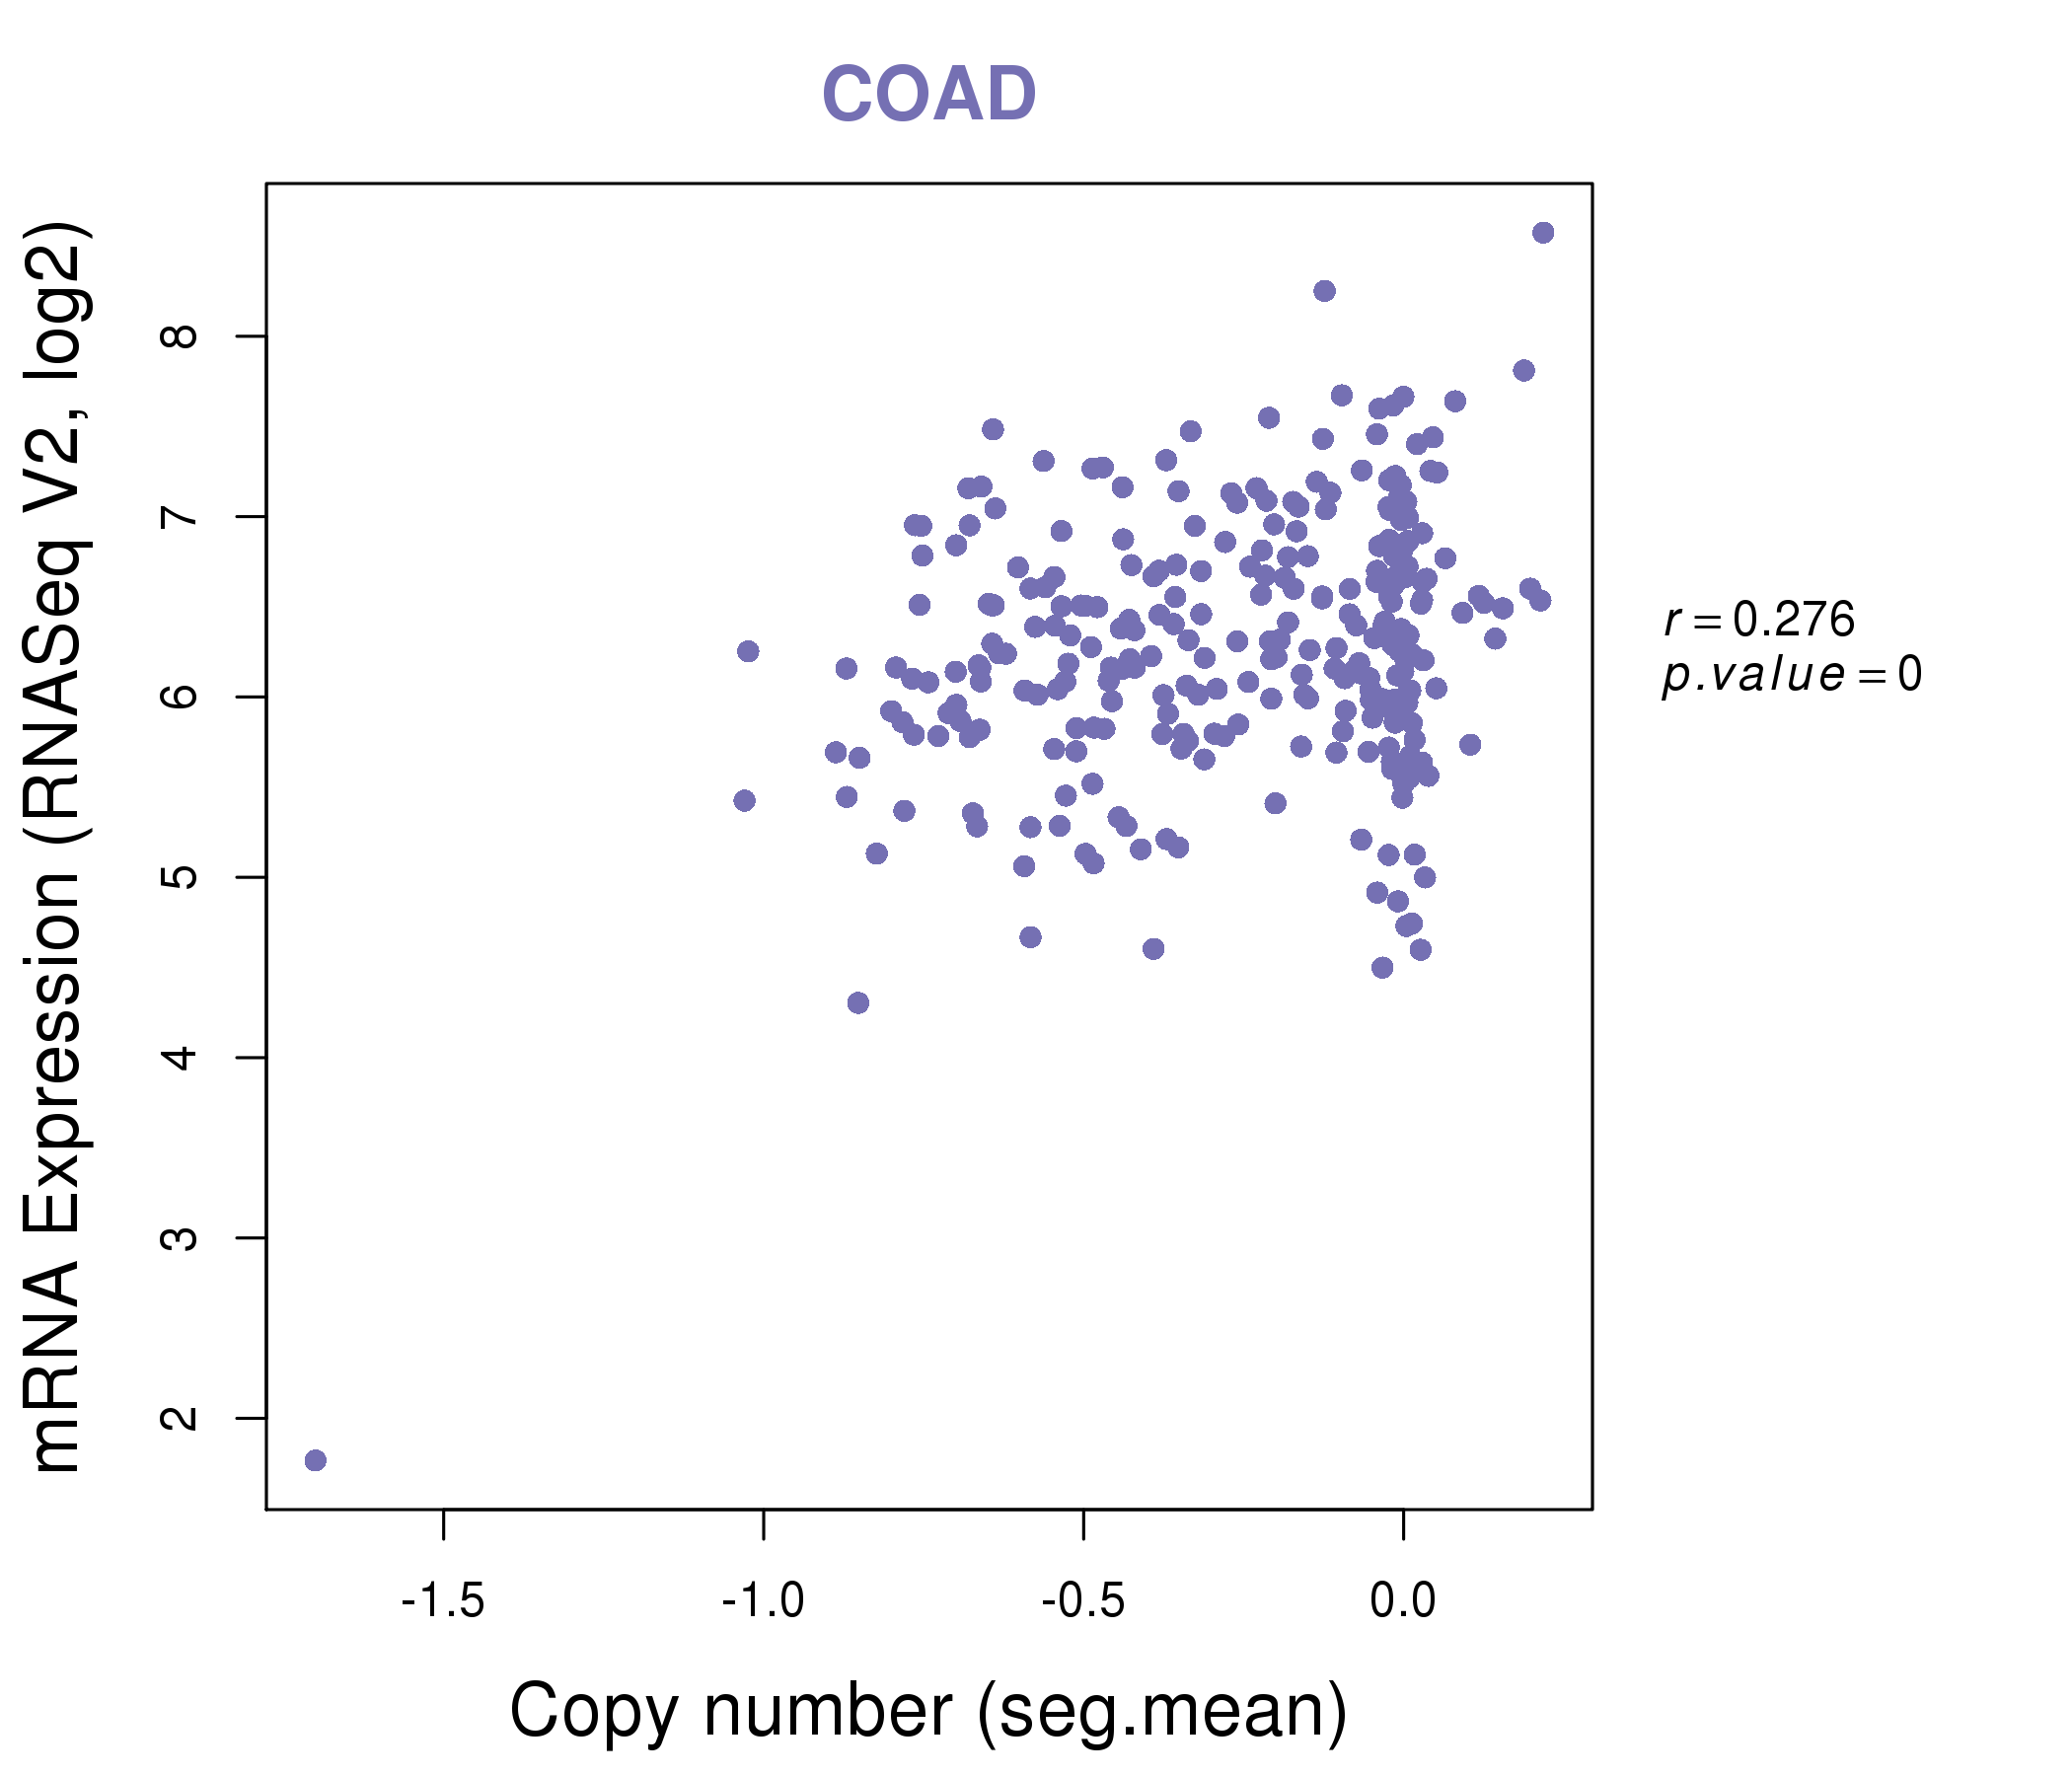
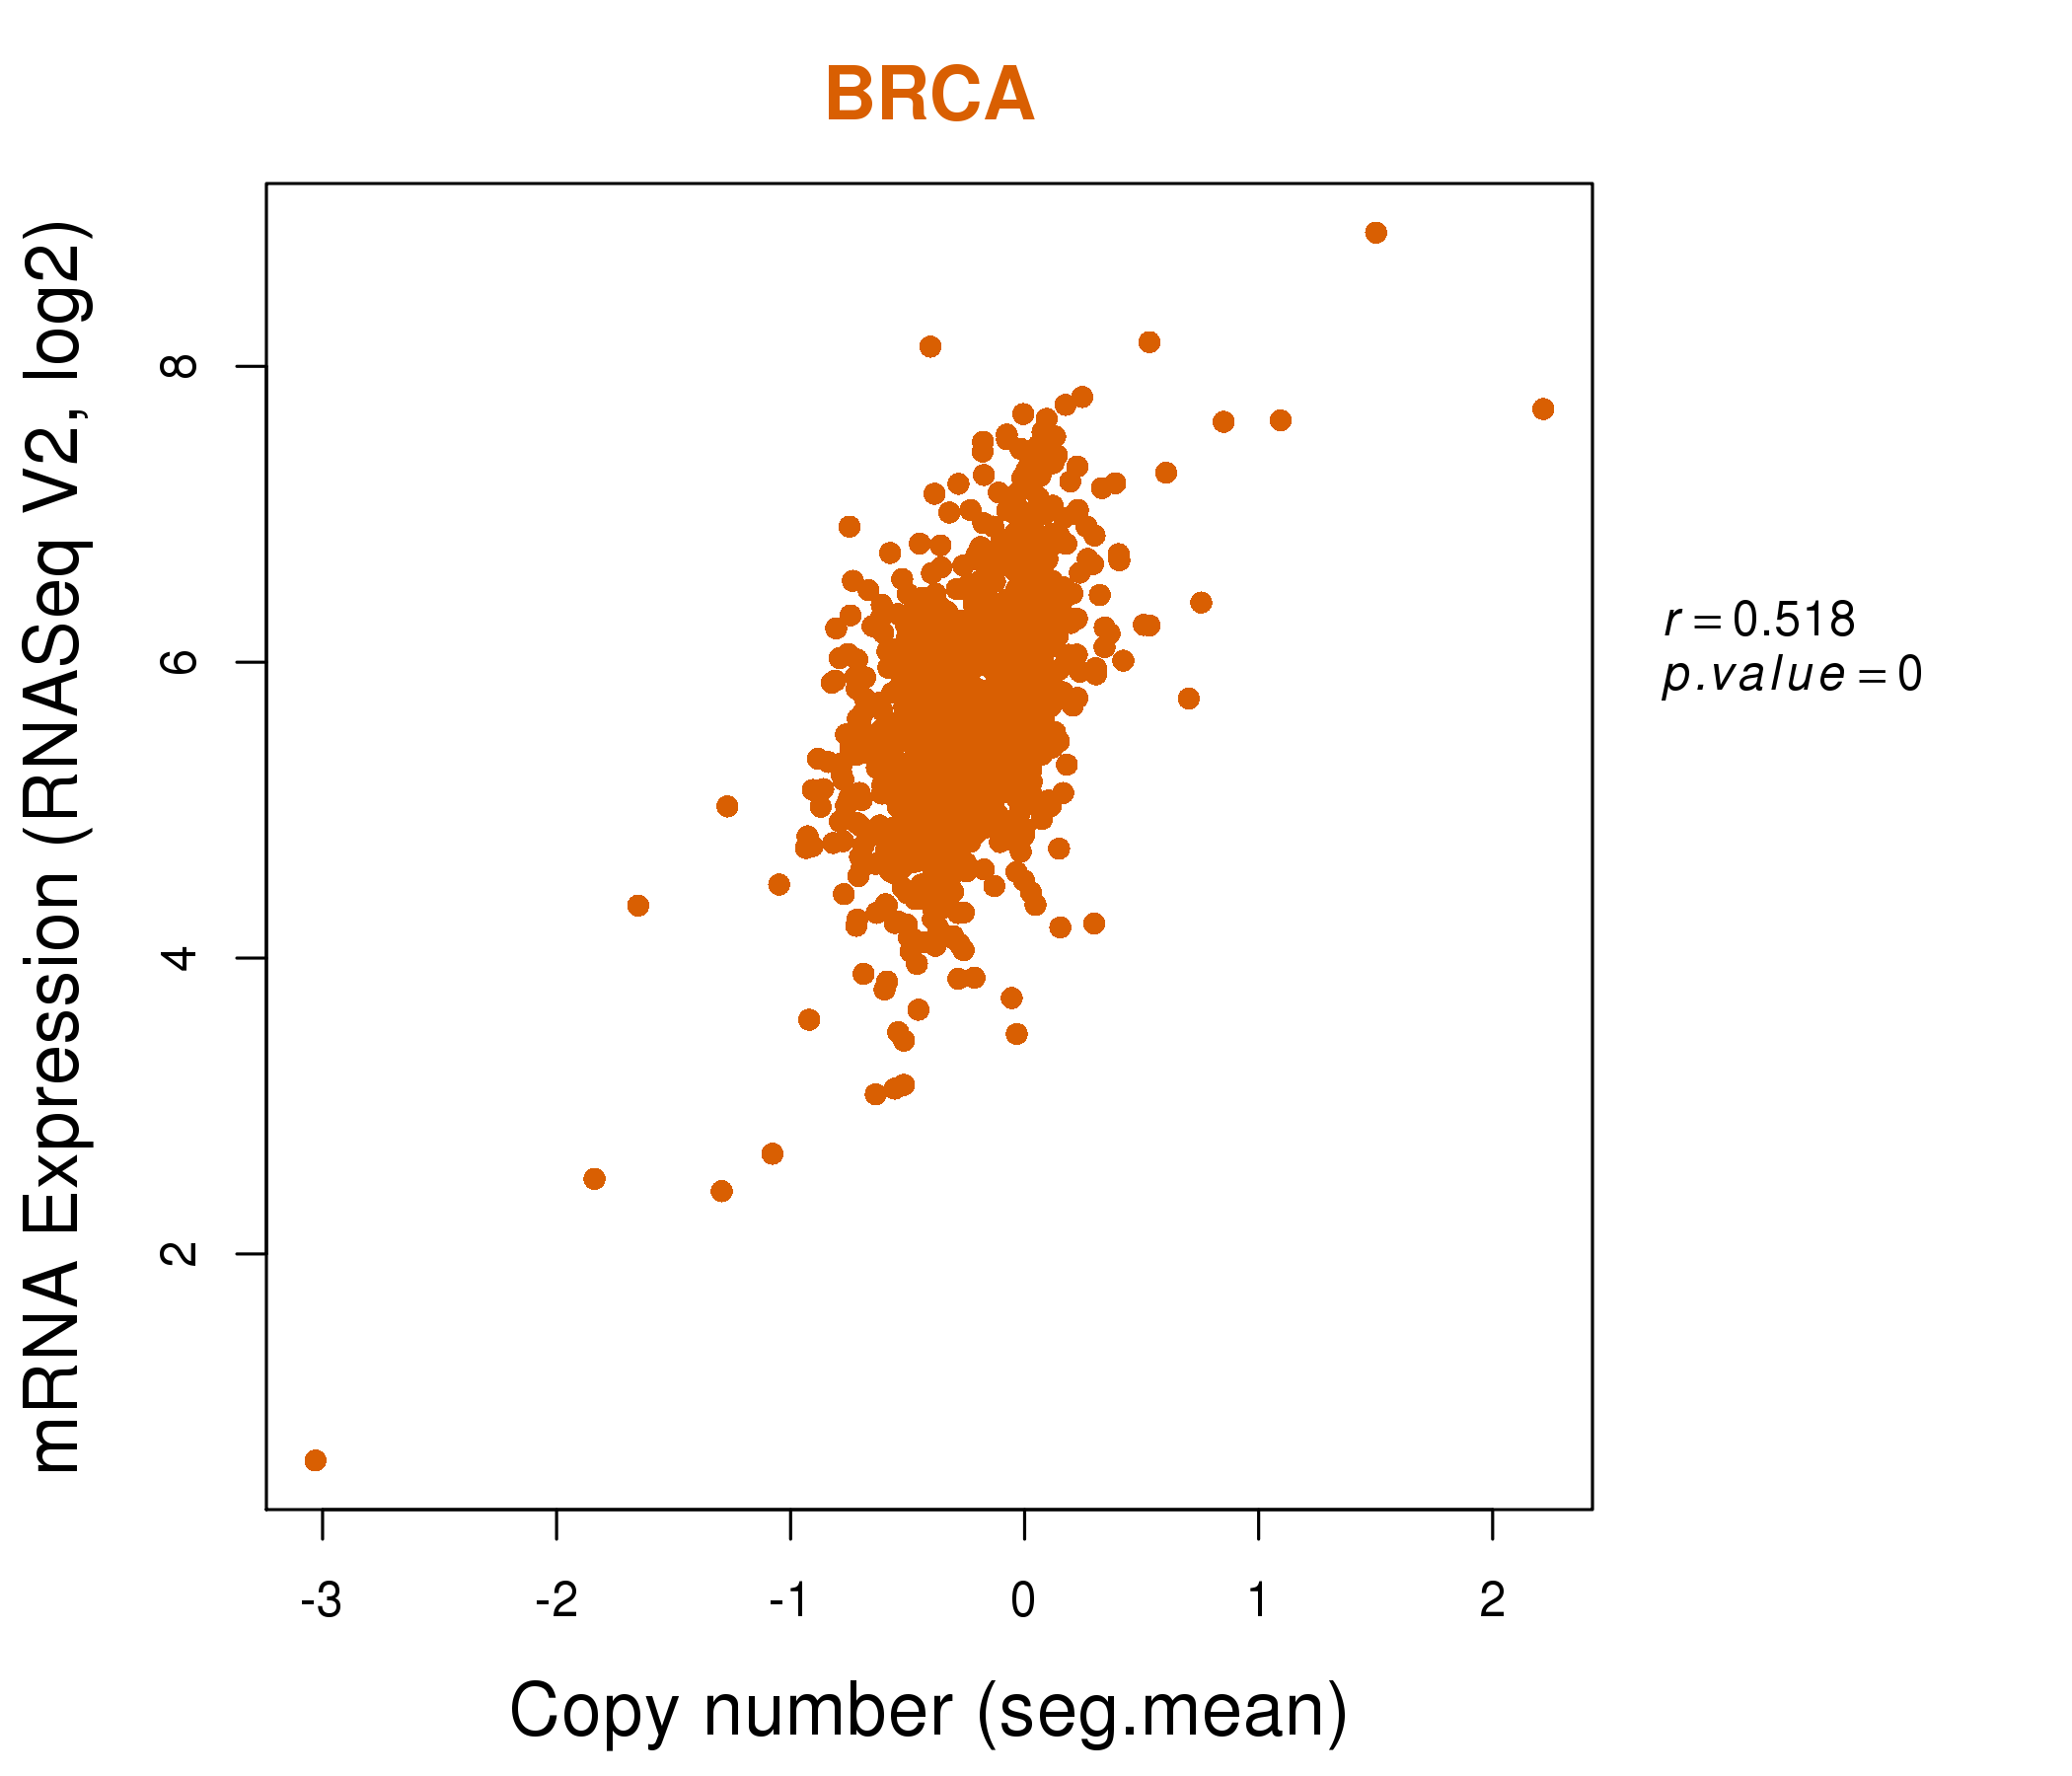
| * This plots show the correlation between CNV and gene expression. |
: Open all plots for all cancer types
 |
|
 |
|
| Top |
| Gene-Gene Network Information |
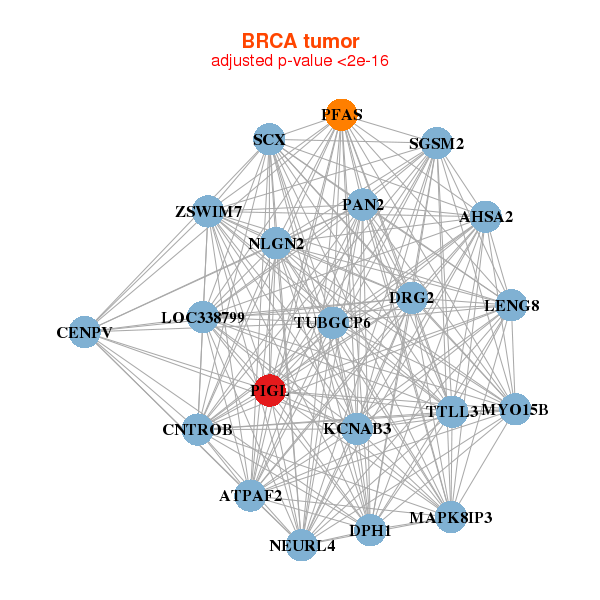
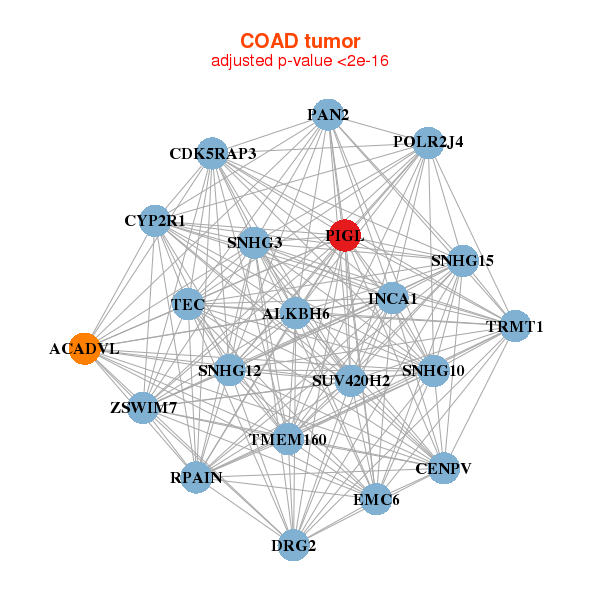
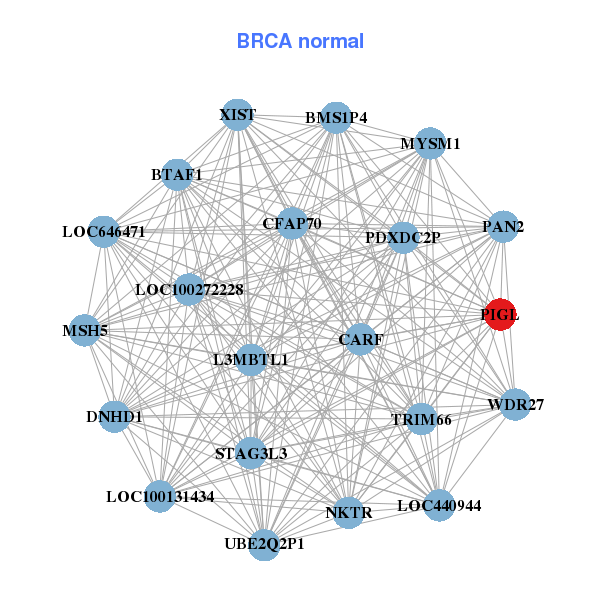
| * Co-Expression network figures were drawn using R package igraph. Only the top 20 genes with the highest correlations were shown. Red circle: input gene, orange circle: cell metabolism gene, sky circle: other gene |
: Open all plots for all cancer types
 |
|
| AHSA2,ATPAF2,CENPV,CNTROB,DPH1,DRG2,KCNAB3, LENG8,LOC338799,MAPK8IP3,MYO15B,NEURL4,NLGN2,PAN2, PFAS,PIGL,SCX,SGSM2,TTLL3,TUBGCP6,ZSWIM7 | CARF,BMS1P4,BTAF1,DNHD1,L3MBTL1,LOC100131434,LOC100272228, LOC440944,LOC646471,MSH5,MYSM1,NKTR,PAN2,PDXDC2P, PIGL,STAG3L3,TRIM66,CFAP70,UBE2Q2P1,WDR27,XIST |
 |
|
| ACADVL,ALKBH6,SNHG15,CDK5RAP3,CENPV,CYP2R1,DRG2, INCA1,PAN2,PIGL,POLR2J4,RPAIN,SNHG10,SNHG12, SNHG3,SUV420H2,TEC,TMEM160,EMC6,TRMT1,ZSWIM7 | RSRP1,CAPN10,CDK5RAP3,CHKB-CPT1B,GIPR,CLUHP3,KIFC2, LOC100131434,LOC100272228,LOC642846,NAA40,NOXA1,NSUN5P1,NSUN5P2, PDXDC2P,PIGL,PLEKHM1P,RHOT2,SNHG12,ZNF276,ZNF513 |
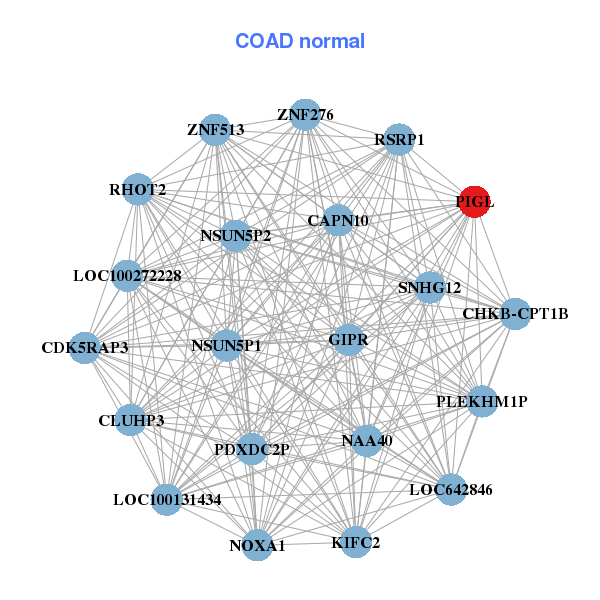
| * Co-Expression network figures were drawn using R package igraph. Only the top 20 genes with the highest correlations were shown. Red circle: input gene, orange circle: cell metabolism gene, sky circle: other gene |
: Open all plots for all cancer types
| Top |
: Open all interacting genes' information including KEGG pathway for all interacting genes from DAVID
| Top |
| Pharmacological Information for PIGL |
| There's no related Drug. |
| Top |
| Cross referenced IDs for PIGL |
| * We obtained these cross-references from Uniprot database. It covers 150 different DBs, 18 categories. http://www.uniprot.org/help/cross_references_section |
: Open all cross reference information
|
Copyright © 2016-Present - The Univsersity of Texas Health Science Center at Houston @ |