|
||||||||||||||||||||||||||||||||||||||||||||||||||||||||||||||||||||||||||||||||||||||||||||||||||||||||||||||||||||||||||||||||||||||||||||||||||||||||||||||||||||||||||||||||||||||||||||||||||||||||||||||||||||||||||||||||||||||||||||||||||||||||||||||||||||||||||||||||||||||||||||||||||||||||||||||||||||||||||
| |
| Phenotypic Information (metabolism pathway, cancer, disease, phenome) |
| |
| |
| Gene-Gene Network Information: Co-Expression Network, Interacting Genes & KEGG |
| |
|


| Gene Summary for PSMF1 |
| Top |
| Phenotypic Information for PSMF1(metabolism pathway, cancer, disease, phenome) |
| Cancer | CGAP: PSMF1 |
| Familial Cancer Database: PSMF1 | |
| * This gene is included in those cancer gene databases. |
|
|
|
|
|
| . | ||||||||||||||||||||||||||||||||||||||||||||||||||||||||||||||||||||||||||||||||||||||||||||||||||||||||||||||||||||||||||||||||||||||||||||||||||||||||||||||||||||||||||||||||||||||||||||||||||||||||||||||||||||||||||||||||||||||||||||||||||||||||||||||||||||||||||||||||||||||||||||||||||||||||||||||||||||
Oncogene 1 | Significant driver gene in | |||||||||||||||||||||||||||||||||||||||||||||||||||||||||||||||||||||||||||||||||||||||||||||||||||||||||||||||||||||||||||||||||||||||||||||||||||||||||||||||||||||||||||||||||||||||||||||||||||||||||||||||||||||||||||||||||||||||||||||||||||||||||||||||||||||||||||||||||||||||||||||||||||||||||||||||||||||||||
| cf) number; DB name 1 Oncogene; http://nar.oxfordjournals.org/content/35/suppl_1/D721.long, 2 Tumor Suppressor gene; https://bioinfo.uth.edu/TSGene/, 3 Cancer Gene Census; http://www.nature.com/nrc/journal/v4/n3/abs/nrc1299.html, 4 CancerGenes; http://nar.oxfordjournals.org/content/35/suppl_1/D721.long, 5 Network of Cancer Gene; http://ncg.kcl.ac.uk/index.php, 1Therapeutic Vulnerabilities in Cancer; http://cbio.mskcc.org/cancergenomics/statius/ |
| REACTOME_METABOLISM_OF_AMINO_ACIDS_AND_DERIVATIVES REACTOME_METABOLISM_OF_MRNA REACTOME_METABOLISM_OF_RNA | |
| OMIM | |
| Orphanet | |
| Disease | KEGG Disease: PSMF1 |
| MedGen: PSMF1 (Human Medical Genetics with Condition) | |
| ClinVar: PSMF1 | |
| Phenotype | MGI: PSMF1 (International Mouse Phenotyping Consortium) |
| PhenomicDB: PSMF1 | |
| Mutations for PSMF1 |
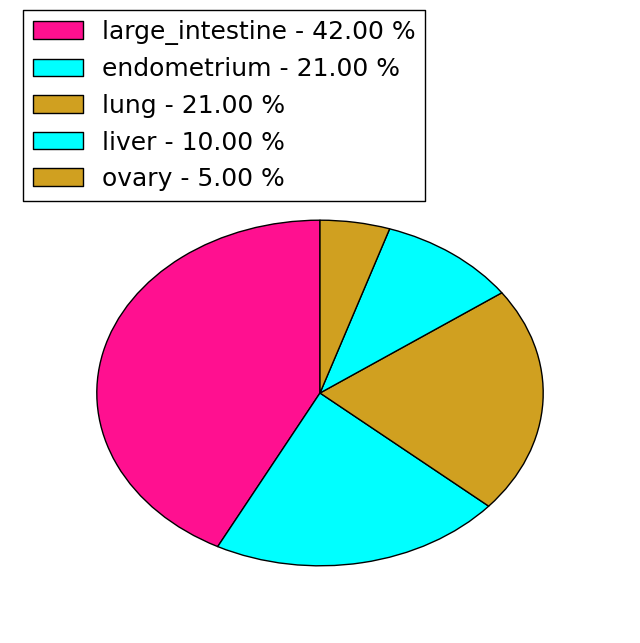
| * Under tables are showing count per each tissue to give us broad intuition about tissue specific mutation patterns.You can go to the detailed page for each mutation database's web site. |
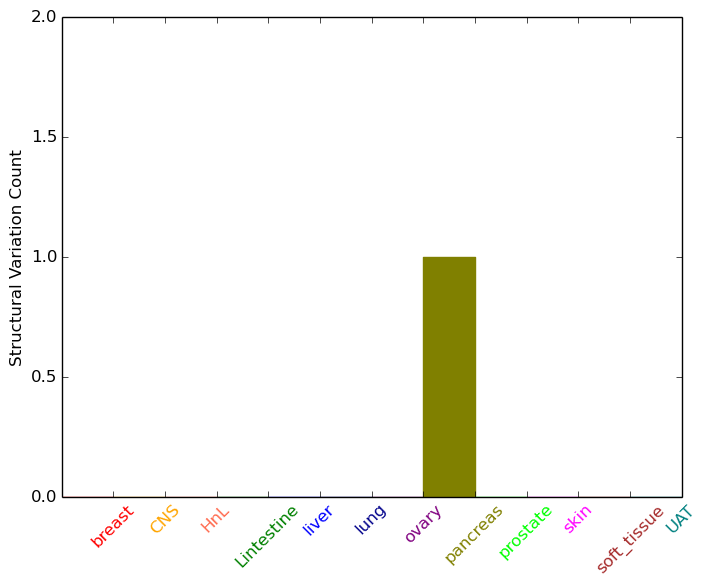
| - Statistics for Tissue and Mutation type | Top |
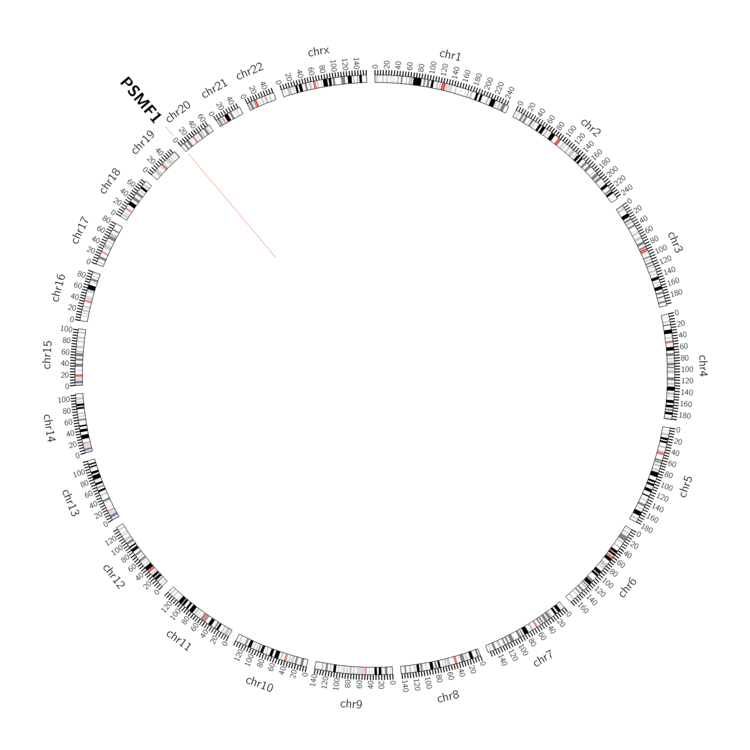 |
| - For Inter-chromosomal Variations |
| There's no inter-chromosomal structural variation. |
| - For Intra-chromosomal Variations |
| * Intra-chromosomal variantions includes 'intrachromosomal amplicon to amplicon', 'intrachromosomal amplicon to non-amplified dna', 'intrachromosomal deletion', 'intrachromosomal fold-back inversion', 'intrachromosomal inversion', 'intrachromosomal tandem duplication', 'Intrachromosomal unknown type', 'intrachromosomal with inverted orientation', 'intrachromosomal with non-inverted orientation'. |
 |
| Sample | Symbol_a | Chr_a | Start_a | End_a | Symbol_b | Chr_b | Start_b | End_b |
| pancreas | PSMF1 | chr20 | 1130614 | 1130814 | PSMF1 | chr20 | 1130466 | 1130666 |
| cf) Tissue number; Tissue name (1;Breast, 2;Central_nervous_system, 3;Haematopoietic_and_lymphoid_tissue, 4;Large_intestine, 5;Liver, 6;Lung, 7;Ovary, 8;Pancreas, 9;Prostate, 10;Skin, 11;Soft_tissue, 12;Upper_aerodigestive_tract) |
| * From mRNA Sanger sequences, Chitars2.0 arranged chimeric transcripts. This table shows PSMF1 related fusion information. |
| ID | Head Gene | Tail Gene | Accession | Gene_a | qStart_a | qEnd_a | Chromosome_a | tStart_a | tEnd_a | Gene_a | qStart_a | qEnd_a | Chromosome_a | tStart_a | tEnd_a |
| AW170550 | CLTB | 1 | 56 | 5 | 175843305 | 175843360 | PSMF1 | 54 | 470 | 20 | 1115795 | 1145721 | |
| AI418115 | FAIM3 | 83 | 102 | 1 | 207080440 | 207080459 | PSMF1 | 102 | 403 | 20 | 1145725 | 1146026 | |
| AA309217 | RGL1 | 53 | 75 | 1 | 183843614 | 183843636 | PSMF1 | 68 | 420 | 20 | 1102599 | 1102943 | |
| BP249774 | SGTA | 1 | 328 | 19 | 2767162 | 2783271 | PSMF1 | 319 | 588 | 20 | 1145342 | 1145610 | |
| Top |
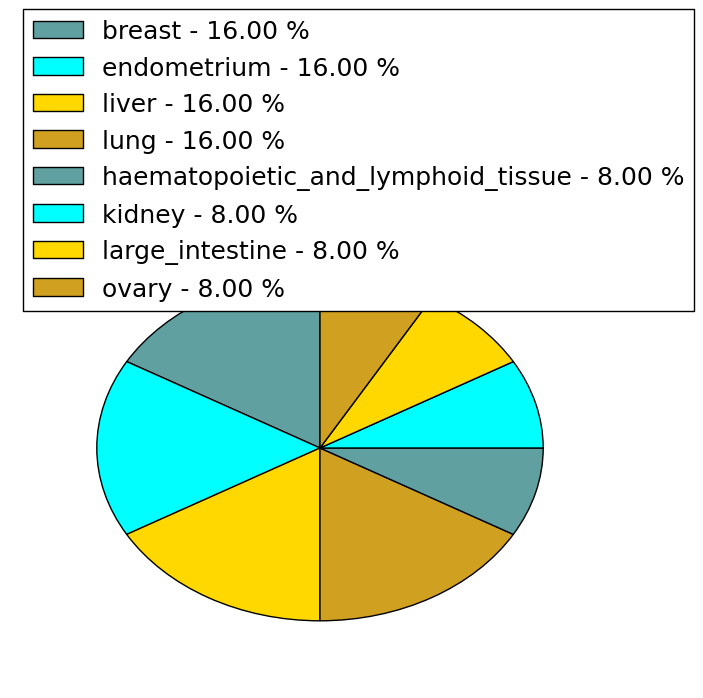
| Mutation type/ Tissue ID | brca | cns | cerv | endome | haematopo | kidn | Lintest | liver | lung | ns | ovary | pancre | prost | skin | stoma | thyro | urina | |||
| Total # sample | 1 | 1 | ||||||||||||||||||
| GAIN (# sample) | 1 | 1 | ||||||||||||||||||
| LOSS (# sample) |
| cf) Tissue ID; Tissue type (1; Breast, 2; Central_nervous_system, 3; Cervix, 4; Endometrium, 5; Haematopoietic_and_lymphoid_tissue, 6; Kidney, 7; Large_intestine, 8; Liver, 9; Lung, 10; NS, 11; Ovary, 12; Pancreas, 13; Prostate, 14; Skin, 15; Stomach, 16; Thyroid, 17; Urinary_tract) |
| Top |
|
 |
| Top |
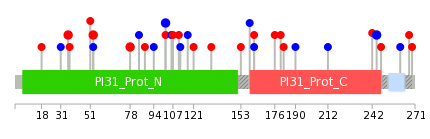
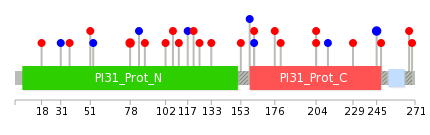
| Stat. for Non-Synonymous SNVs (# total SNVs=19) | (# total SNVs=12) |
 |  |
(# total SNVs=0) | (# total SNVs=0) |
| Top |
| * When you move the cursor on each content, you can see more deailed mutation information on the Tooltip. Those are primary_site,primary_histology,mutation(aa),pubmedID. |
| GRCh37 position | Mutation(aa) | Unique sampleID count |
| chr20:1106168-1106168 | p.L53M | 2 |
| chr20:1106243-1106243 | p.L78F | 2 |
| chr20:1145091-1145091 | p.P245P | 2 |
| chr20:1108092-1108092 | p.A102A | 2 |
| chr20:1099523-1099523 | p.F36C | 2 |
| chr20:1115924-1115924 | p.P176S | 1 |
| chr20:1099525-1099525 | p.G37C | 1 |
| chr20:1108107-1108107 | p.N107K | 1 |
| chr20:1115936-1115936 | p.R180W | 1 |
| chr20:1106163-1106163 | p.S51L | 1 |
| Top |
|
 |
| Point Mutation/ Tissue ID | 1 | 2 | 3 | 4 | 5 | 6 | 7 | 8 | 9 | 10 | 11 | 12 | 13 | 14 | 15 | 16 | 17 | 18 | 19 | 20 |
| # sample | 1 | 1 | 6 | 2 | 1 | 4 | 2 | 2 | 1 | 3 | 5 | |||||||||
| # mutation | 1 | 1 | 6 | 2 | 1 | 4 | 4 | 2 | 1 | 3 | 6 | |||||||||
| nonsynonymous SNV | 1 | 6 | 2 | 4 | 2 | 1 | 2 | 4 | ||||||||||||
| synonymous SNV | 1 | 1 | 2 | 1 | 1 | 1 | 2 |
| cf) Tissue ID; Tissue type (1; BLCA[Bladder Urothelial Carcinoma], 2; BRCA[Breast invasive carcinoma], 3; CESC[Cervical squamous cell carcinoma and endocervical adenocarcinoma], 4; COAD[Colon adenocarcinoma], 5; GBM[Glioblastoma multiforme], 6; Glioma Low Grade, 7; HNSC[Head and Neck squamous cell carcinoma], 8; KICH[Kidney Chromophobe], 9; KIRC[Kidney renal clear cell carcinoma], 10; KIRP[Kidney renal papillary cell carcinoma], 11; LAML[Acute Myeloid Leukemia], 12; LUAD[Lung adenocarcinoma], 13; LUSC[Lung squamous cell carcinoma], 14; OV[Ovarian serous cystadenocarcinoma ], 15; PAAD[Pancreatic adenocarcinoma], 16; PRAD[Prostate adenocarcinoma], 17; SKCM[Skin Cutaneous Melanoma], 18:STAD[Stomach adenocarcinoma], 19:THCA[Thyroid carcinoma], 20:UCEC[Uterine Corpus Endometrial Carcinoma]) |
| Top |
| * We represented just top 10 SNVs. When you move the cursor on each content, you can see more deailed mutation information on the Tooltip. Those are primary_site, primary_histology, mutation(aa), pubmedID. |
| Genomic Position | Mutation(aa) | Unique sampleID count |
| chr20:1145091 | p.L78F,PSMF1 | 2 |
| chr20:1106243 | p.P245P,PSMF1 | 2 |
| chr20:1145042 | p.S153I,PSMF1 | 1 |
| chr20:1106163 | p.P159P,PSMF1 | 1 |
| chr20:1115795 | p.R18S,PSMF1 | 1 |
| chr20:1106170 | p.T162I,PSMF1 | 1 |
| chr20:1115856 | p.V31V,PSMF1 | 1 |
| chr20:1145099 | p.T162T,PSMF1 | 1 |
| chr20:1115875 | p.G37C,PSMF1 | 1 |
| chr20:1145707 | p.P176S,PSMF1 | 1 |
| * Copy number data were extracted from TCGA using R package TCGA-Assembler. The URLs of all public data files on TCGA DCC data server were gathered on Jan-05-2015. Function ProcessCNAData in TCGA-Assembler package was used to obtain gene-level copy number value which is calculated as the average copy number of the genomic region of a gene. |
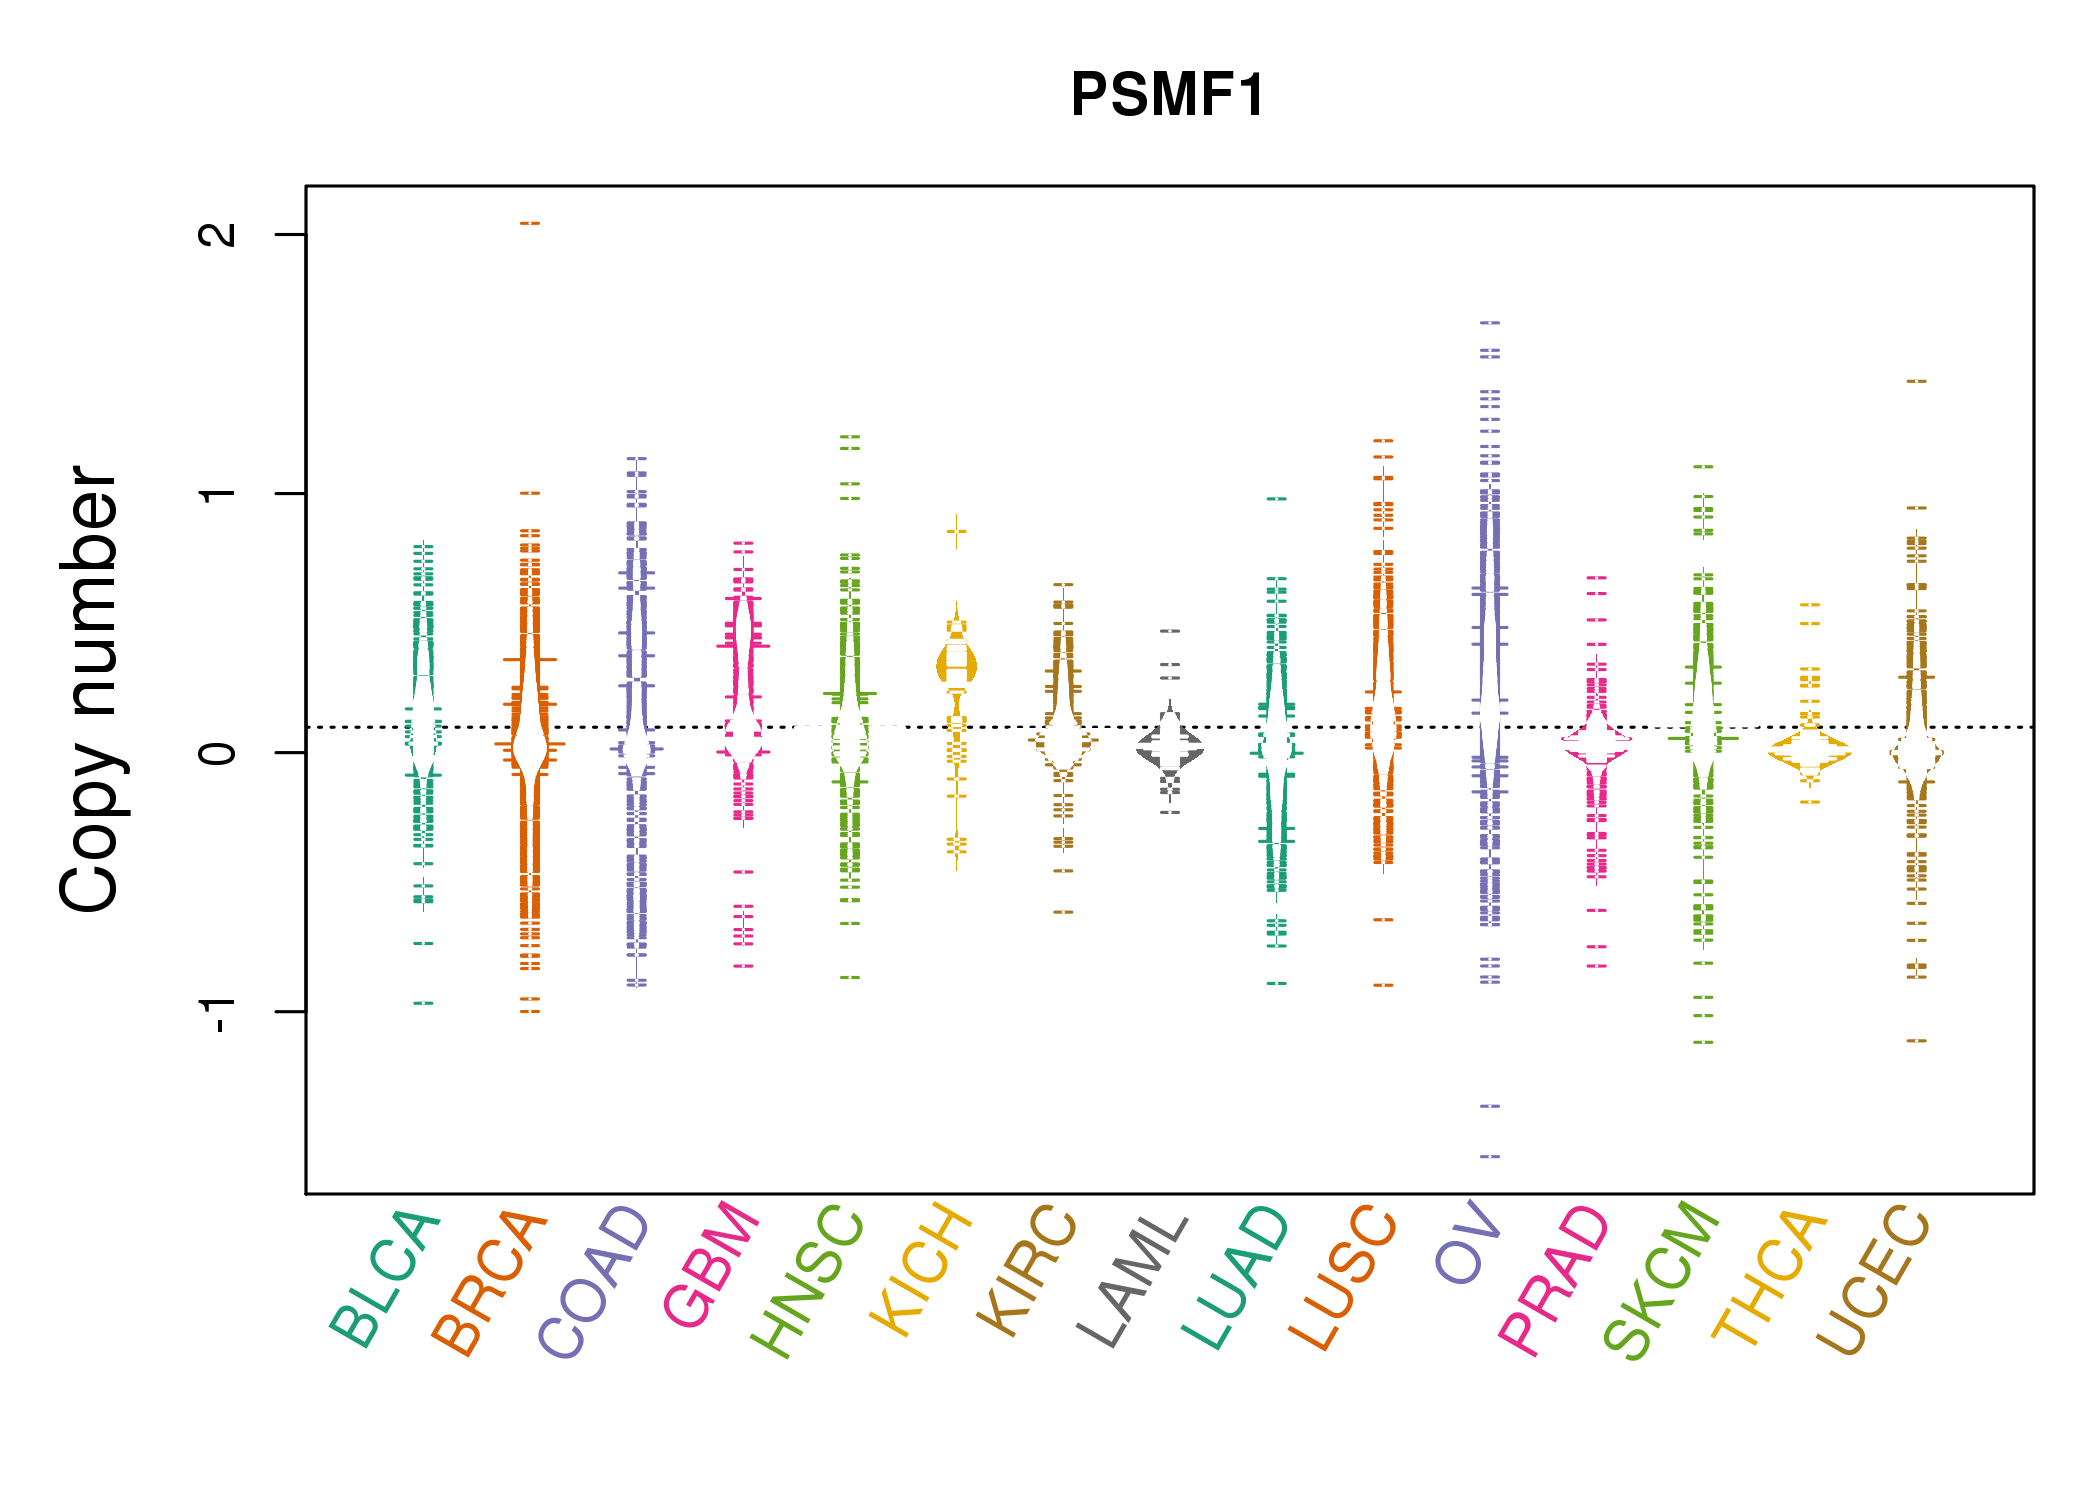 |
| cf) Tissue ID[Tissue type]: BLCA[Bladder Urothelial Carcinoma], BRCA[Breast invasive carcinoma], CESC[Cervical squamous cell carcinoma and endocervical adenocarcinoma], COAD[Colon adenocarcinoma], GBM[Glioblastoma multiforme], Glioma Low Grade, HNSC[Head and Neck squamous cell carcinoma], KICH[Kidney Chromophobe], KIRC[Kidney renal clear cell carcinoma], KIRP[Kidney renal papillary cell carcinoma], LAML[Acute Myeloid Leukemia], LUAD[Lung adenocarcinoma], LUSC[Lung squamous cell carcinoma], OV[Ovarian serous cystadenocarcinoma ], PAAD[Pancreatic adenocarcinoma], PRAD[Prostate adenocarcinoma], SKCM[Skin Cutaneous Melanoma], STAD[Stomach adenocarcinoma], THCA[Thyroid carcinoma], UCEC[Uterine Corpus Endometrial Carcinoma] |
| Top |
| Gene Expression for PSMF1 |
| * CCLE gene expression data were extracted from CCLE_Expression_Entrez_2012-10-18.res: Gene-centric RMA-normalized mRNA expression data. |
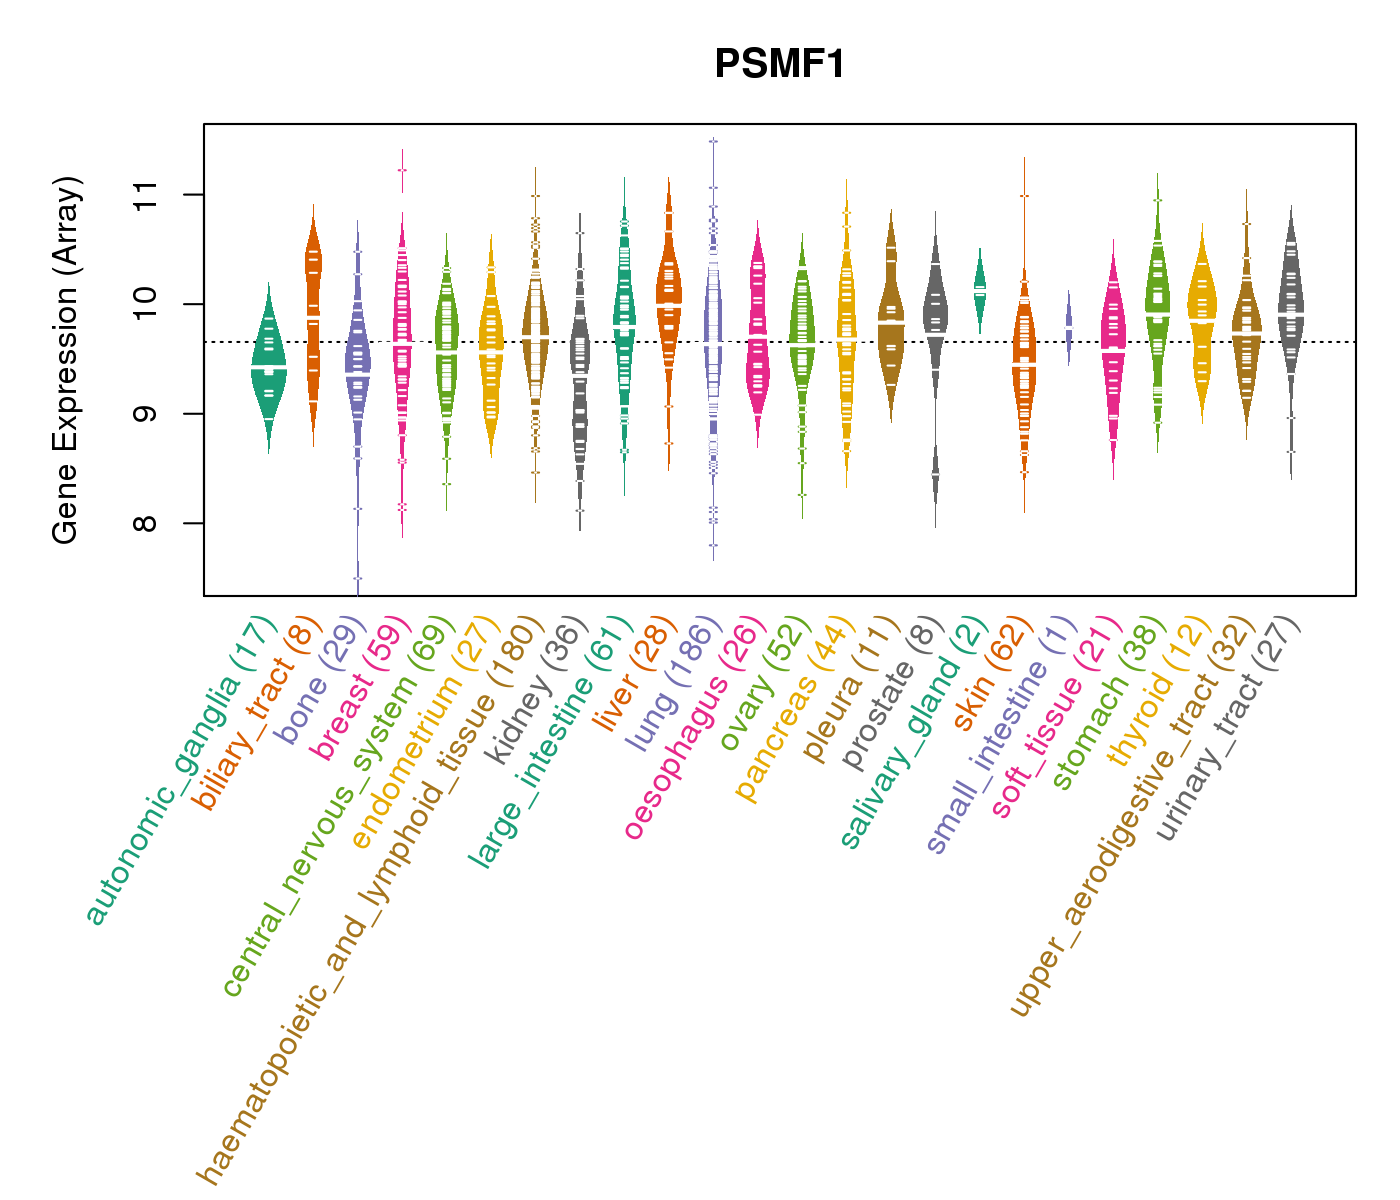 |
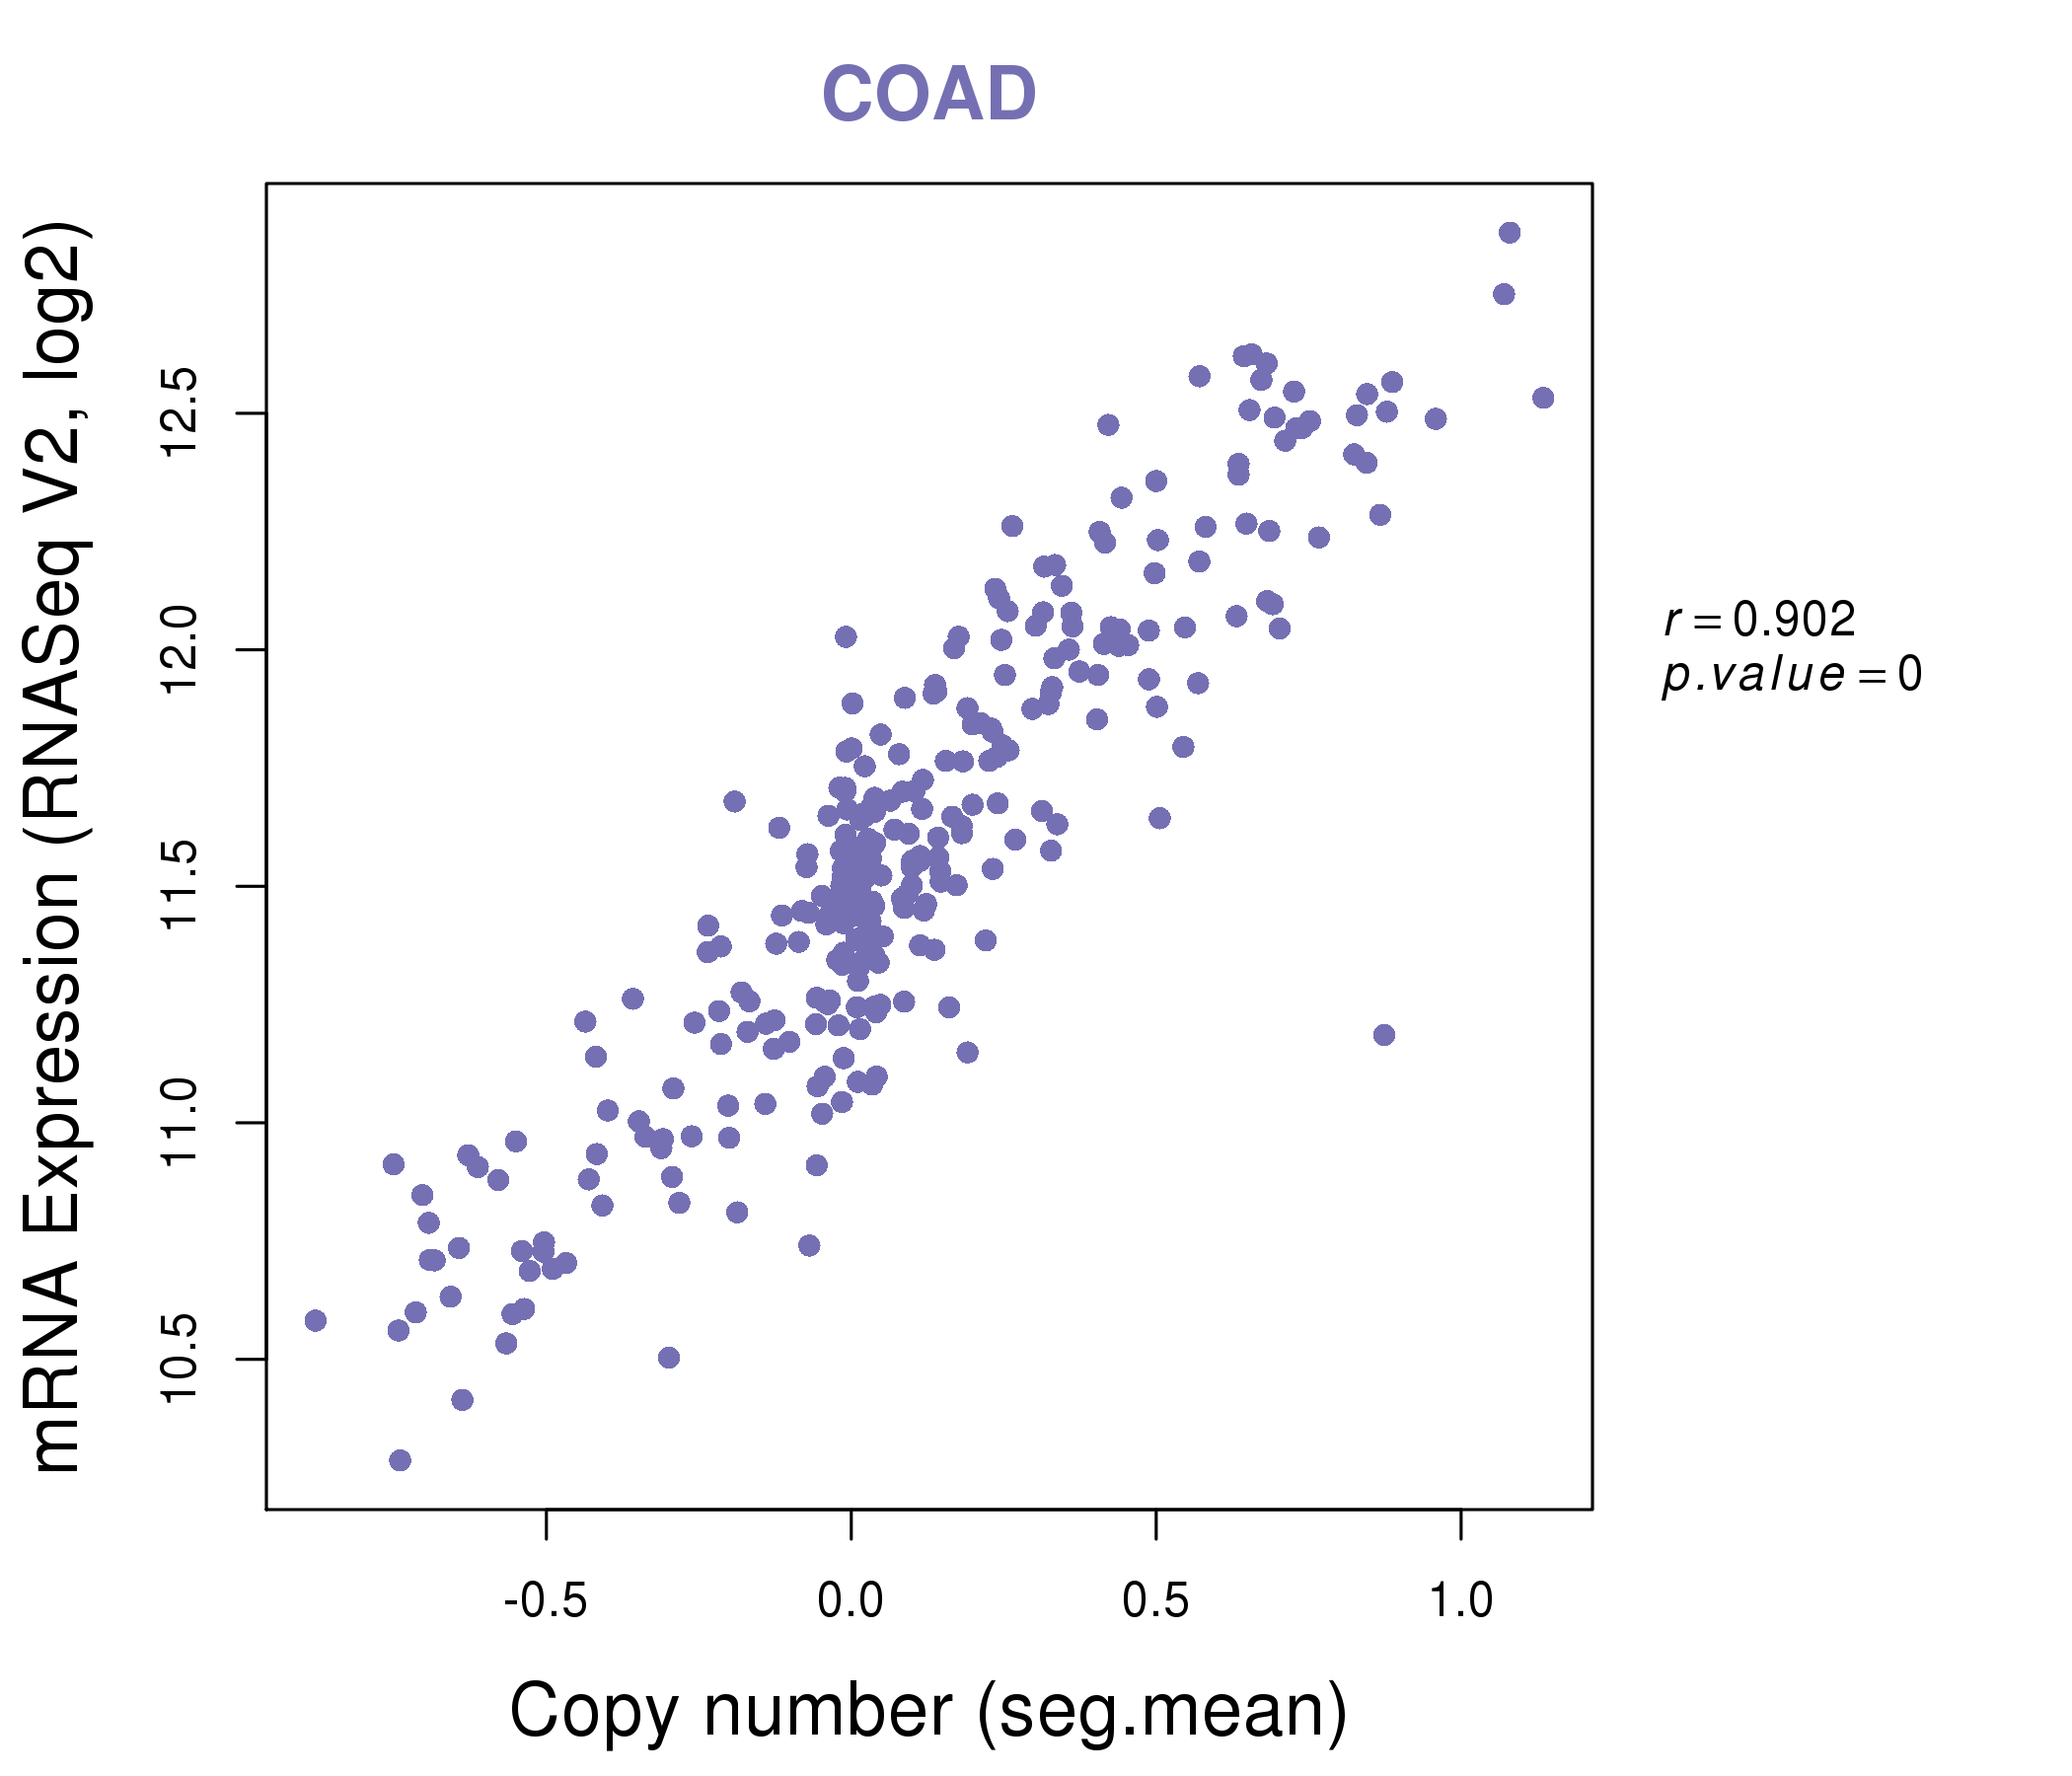
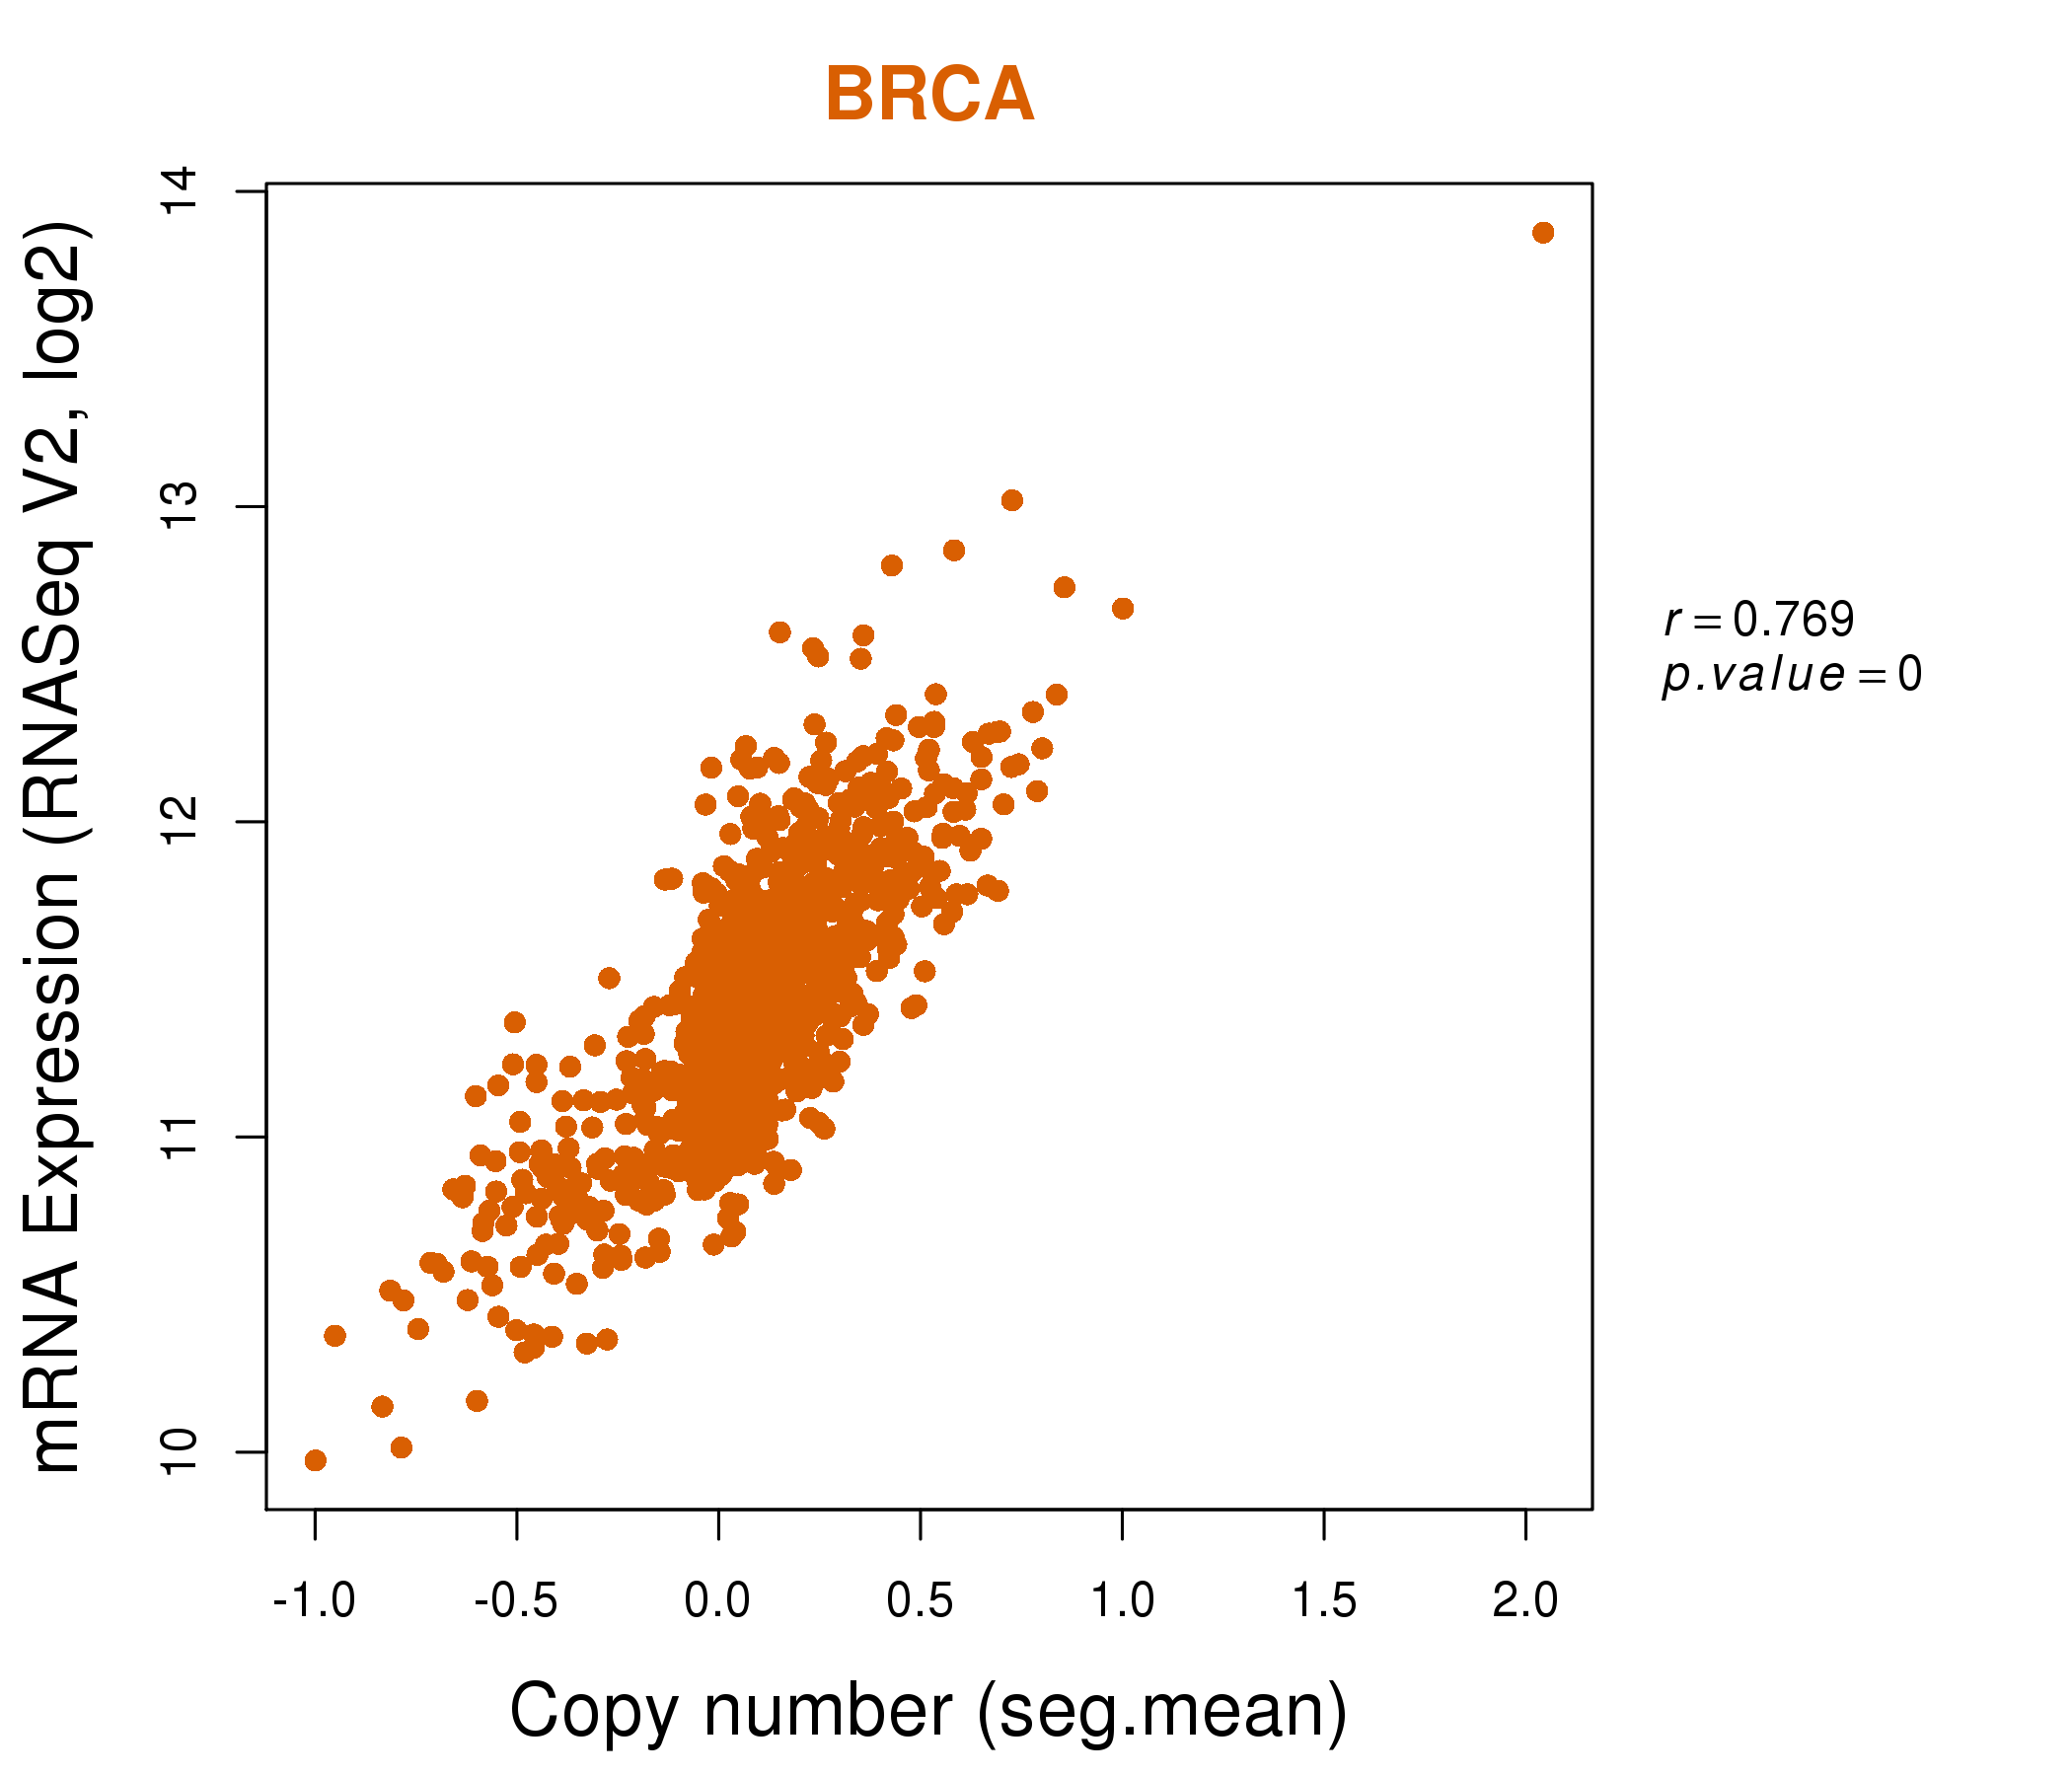
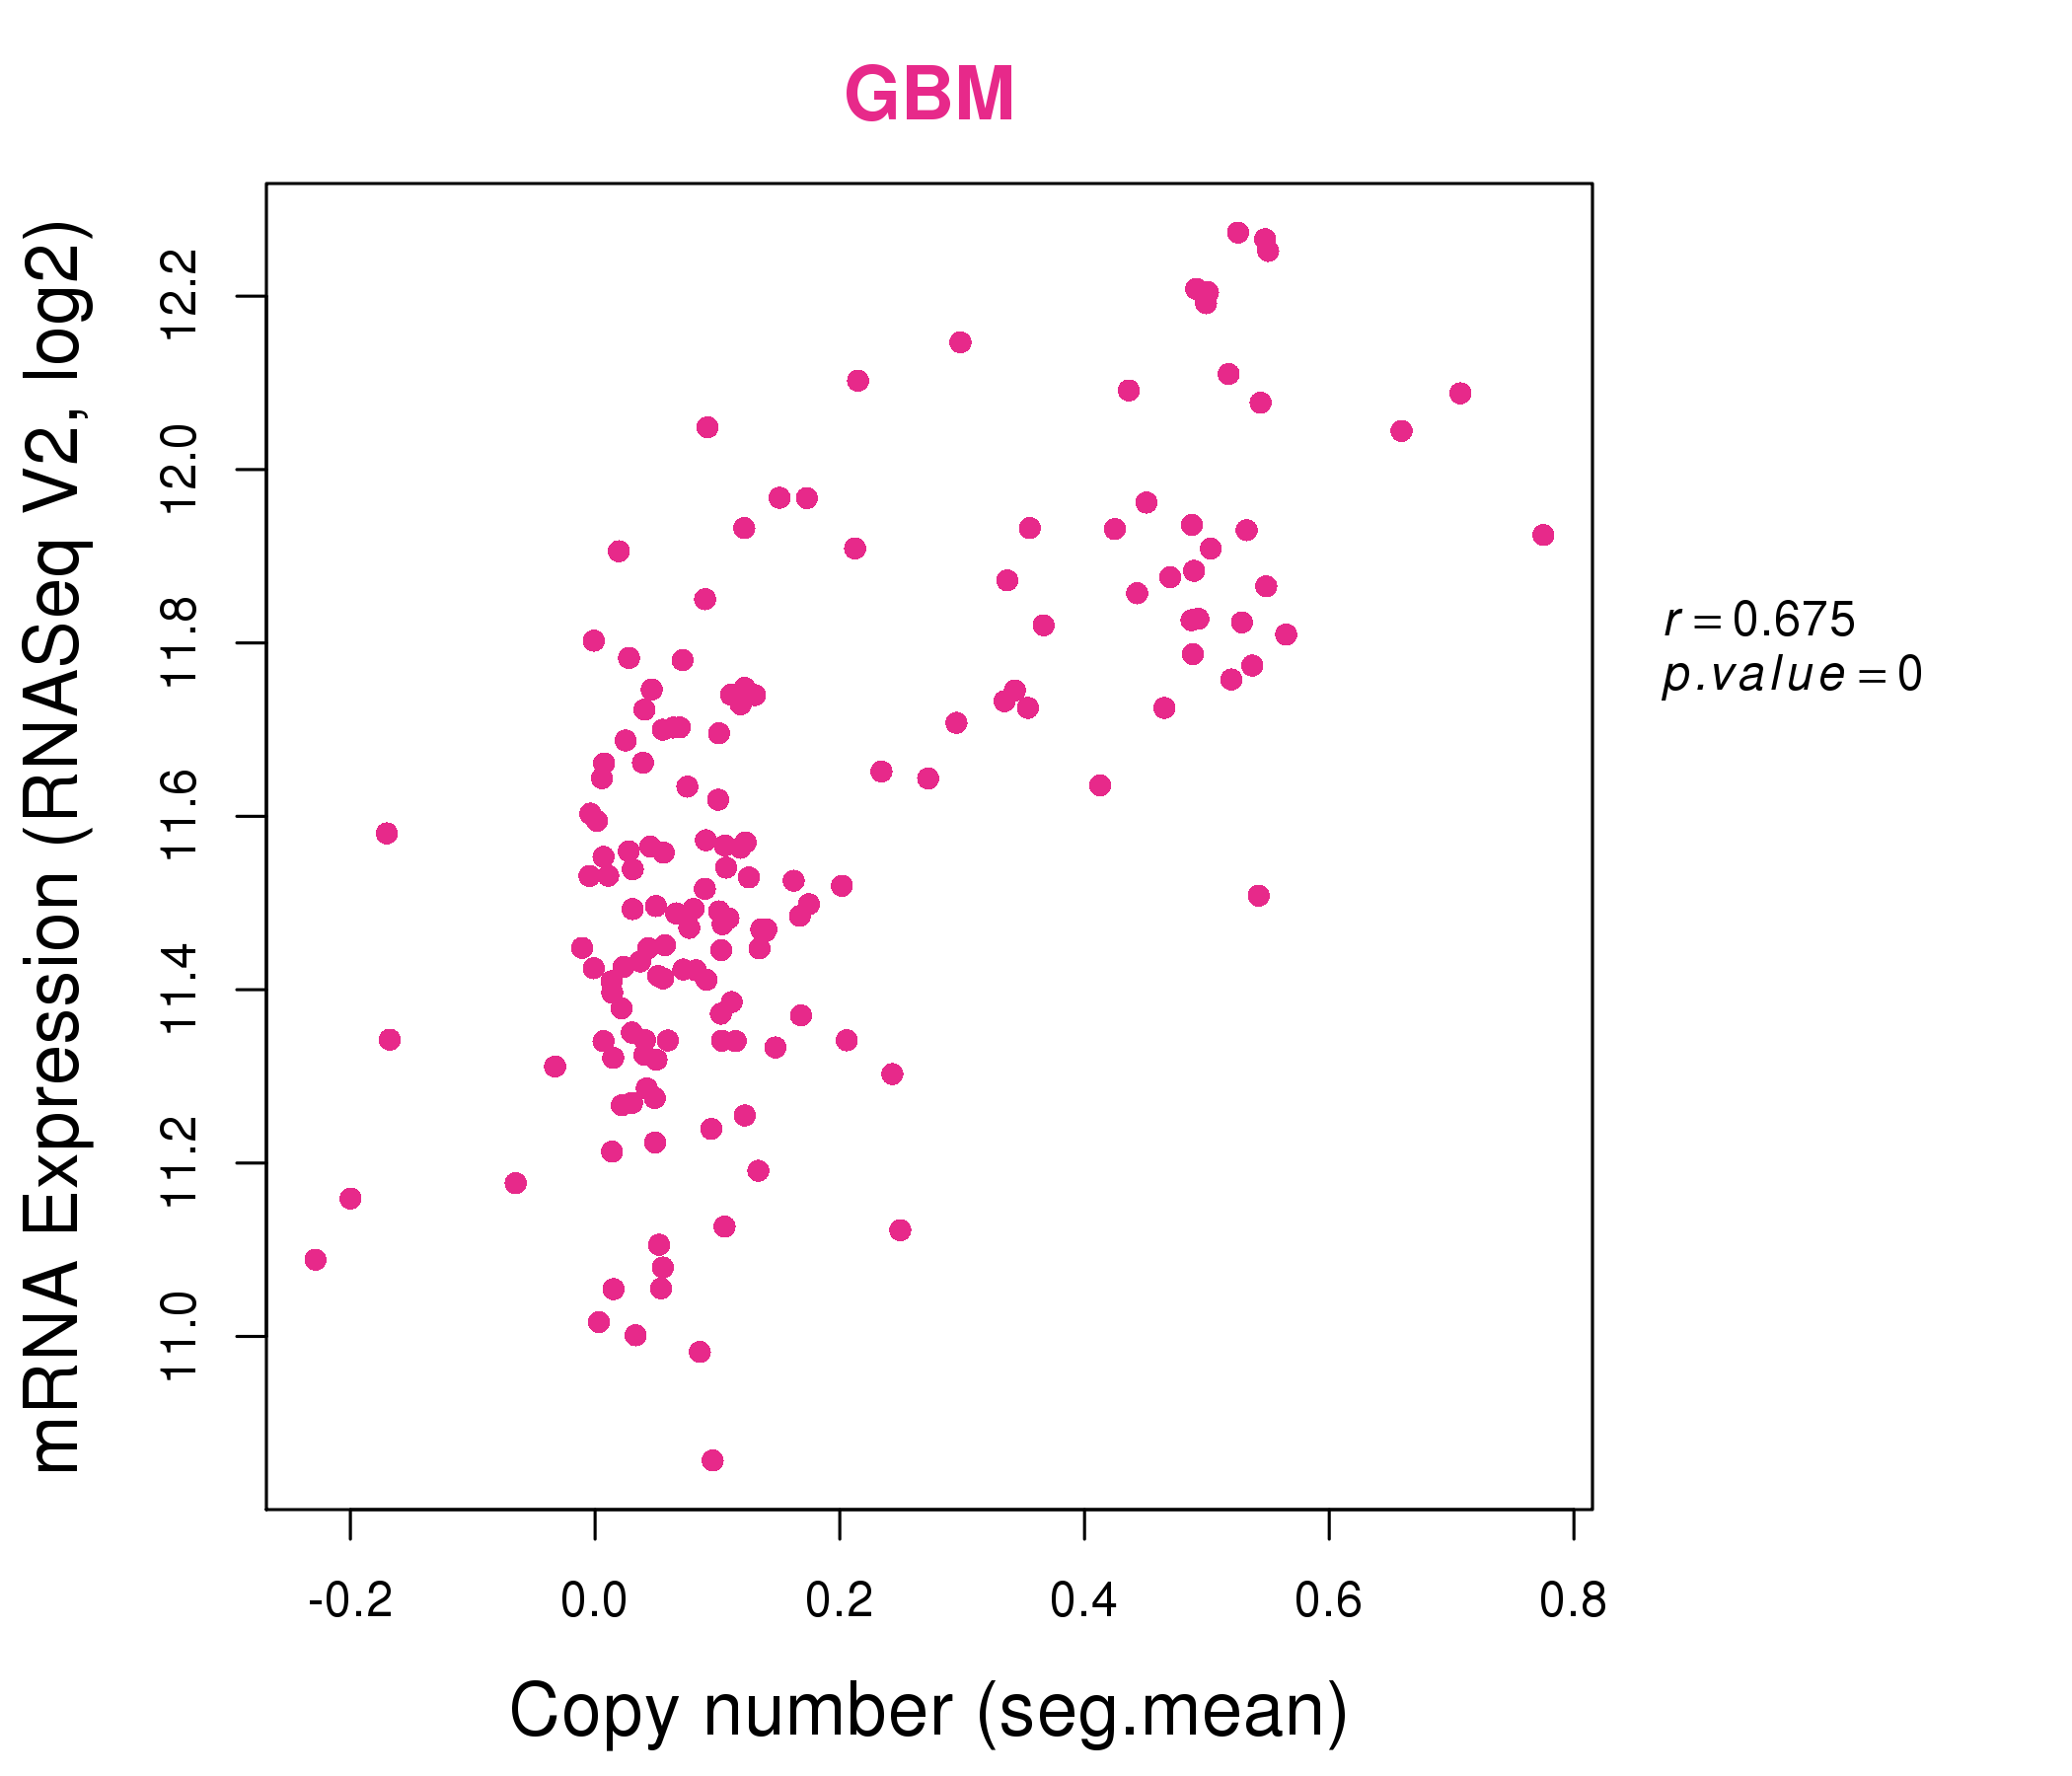
| * Normalized gene expression data of RNASeqV2 was extracted from TCGA using R package TCGA-Assembler. The URLs of all public data files on TCGA DCC data server were gathered at Jan-05-2015. Only eight cancer types have enough normal control samples for differential expression analysis. (t test, adjusted p<0.05 (using Benjamini-Hochberg FDR)) |
 |
| Top |
| * This plots show the correlation between CNV and gene expression. |
: Open all plots for all cancer types
 |
|
 |
|
| Top |
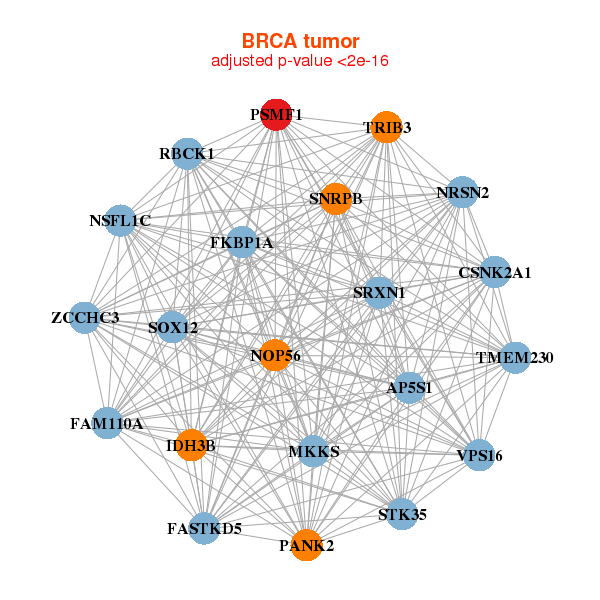
| Gene-Gene Network Information |
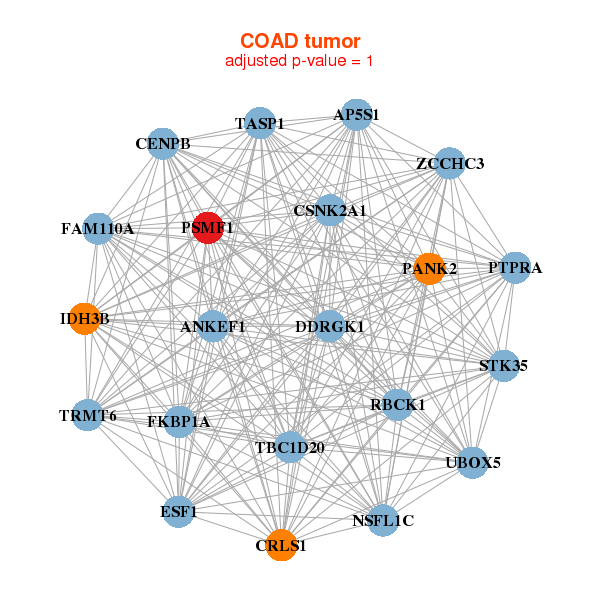
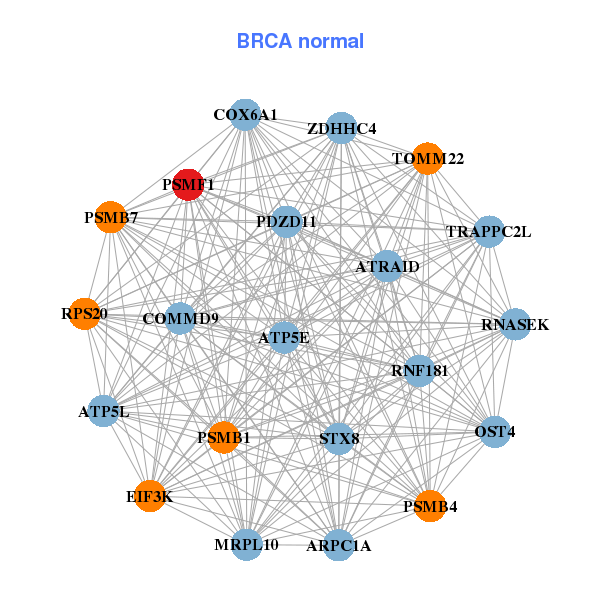
| * Co-Expression network figures were drawn using R package igraph. Only the top 20 genes with the highest correlations were shown. Red circle: input gene, orange circle: cell metabolism gene, sky circle: other gene |
: Open all plots for all cancer types
 |
|
| AP5S1,TMEM230,CSNK2A1,FAM110A,FASTKD5,FKBP1A,IDH3B, MKKS,NOP56,NRSN2,NSFL1C,PANK2,PSMF1,RBCK1, SNRPB,SOX12,SRXN1,STK35,TRIB3,VPS16,ZCCHC3 | ARPC1A,ATP5E,ATP5L,ATRAID,COMMD9,COX6A1,EIF3K, MRPL10,OST4,PDZD11,PSMB1,PSMB4,PSMB7,PSMF1, RNASEK,RNF181,RPS20,STX8,TOMM22,TRAPPC2L,ZDHHC4 |
 |
|
| ANKEF1,AP5S1,CENPB,CRLS1,CSNK2A1,DDRGK1,ESF1, FAM110A,FKBP1A,IDH3B,NSFL1C,PANK2,PSMF1,PTPRA, RBCK1,STK35,TASP1,TBC1D20,TRMT6,UBOX5,ZCCHC3 | ALKBH4,C12orf10,CCDC101,CUEDC2,DGCR6L,DRG2,EEF1D, EIF3G,ERCC1,PPIE,PSMF1,R3HCC1,RAD23A,RPL12, SIRT2,THOC5,TIMM22,UBL7,UBXN1,VPS72,WDR83 |
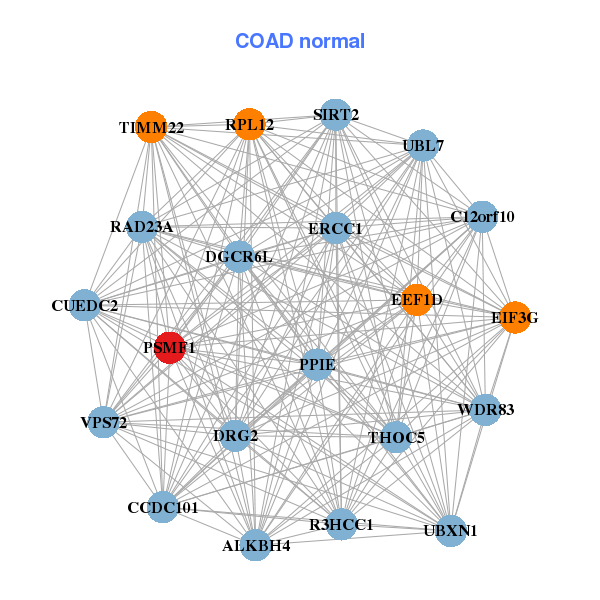
| * Co-Expression network figures were drawn using R package igraph. Only the top 20 genes with the highest correlations were shown. Red circle: input gene, orange circle: cell metabolism gene, sky circle: other gene |
: Open all plots for all cancer types
| Top |
: Open all interacting genes' information including KEGG pathway for all interacting genes from DAVID
| Top |
| Pharmacological Information for PSMF1 |
| There's no related Drug. |
| Top |
| Cross referenced IDs for PSMF1 |
| * We obtained these cross-references from Uniprot database. It covers 150 different DBs, 18 categories. http://www.uniprot.org/help/cross_references_section |
: Open all cross reference information
|
Copyright © 2016-Present - The Univsersity of Texas Health Science Center at Houston @ |