|
||||||||||||||||||||
| |
| Phenotypic Information (metabolism pathway, cancer, disease, phenome) |
| |
| |
| Gene-Gene Network Information: Co-Expression Network, Interacting Genes & KEGG |
| |
|


| Gene Summary for PMPCB |
| Top |
| Phenotypic Information for PMPCB(metabolism pathway, cancer, disease, phenome) |
| Cancer | CGAP: PMPCB |
| Familial Cancer Database: PMPCB | |
| * This gene is included in those cancer gene databases. |
|
|
|
|
|
|
| ||||||||||||||
Oncogene 1 | Significant driver gene in | |||||||||||||||||||
| cf) number; DB name 1 Oncogene; http://nar.oxfordjournals.org/content/35/suppl_1/D721.long, 2 Tumor Suppressor gene; https://bioinfo.uth.edu/TSGene/, 3 Cancer Gene Census; http://www.nature.com/nrc/journal/v4/n3/abs/nrc1299.html, 4 CancerGenes; http://nar.oxfordjournals.org/content/35/suppl_1/D721.long, 5 Network of Cancer Gene; http://ncg.kcl.ac.uk/index.php, 1Therapeutic Vulnerabilities in Cancer; http://cbio.mskcc.org/cancergenomics/statius/ |
| REACTOME_METABOLISM_OF_PROTEINS | |
| OMIM | |
| Orphanet | |
| Disease | KEGG Disease: PMPCB |
| MedGen: PMPCB (Human Medical Genetics with Condition) | |
| ClinVar: PMPCB | |
| Phenotype | MGI: PMPCB (International Mouse Phenotyping Consortium) |
| PhenomicDB: PMPCB | |
| Mutations for PMPCB |
| * Under tables are showing count per each tissue to give us broad intuition about tissue specific mutation patterns.You can go to the detailed page for each mutation database's web site. |
| There's no structural variation information in COSMIC data for this gene. |
| * From mRNA Sanger sequences, Chitars2.0 arranged chimeric transcripts. This table shows PMPCB related fusion information. |
| ID | Head Gene | Tail Gene | Accession | Gene_a | qStart_a | qEnd_a | Chromosome_a | tStart_a | tEnd_a | Gene_a | qStart_a | qEnd_a | Chromosome_a | tStart_a | tEnd_a |
| BF229388 | GOLIM4 | 15 | 209 | 3 | 167759219 | 167761317 | PMPCB | 208 | 272 | 7 | 102962511 | 102963005 | |
| AW838568 | RPS24 | 66 | 402 | 10 | 79795105 | 79797006 | PMPCB | 397 | 501 | 7 | 102963027 | 102963201 | |
| BE709389 | PMPCB | 199 | 218 | 7 | 102967741 | 102967760 | PCBD2 | 213 | 466 | 5 | 134262570 | 134262823 | |
| AW838567 | RPS24 | 52 | 389 | 10 | 79795104 | 79797006 | PMPCB | 384 | 488 | 7 | 102963027 | 102963201 | |
| AI205138 | ATL1 | 1 | 313 | 14 | 51099063 | 51099375 | PMPCB | 314 | 514 | 7 | 102939038 | 102939972 | |
| DA111094 | ZNF608 | 1 | 173 | 5 | 124004429 | 124004600 | PMPCB | 173 | 588 | 7 | 102953469 | 102953884 | |
| BE929033 | PRKCH | 33 | 223 | 14 | 61814398 | 61814591 | PMPCB | 221 | 294 | 7 | 102940672 | 102940745 | |
| AW993843 | PMPCB | 2 | 402 | 7 | 102956273 | 102960127 | MAP4 | 403 | 636 | 3 | 47912572 | 47913556 | |
| Top |
| There's no copy number variation information in COSMIC data for this gene. |
| Top |
|
 |
| Top |
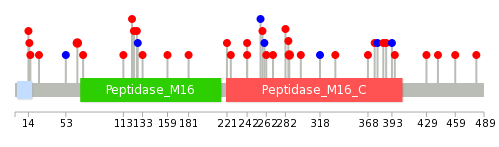
| Stat. for Non-Synonymous SNVs (# total SNVs=30) | (# total SNVs=5) |
 |  |
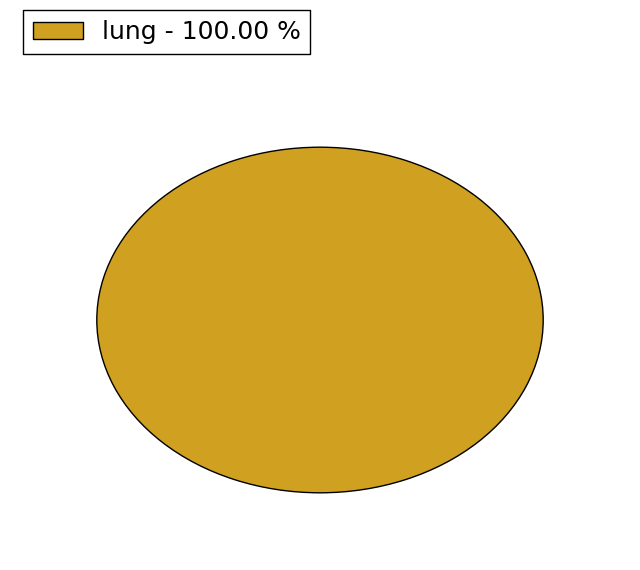
(# total SNVs=1) | (# total SNVs=0) |
 |
| Top |
| * When you move the cursor on each content, you can see more deailed mutation information on the Tooltip. Those are primary_site,primary_histology,mutation(aa),pubmedID. |
| GRCh37 position | Mutation(aa) | Unique sampleID count |
| chr7:102949405-102949405 | p.V286L | 2 |
| chr7:102944925-102944925 | p.A242T | 2 |
| chr7:102939109-102939109 | p.S65N | 2 |
| chr7:102944862-102944862 | p.I221V | 1 |
| chr7:102939127-102939127 | p.S71L | 1 |
| chr7:102952123-102952123 | p.E396D | 1 |
| chr7:102944875-102944875 | p.D225V | 1 |
| chr7:102949443-102949443 | p.I298M | 1 |
| chr7:102939977-102939977 | p.? | 1 |
| chr7:102952300-102952300 | p.Y429C | 1 |
| Top |
|
 |
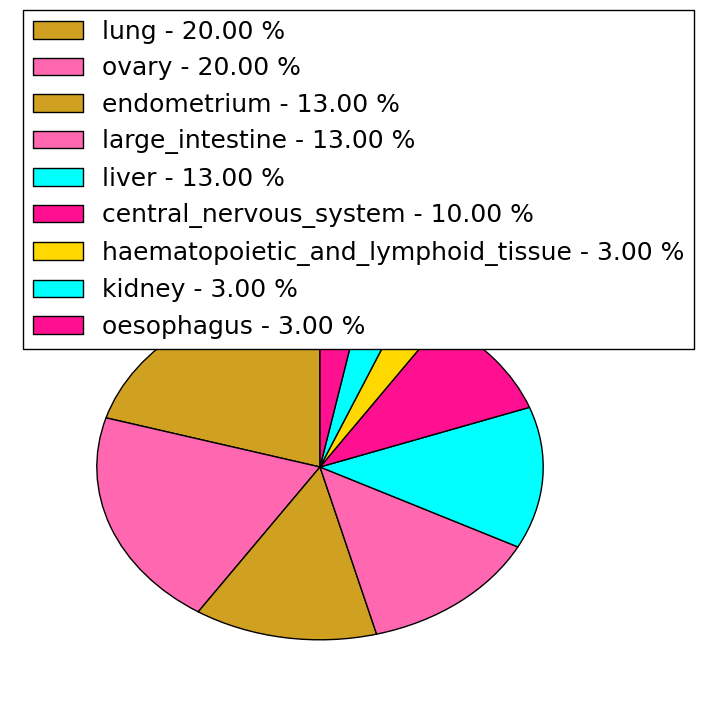
| Point Mutation/ Tissue ID | 1 | 2 | 3 | 4 | 5 | 6 | 7 | 8 | 9 | 10 | 11 | 12 | 13 | 14 | 15 | 16 | 17 | 18 | 19 | 20 |
| # sample | 1 | 2 | 2 | 1 | 1 | 3 | 2 | 5 | 2 | 3 | 3 | |||||||||
| # mutation | 1 | 2 | 2 | 1 | 1 | 3 | 2 | 5 | 2 | 3 | 3 | |||||||||
| nonsynonymous SNV | 1 | 2 | 2 | 1 | 2 | 2 | 5 | 2 | 1 | 3 | ||||||||||
| synonymous SNV | 1 | 1 | 2 |
| cf) Tissue ID; Tissue type (1; BLCA[Bladder Urothelial Carcinoma], 2; BRCA[Breast invasive carcinoma], 3; CESC[Cervical squamous cell carcinoma and endocervical adenocarcinoma], 4; COAD[Colon adenocarcinoma], 5; GBM[Glioblastoma multiforme], 6; Glioma Low Grade, 7; HNSC[Head and Neck squamous cell carcinoma], 8; KICH[Kidney Chromophobe], 9; KIRC[Kidney renal clear cell carcinoma], 10; KIRP[Kidney renal papillary cell carcinoma], 11; LAML[Acute Myeloid Leukemia], 12; LUAD[Lung adenocarcinoma], 13; LUSC[Lung squamous cell carcinoma], 14; OV[Ovarian serous cystadenocarcinoma ], 15; PAAD[Pancreatic adenocarcinoma], 16; PRAD[Prostate adenocarcinoma], 17; SKCM[Skin Cutaneous Melanoma], 18:STAD[Stomach adenocarcinoma], 19:THCA[Thyroid carcinoma], 20:UCEC[Uterine Corpus Endometrial Carcinoma]) |
| Top |
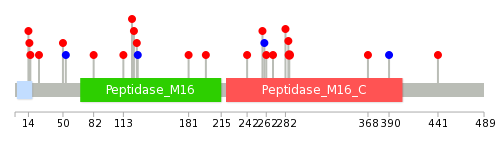
| * We represented just top 10 SNVs. When you move the cursor on each content, you can see more deailed mutation information on the Tooltip. Those are primary_site, primary_histology, mutation(aa), pubmedID. |
| Genomic Position | Mutation(aa) | Unique sampleID count |
| chr7:102949405 | p.V286L | 2 |
| chr7:102939063 | p.L53L | 1 |
| chr7:102948078 | p.G82V | 1 |
| chr7:102939074 | p.V368A | 1 |
| chr7:102948086 | p.K113N | 1 |
| chr7:102939894 | p.T390T | 1 |
| chr7:102948090 | p.E122Q | 1 |
| chr7:102940636 | p.R441I | 1 |
| chr7:102948111 | p.E124K | 1 |
| chr7:102940661 | p.G127S | 1 |
| * Copy number data were extracted from TCGA using R package TCGA-Assembler. The URLs of all public data files on TCGA DCC data server were gathered on Jan-05-2015. Function ProcessCNAData in TCGA-Assembler package was used to obtain gene-level copy number value which is calculated as the average copy number of the genomic region of a gene. |
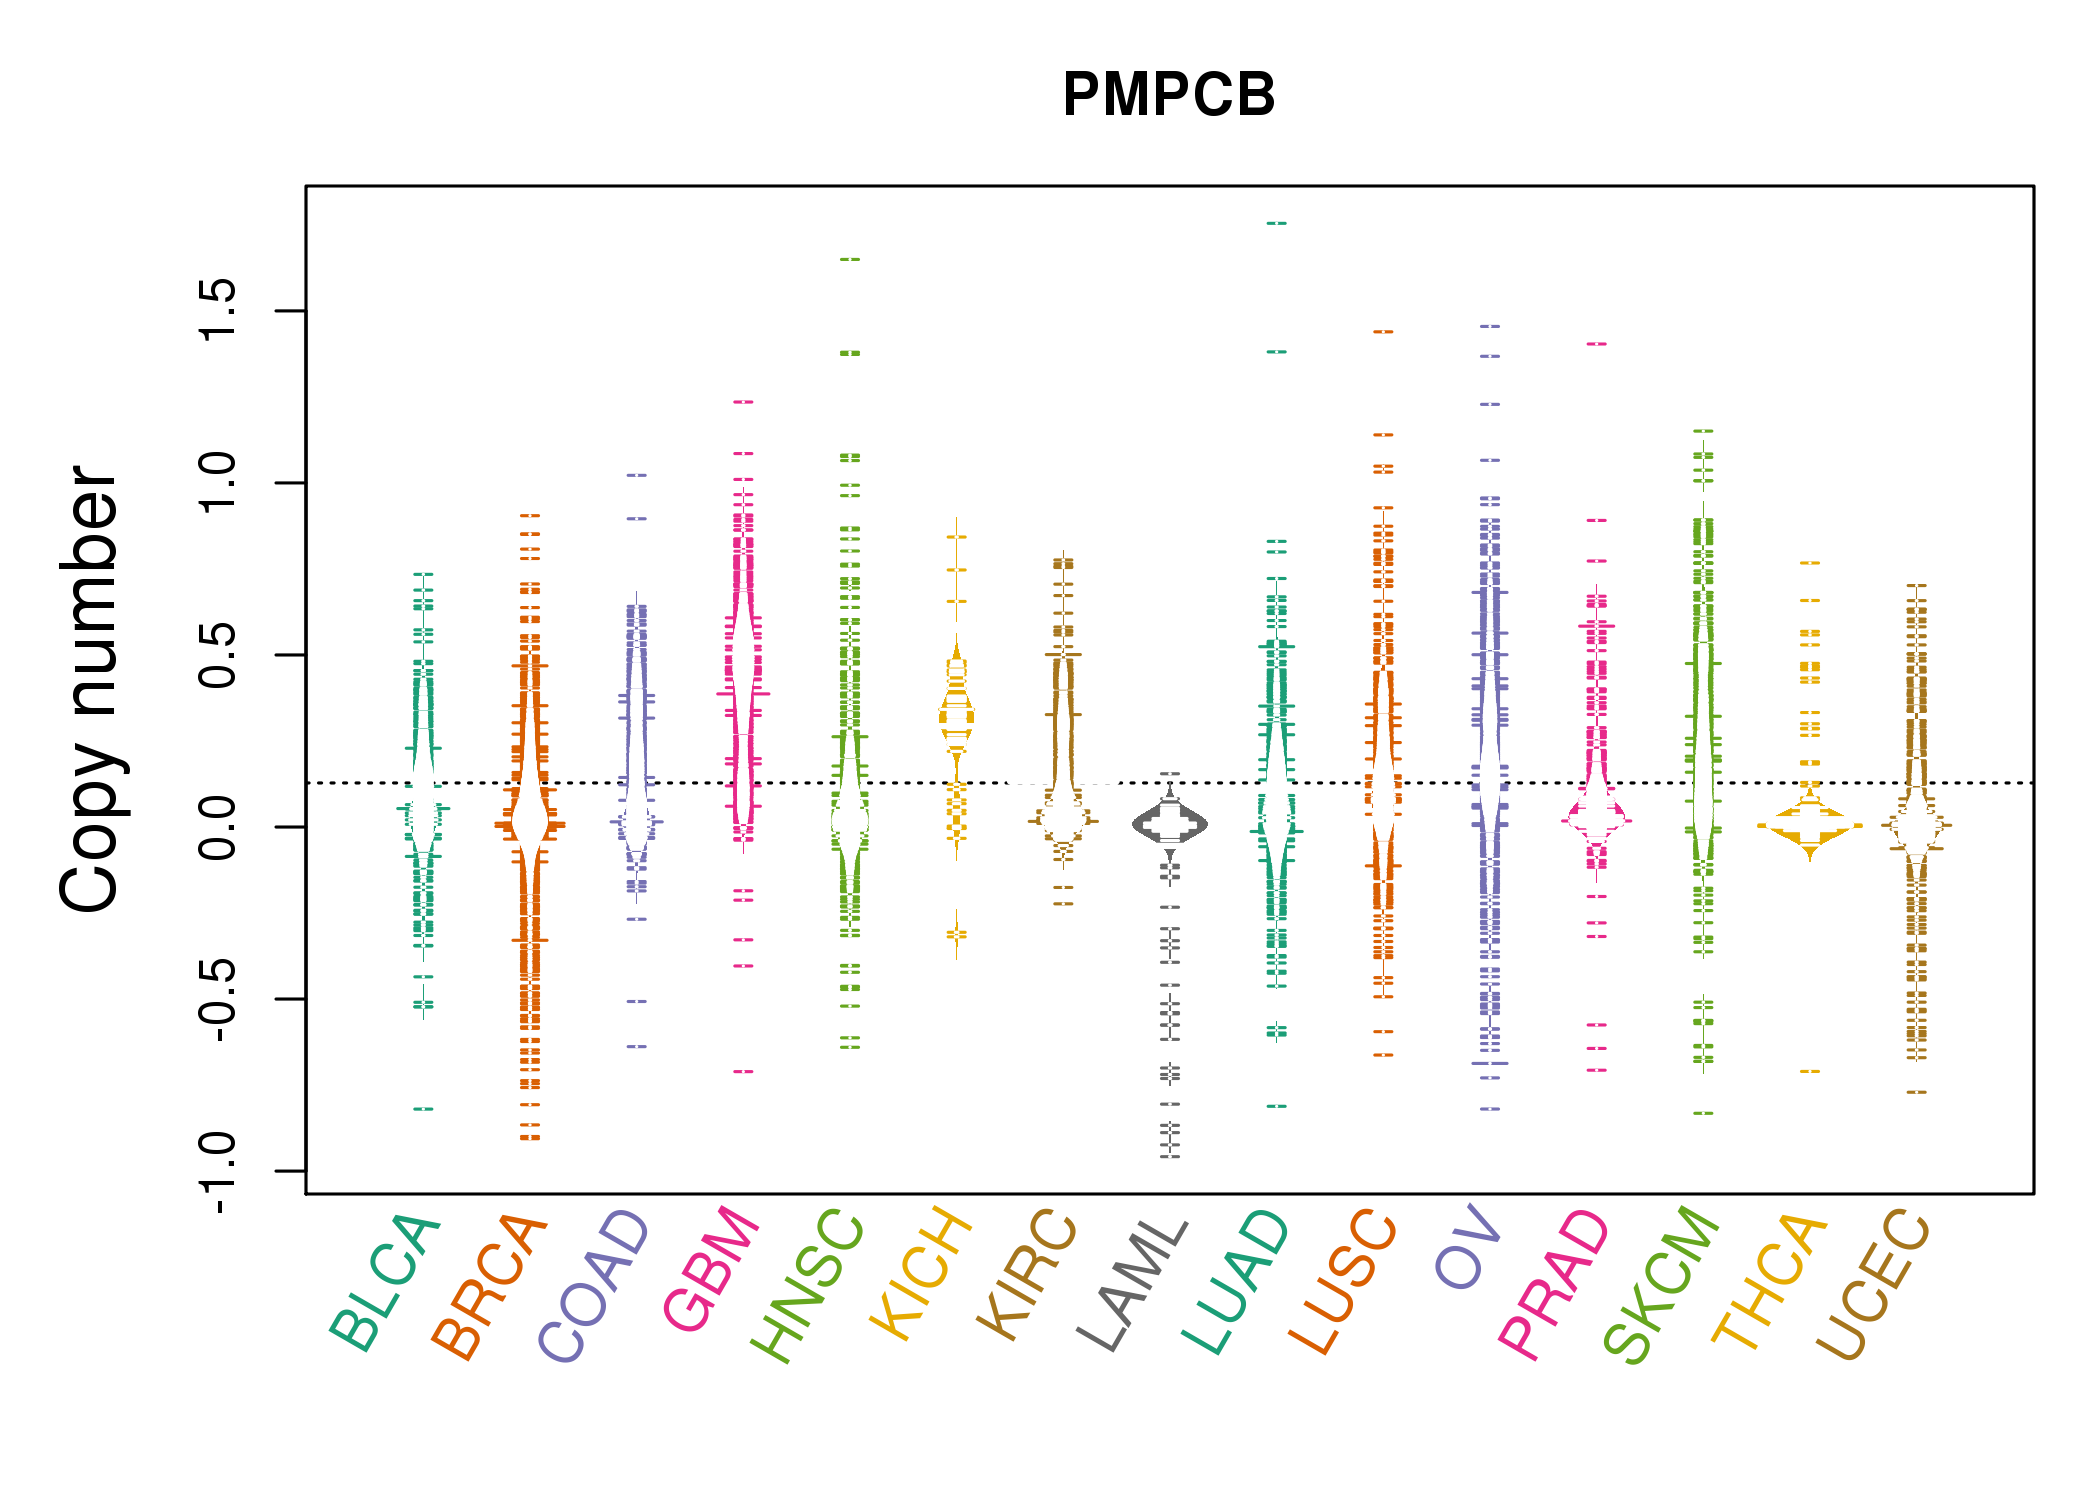 |
| cf) Tissue ID[Tissue type]: BLCA[Bladder Urothelial Carcinoma], BRCA[Breast invasive carcinoma], CESC[Cervical squamous cell carcinoma and endocervical adenocarcinoma], COAD[Colon adenocarcinoma], GBM[Glioblastoma multiforme], Glioma Low Grade, HNSC[Head and Neck squamous cell carcinoma], KICH[Kidney Chromophobe], KIRC[Kidney renal clear cell carcinoma], KIRP[Kidney renal papillary cell carcinoma], LAML[Acute Myeloid Leukemia], LUAD[Lung adenocarcinoma], LUSC[Lung squamous cell carcinoma], OV[Ovarian serous cystadenocarcinoma ], PAAD[Pancreatic adenocarcinoma], PRAD[Prostate adenocarcinoma], SKCM[Skin Cutaneous Melanoma], STAD[Stomach adenocarcinoma], THCA[Thyroid carcinoma], UCEC[Uterine Corpus Endometrial Carcinoma] |
| Top |
| Gene Expression for PMPCB |
| * CCLE gene expression data were extracted from CCLE_Expression_Entrez_2012-10-18.res: Gene-centric RMA-normalized mRNA expression data. |
 |
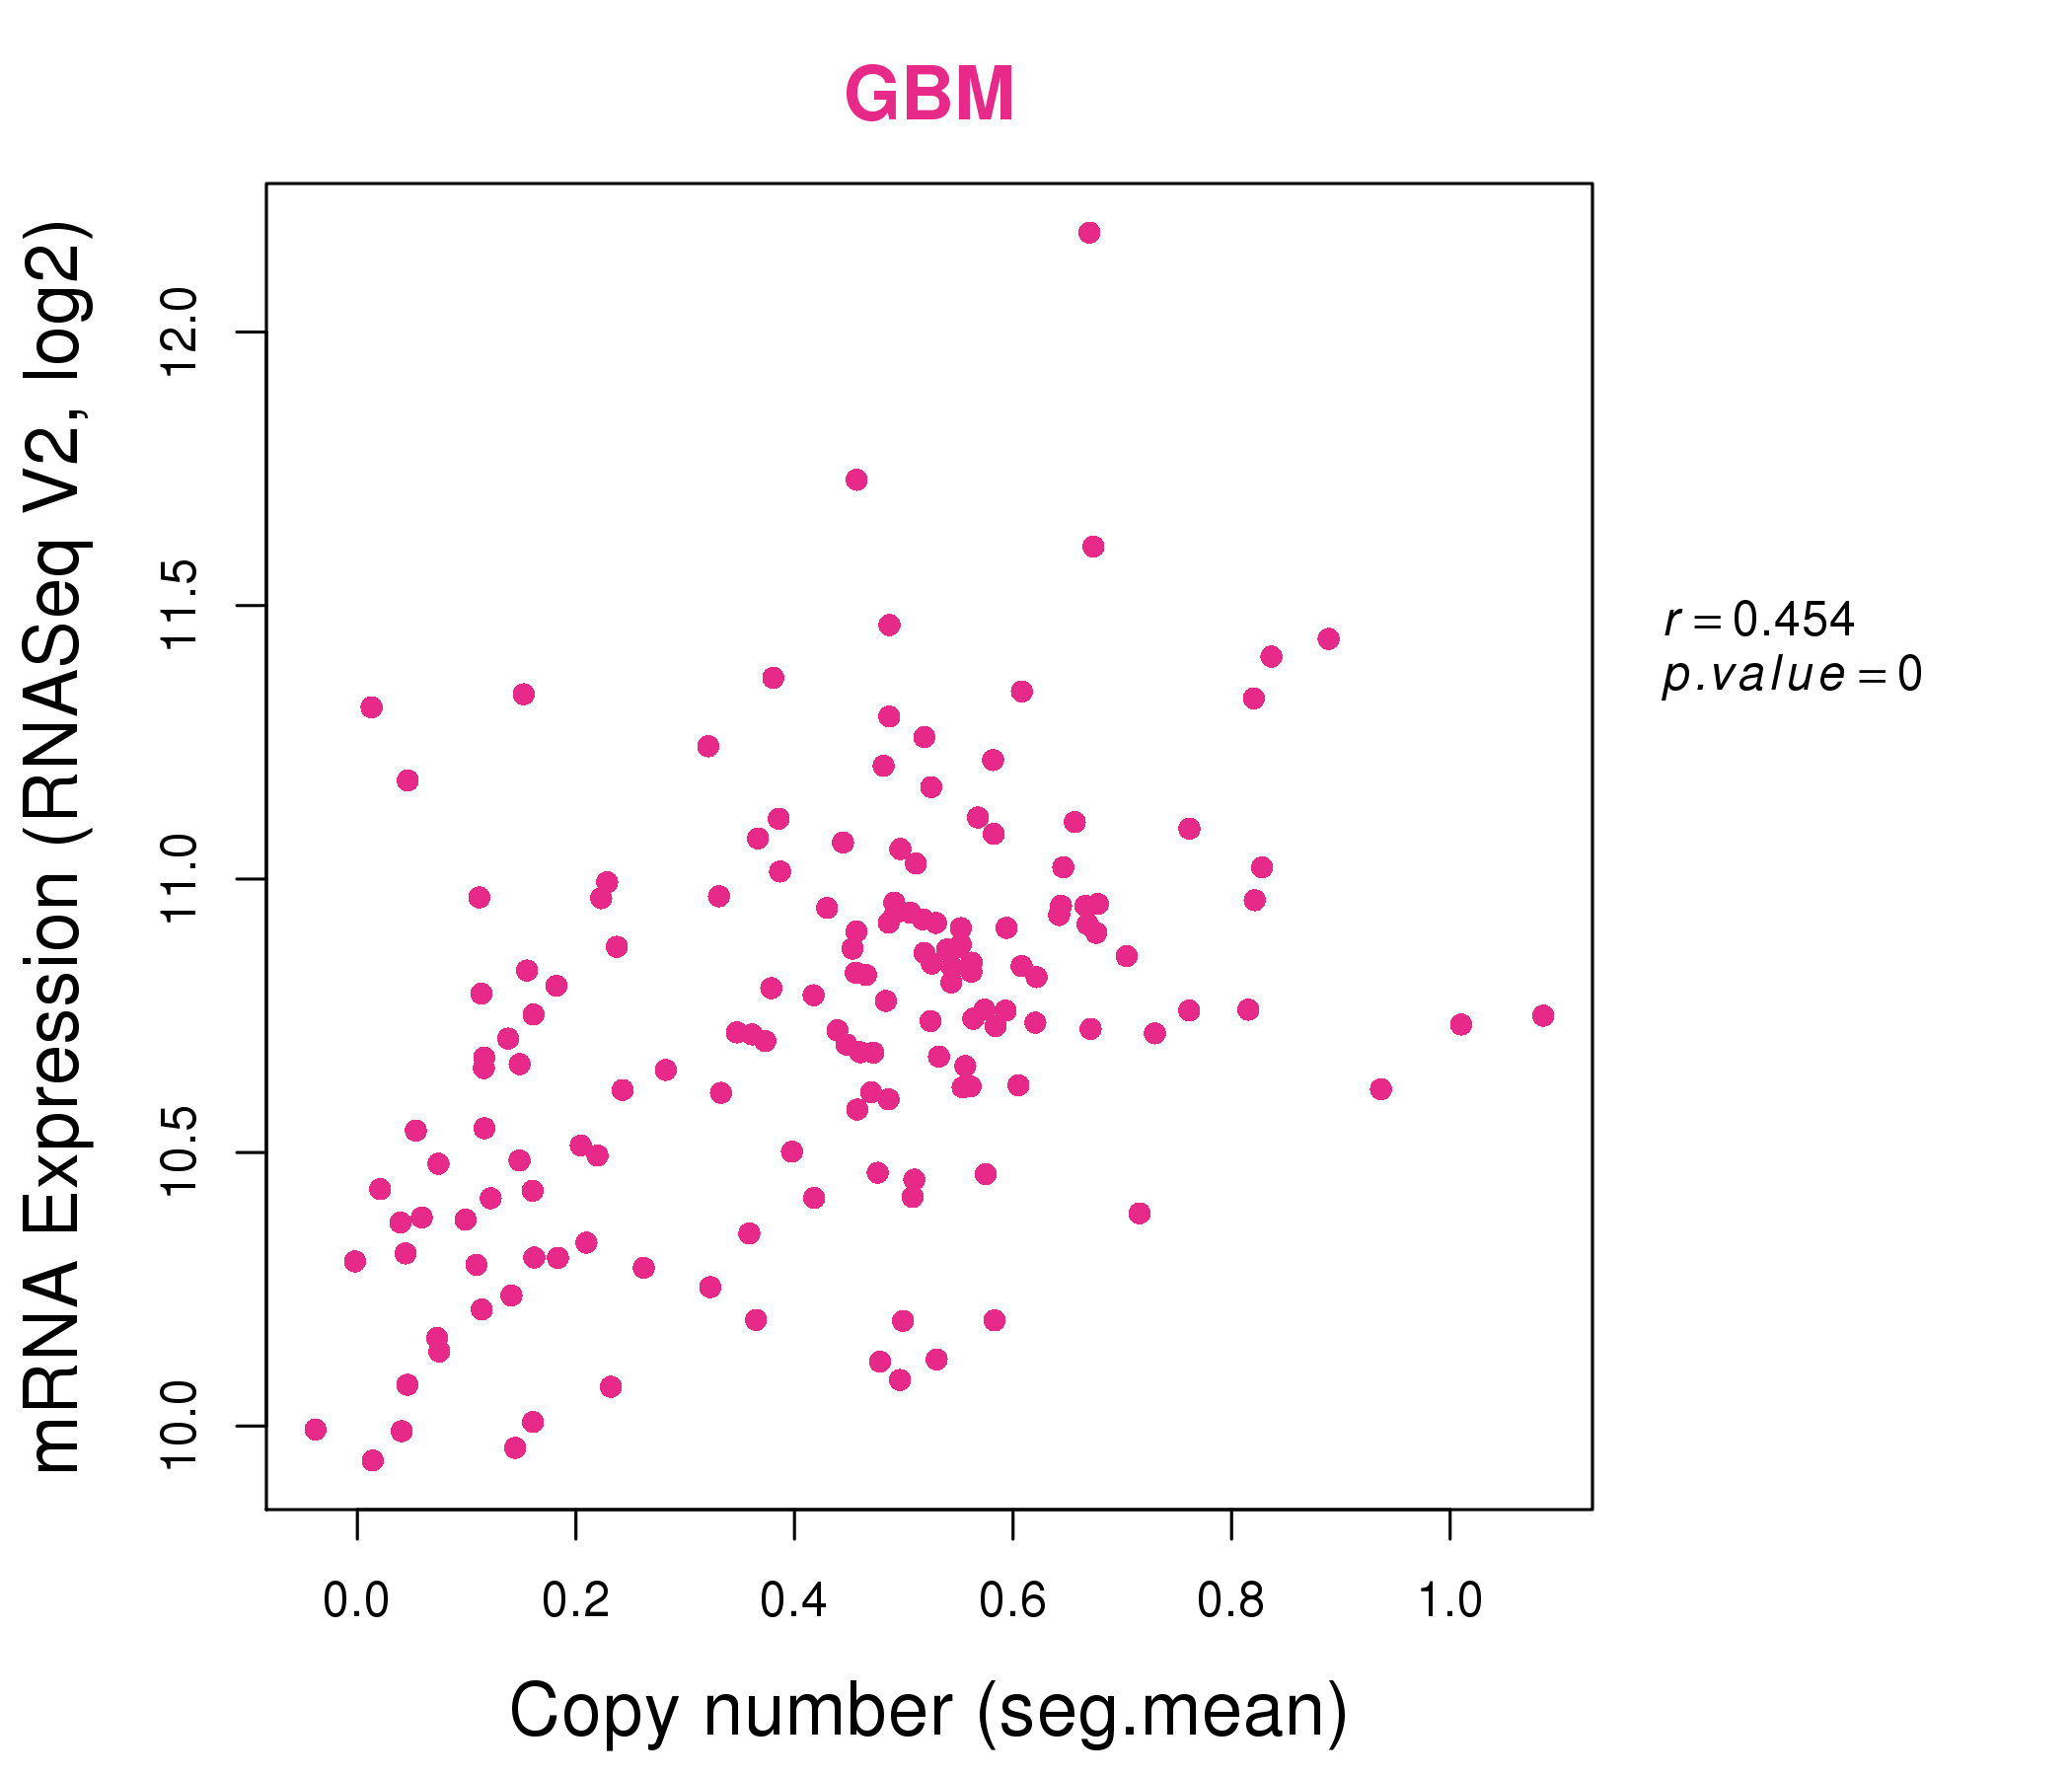
| * Normalized gene expression data of RNASeqV2 was extracted from TCGA using R package TCGA-Assembler. The URLs of all public data files on TCGA DCC data server were gathered at Jan-05-2015. Only eight cancer types have enough normal control samples for differential expression analysis. (t test, adjusted p<0.05 (using Benjamini-Hochberg FDR)) |
 |
| Top |
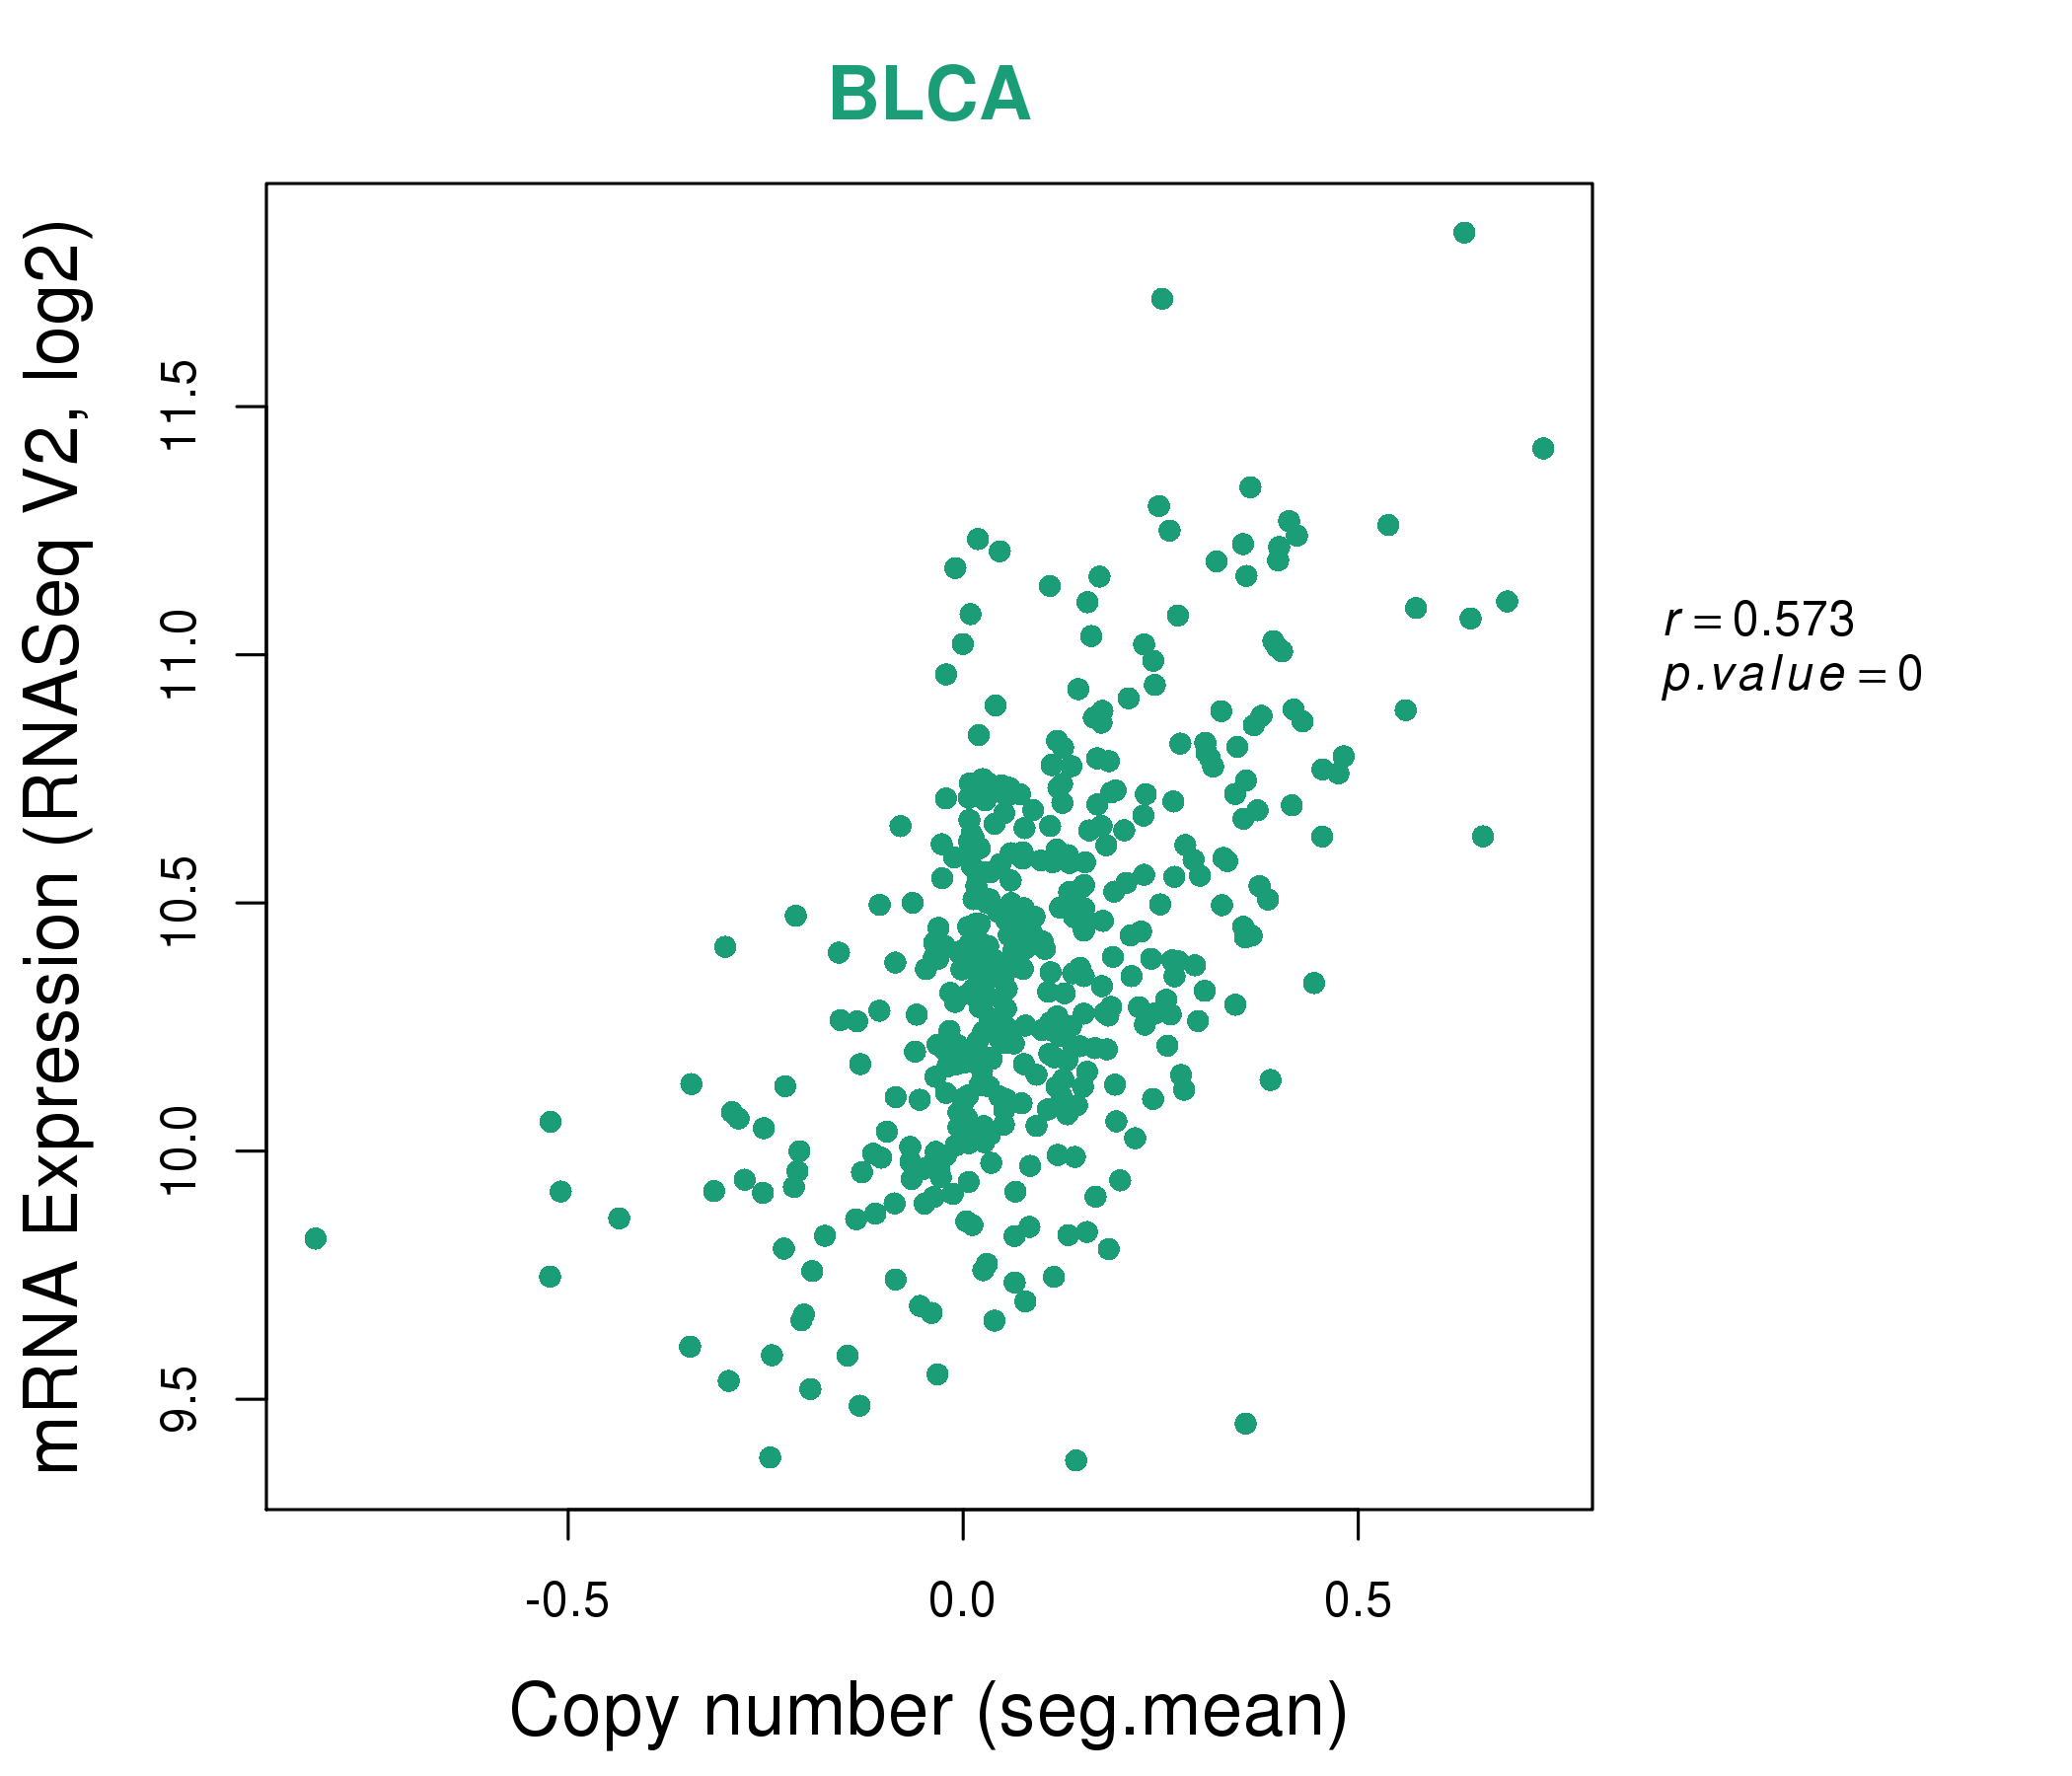
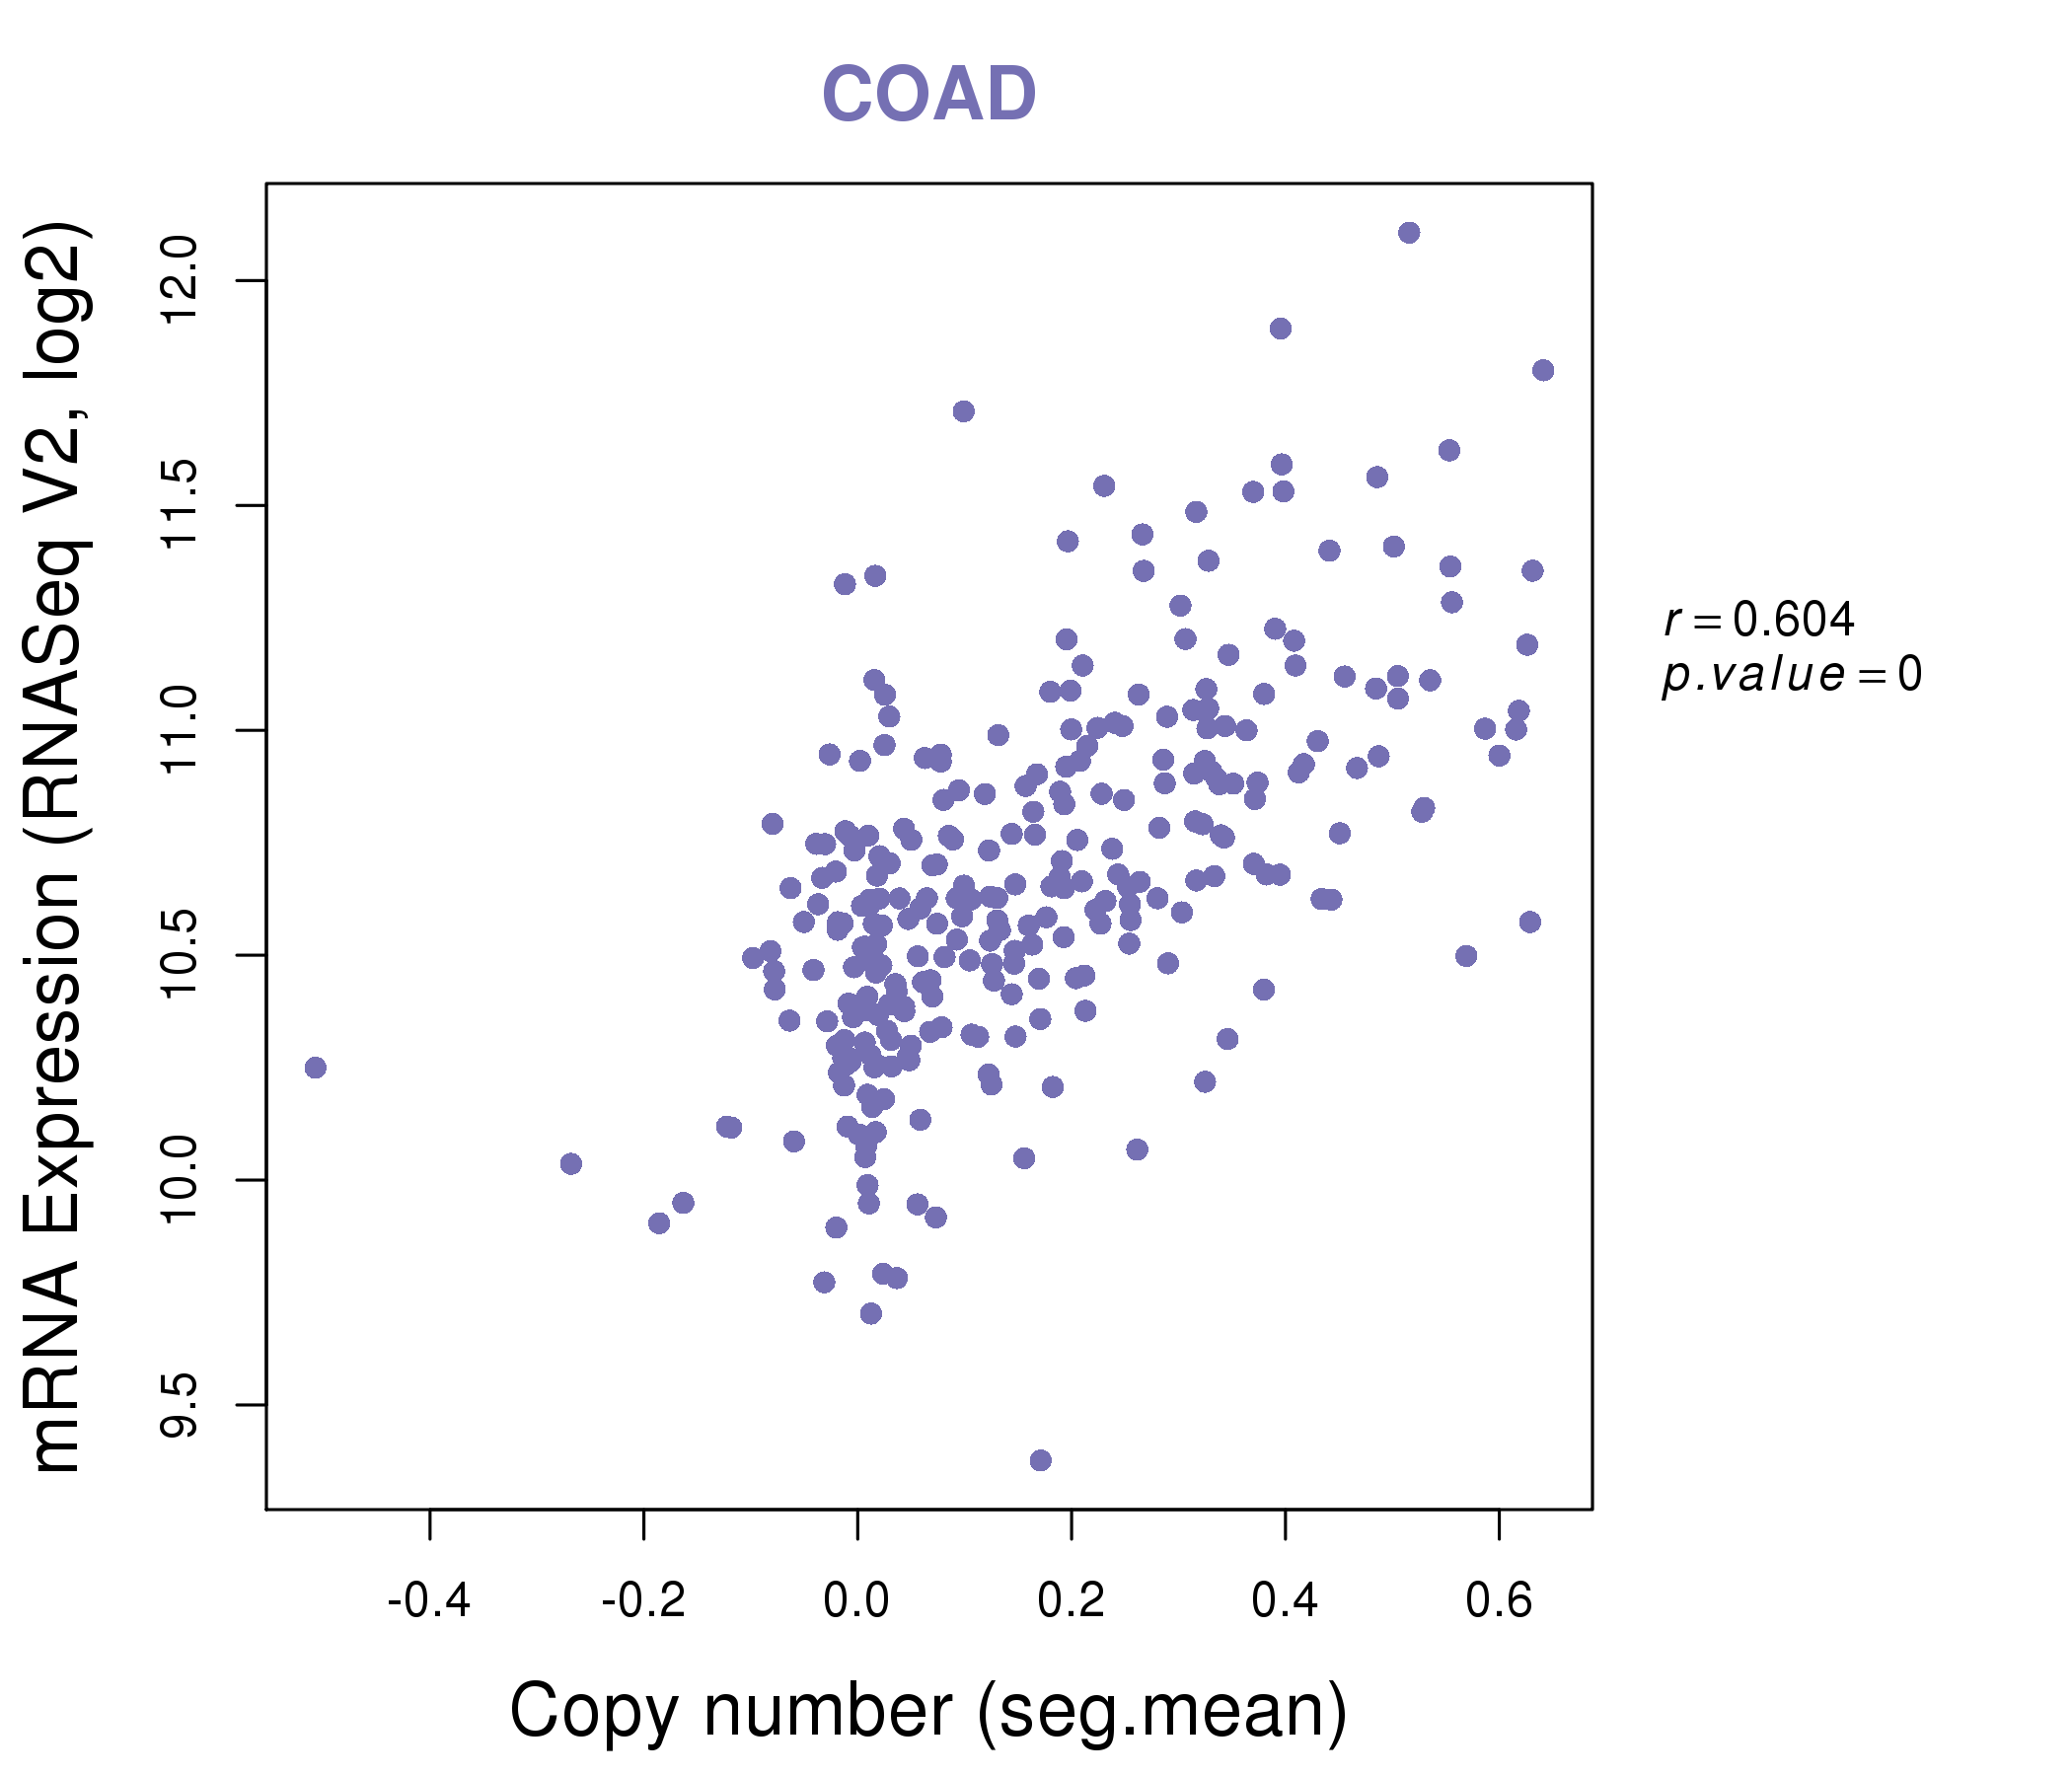
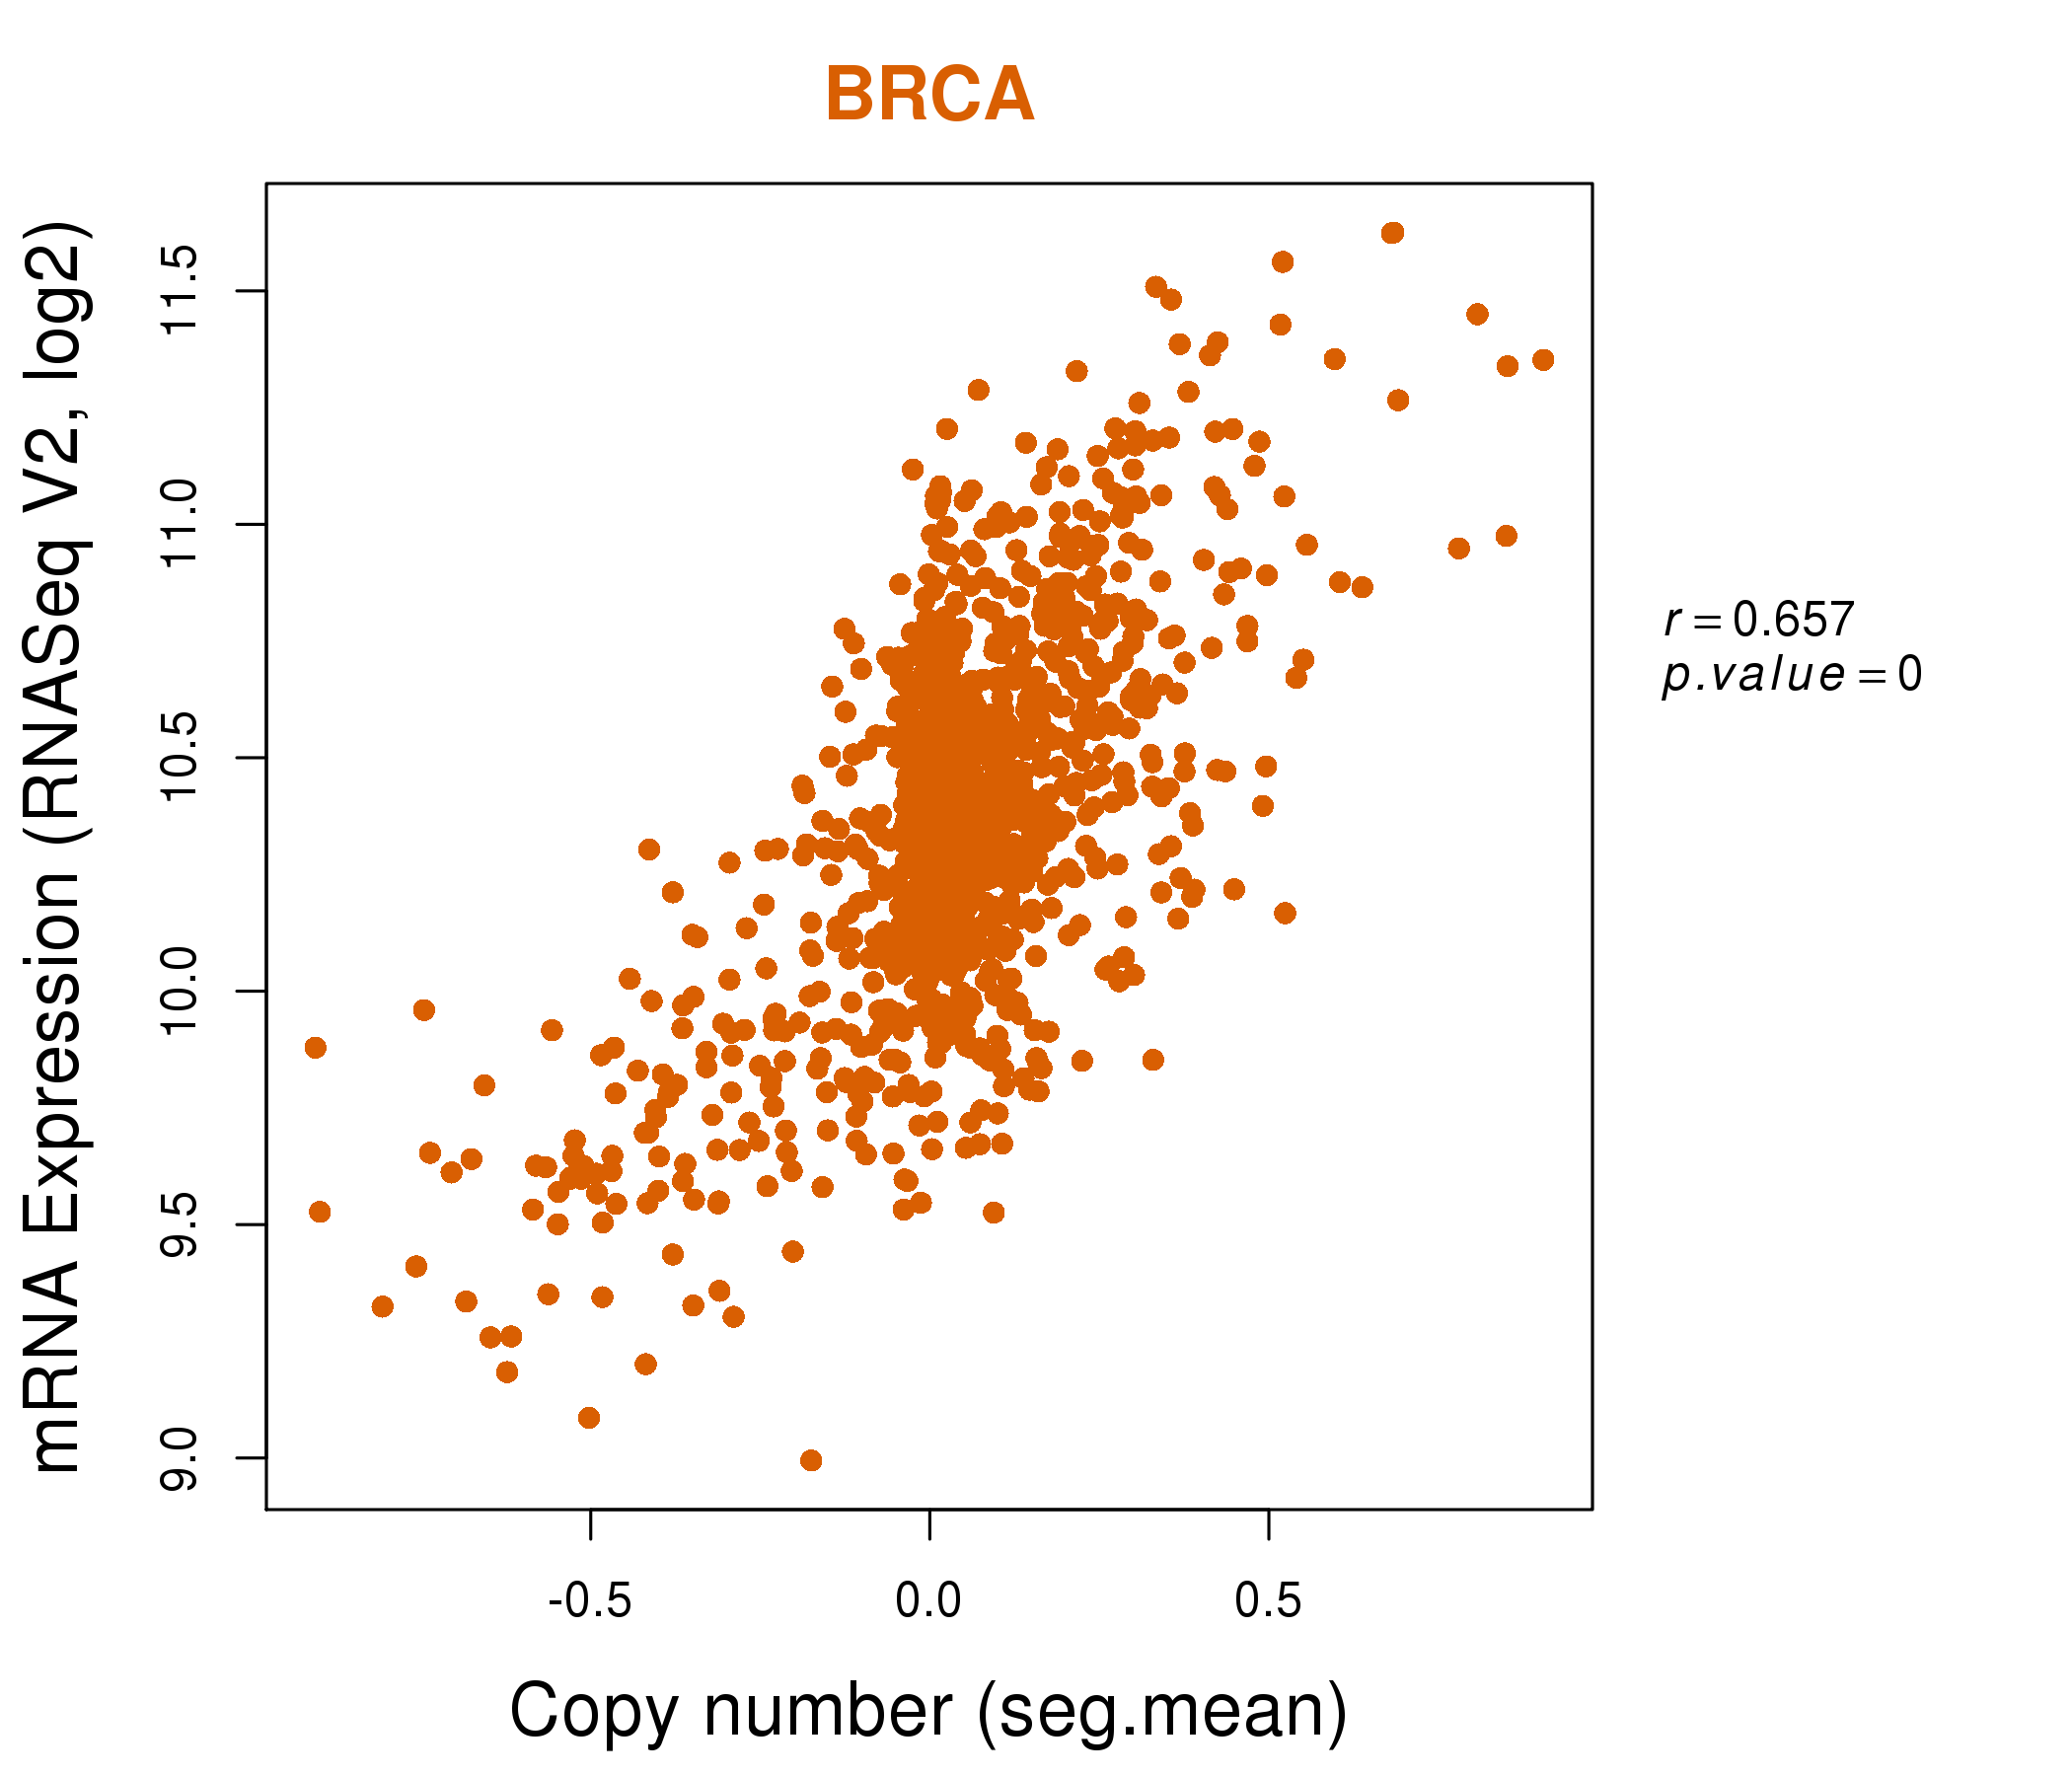
| * This plots show the correlation between CNV and gene expression. |
: Open all plots for all cancer types
 |
|
 |
|
| Top |
| Gene-Gene Network Information |
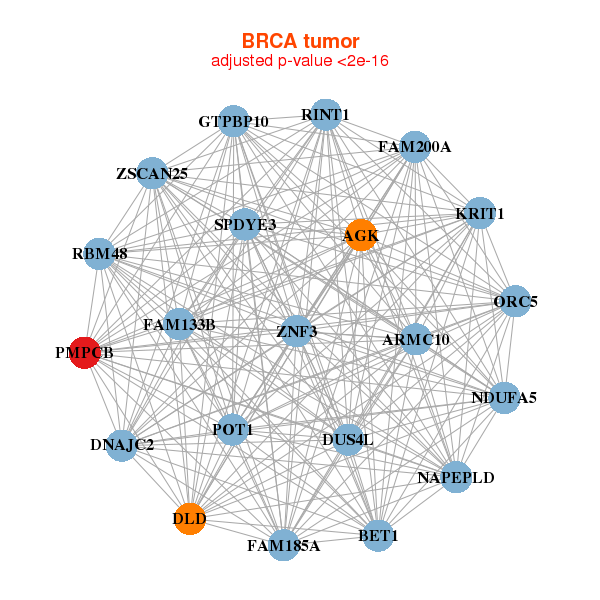
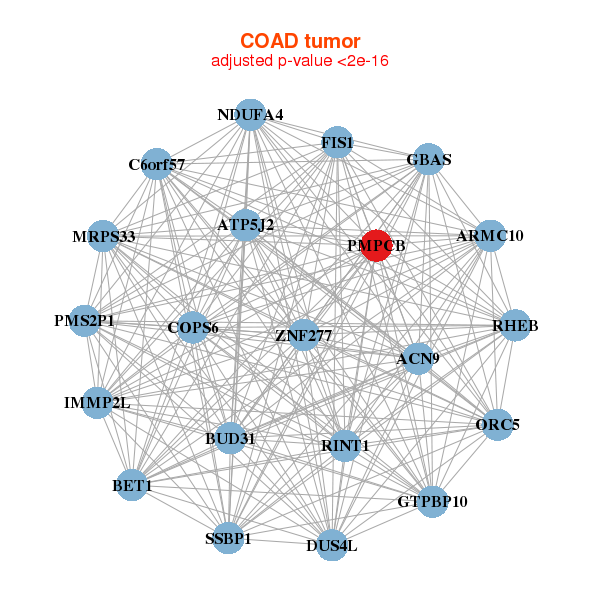
| * Co-Expression network figures were drawn using R package igraph. Only the top 20 genes with the highest correlations were shown. Red circle: input gene, orange circle: cell metabolism gene, sky circle: other gene |
: Open all plots for all cancer types
 |
|
| AGK,ARMC10,BET1,RBM48,DLD,DNAJC2,DUS4L, FAM133B,FAM185A,FAM200A,GTPBP10,KRIT1,NAPEPLD,NDUFA5, ORC5,PMPCB,POT1,RINT1,SPDYE3,ZNF3,ZSCAN25 | ABCB7,EIF2A,EIF2S3,EIF3E,EIF3L,EIF3M,EIF4B, LIAS,MRPL45,NAP1L1,LRRC75A-AS1,PCBP2,PMPCB,POLR1D, RPL22,RSL1D1,SUPV3L1,TAF1D,TATDN1,TIMM9,TMEM18 |
 |
|
| ACN9,ARMC10,ATP5J2,BET1,BUD31,C6orf57,COPS6, DUS4L,FIS1,GBAS,GTPBP10,IMMP2L,MRPS33,NDUFA4, ORC5,PMPCB,PMS2P1,RHEB,RINT1,SSBP1,ZNF277 | ANKRD49,ATG5,ATP5S,C1orf43,COMMD3,DPY30,EBAG9, EEF1B2,GOLGA7,GPN1,LYPLA1,MKKS,MYNN,NDUFB5, PEX2,PMPCB,RCHY1,RPS3A,TATDN1,TMEM14B,TMEM14C |
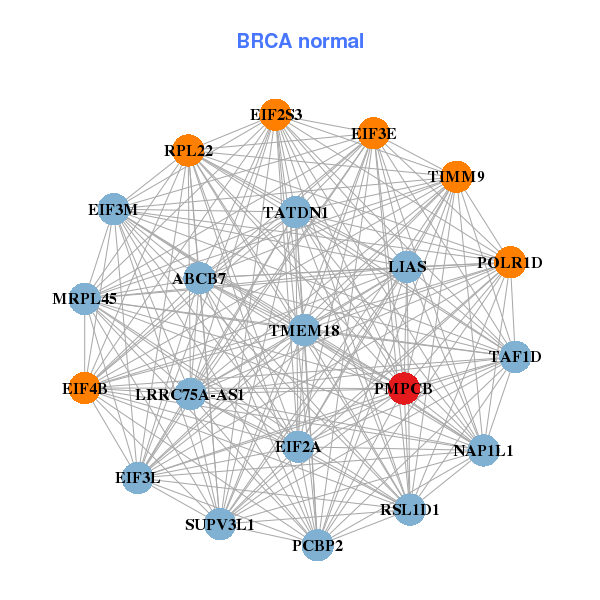
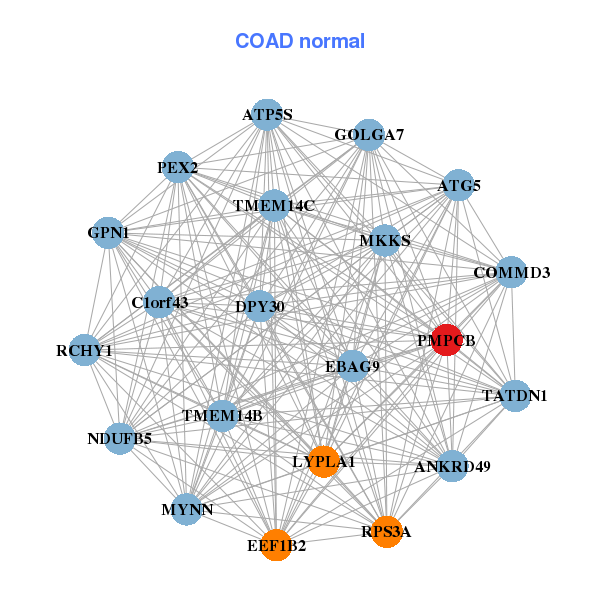
| * Co-Expression network figures were drawn using R package igraph. Only the top 20 genes with the highest correlations were shown. Red circle: input gene, orange circle: cell metabolism gene, sky circle: other gene |
: Open all plots for all cancer types
| Top |
: Open all interacting genes' information including KEGG pathway for all interacting genes from DAVID
| Top |
| Pharmacological Information for PMPCB |
| There's no related Drug. |
| Top |
| Cross referenced IDs for PMPCB |
| * We obtained these cross-references from Uniprot database. It covers 150 different DBs, 18 categories. http://www.uniprot.org/help/cross_references_section |
: Open all cross reference information
|
Copyright © 2016-Present - The Univsersity of Texas Health Science Center at Houston @ |