|
|||||||||||||||||||||||||||||||||||||||||||||||||||||||||||||||||||||||||||||||||||||||||||||||||||||||||||||||||||||||||||||||||||||||||||||||||||||||||||||||||||||||||||||||||||||||||||||||||||||||||||||||||||||||||||||||||||||||||||||||||||||||||||||||||||||||||||||||||||||||||||||||||||||||||||||||||||||||||||||||||||||||||||||||||||
| |
| Phenotypic Information (metabolism pathway, cancer, disease, phenome) |
| |
| |
| Gene-Gene Network Information: Co-Expression Network, Interacting Genes & KEGG |
| |
|


| Gene Summary for SPTLC2 |
| Basic gene info. | Gene symbol | SPTLC2 |
| Gene name | serine palmitoyltransferase, long chain base subunit 2 | |
| Synonyms | HSN1C|LCB2|LCB2A|NSAN1C|SPT2|hLCB2a | |
| Cytomap | UCSC genome browser: 14q24.3 | |
| Genomic location | chr14 :77972339-78083110 | |
| Type of gene | protein-coding | |
| RefGenes | NM_004863.3, | |
| Ensembl id | ENSG00000100596 | |
| Description | LCB 2SPT 2long chain base biosynthesis protein 2aserine palmitoyltransferase 2serine palmitoyltransferase, subunit IIserine-palmitoyl-CoA transferase 2 | |
| Modification date | 20141207 | |
| dbXrefs | MIM : 605713 | |
| HGNC : HGNC | ||
| Ensembl : ENSG00000100596 | ||
| HPRD : 05755 | ||
| Vega : OTTHUMG00000171540 | ||
| Protein | UniProt: go to UniProt's Cross Reference DB Table | |
| Expression | CleanEX: HS_SPTLC2 | |
| BioGPS: 9517 | ||
| Gene Expression Atlas: ENSG00000100596 | ||
| The Human Protein Atlas: ENSG00000100596 | ||
| Pathway | NCI Pathway Interaction Database: SPTLC2 | |
| KEGG: SPTLC2 | ||
| REACTOME: SPTLC2 | ||
| ConsensusPathDB | ||
| Pathway Commons: SPTLC2 | ||
| Metabolism | MetaCyc: SPTLC2 | |
| HUMANCyc: SPTLC2 | ||
| Regulation | Ensembl's Regulation: ENSG00000100596 | |
| miRBase: chr14 :77,972,339-78,083,110 | ||
| TargetScan: NM_004863 | ||
| cisRED: ENSG00000100596 | ||
| Context | iHOP: SPTLC2 | |
| cancer metabolism search in PubMed: SPTLC2 | ||
| UCL Cancer Institute: SPTLC2 | ||
| Assigned class in ccmGDB | C | |
| Top |
| Phenotypic Information for SPTLC2(metabolism pathway, cancer, disease, phenome) |
| Cancer | CGAP: SPTLC2 |
| Familial Cancer Database: SPTLC2 | |
| * This gene is included in those cancer gene databases. |
|
|
|
|
|
|
| |||||||||||||||||||||||||||||||||||||||||||||||||||||||||||||||||||||||||||||||||||||||||||||||||||||||||||||||||||||||||||||||||||||||||||||||||||||||||||||||||||||||||||||||||||||||||||||||||||||||||||||||||||||||||||||||||||||||||||||||||||||||||||||||||||||||||||||||||||||||||||||||||||||||||||||||||||||||||||||||||||||||||||||
Oncogene 1 | Significant driver gene in | ||||||||||||||||||||||||||||||||||||||||||||||||||||||||||||||||||||||||||||||||||||||||||||||||||||||||||||||||||||||||||||||||||||||||||||||||||||||||||||||||||||||||||||||||||||||||||||||||||||||||||||||||||||||||||||||||||||||||||||||||||||||||||||||||||||||||||||||||||||||||||||||||||||||||||||||||||||||||||||||||||||||||||||||||||
| cf) number; DB name 1 Oncogene; http://nar.oxfordjournals.org/content/35/suppl_1/D721.long, 2 Tumor Suppressor gene; https://bioinfo.uth.edu/TSGene/, 3 Cancer Gene Census; http://www.nature.com/nrc/journal/v4/n3/abs/nrc1299.html, 4 CancerGenes; http://nar.oxfordjournals.org/content/35/suppl_1/D721.long, 5 Network of Cancer Gene; http://ncg.kcl.ac.uk/index.php, 1Therapeutic Vulnerabilities in Cancer; http://cbio.mskcc.org/cancergenomics/statius/ |
| KEGG_SPHINGOLIPID_METABOLISM REACTOME_PHOSPHOLIPID_METABOLISM REACTOME_SPHINGOLIPID_METABOLISM REACTOME_METABOLISM_OF_LIPIDS_AND_LIPOPROTEINS | |
| OMIM | |
| Orphanet | |
| Disease | KEGG Disease: SPTLC2 |
| MedGen: SPTLC2 (Human Medical Genetics with Condition) | |
| ClinVar: SPTLC2 | |
| Phenotype | MGI: SPTLC2 (International Mouse Phenotyping Consortium) |
| PhenomicDB: SPTLC2 | |
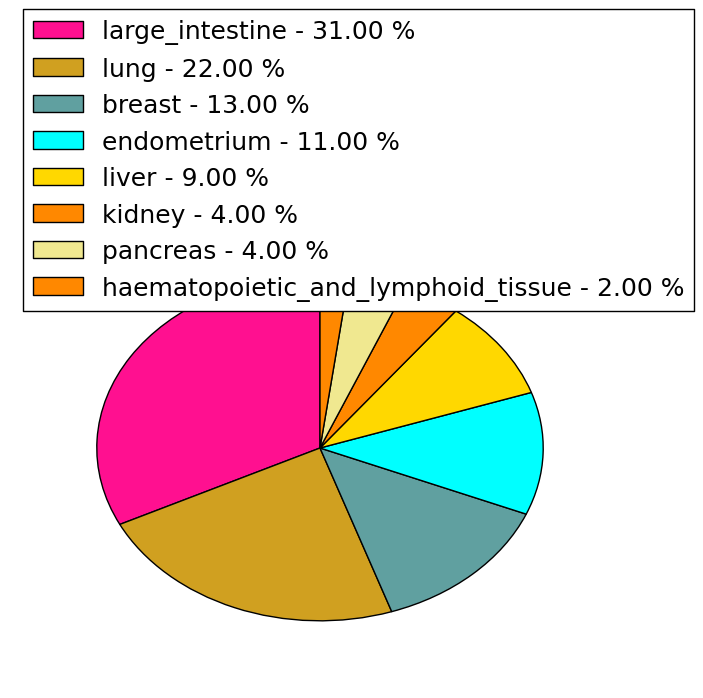
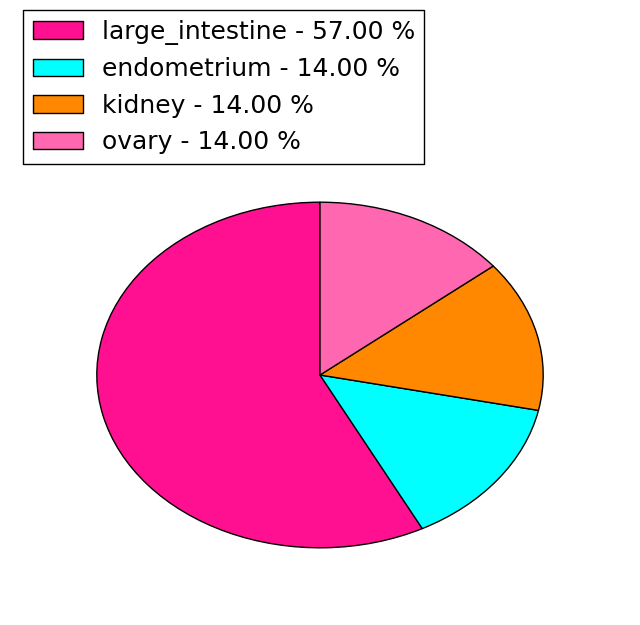
| Mutations for SPTLC2 |
| * Under tables are showing count per each tissue to give us broad intuition about tissue specific mutation patterns.You can go to the detailed page for each mutation database's web site. |
| - Statistics for Tissue and Mutation type | Top |
 |
| - For Inter-chromosomal Variations |
| There's no inter-chromosomal structural variation. |
| - For Intra-chromosomal Variations |
| * Intra-chromosomal variantions includes 'intrachromosomal amplicon to amplicon', 'intrachromosomal amplicon to non-amplified dna', 'intrachromosomal deletion', 'intrachromosomal fold-back inversion', 'intrachromosomal inversion', 'intrachromosomal tandem duplication', 'Intrachromosomal unknown type', 'intrachromosomal with inverted orientation', 'intrachromosomal with non-inverted orientation'. |
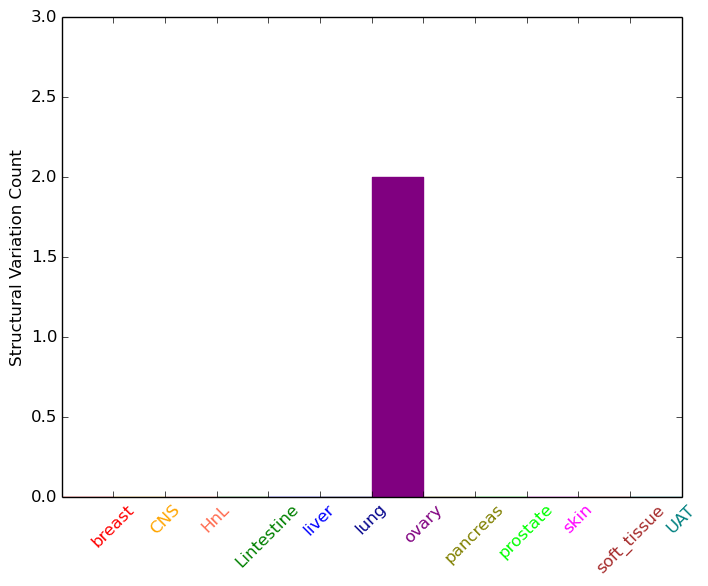 |
| Sample | Symbol_a | Chr_a | Start_a | End_a | Symbol_b | Chr_b | Start_b | End_b |
| ovary | SPTLC2 | chr14 | 78021370 | 78021390 | SPTLC2 | chr14 | 78008114 | 78008134 |
| cf) Tissue number; Tissue name (1;Breast, 2;Central_nervous_system, 3;Haematopoietic_and_lymphoid_tissue, 4;Large_intestine, 5;Liver, 6;Lung, 7;Ovary, 8;Pancreas, 9;Prostate, 10;Skin, 11;Soft_tissue, 12;Upper_aerodigestive_tract) |
| * From mRNA Sanger sequences, Chitars2.0 arranged chimeric transcripts. This table shows SPTLC2 related fusion information. |
| ID | Head Gene | Tail Gene | Accession | Gene_a | qStart_a | qEnd_a | Chromosome_a | tStart_a | tEnd_a | Gene_a | qStart_a | qEnd_a | Chromosome_a | tStart_a | tEnd_a |
| N98751 | SURF4 | 6 | 229 | 9 | 136228340 | 136228561 | SPTLC2 | 230 | 402 | 14 | 77972559 | 77972728 | |
| AW376098 | SPTLC2 | 1 | 257 | 14 | 77978692 | 77987860 | SPTLC2 | 254 | 320 | 14 | 77978648 | 77978714 | |
| AW376106 | SPTLC2 | 5 | 274 | 14 | 77978692 | 77987873 | SPTLC2 | 271 | 337 | 14 | 77978648 | 77978714 | |
| AW803684 | SPTLC2 | 14 | 107 | 14 | 77972428 | 77972521 | ACTB | 92 | 182 | 7 | 5567258 | 5567348 | |
| Top |
| Mutation type/ Tissue ID | brca | cns | cerv | endome | haematopo | kidn | Lintest | liver | lung | ns | ovary | pancre | prost | skin | stoma | thyro | urina | |||
| Total # sample | 1 | 1 | 2 | 1 | 1 | |||||||||||||||
| GAIN (# sample) | 1 | 2 | 1 | |||||||||||||||||
| LOSS (# sample) | 1 | 1 |
| cf) Tissue ID; Tissue type (1; Breast, 2; Central_nervous_system, 3; Cervix, 4; Endometrium, 5; Haematopoietic_and_lymphoid_tissue, 6; Kidney, 7; Large_intestine, 8; Liver, 9; Lung, 10; NS, 11; Ovary, 12; Pancreas, 13; Prostate, 14; Skin, 15; Stomach, 16; Thyroid, 17; Urinary_tract) |
| Top |
|
 |
| Top |
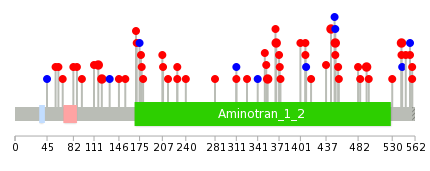
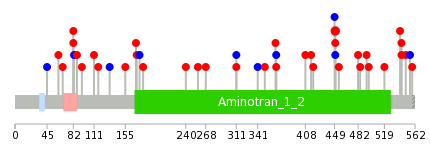
| Stat. for Non-Synonymous SNVs (# total SNVs=44) | (# total SNVs=7) |
 |  |
(# total SNVs=0) | (# total SNVs=0) |
| Top |
| * When you move the cursor on each content, you can see more deailed mutation information on the Tooltip. Those are primary_site,primary_histology,mutation(aa),pubmedID. |
| GRCh37 position | Mutation(aa) | Unique sampleID count |
| chr14:77987880-77987880 | p.R450R | 3 |
| chr14:78045415-78045415 | p.Y122C | 2 |
| chr14:78018519-78018519 | p.A408D | 2 |
| chr14:78045431-78045431 | p.D117Y | 2 |
| chr14:78063594-78063594 | p.R88* | 2 |
| chr14:77978689-77978689 | p.R543W | 2 |
| chr14:77987898-77987898 | p.E444K | 2 |
| chr14:77978747-77978747 | p.? | 2 |
| chr14:78021720-78021720 | p.P367S | 2 |
| chr14:77984470-77984470 | p.V494I | 2 |
| Top |
|
 |
| Point Mutation/ Tissue ID | 1 | 2 | 3 | 4 | 5 | 6 | 7 | 8 | 9 | 10 | 11 | 12 | 13 | 14 | 15 | 16 | 17 | 18 | 19 | 20 |
| # sample | 3 | 2 | 1 | 10 | 2 | 1 | 1 | 1 | 5 | 3 | 1 | 5 | 4 | 4 | ||||||
| # mutation | 4 | 2 | 1 | 9 | 2 | 1 | 1 | 1 | 5 | 3 | 1 | 5 | 4 | 5 | ||||||
| nonsynonymous SNV | 3 | 2 | 1 | 6 | 2 | 1 | 1 | 4 | 3 | 4 | 3 | 4 | ||||||||
| synonymous SNV | 1 | 3 | 1 | 1 | 1 | 1 | 1 | 1 |
| cf) Tissue ID; Tissue type (1; BLCA[Bladder Urothelial Carcinoma], 2; BRCA[Breast invasive carcinoma], 3; CESC[Cervical squamous cell carcinoma and endocervical adenocarcinoma], 4; COAD[Colon adenocarcinoma], 5; GBM[Glioblastoma multiforme], 6; Glioma Low Grade, 7; HNSC[Head and Neck squamous cell carcinoma], 8; KICH[Kidney Chromophobe], 9; KIRC[Kidney renal clear cell carcinoma], 10; KIRP[Kidney renal papillary cell carcinoma], 11; LAML[Acute Myeloid Leukemia], 12; LUAD[Lung adenocarcinoma], 13; LUSC[Lung squamous cell carcinoma], 14; OV[Ovarian serous cystadenocarcinoma ], 15; PAAD[Pancreatic adenocarcinoma], 16; PRAD[Prostate adenocarcinoma], 17; SKCM[Skin Cutaneous Melanoma], 18:STAD[Stomach adenocarcinoma], 19:THCA[Thyroid carcinoma], 20:UCEC[Uterine Corpus Endometrial Carcinoma]) |
| Top |
| * We represented just top 10 SNVs. When you move the cursor on each content, you can see more deailed mutation information on the Tooltip. Those are primary_site, primary_histology, mutation(aa), pubmedID. |
| Genomic Position | Mutation(aa) | Unique sampleID count |
| chr14:77987880 | p.R450G | 3 |
| chr14:77978688 | p.R543Q | 2 |
| chr14:78063612 | p.T82S | 2 |
| chr14:78023409 | p.D366H | 1 |
| chr14:77978671 | p.W94R | 1 |
| chr14:78045449 | p.R541S | 1 |
| chr14:77987881 | p.A351S | 1 |
| chr14:78028787 | p.L87I | 1 |
| chr14:78063576 | p.E519Q | 1 |
| chr14:78018487 | p.L341L | 1 |
| * Copy number data were extracted from TCGA using R package TCGA-Assembler. The URLs of all public data files on TCGA DCC data server were gathered on Jan-05-2015. Function ProcessCNAData in TCGA-Assembler package was used to obtain gene-level copy number value which is calculated as the average copy number of the genomic region of a gene. |
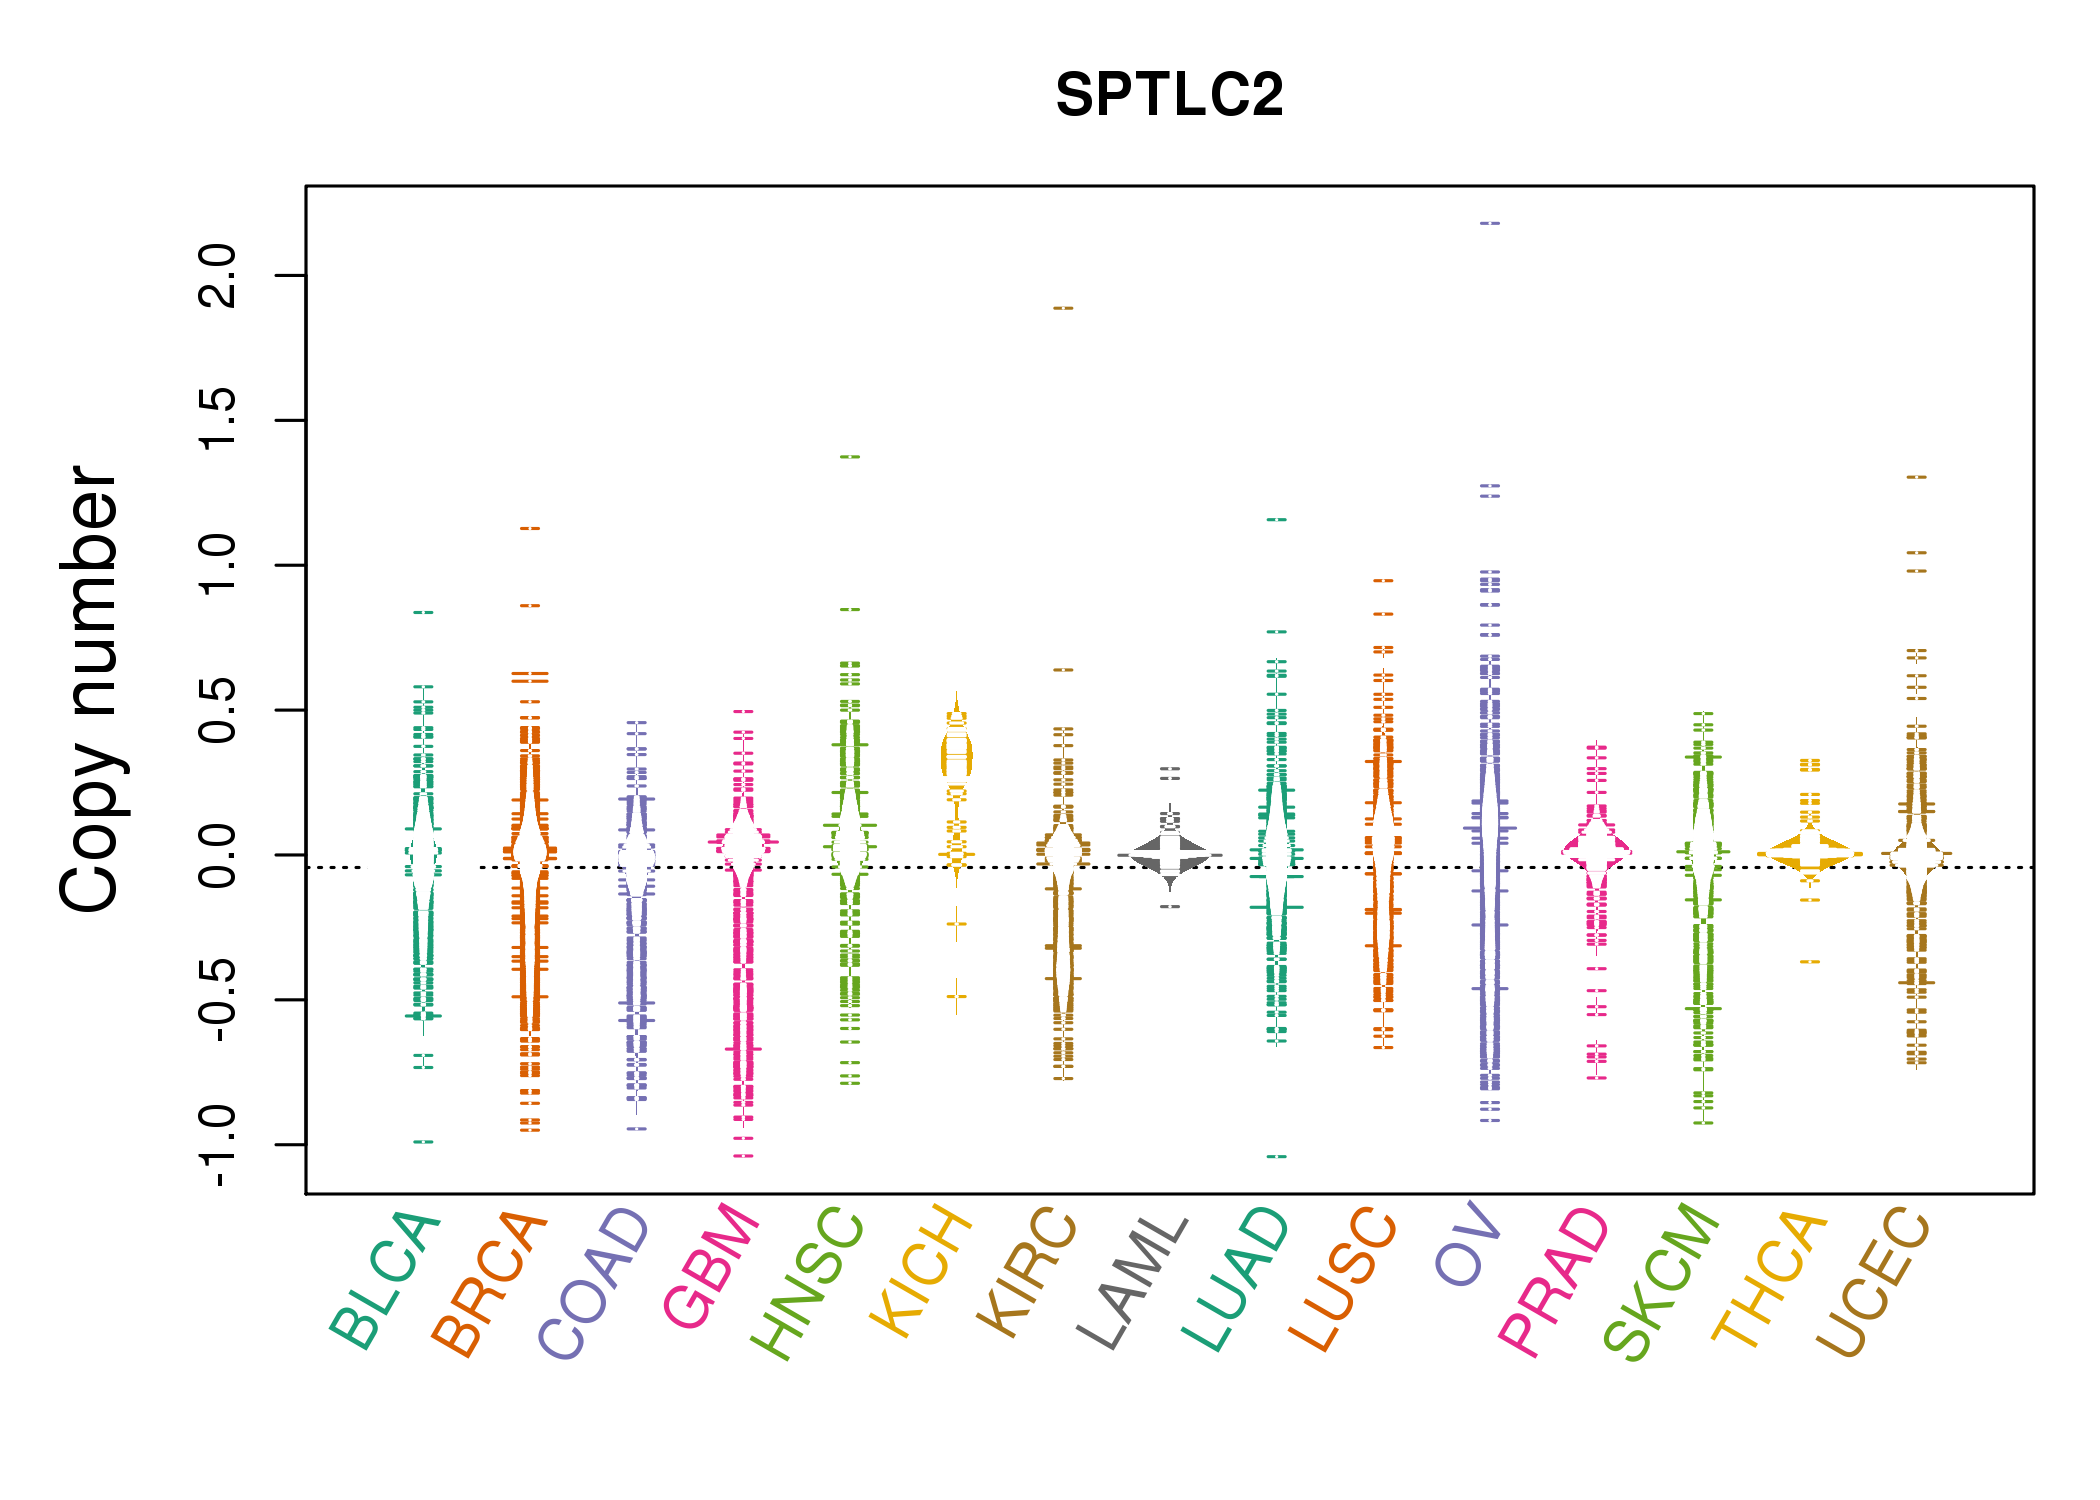 |
| cf) Tissue ID[Tissue type]: BLCA[Bladder Urothelial Carcinoma], BRCA[Breast invasive carcinoma], CESC[Cervical squamous cell carcinoma and endocervical adenocarcinoma], COAD[Colon adenocarcinoma], GBM[Glioblastoma multiforme], Glioma Low Grade, HNSC[Head and Neck squamous cell carcinoma], KICH[Kidney Chromophobe], KIRC[Kidney renal clear cell carcinoma], KIRP[Kidney renal papillary cell carcinoma], LAML[Acute Myeloid Leukemia], LUAD[Lung adenocarcinoma], LUSC[Lung squamous cell carcinoma], OV[Ovarian serous cystadenocarcinoma ], PAAD[Pancreatic adenocarcinoma], PRAD[Prostate adenocarcinoma], SKCM[Skin Cutaneous Melanoma], STAD[Stomach adenocarcinoma], THCA[Thyroid carcinoma], UCEC[Uterine Corpus Endometrial Carcinoma] |
| Top |
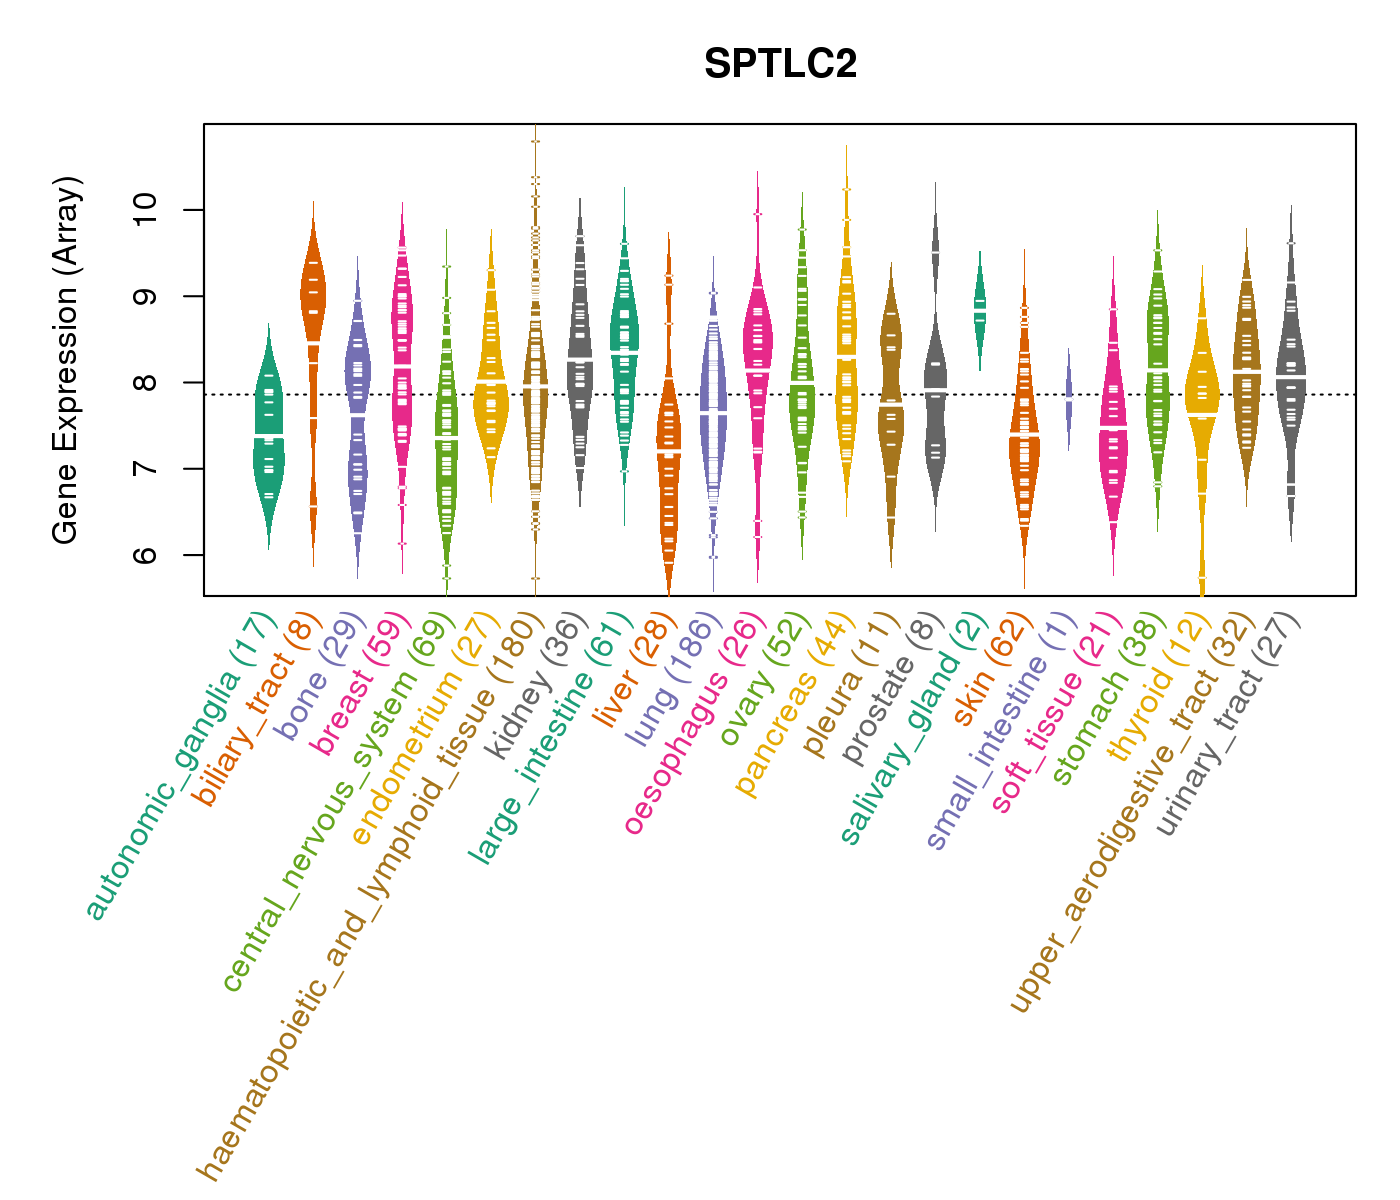
| Gene Expression for SPTLC2 |
| * CCLE gene expression data were extracted from CCLE_Expression_Entrez_2012-10-18.res: Gene-centric RMA-normalized mRNA expression data. |
 |
| * Normalized gene expression data of RNASeqV2 was extracted from TCGA using R package TCGA-Assembler. The URLs of all public data files on TCGA DCC data server were gathered at Jan-05-2015. Only eight cancer types have enough normal control samples for differential expression analysis. (t test, adjusted p<0.05 (using Benjamini-Hochberg FDR)) |
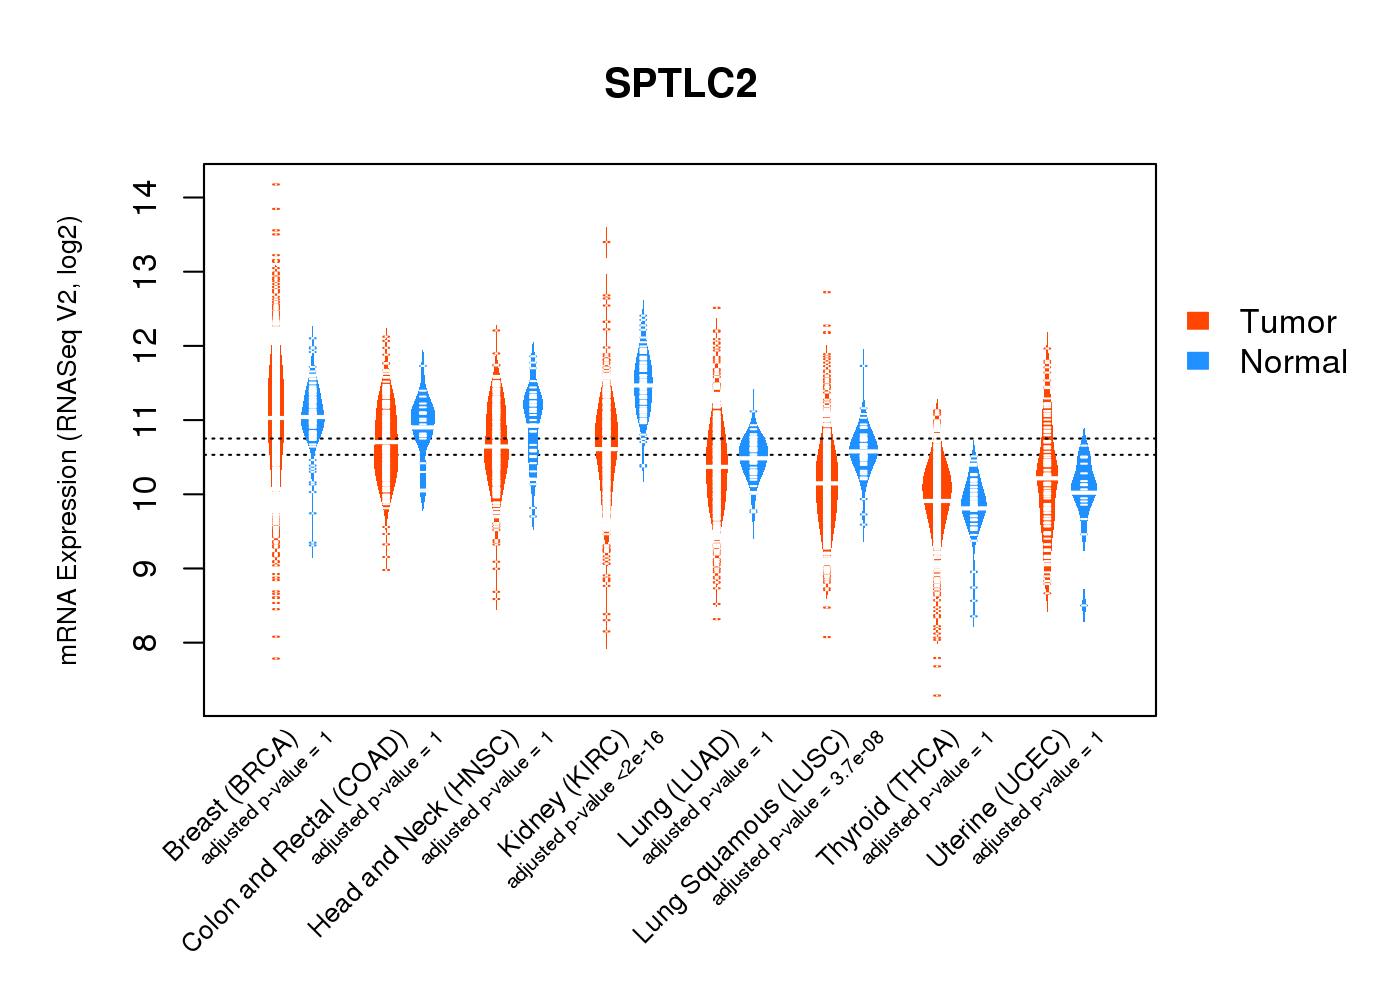 |
| Top |
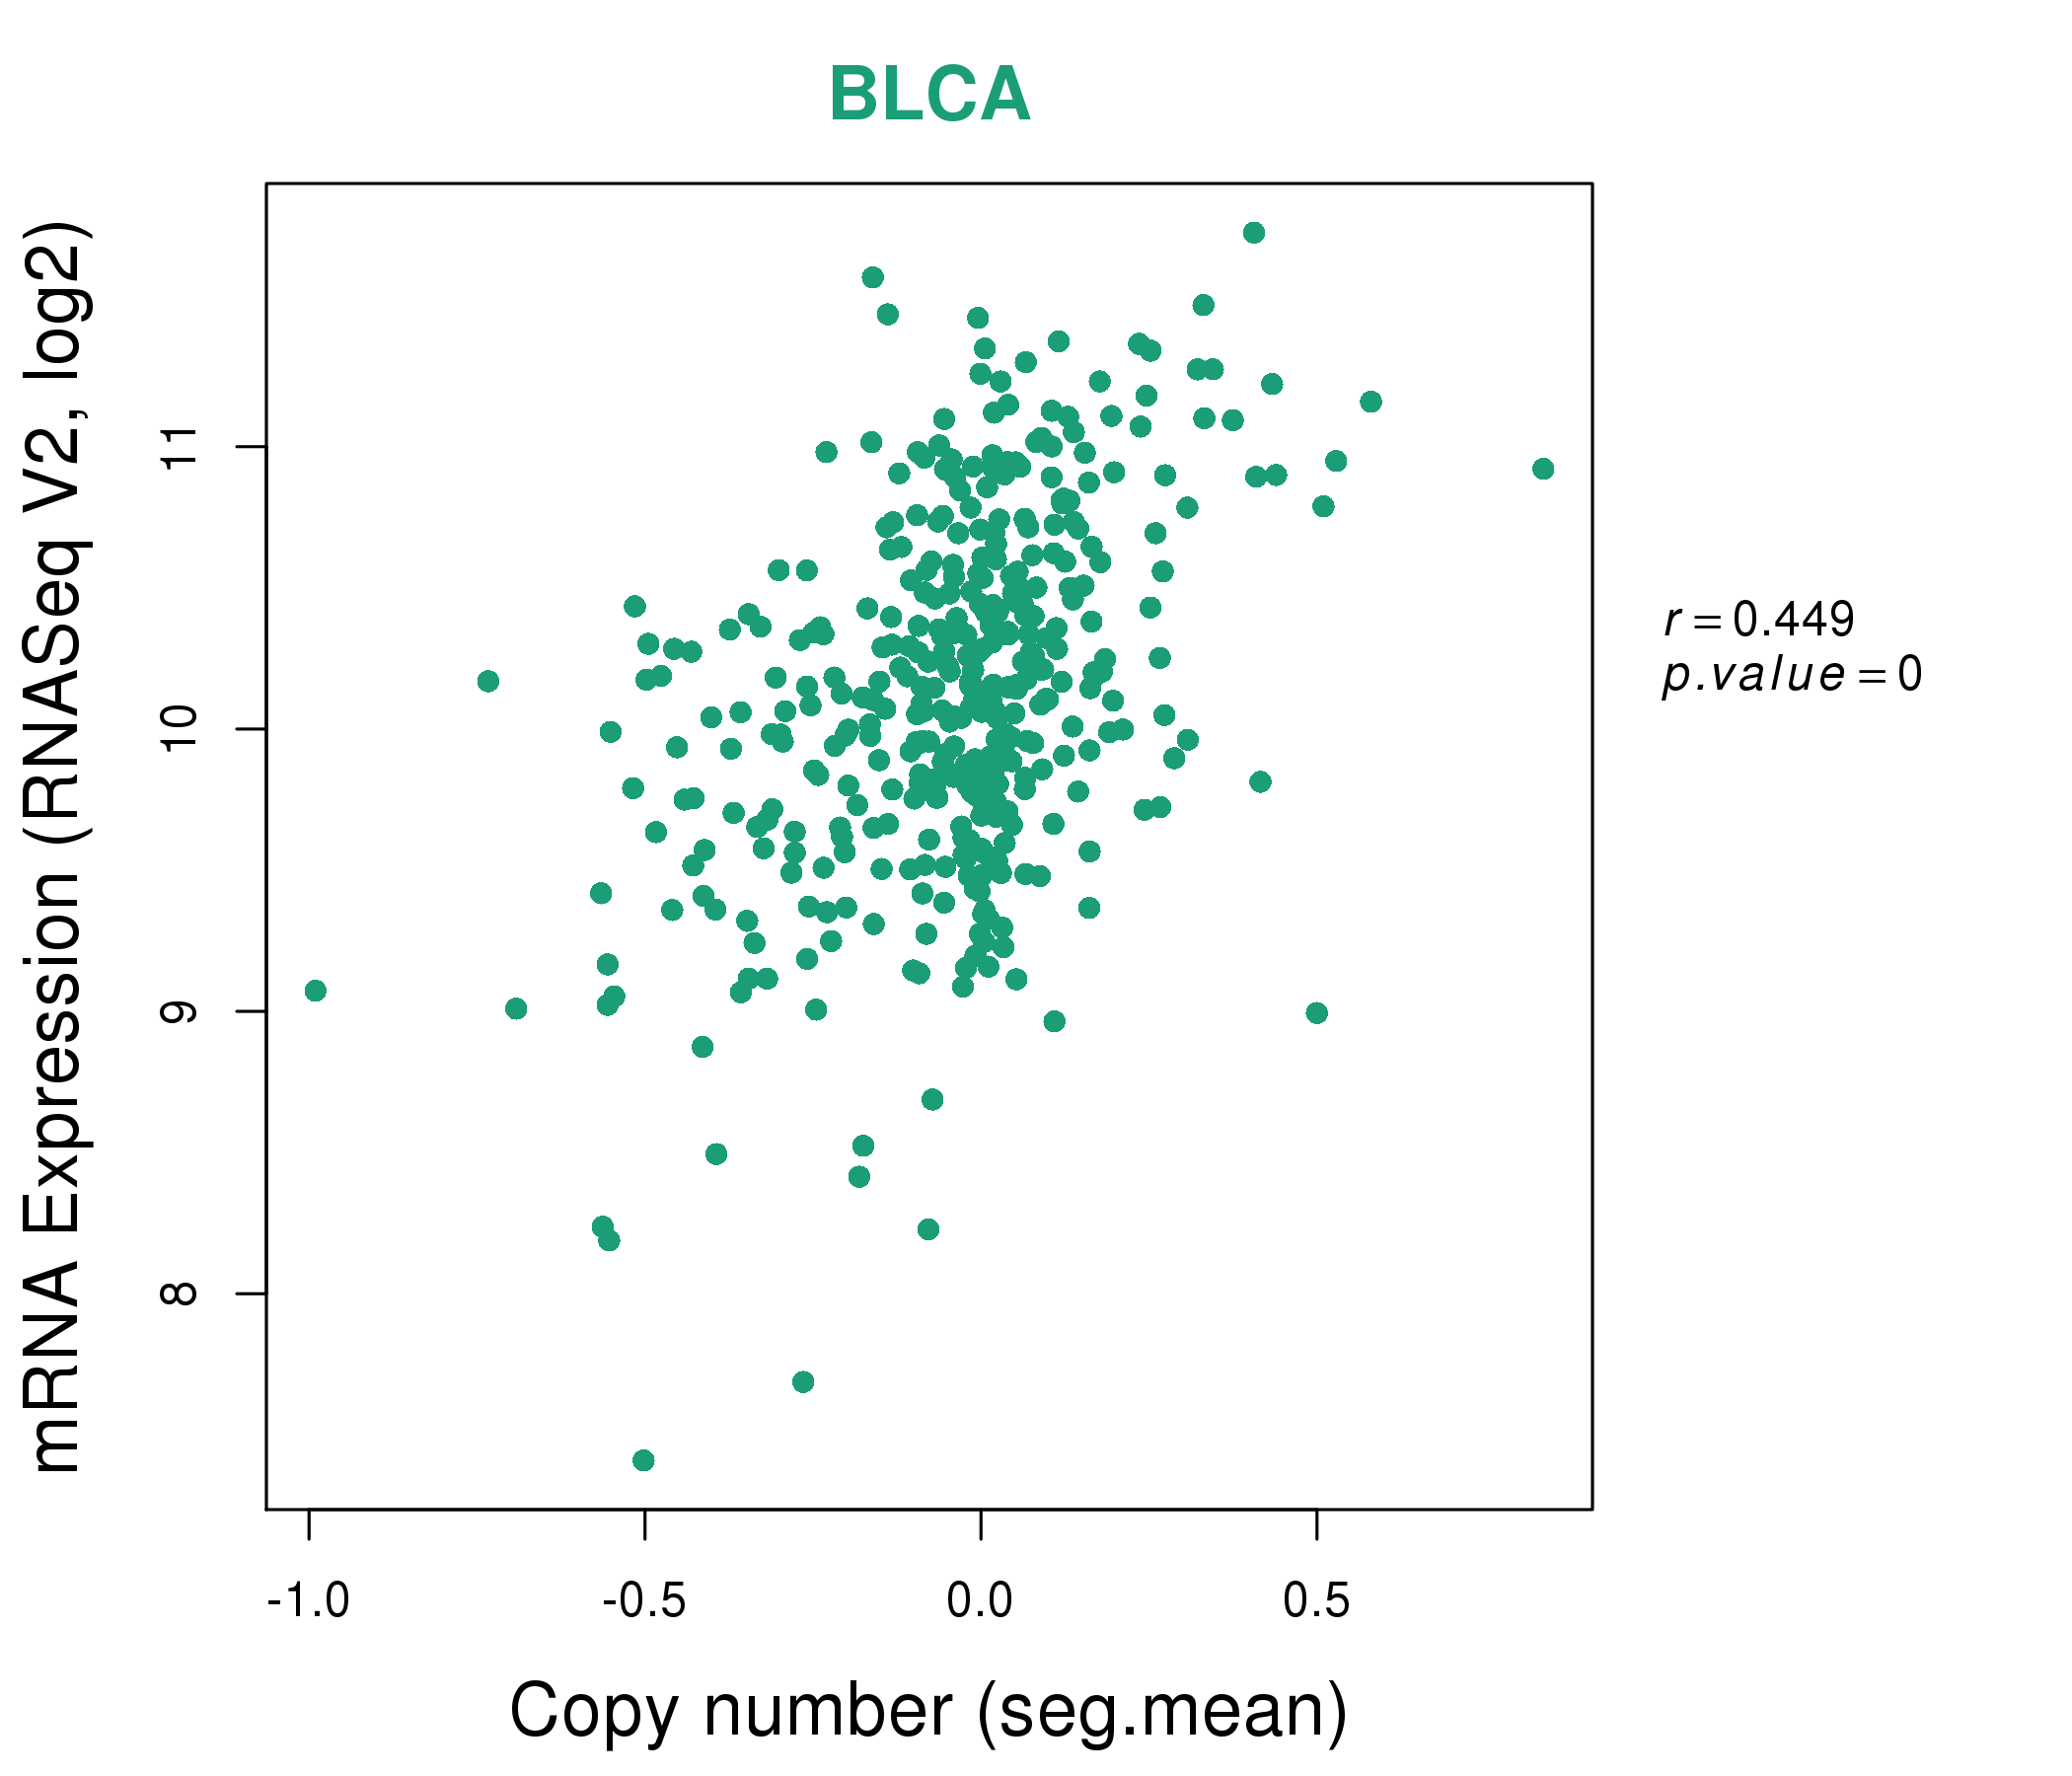
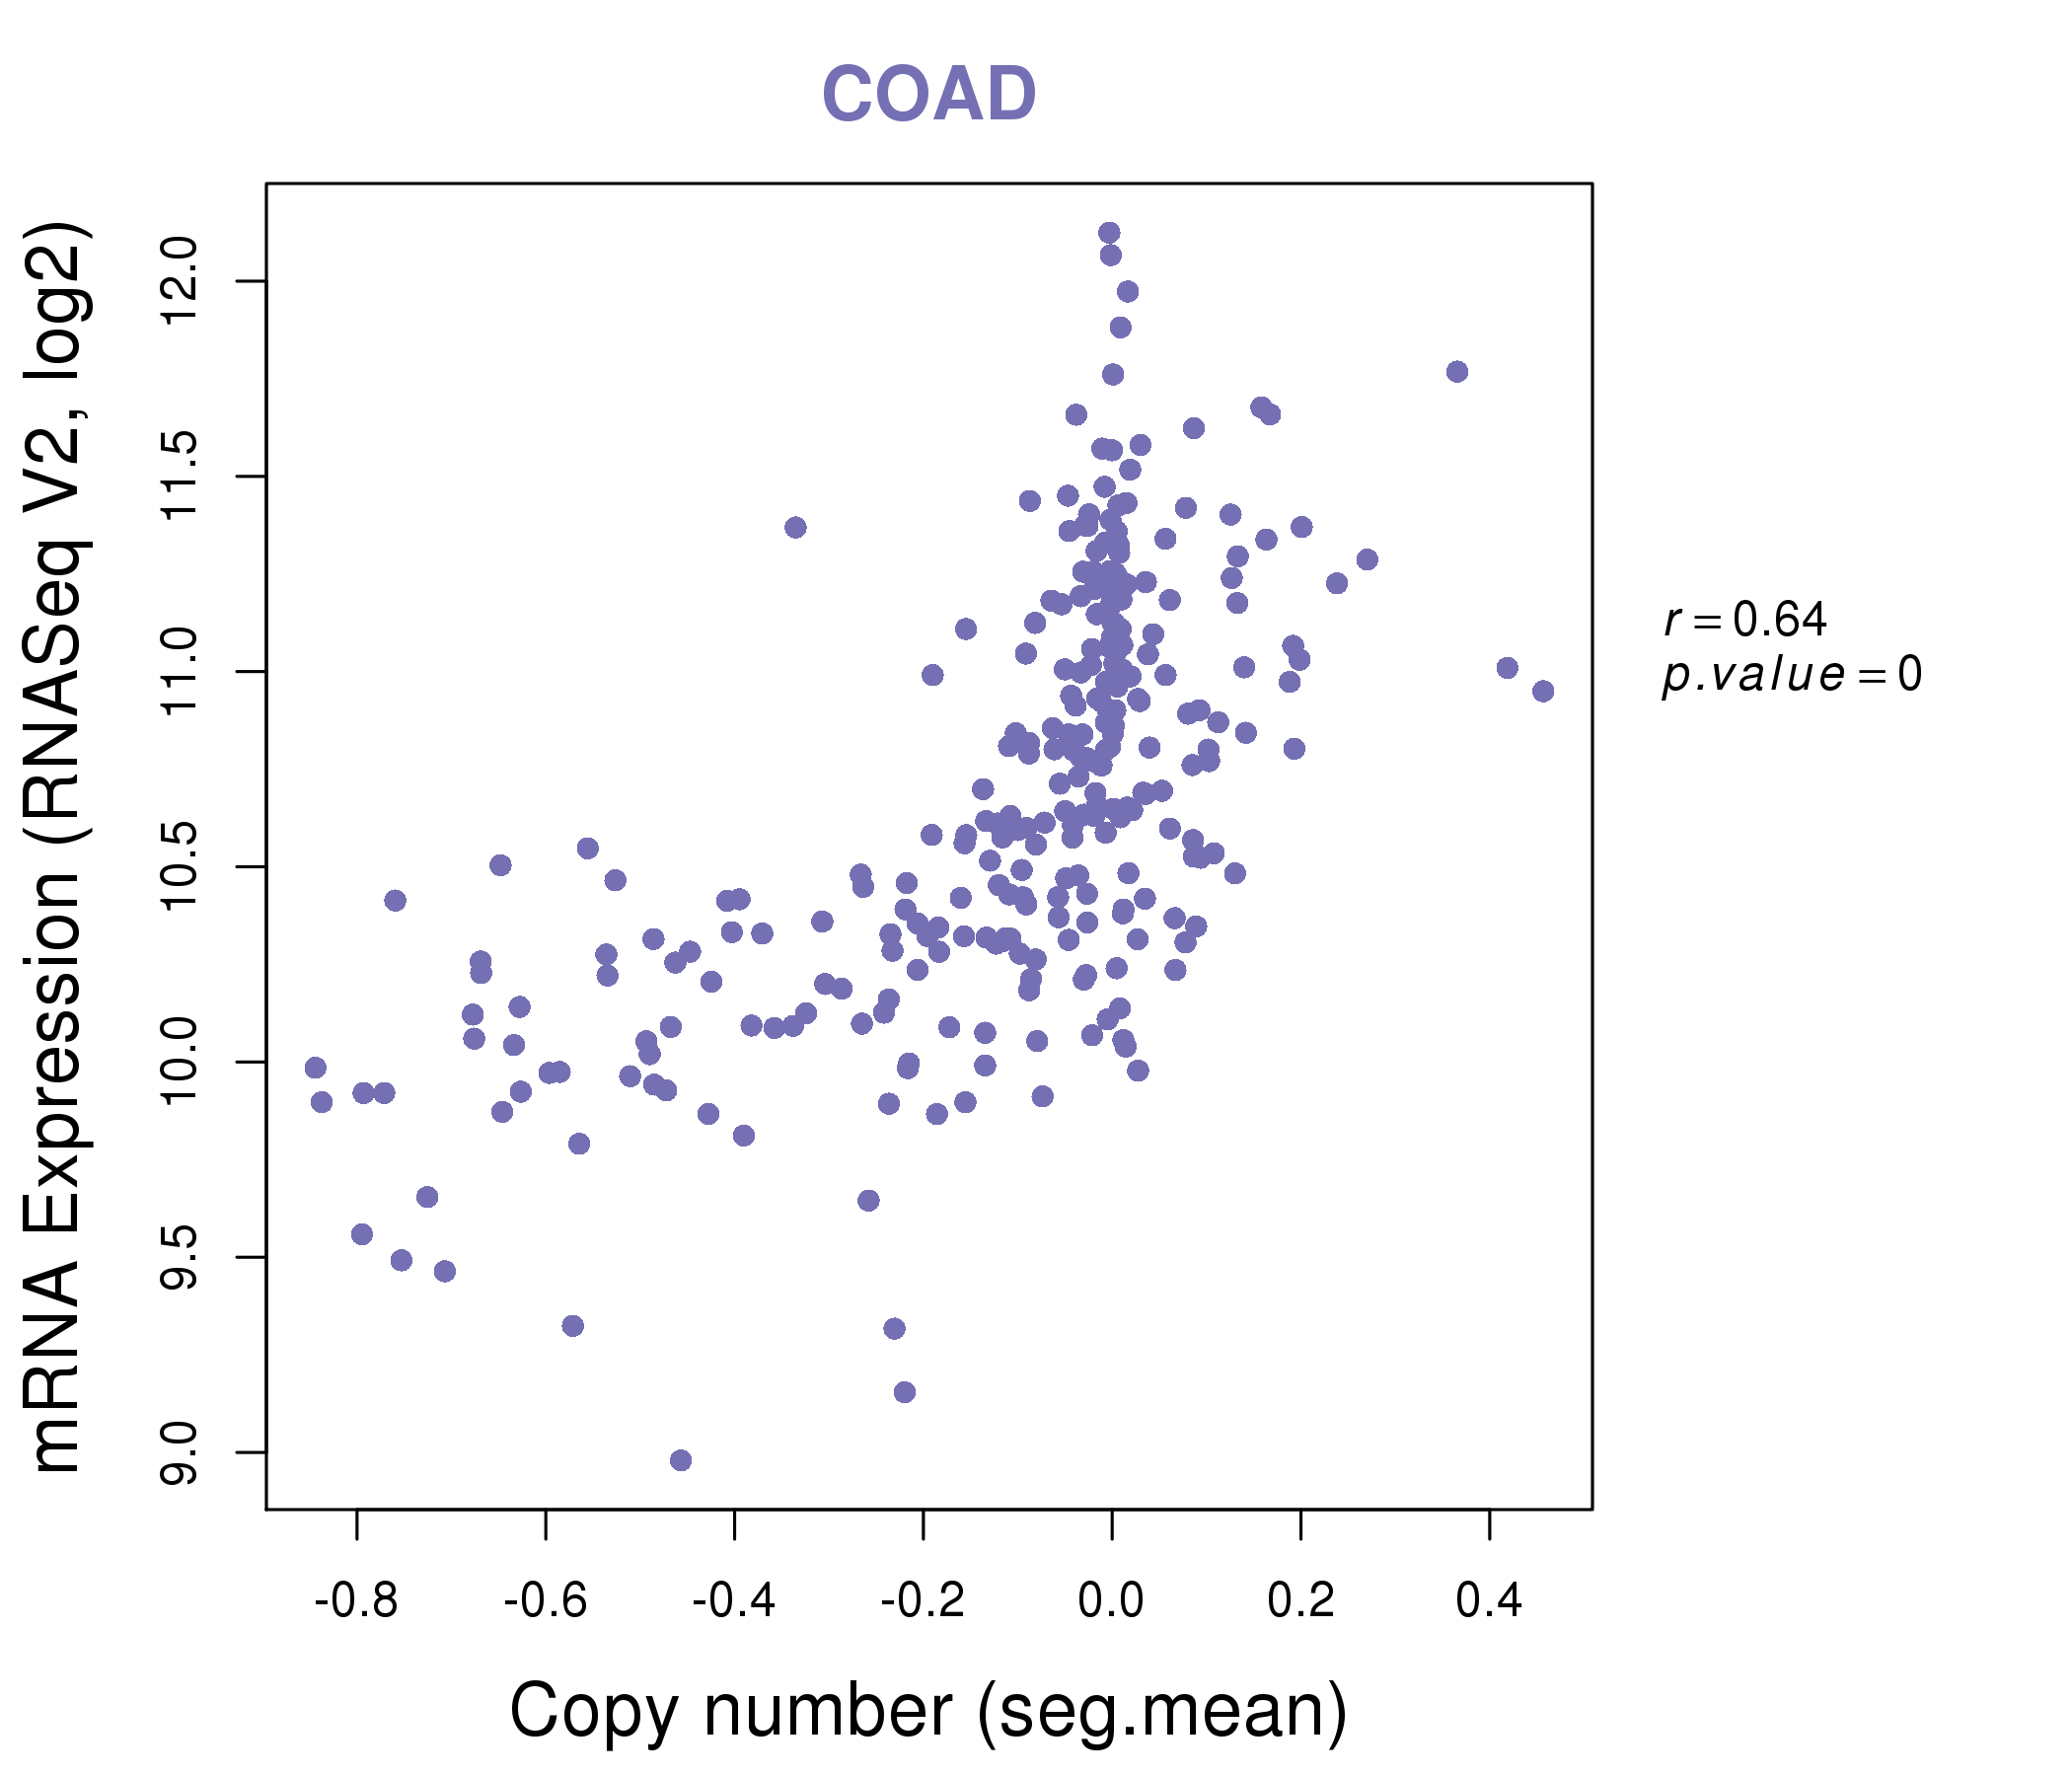
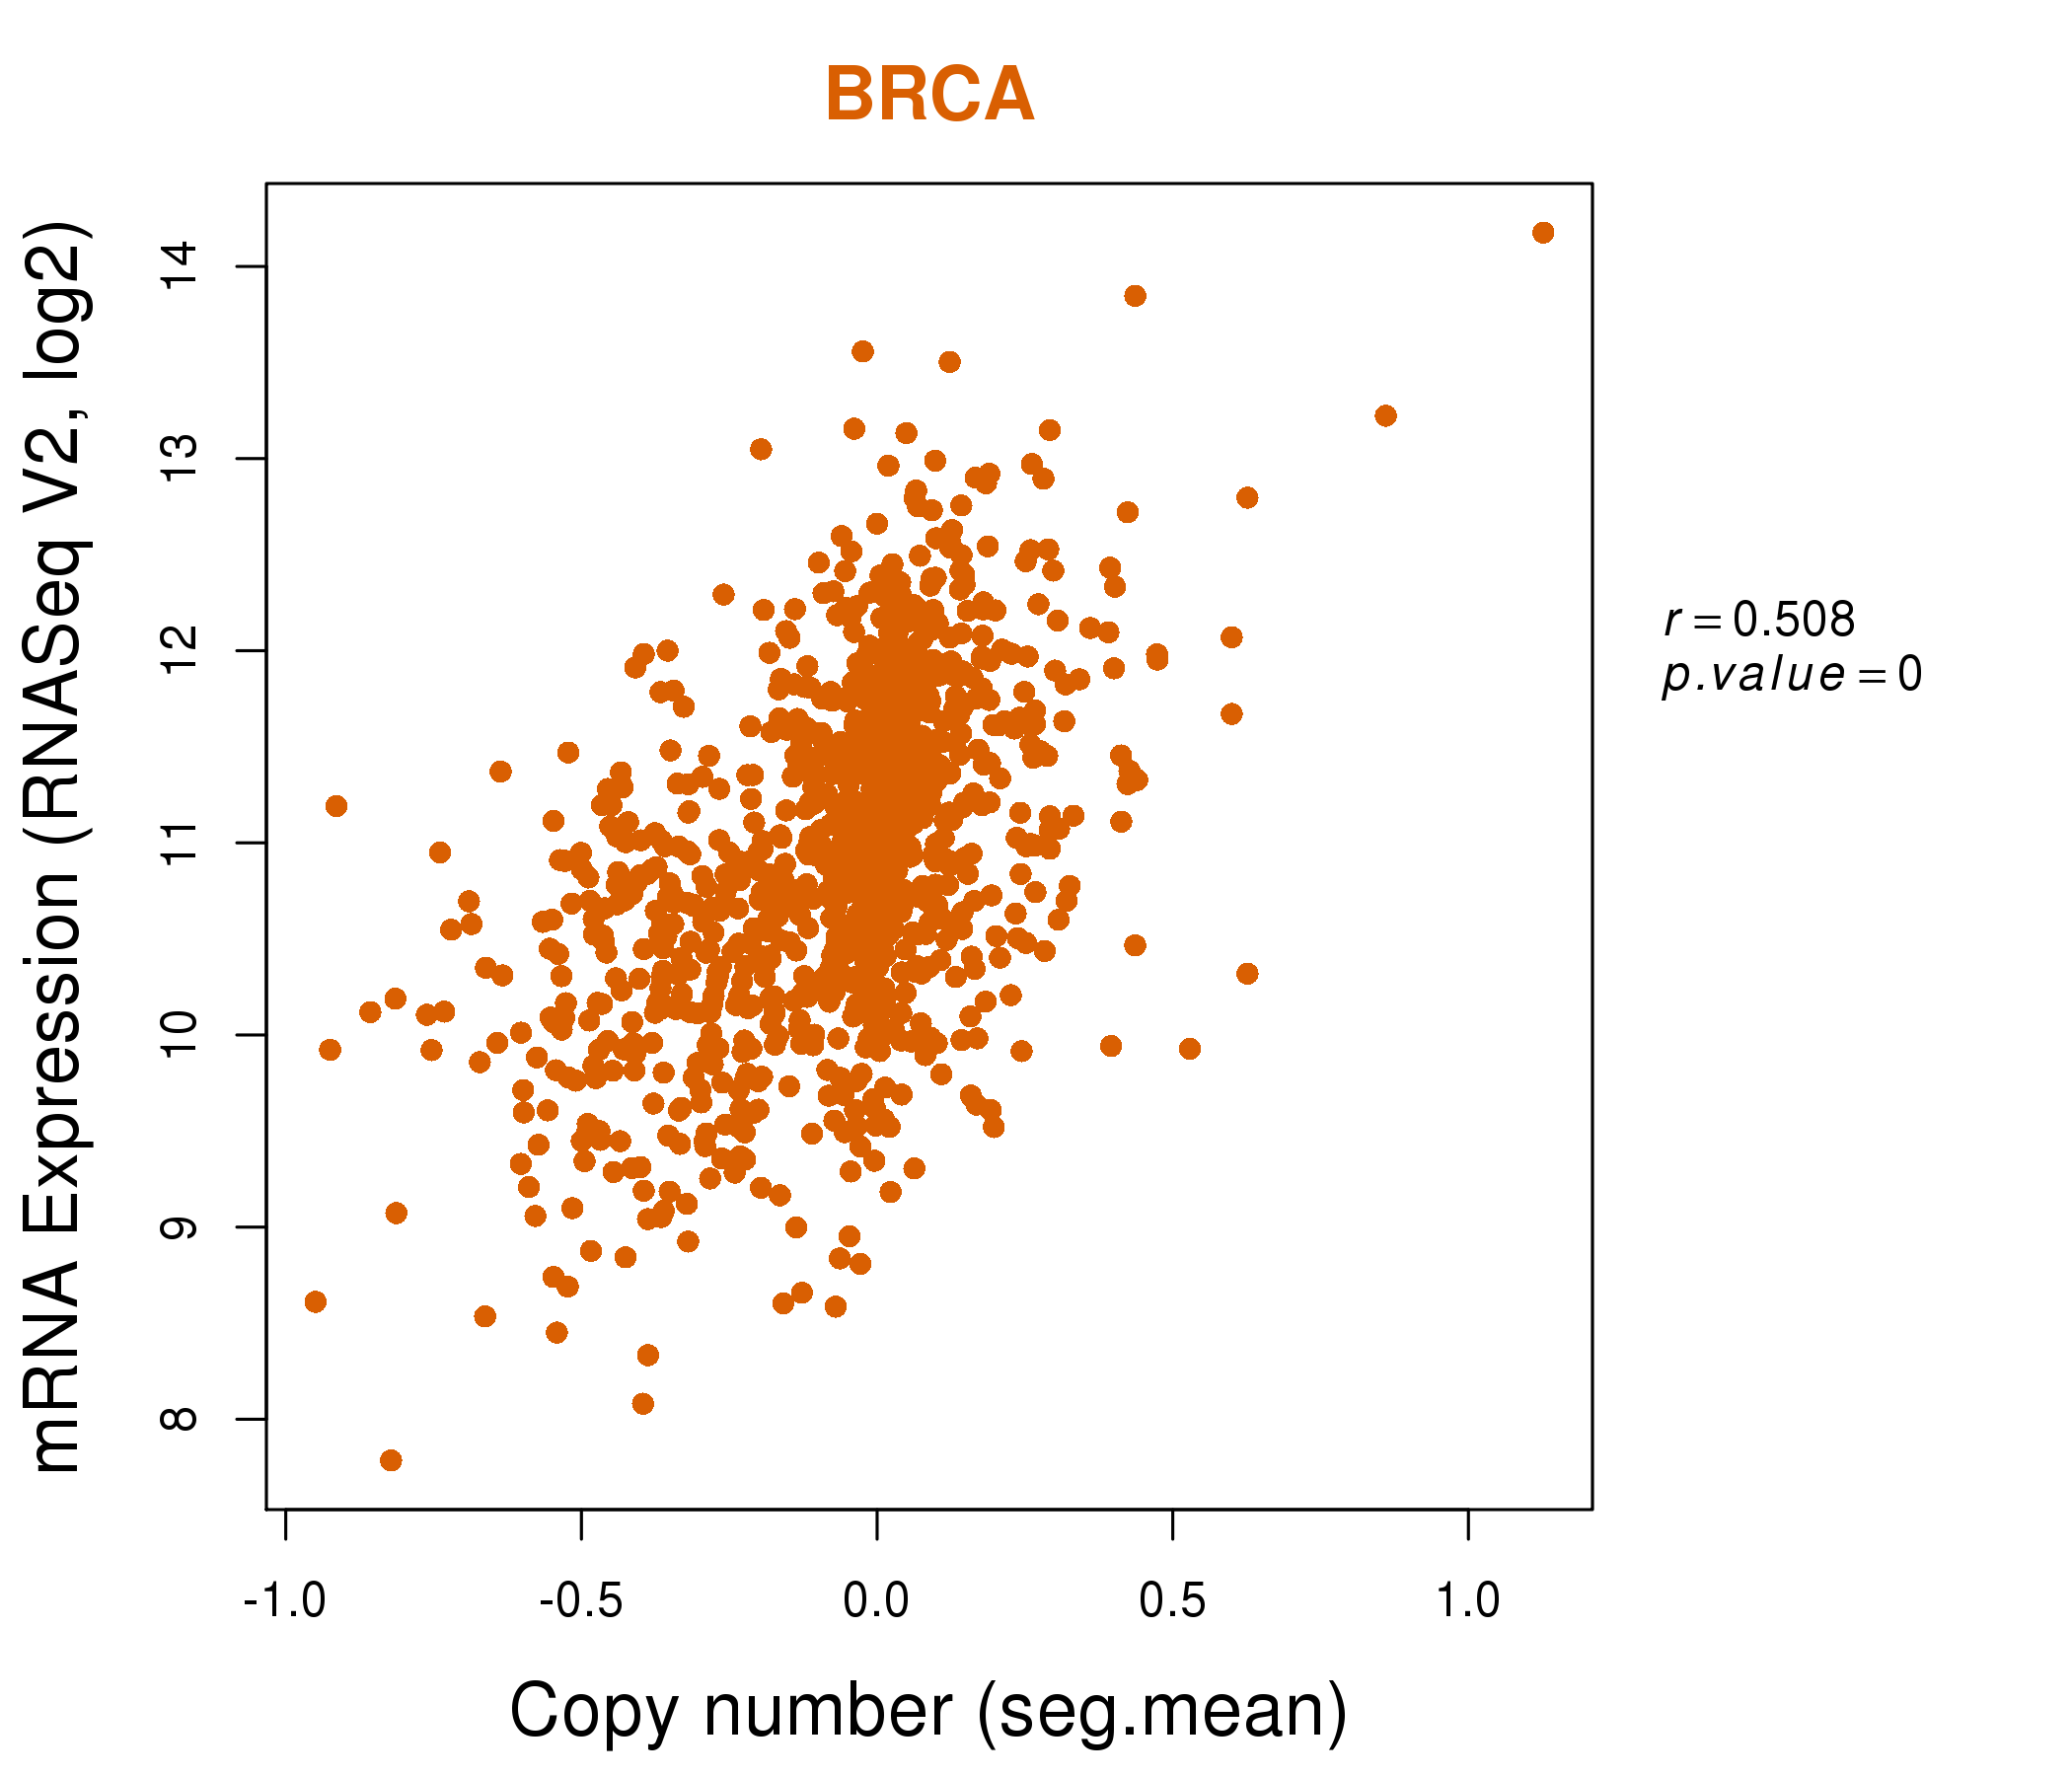
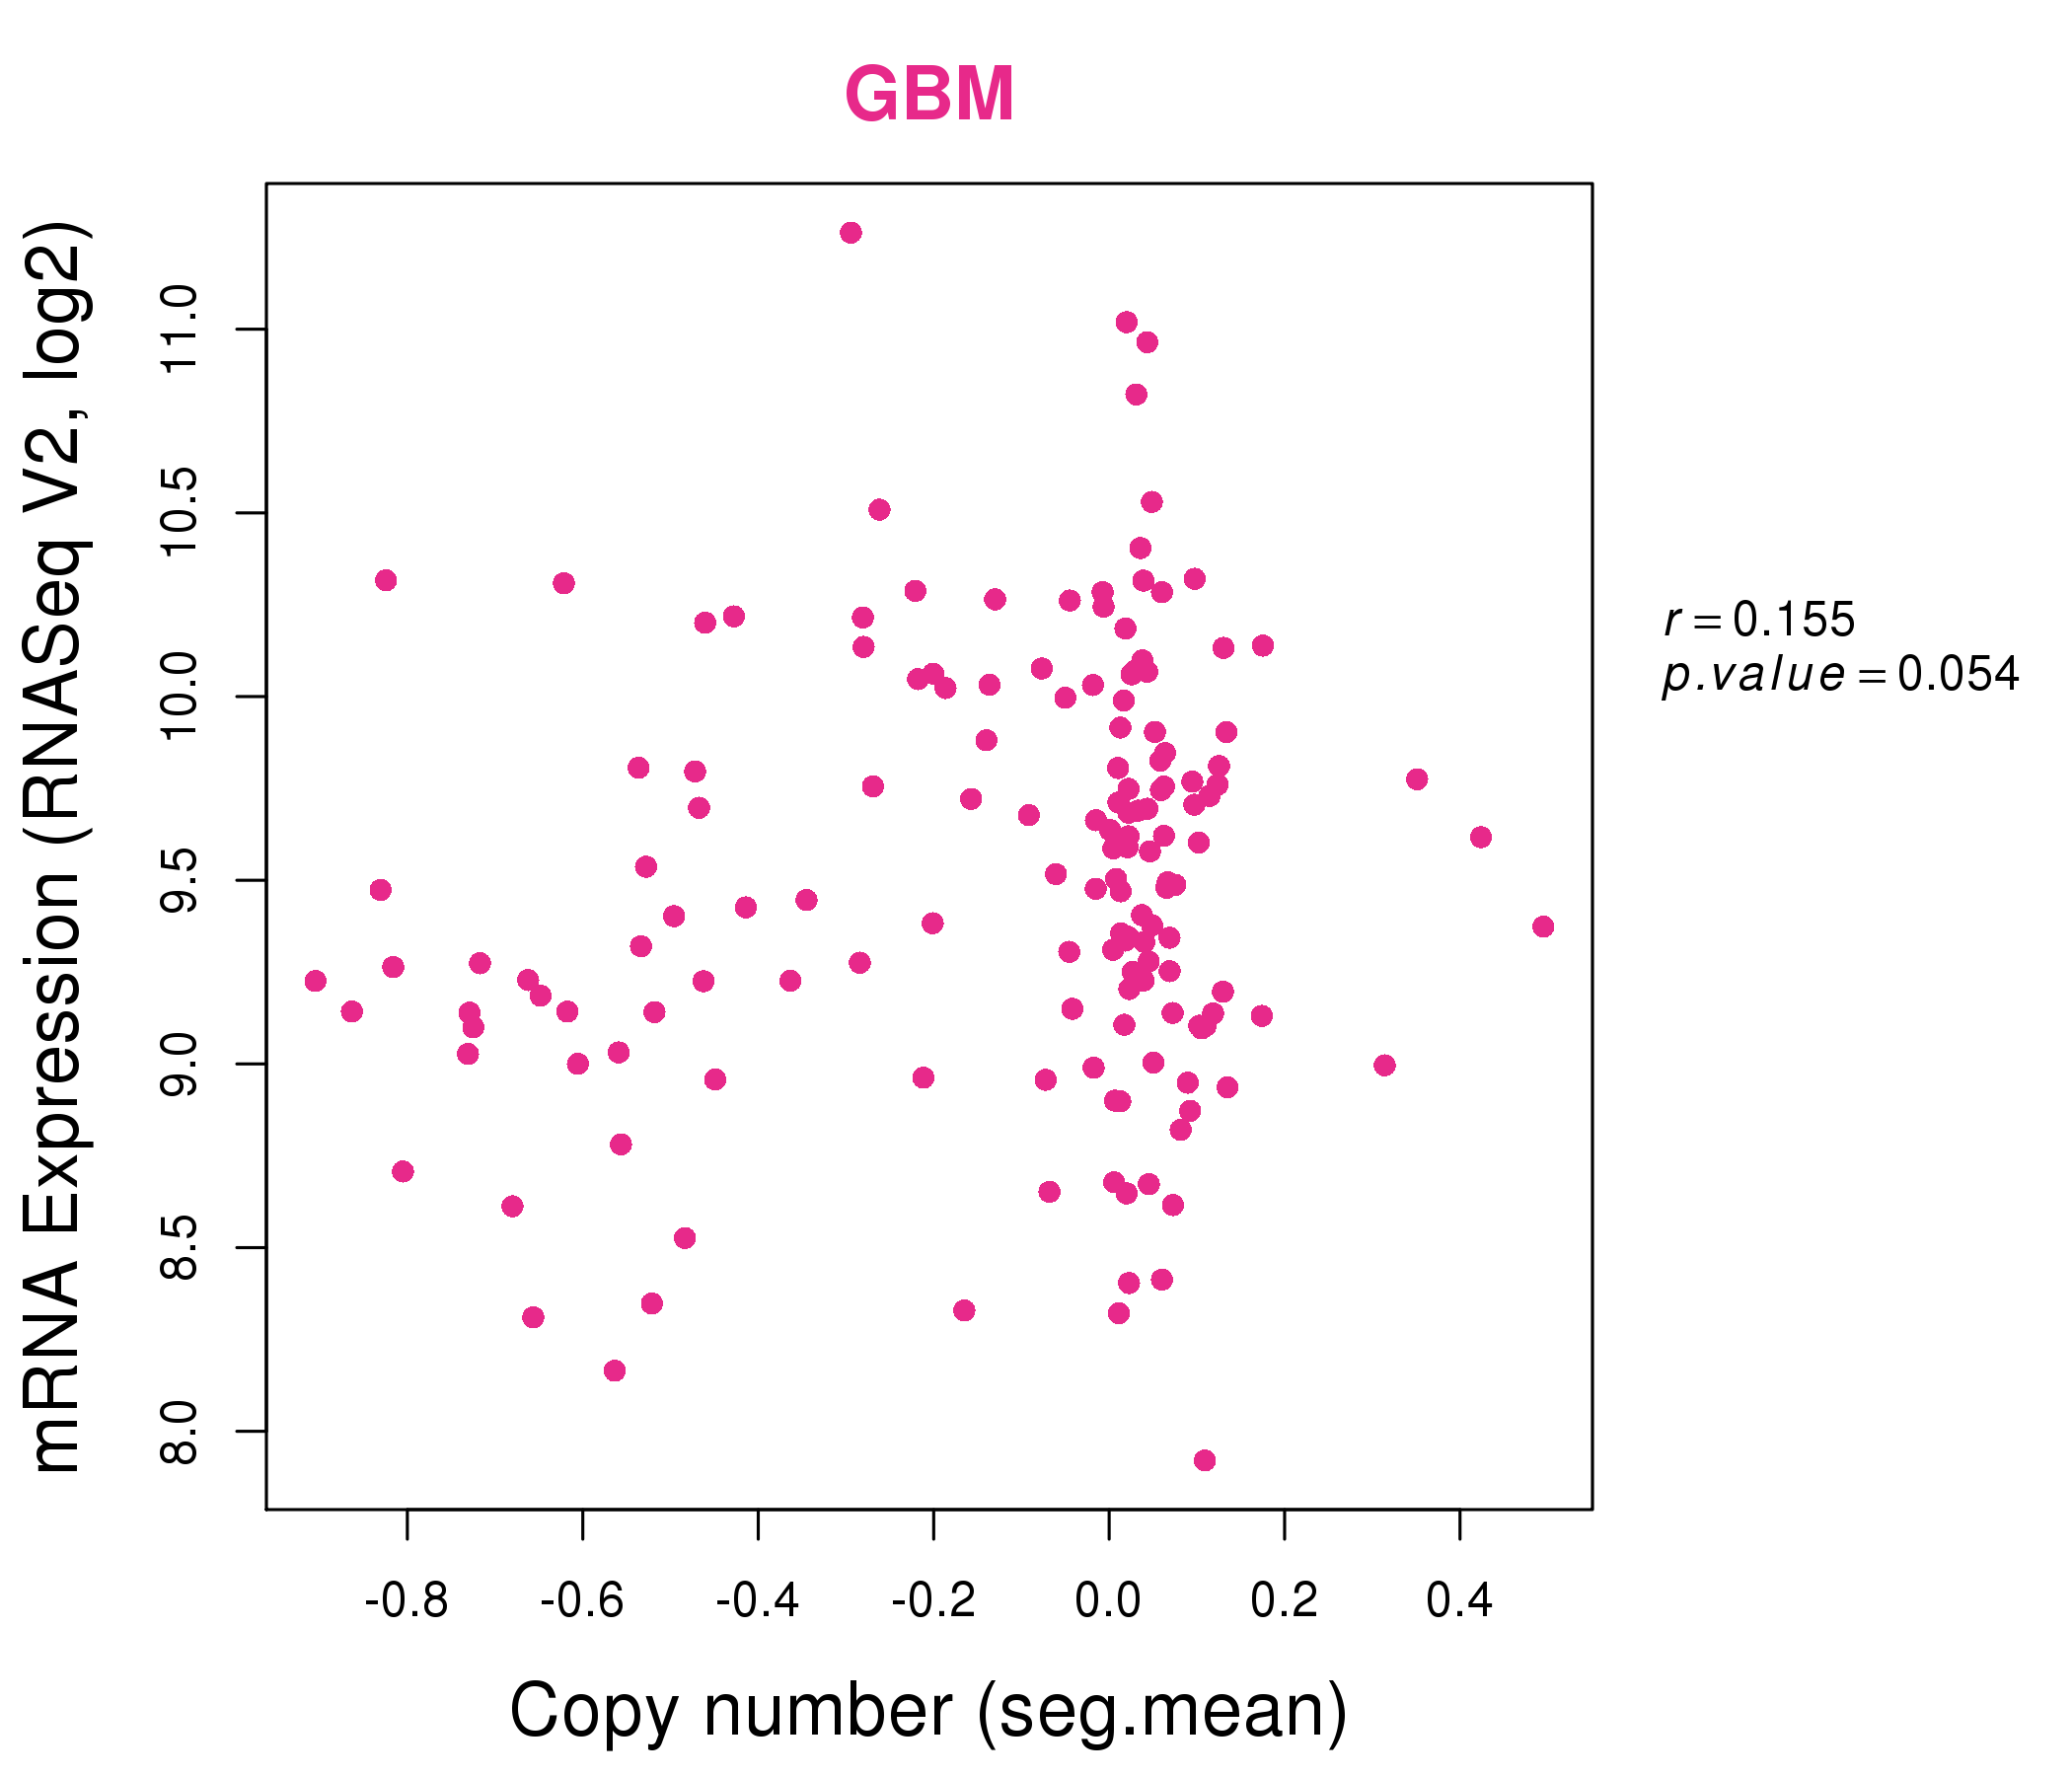
| * This plots show the correlation between CNV and gene expression. |
: Open all plots for all cancer types
 |
|
 |
|
| Top |
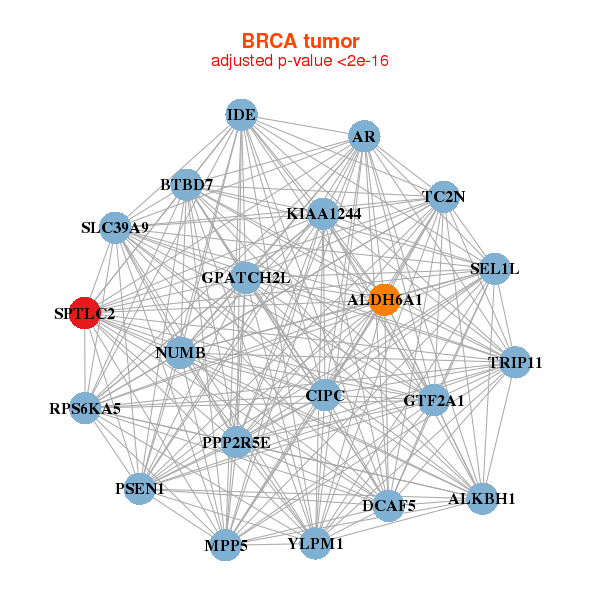
| Gene-Gene Network Information |
| * Co-Expression network figures were drawn using R package igraph. Only the top 20 genes with the highest correlations were shown. Red circle: input gene, orange circle: cell metabolism gene, sky circle: other gene |
: Open all plots for all cancer types
 |
| ||||
| ALDH6A1,ALKBH1,AR,BTBD7,GPATCH2L,DCAF5,GTF2A1, IDE,KIAA1244,CIPC,MPP5,NUMB,PPP2R5E,PSEN1, RPS6KA5,SEL1L,SLC39A9,SPTLC2,TC2N,TRIP11,YLPM1 | ANAPC1,AQR,CEP128,C9orf41,CDK12,CLCN3,CPD, DPY19L3,FAM73A,GPR107,HDX,HFE,IPMK,SCYL2, SPG11,SPTLC2,TMEM181,TMTC2,XYLB,ZDHHC20,ZFYVE16 | ||||
 |
| ||||
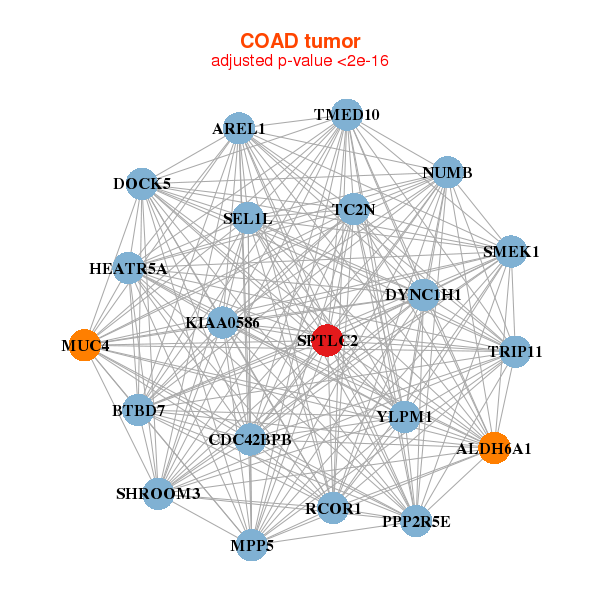
| ALDH6A1,BTBD7,CDC42BPB,DOCK5,DYNC1H1,HEATR5A,AREL1, KIAA0586,MPP5,MUC4,NUMB,PPP2R5E,RCOR1,SEL1L, SHROOM3,SMEK1,SPTLC2,TC2N,TMED10,TRIP11,YLPM1 | AIM1,ARFGEF2,ARHGAP32,PRR14L,CLTC,CNOT1,DCAF7, DNAJC16,FAM120A,FNBP1L,KDM4A,LARP4B,MAML2,MLEC, OSBP,RALGAPA2,SPG11,SPTLC2,SYNE2,ZBED4,ZBTB10 |
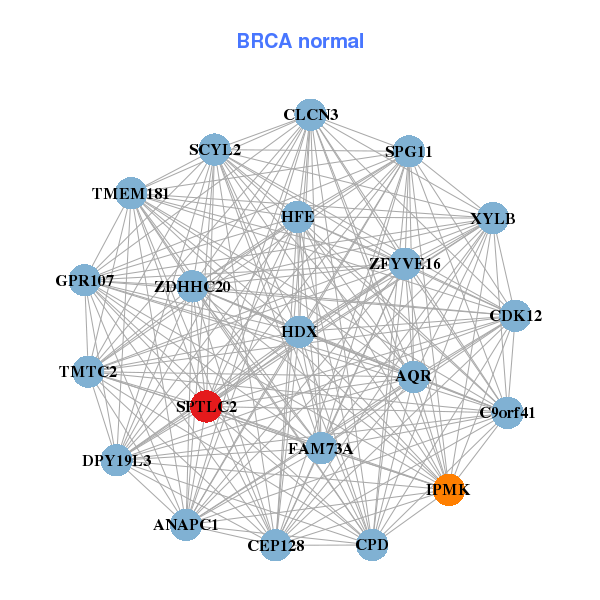

| * Co-Expression network figures were drawn using R package igraph. Only the top 20 genes with the highest correlations were shown. Red circle: input gene, orange circle: cell metabolism gene, sky circle: other gene |
: Open all plots for all cancer types
| Top |
: Open all interacting genes' information including KEGG pathway for all interacting genes from DAVID
| Top |
| Pharmacological Information for SPTLC2 |
| DB Category | DB Name | DB's ID and Url link |
| * Gene Centered Interaction Network. |
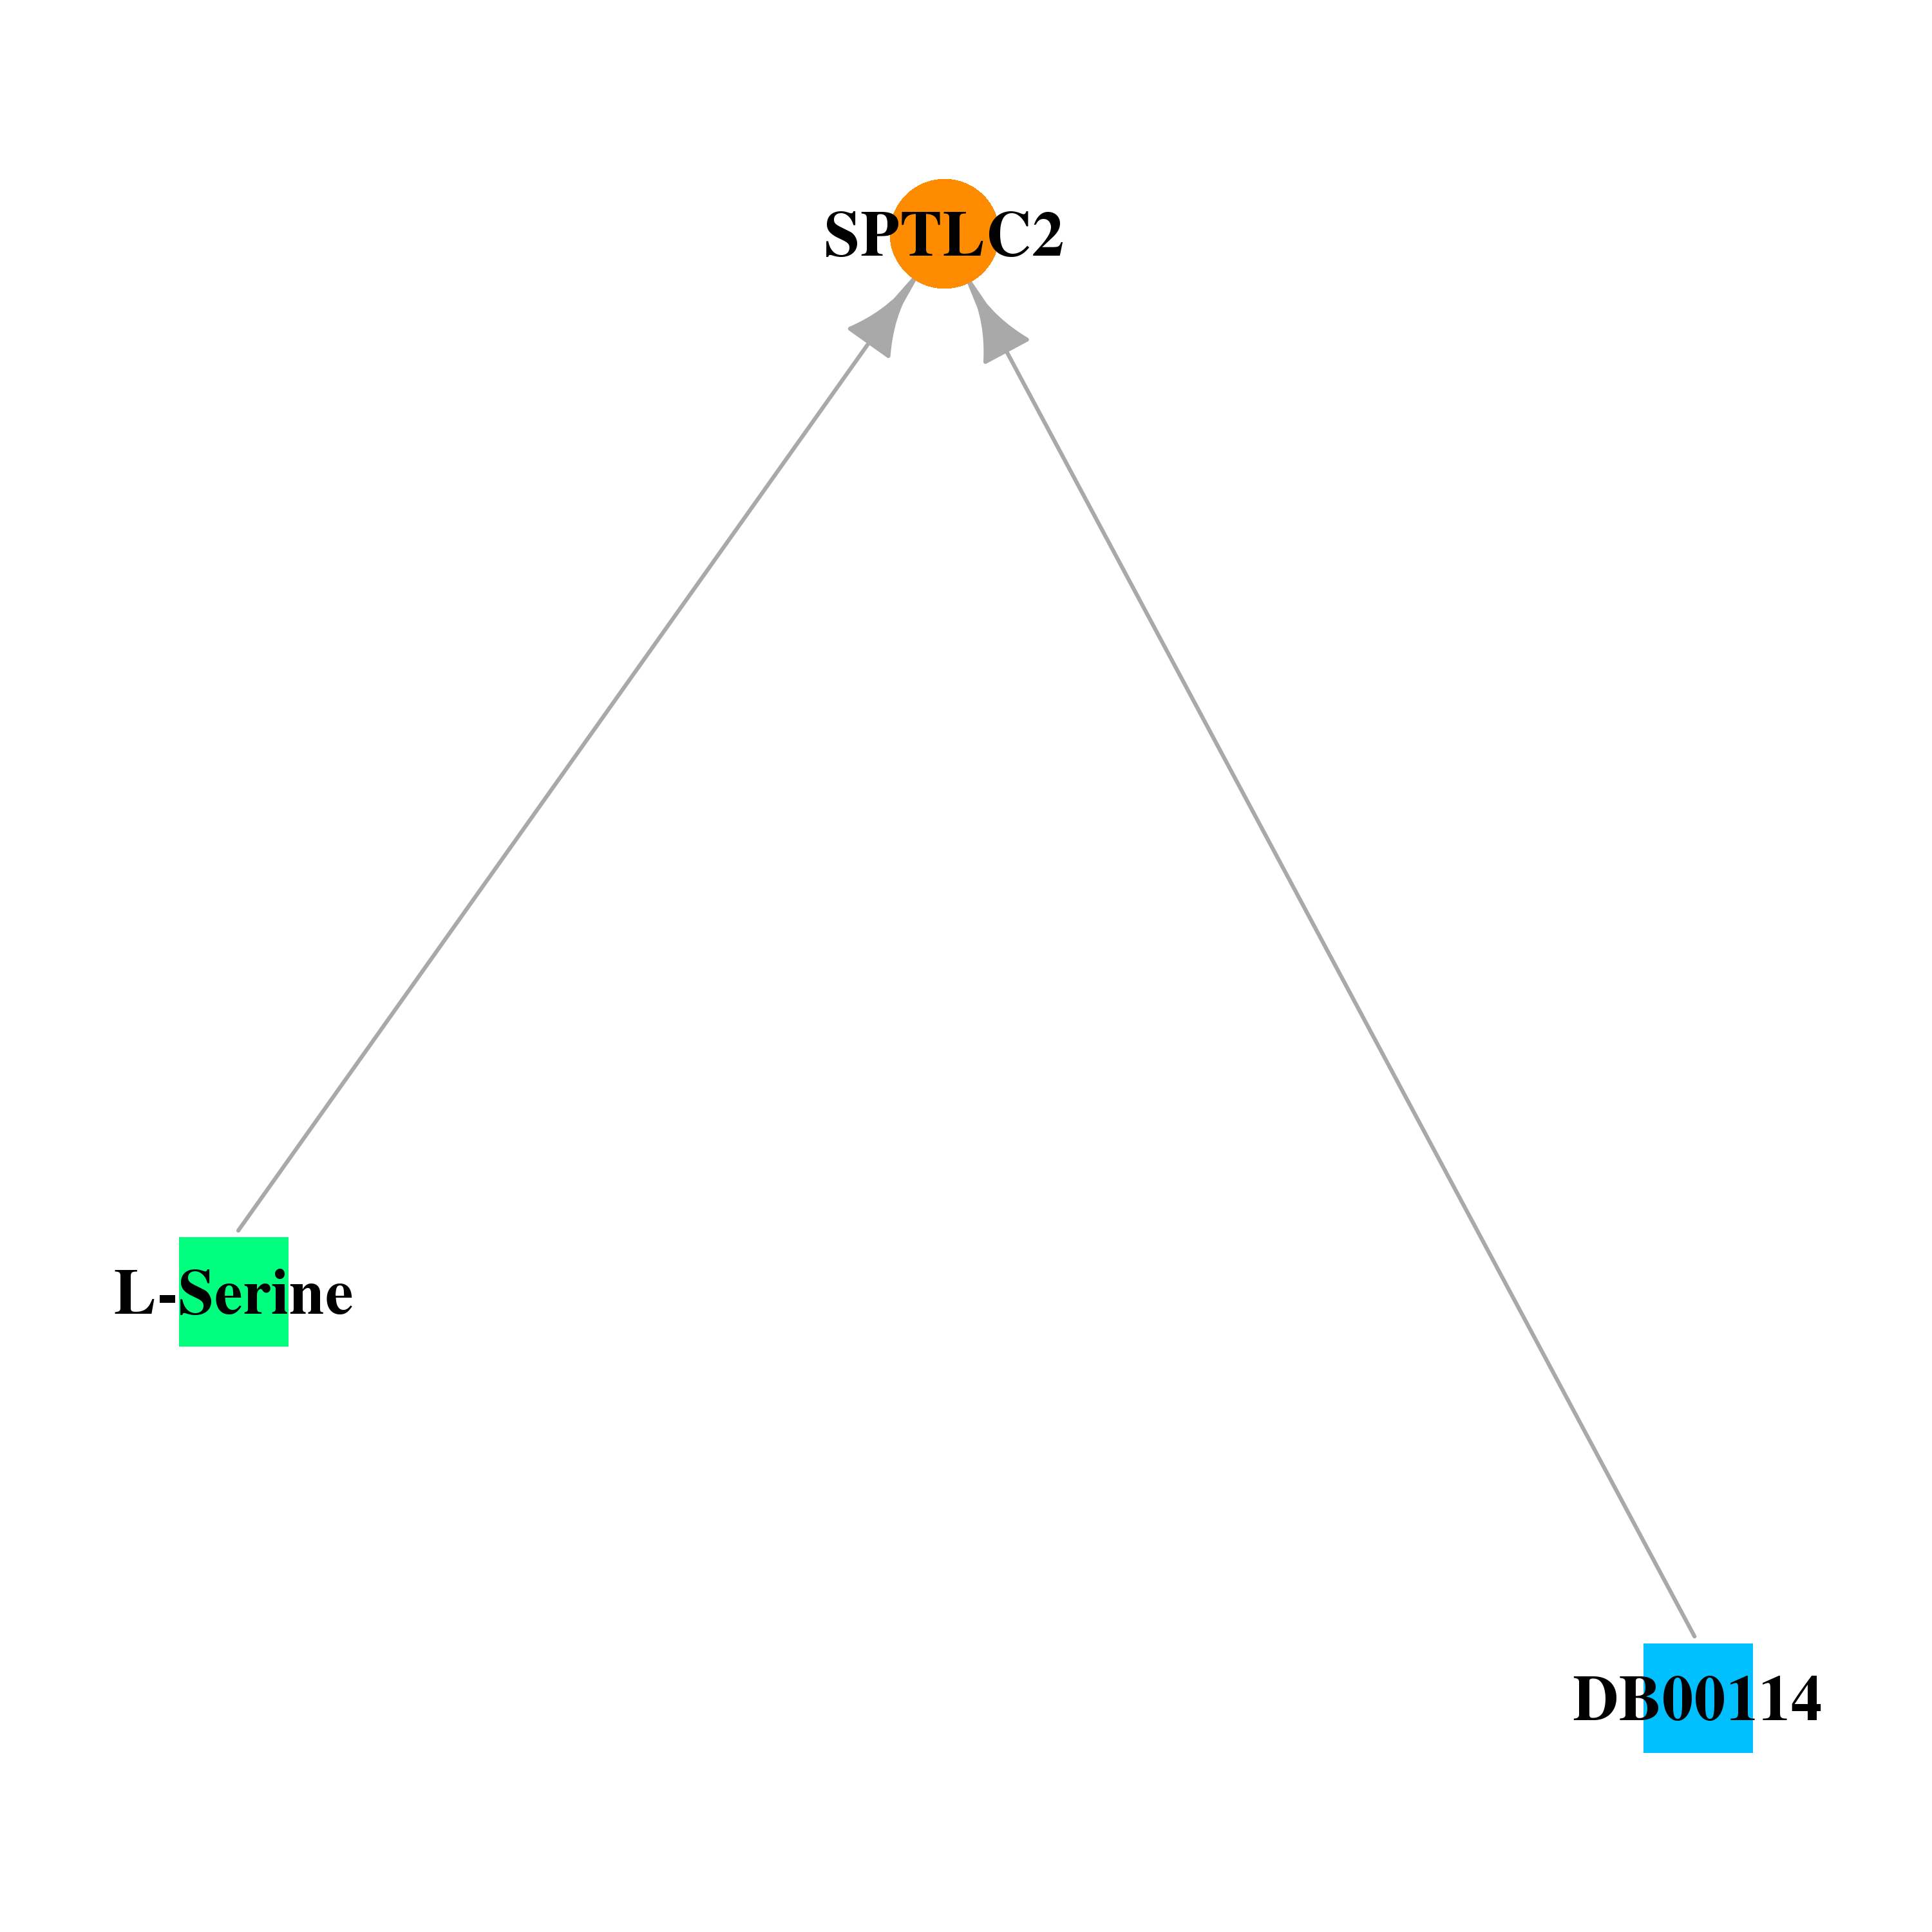 |
| * Drug Centered Interaction Network. |
| DrugBank ID | Target Name | Drug Groups | Generic Name | Drug Centered Network | Drug Structure |
| DB00114 | serine palmitoyltransferase, long chain base subunit 2 | nutraceutical | Pyridoxal Phosphate |  |  |
| DB00133 | serine palmitoyltransferase, long chain base subunit 2 | approved; nutraceutical | L-Serine | 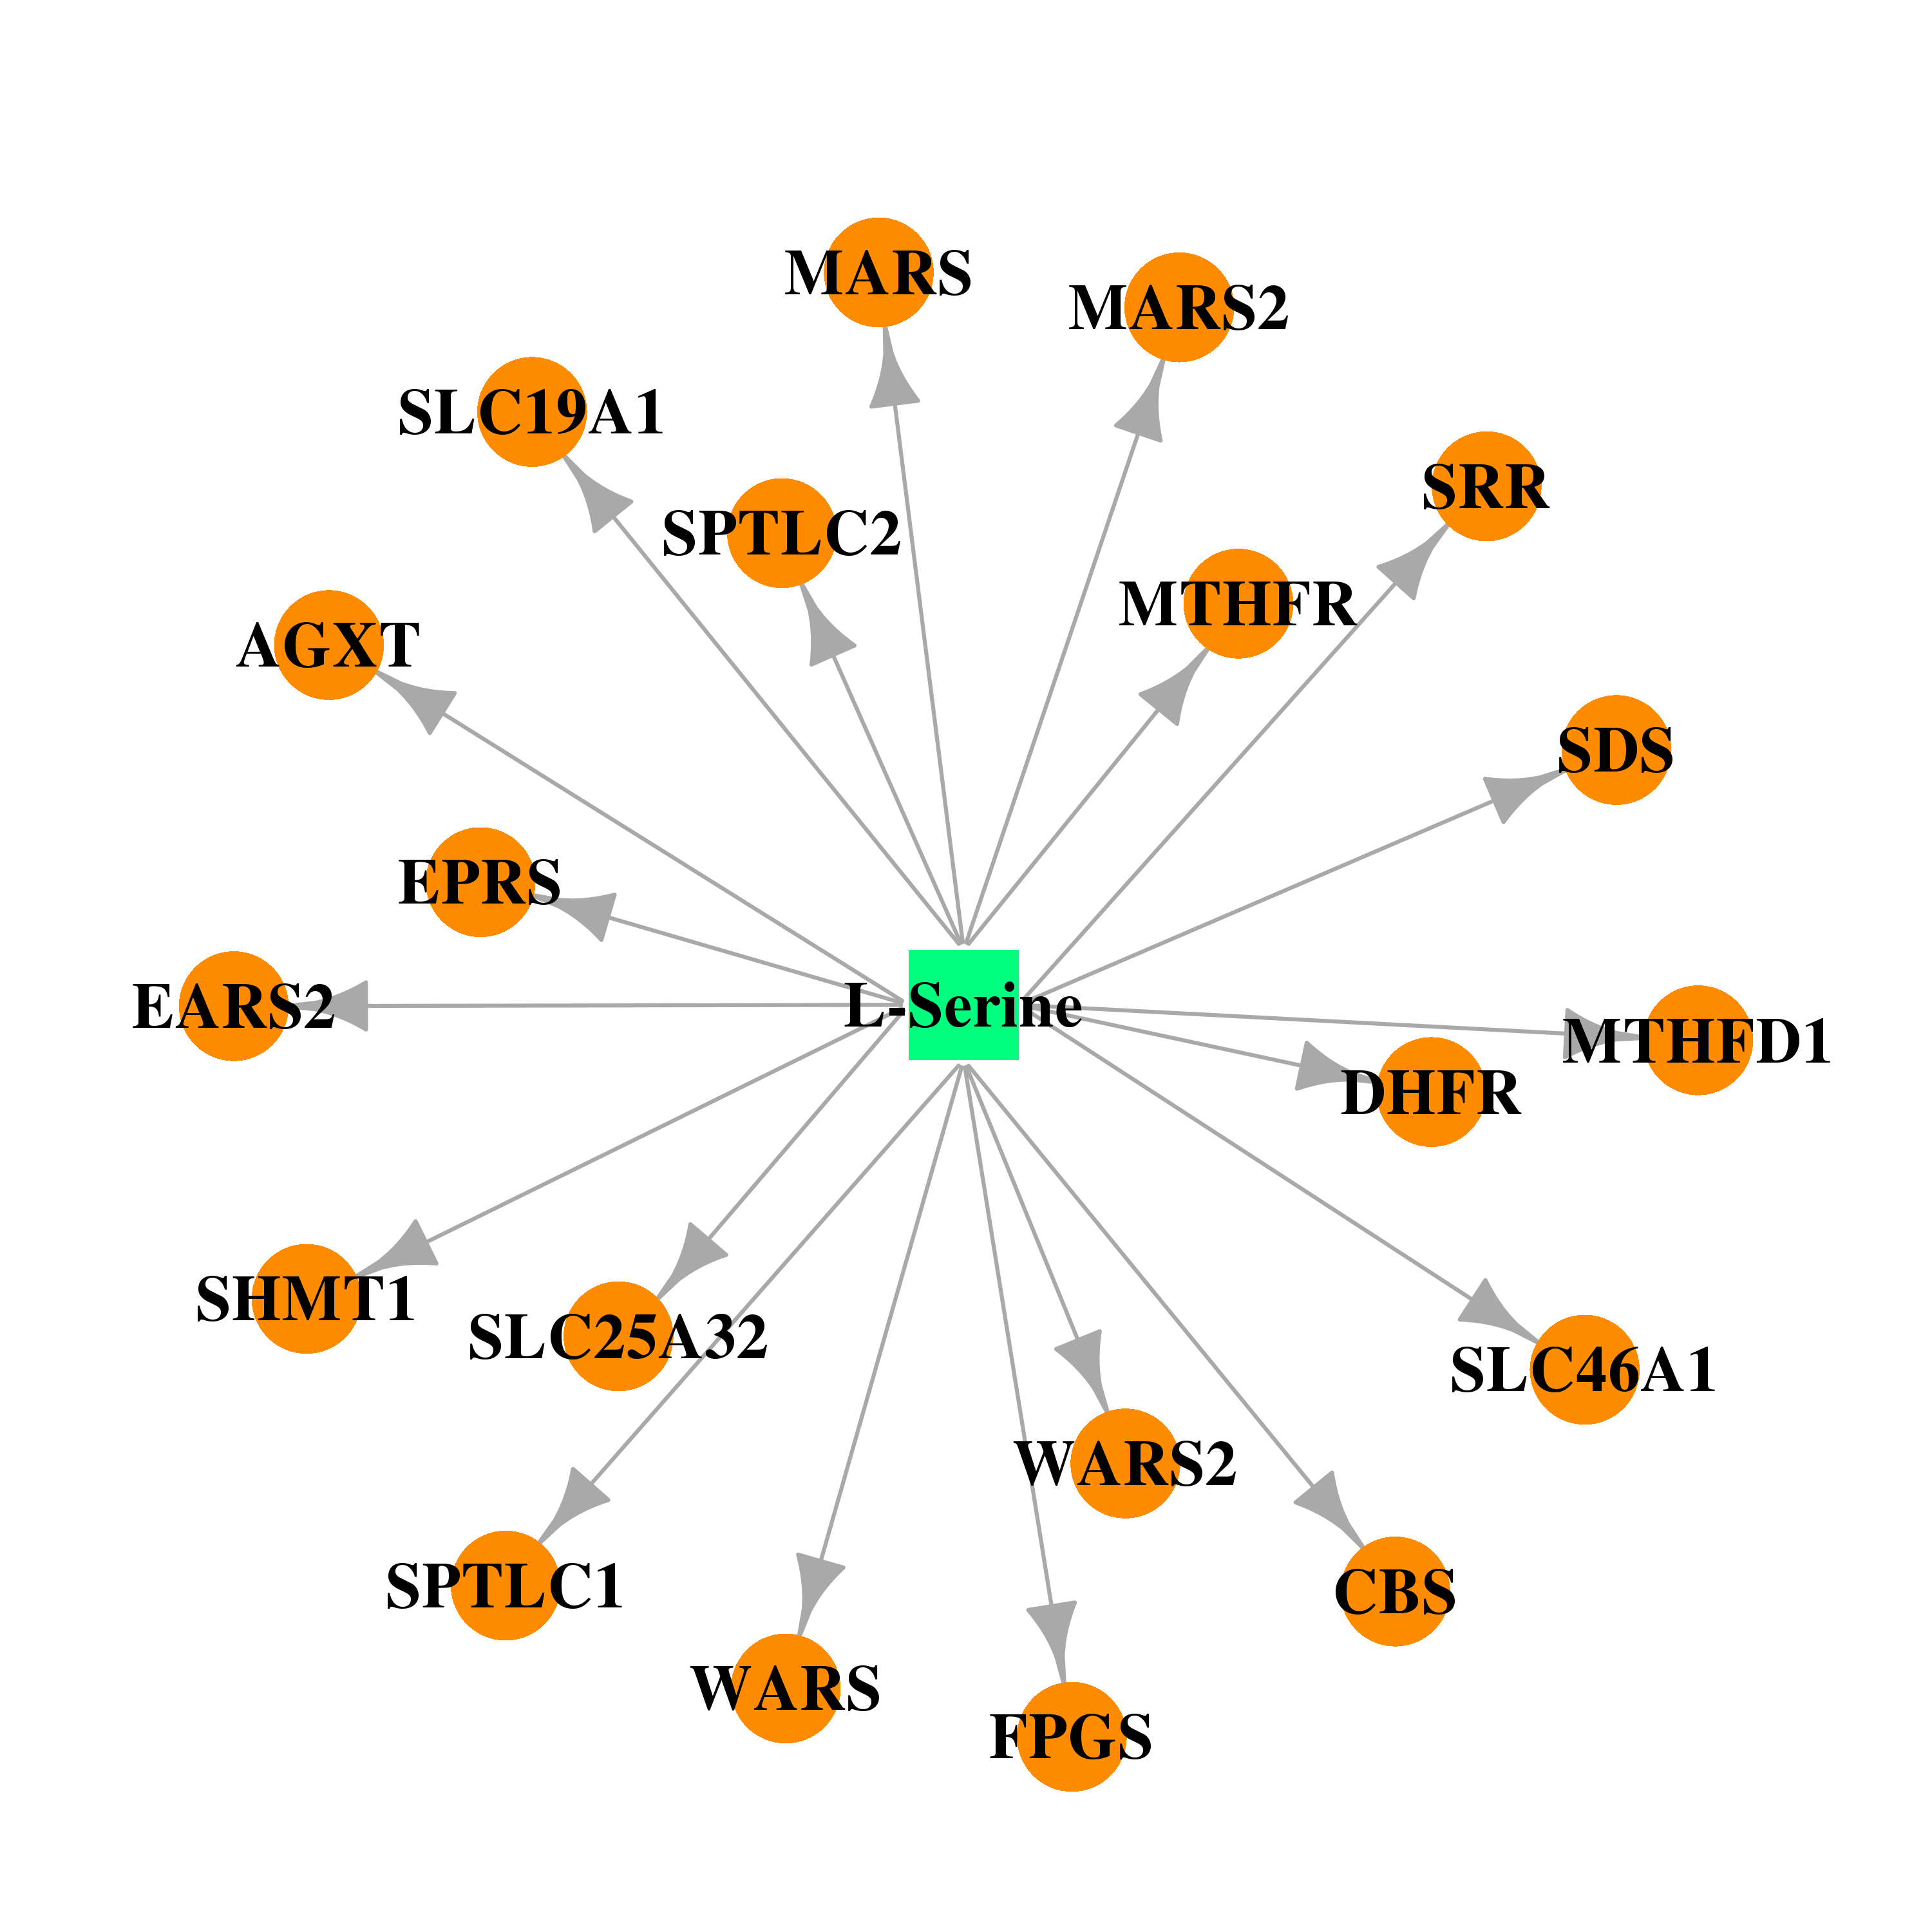 |  |
| Top |
| Cross referenced IDs for SPTLC2 |
| * We obtained these cross-references from Uniprot database. It covers 150 different DBs, 18 categories. http://www.uniprot.org/help/cross_references_section |
: Open all cross reference information
|
Copyright © 2016-Present - The Univsersity of Texas Health Science Center at Houston @ |