|
||||||||||||||||||||
| |
| Phenotypic Information (metabolism pathway, cancer, disease, phenome) |
| |
| |
| Gene-Gene Network Information: Co-Expression Network, Interacting Genes & KEGG |
| |
|


| Gene Summary for ENTPD1 |
| Top |
| Phenotypic Information for ENTPD1(metabolism pathway, cancer, disease, phenome) |
| Cancer | CGAP: ENTPD1 |
| Familial Cancer Database: ENTPD1 | |
| * This gene is included in those cancer gene databases. |
|
|
|
|
|
|
| ||||||||||||||
Oncogene 1 | Significant driver gene in | |||||||||||||||||||
| cf) number; DB name 1 Oncogene; http://nar.oxfordjournals.org/content/35/suppl_1/D721.long, 2 Tumor Suppressor gene; https://bioinfo.uth.edu/TSGene/, 3 Cancer Gene Census; http://www.nature.com/nrc/journal/v4/n3/abs/nrc1299.html, 4 CancerGenes; http://nar.oxfordjournals.org/content/35/suppl_1/D721.long, 5 Network of Cancer Gene; http://ncg.kcl.ac.uk/index.php, 1Therapeutic Vulnerabilities in Cancer; http://cbio.mskcc.org/cancergenomics/statius/ |
| KEGG_PURINE_METABOLISM KEGG_PYRIMIDINE_METABOLISM | |
| OMIM | |
| Orphanet | |
| Disease | KEGG Disease: ENTPD1 |
| MedGen: ENTPD1 (Human Medical Genetics with Condition) | |
| ClinVar: ENTPD1 | |
| Phenotype | MGI: ENTPD1 (International Mouse Phenotyping Consortium) |
| PhenomicDB: ENTPD1 | |
| Mutations for ENTPD1 |
| * Under tables are showing count per each tissue to give us broad intuition about tissue specific mutation patterns.You can go to the detailed page for each mutation database's web site. |
| There's no structural variation information in COSMIC data for this gene. |
| * From mRNA Sanger sequences, Chitars2.0 arranged chimeric transcripts. This table shows ENTPD1 related fusion information. |
| ID | Head Gene | Tail Gene | Accession | Gene_a | qStart_a | qEnd_a | Chromosome_a | tStart_a | tEnd_a | Gene_a | qStart_a | qEnd_a | Chromosome_a | tStart_a | tEnd_a |
| DA313964 | RTN4 | 1 | 86 | 2 | 55199667 | 55199752 | ENTPD1 | 87 | 550 | 10 | 97515920 | 97602224 | |
| DR006627 | PRKACA | 23 | 456 | 19 | 14217572 | 14228556 | ENTPD1 | 452 | 694 | 10 | 97627439 | 97627682 | |
| AW581220 | ENTPD1 | 1 | 75 | 10 | 97626002 | 97626077 | ENTPD1 | 70 | 277 | 10 | 97626056 | 97626263 | |
| BF374130 | ENTPD1 | 1 | 198 | 10 | 97552892 | 97553089 | IKZF1 | 193 | 320 | 7 | 50470625 | 50470752 | |
| BE796741 | ENTPD1 | 102 | 125 | 10 | 97485323 | 97485346 | RPL13 | 120 | 751 | 16 | 89627137 | 89628145 | |
| AV721912 | ENTPD1 | 28 | 613 | 10 | 97593265 | 97633514 | ENTPD1 | 610 | 719 | 10 | 97594369 | 97594478 | |
| W80598 | ENTPD1 | 114 | 133 | 10 | 97602912 | 97602931 | DGKH | 134 | 418 | 13 | 42811785 | 42812066 | |
| Top |
| There's no copy number variation information in COSMIC data for this gene. |
| Top |
|
 |
| Top |
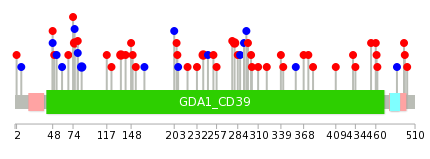
| Stat. for Non-Synonymous SNVs (# total SNVs=34) | (# total SNVs=9) |
 |  |
(# total SNVs=0) | (# total SNVs=0) |
| Top |
| * When you move the cursor on each content, you can see more deailed mutation information on the Tooltip. Those are primary_site,primary_histology,mutation(aa),pubmedID. |
| GRCh37 position | Mutation(aa) | Unique sampleID count |
| chr10:97599558-97599558 | p.R85R | 2 |
| chr10:97607227-97607227 | p.D280N | 2 |
| chr10:97602241-97602241 | p.R135W | 2 |
| chr10:97599530-97599530 | p.G76D | 2 |
| chr10:97605259-97605259 | p.R240H | 2 |
| chr10:97599541-97599541 | p.Q80* | 2 |
| chr10:97604280-97604280 | p.R154K | 1 |
| chr10:97624518-97624518 | p.L409P | 1 |
| chr10:97626096-97626096 | p.L497F | 1 |
| chr10:97583001-97583001 | p.N8N | 1 |
| Top |
|
 |
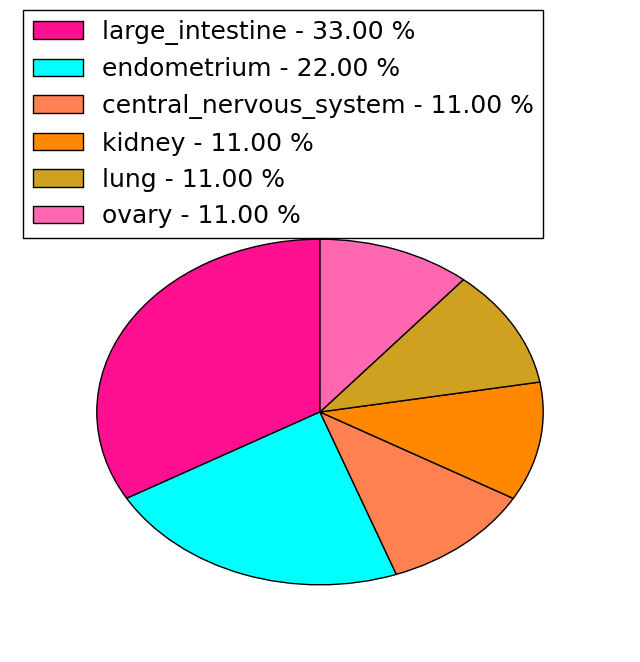
| Point Mutation/ Tissue ID | 1 | 2 | 3 | 4 | 5 | 6 | 7 | 8 | 9 | 10 | 11 | 12 | 13 | 14 | 15 | 16 | 17 | 18 | 19 | 20 |
| # sample | 1 | 8 | 2 | 3 | 1 | 1 | 5 | 2 | 1 | 11 | 7 | 5 | ||||||||
| # mutation | 1 | 6 | 2 | 3 | 1 | 1 | 6 | 2 | 1 | 12 | 7 | 5 | ||||||||
| nonsynonymous SNV | 1 | 4 | 2 | 1 | 6 | 2 | 10 | 5 | 3 | |||||||||||
| synonymous SNV | 2 | 2 | 1 | 1 | 1 | 2 | 2 | 2 |
| cf) Tissue ID; Tissue type (1; BLCA[Bladder Urothelial Carcinoma], 2; BRCA[Breast invasive carcinoma], 3; CESC[Cervical squamous cell carcinoma and endocervical adenocarcinoma], 4; COAD[Colon adenocarcinoma], 5; GBM[Glioblastoma multiforme], 6; Glioma Low Grade, 7; HNSC[Head and Neck squamous cell carcinoma], 8; KICH[Kidney Chromophobe], 9; KIRC[Kidney renal clear cell carcinoma], 10; KIRP[Kidney renal papillary cell carcinoma], 11; LAML[Acute Myeloid Leukemia], 12; LUAD[Lung adenocarcinoma], 13; LUSC[Lung squamous cell carcinoma], 14; OV[Ovarian serous cystadenocarcinoma ], 15; PAAD[Pancreatic adenocarcinoma], 16; PRAD[Prostate adenocarcinoma], 17; SKCM[Skin Cutaneous Melanoma], 18:STAD[Stomach adenocarcinoma], 19:THCA[Thyroid carcinoma], 20:UCEC[Uterine Corpus Endometrial Carcinoma]) |
| Top |
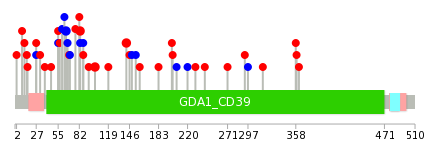
| * We represented just top 10 SNVs. When you move the cursor on each content, you can see more deailed mutation information on the Tooltip. Those are primary_site, primary_histology, mutation(aa), pubmedID. |
| Genomic Position | Mutation(aa) | Unique sampleID count |
| chr10:97605259 | p.G83D,ENTPD1 | 2 |
| chr10:97607227 | p.R102H,ENTPD1 | 2 |
| chr10:97599530 | p.D142N,ENTPD1 | 2 |
| chr10:97605149 | p.T65T,ENTPD1 | 2 |
| chr10:97605164 | p.S94T,ENTPD1 | 1 |
| chr10:97583068 | p.A293T,ENTPD1 | 1 |
| chr10:97607350 | p.G83G,ENTPD1 | 1 |
| chr10:97599543 | p.E297E,ENTPD1 | 1 |
| chr10:97626094 | p.Q87E,ENTPD1 | 1 |
| chr10:97605184 | p.G119E,ENTPD1 | 1 |
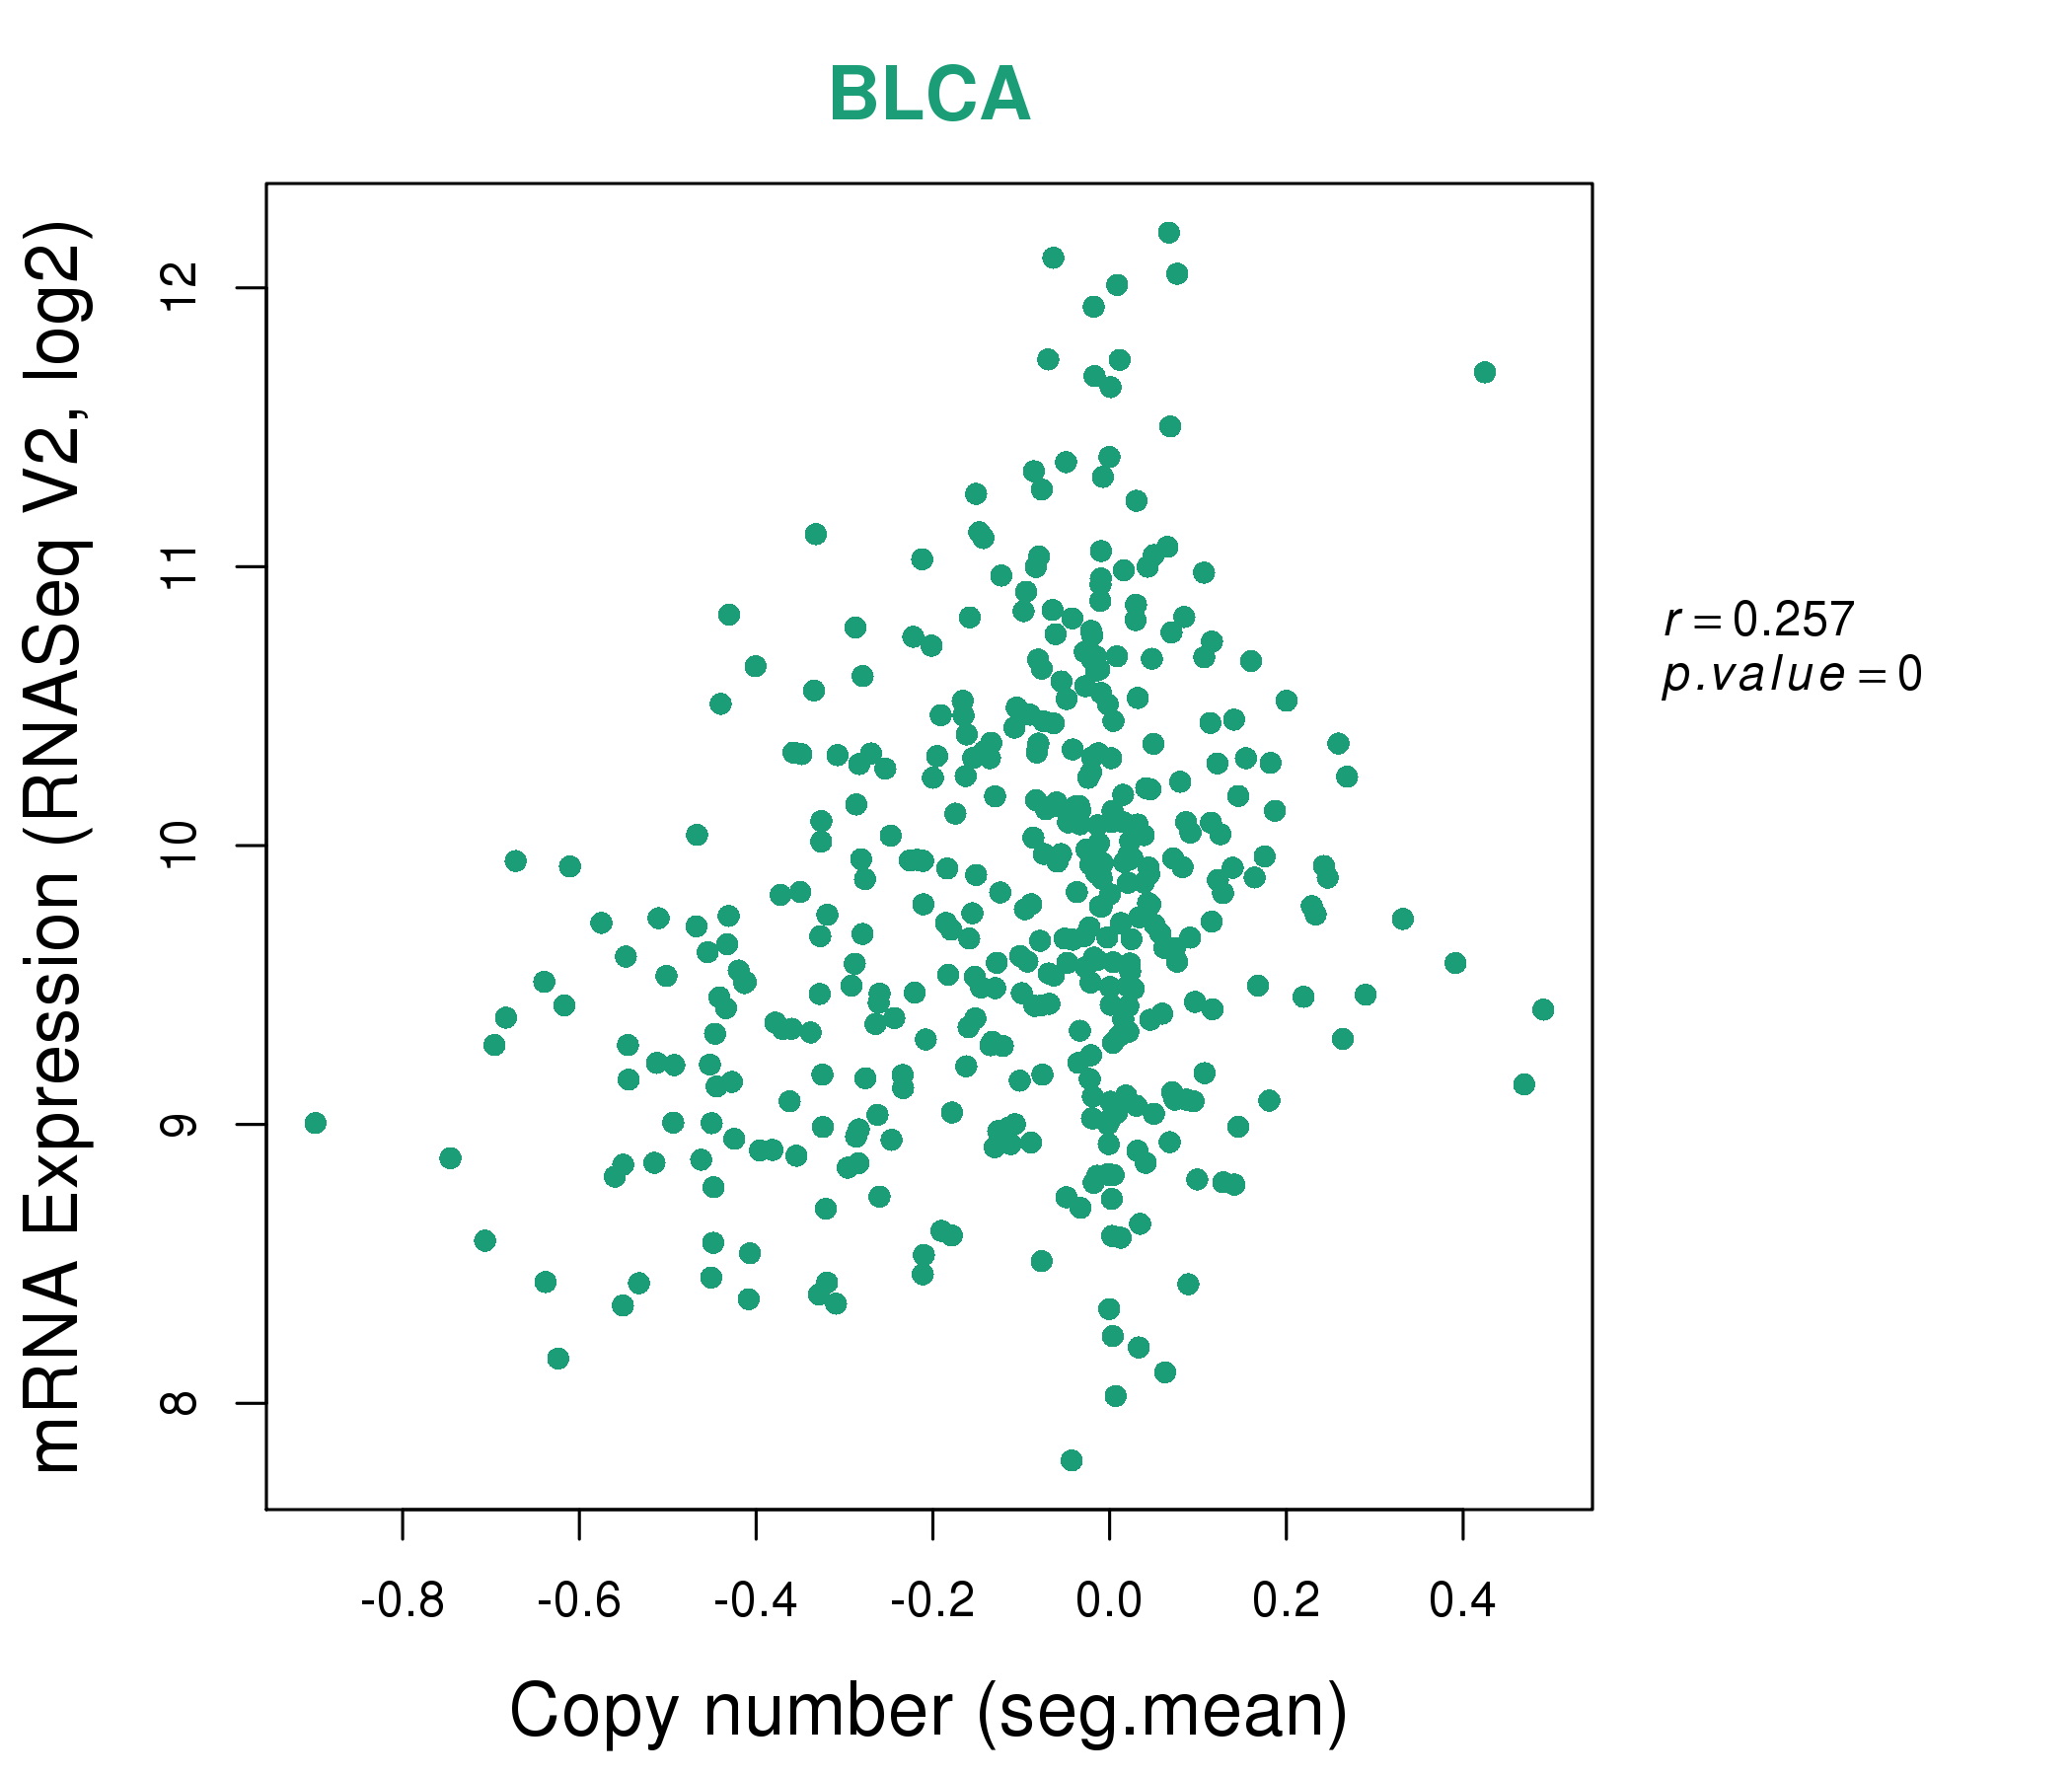
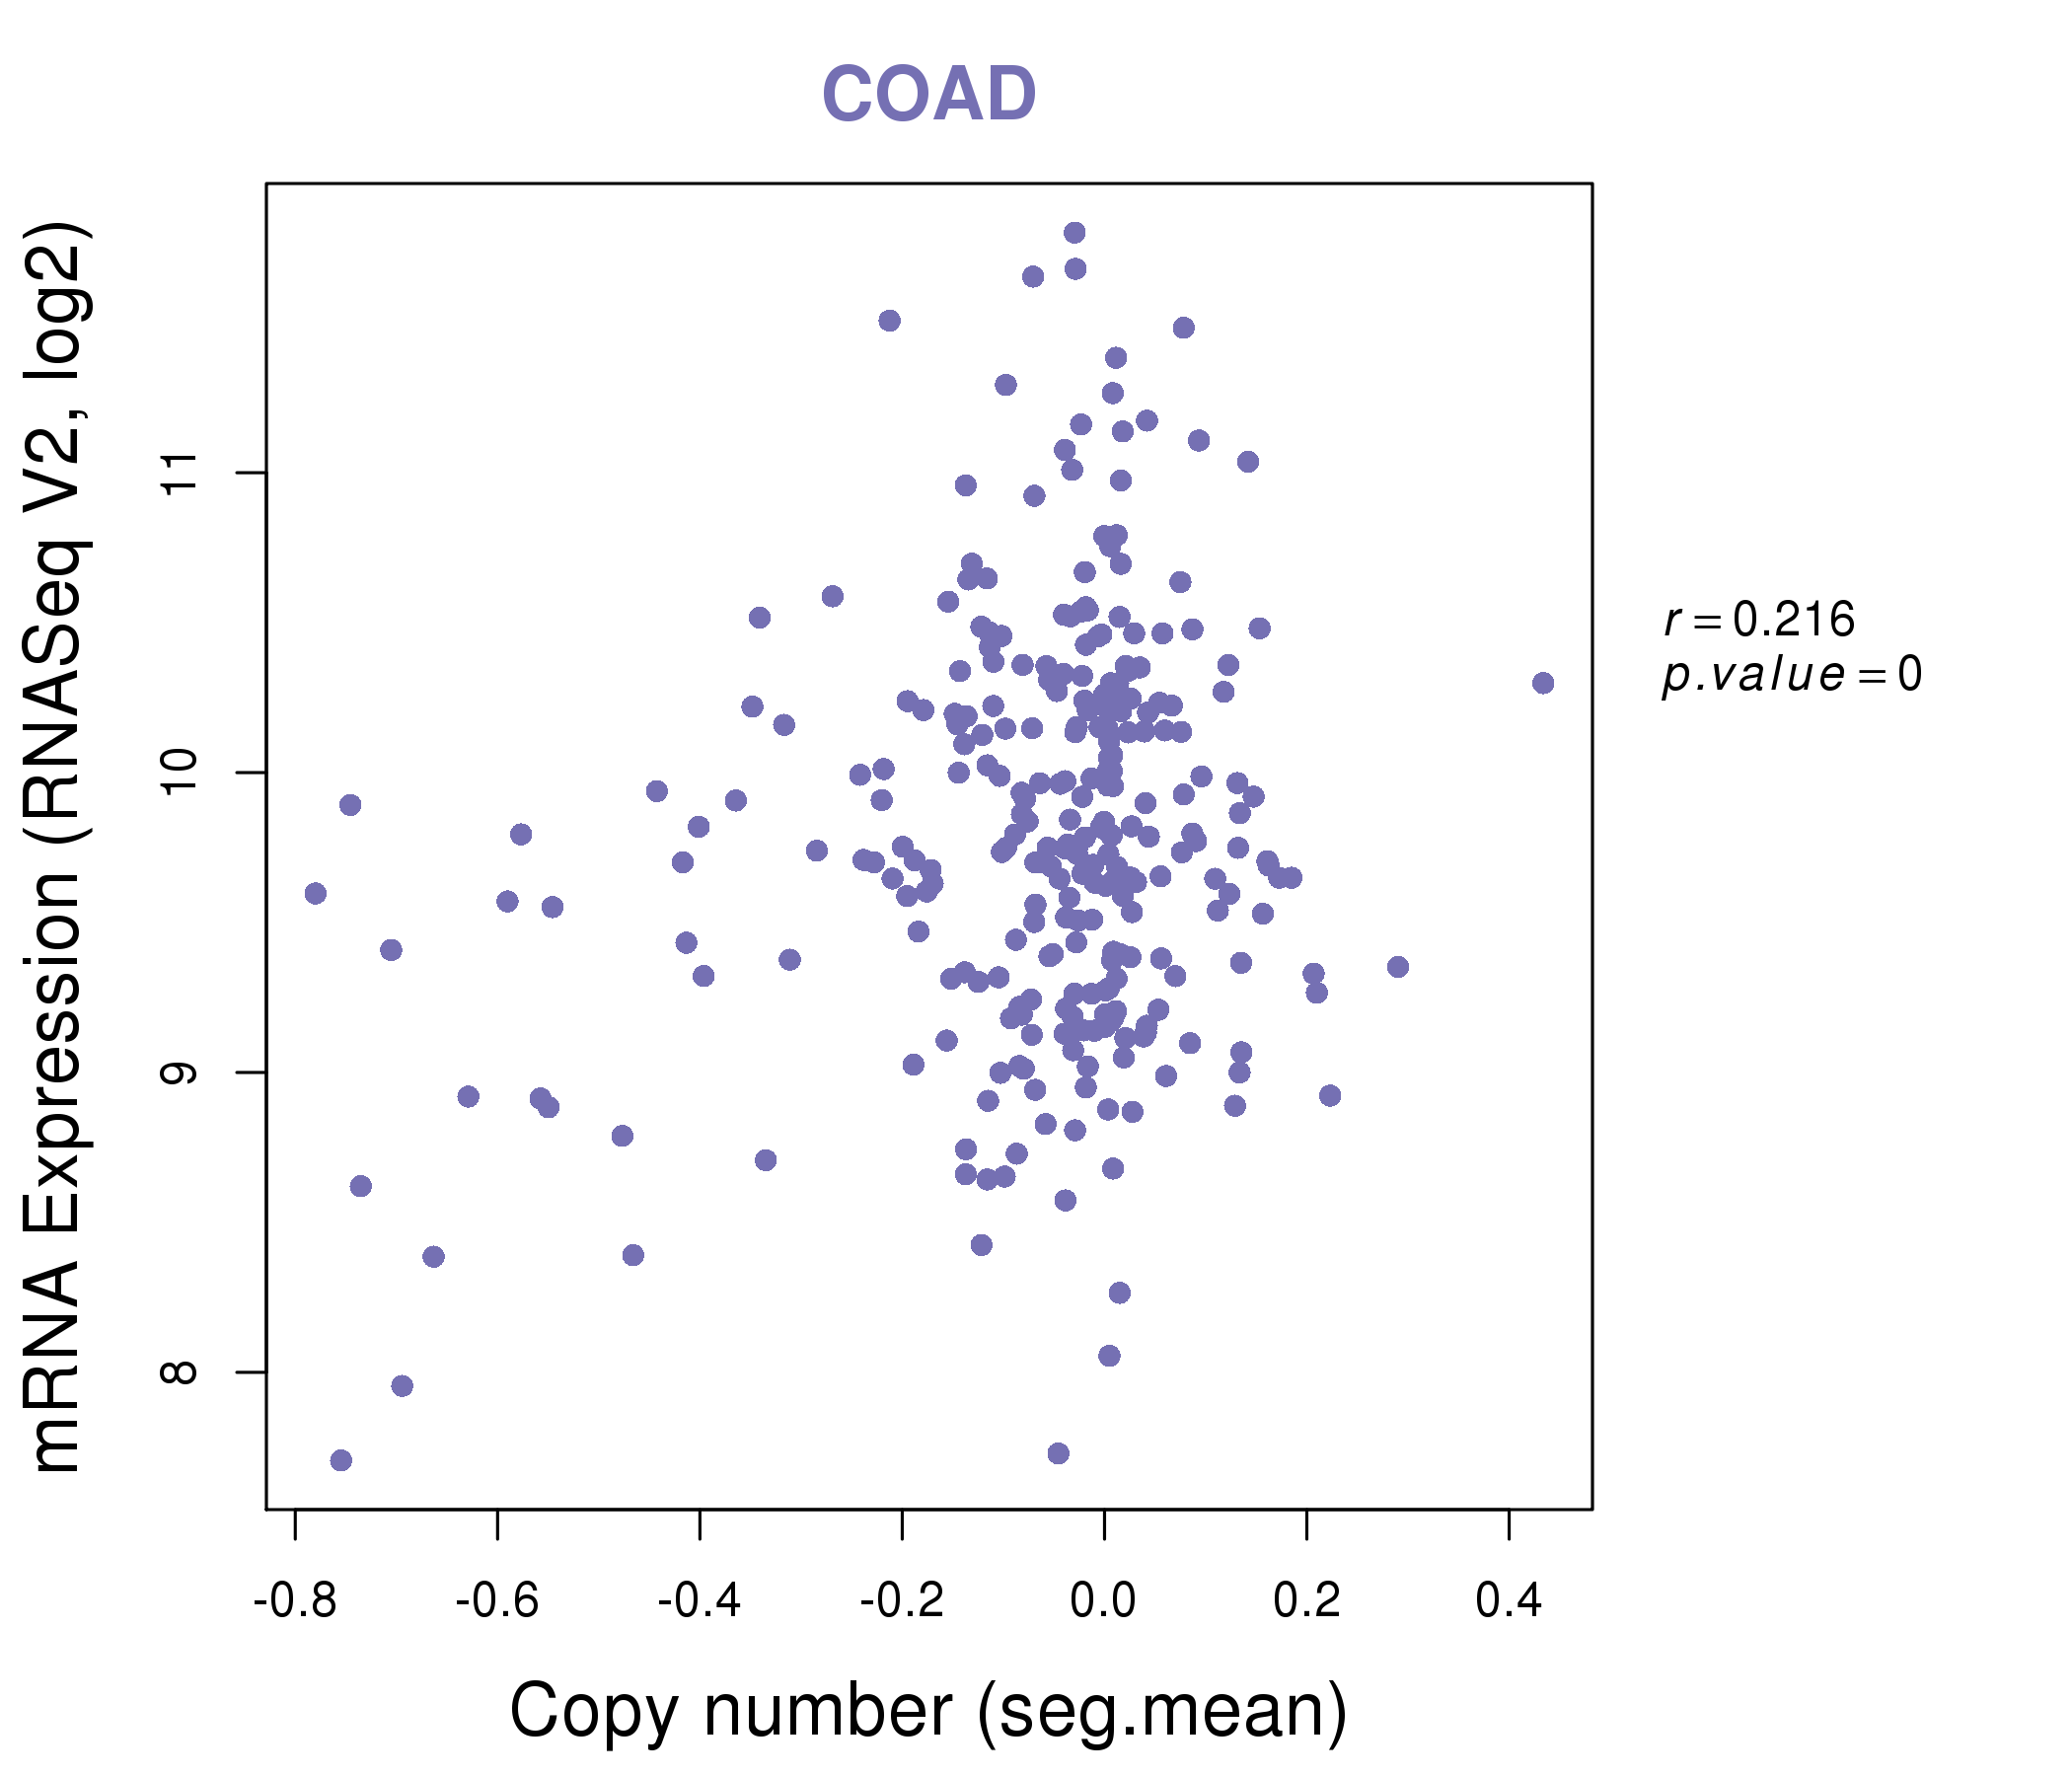
| * Copy number data were extracted from TCGA using R package TCGA-Assembler. The URLs of all public data files on TCGA DCC data server were gathered on Jan-05-2015. Function ProcessCNAData in TCGA-Assembler package was used to obtain gene-level copy number value which is calculated as the average copy number of the genomic region of a gene. |
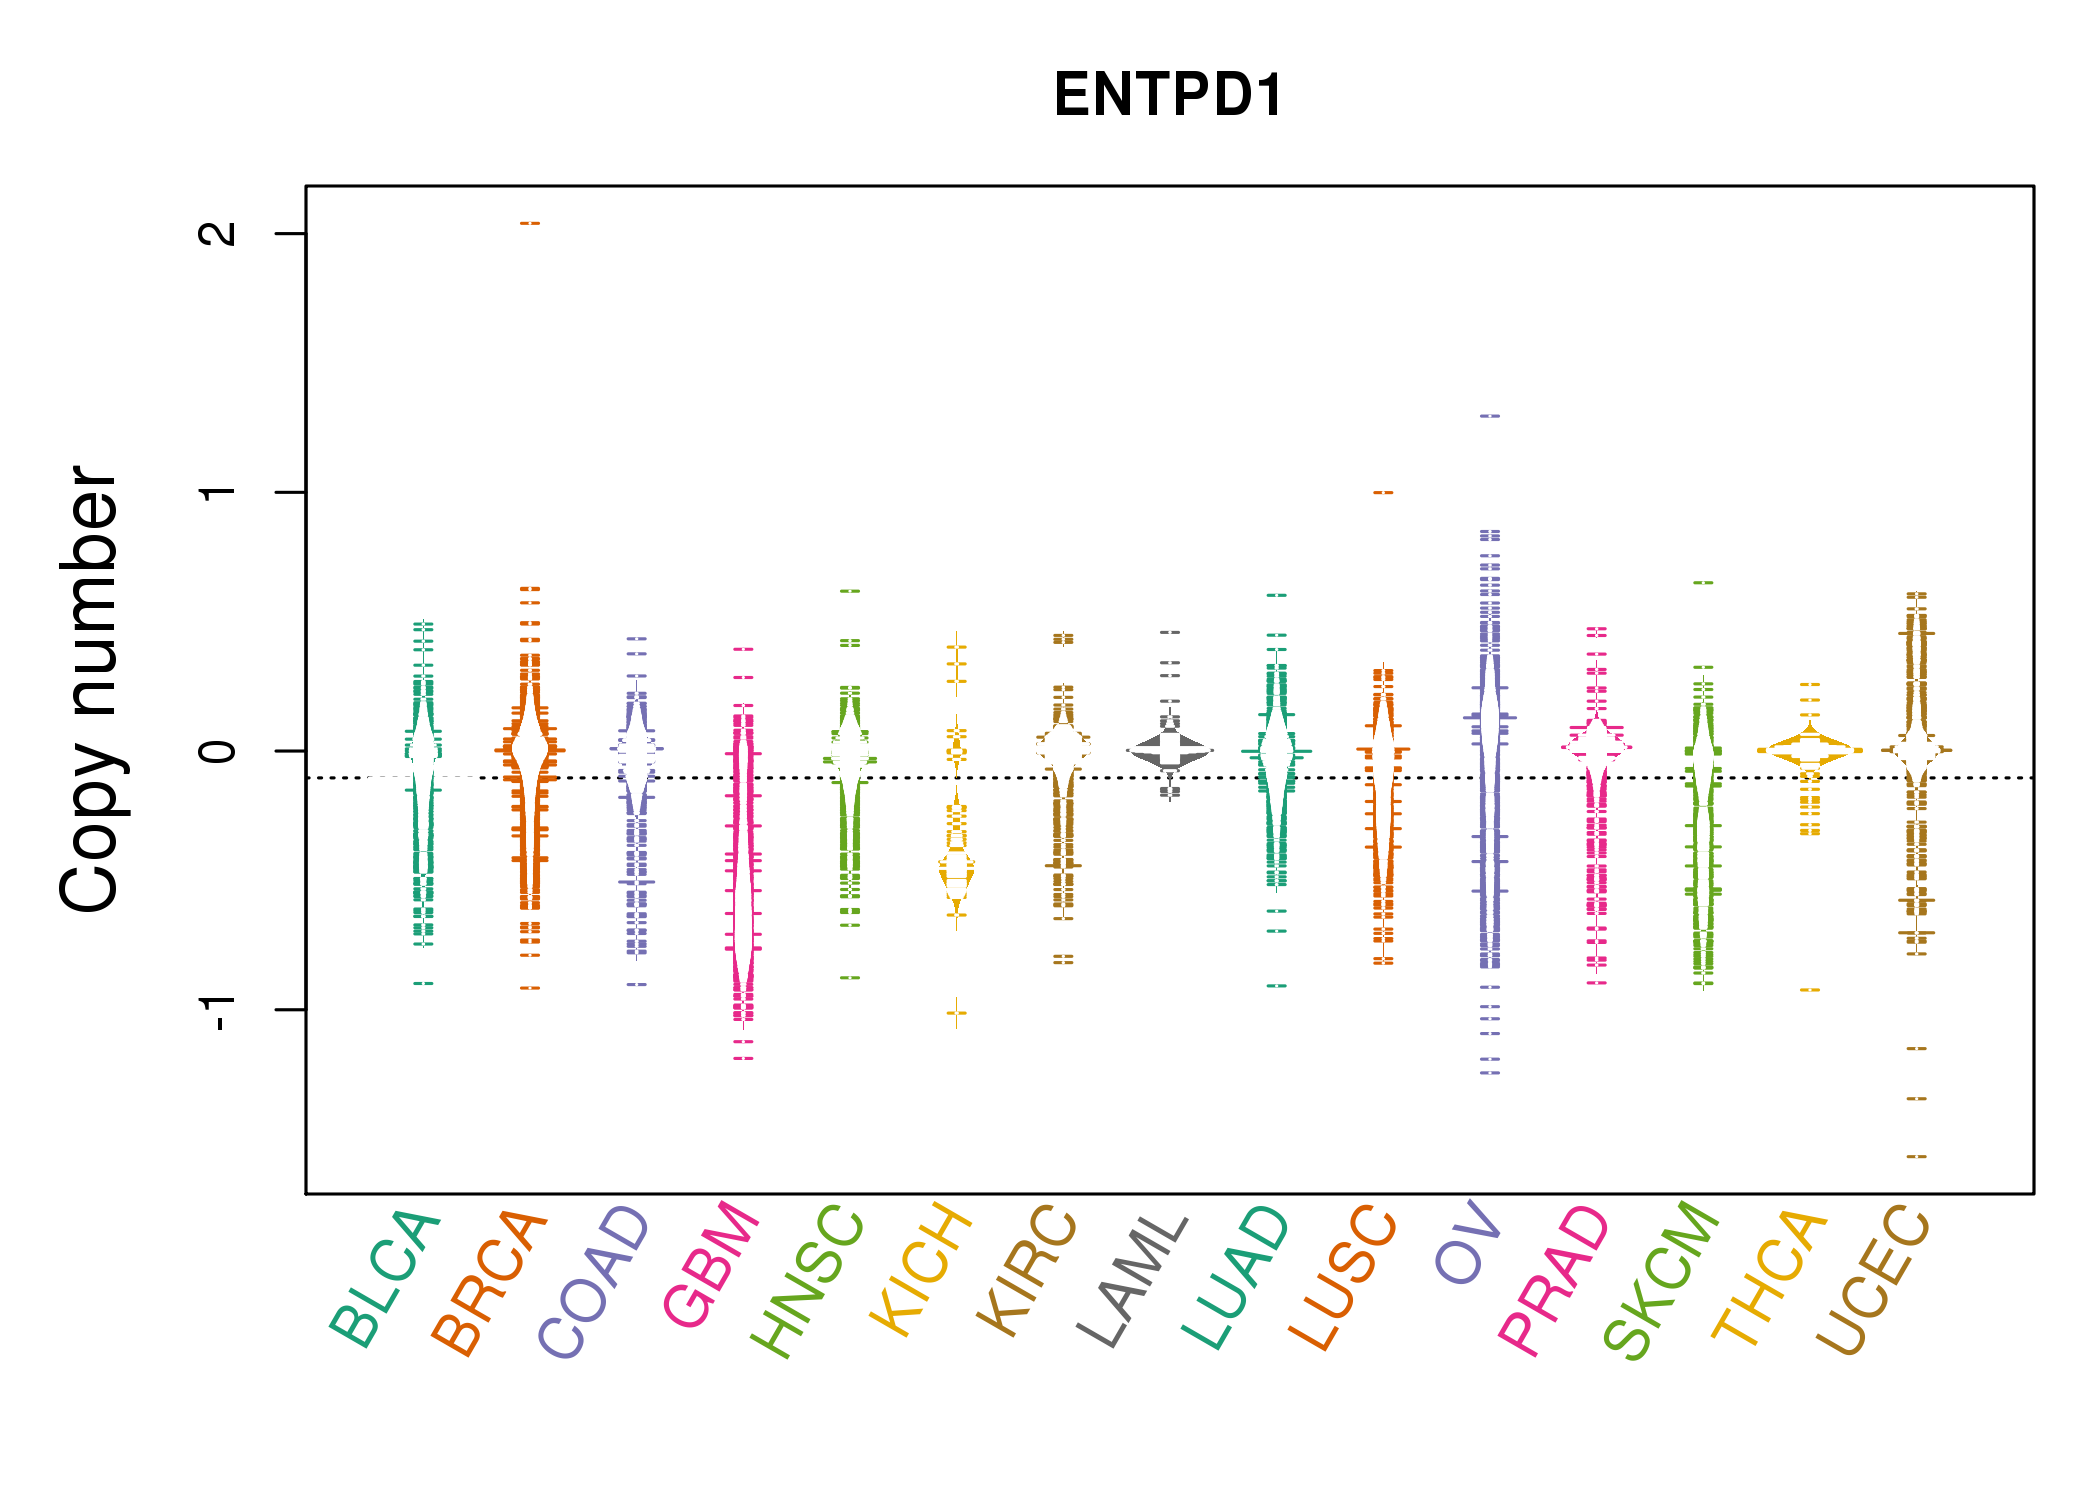 |
| cf) Tissue ID[Tissue type]: BLCA[Bladder Urothelial Carcinoma], BRCA[Breast invasive carcinoma], CESC[Cervical squamous cell carcinoma and endocervical adenocarcinoma], COAD[Colon adenocarcinoma], GBM[Glioblastoma multiforme], Glioma Low Grade, HNSC[Head and Neck squamous cell carcinoma], KICH[Kidney Chromophobe], KIRC[Kidney renal clear cell carcinoma], KIRP[Kidney renal papillary cell carcinoma], LAML[Acute Myeloid Leukemia], LUAD[Lung adenocarcinoma], LUSC[Lung squamous cell carcinoma], OV[Ovarian serous cystadenocarcinoma ], PAAD[Pancreatic adenocarcinoma], PRAD[Prostate adenocarcinoma], SKCM[Skin Cutaneous Melanoma], STAD[Stomach adenocarcinoma], THCA[Thyroid carcinoma], UCEC[Uterine Corpus Endometrial Carcinoma] |
| Top |
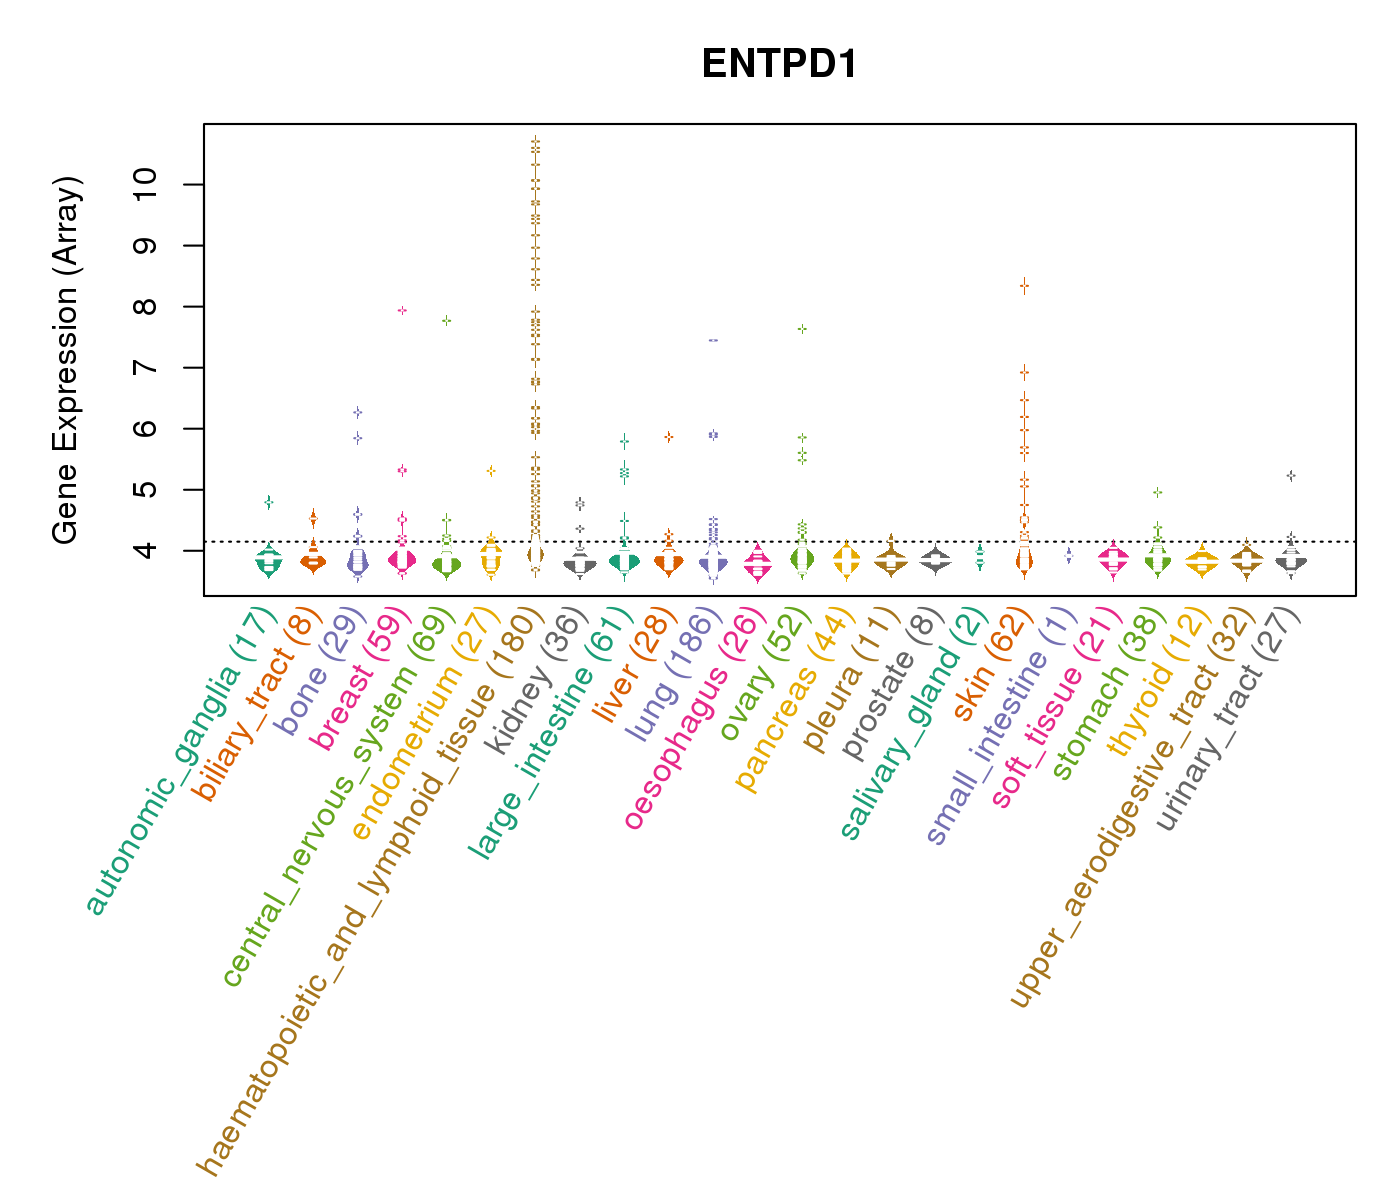
| Gene Expression for ENTPD1 |
| * CCLE gene expression data were extracted from CCLE_Expression_Entrez_2012-10-18.res: Gene-centric RMA-normalized mRNA expression data. |
 |
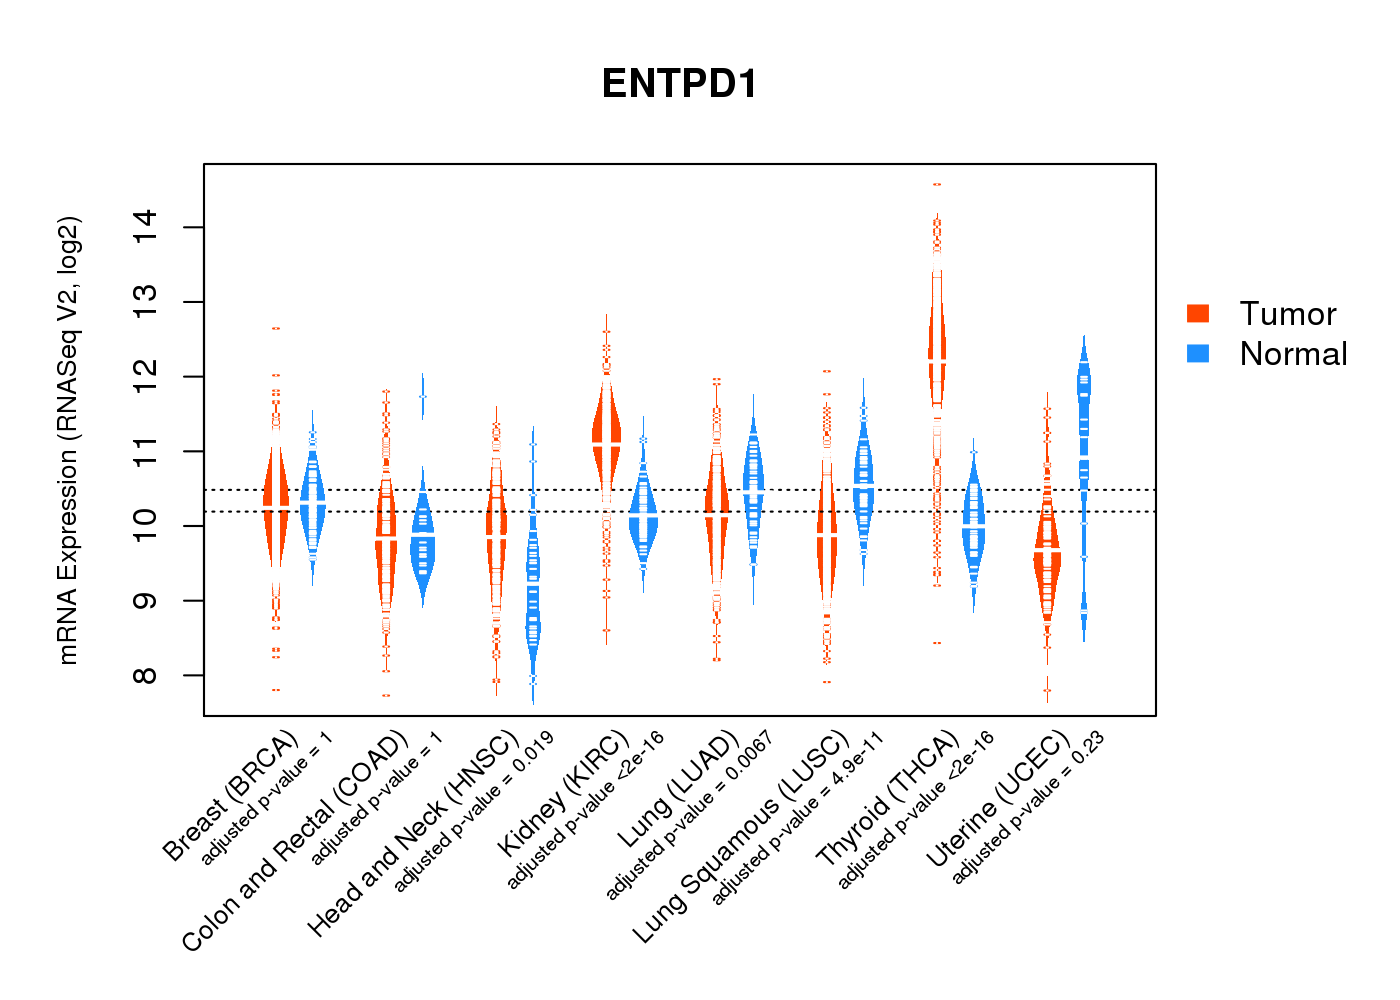
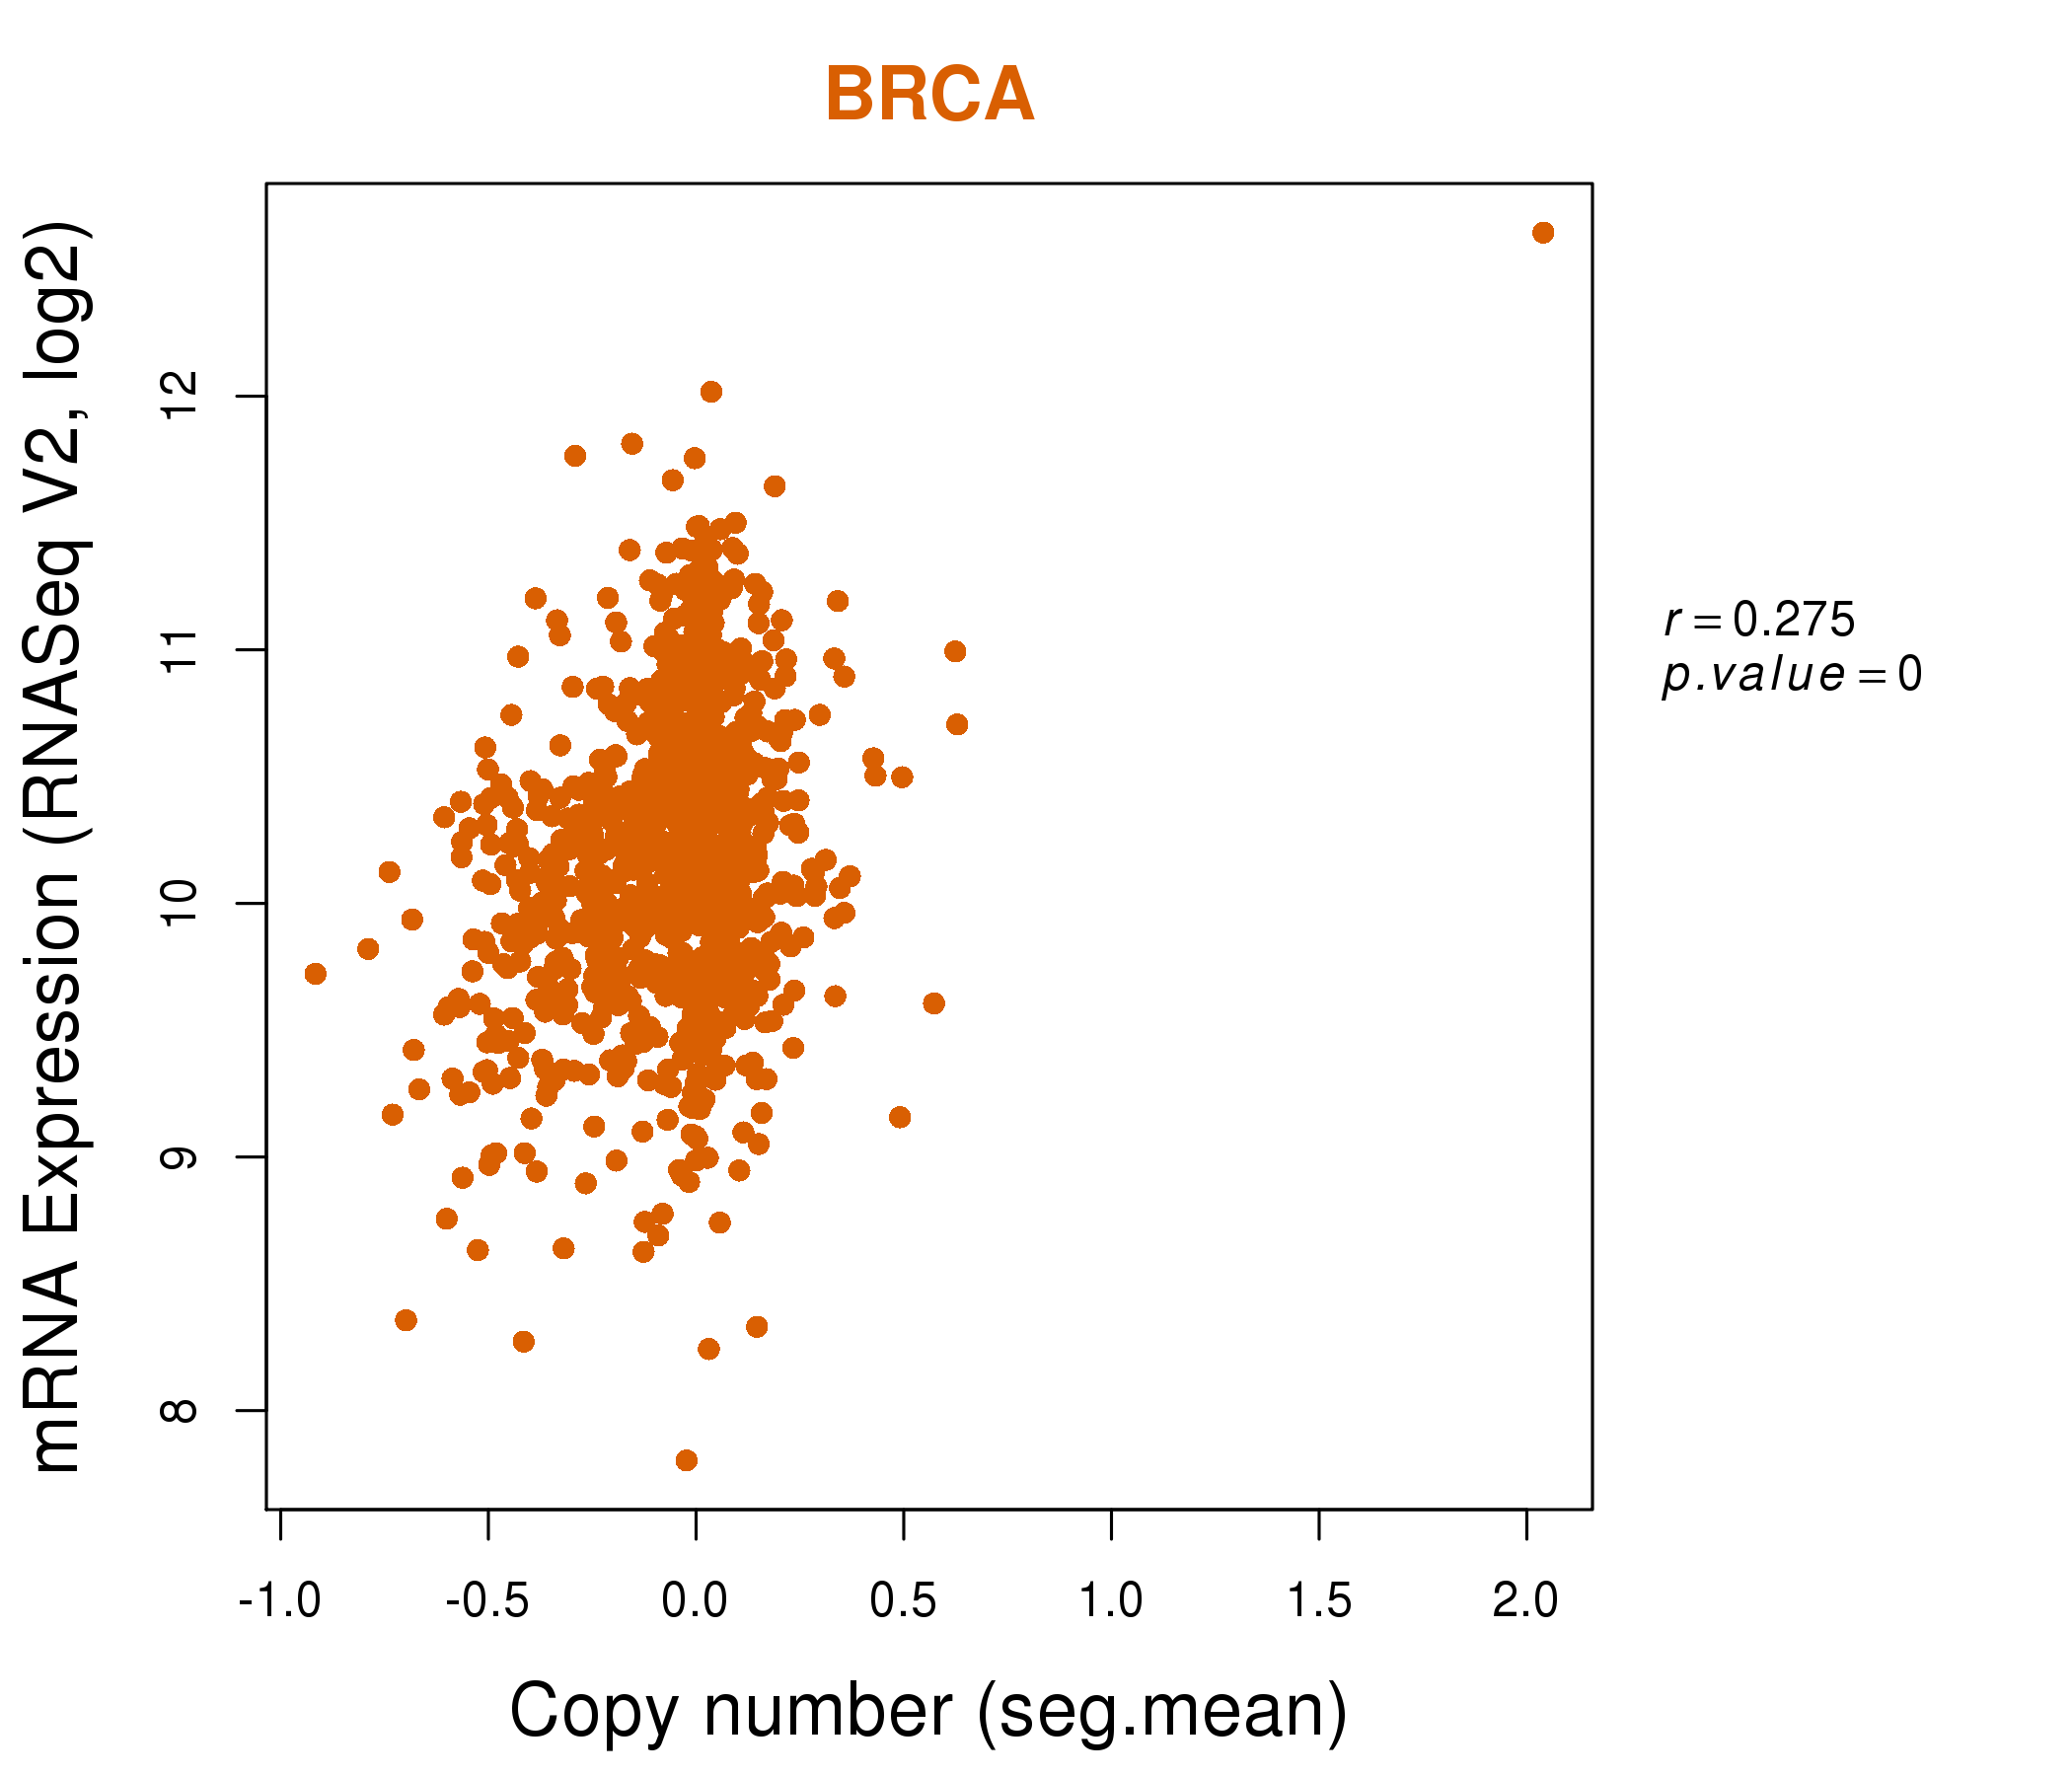
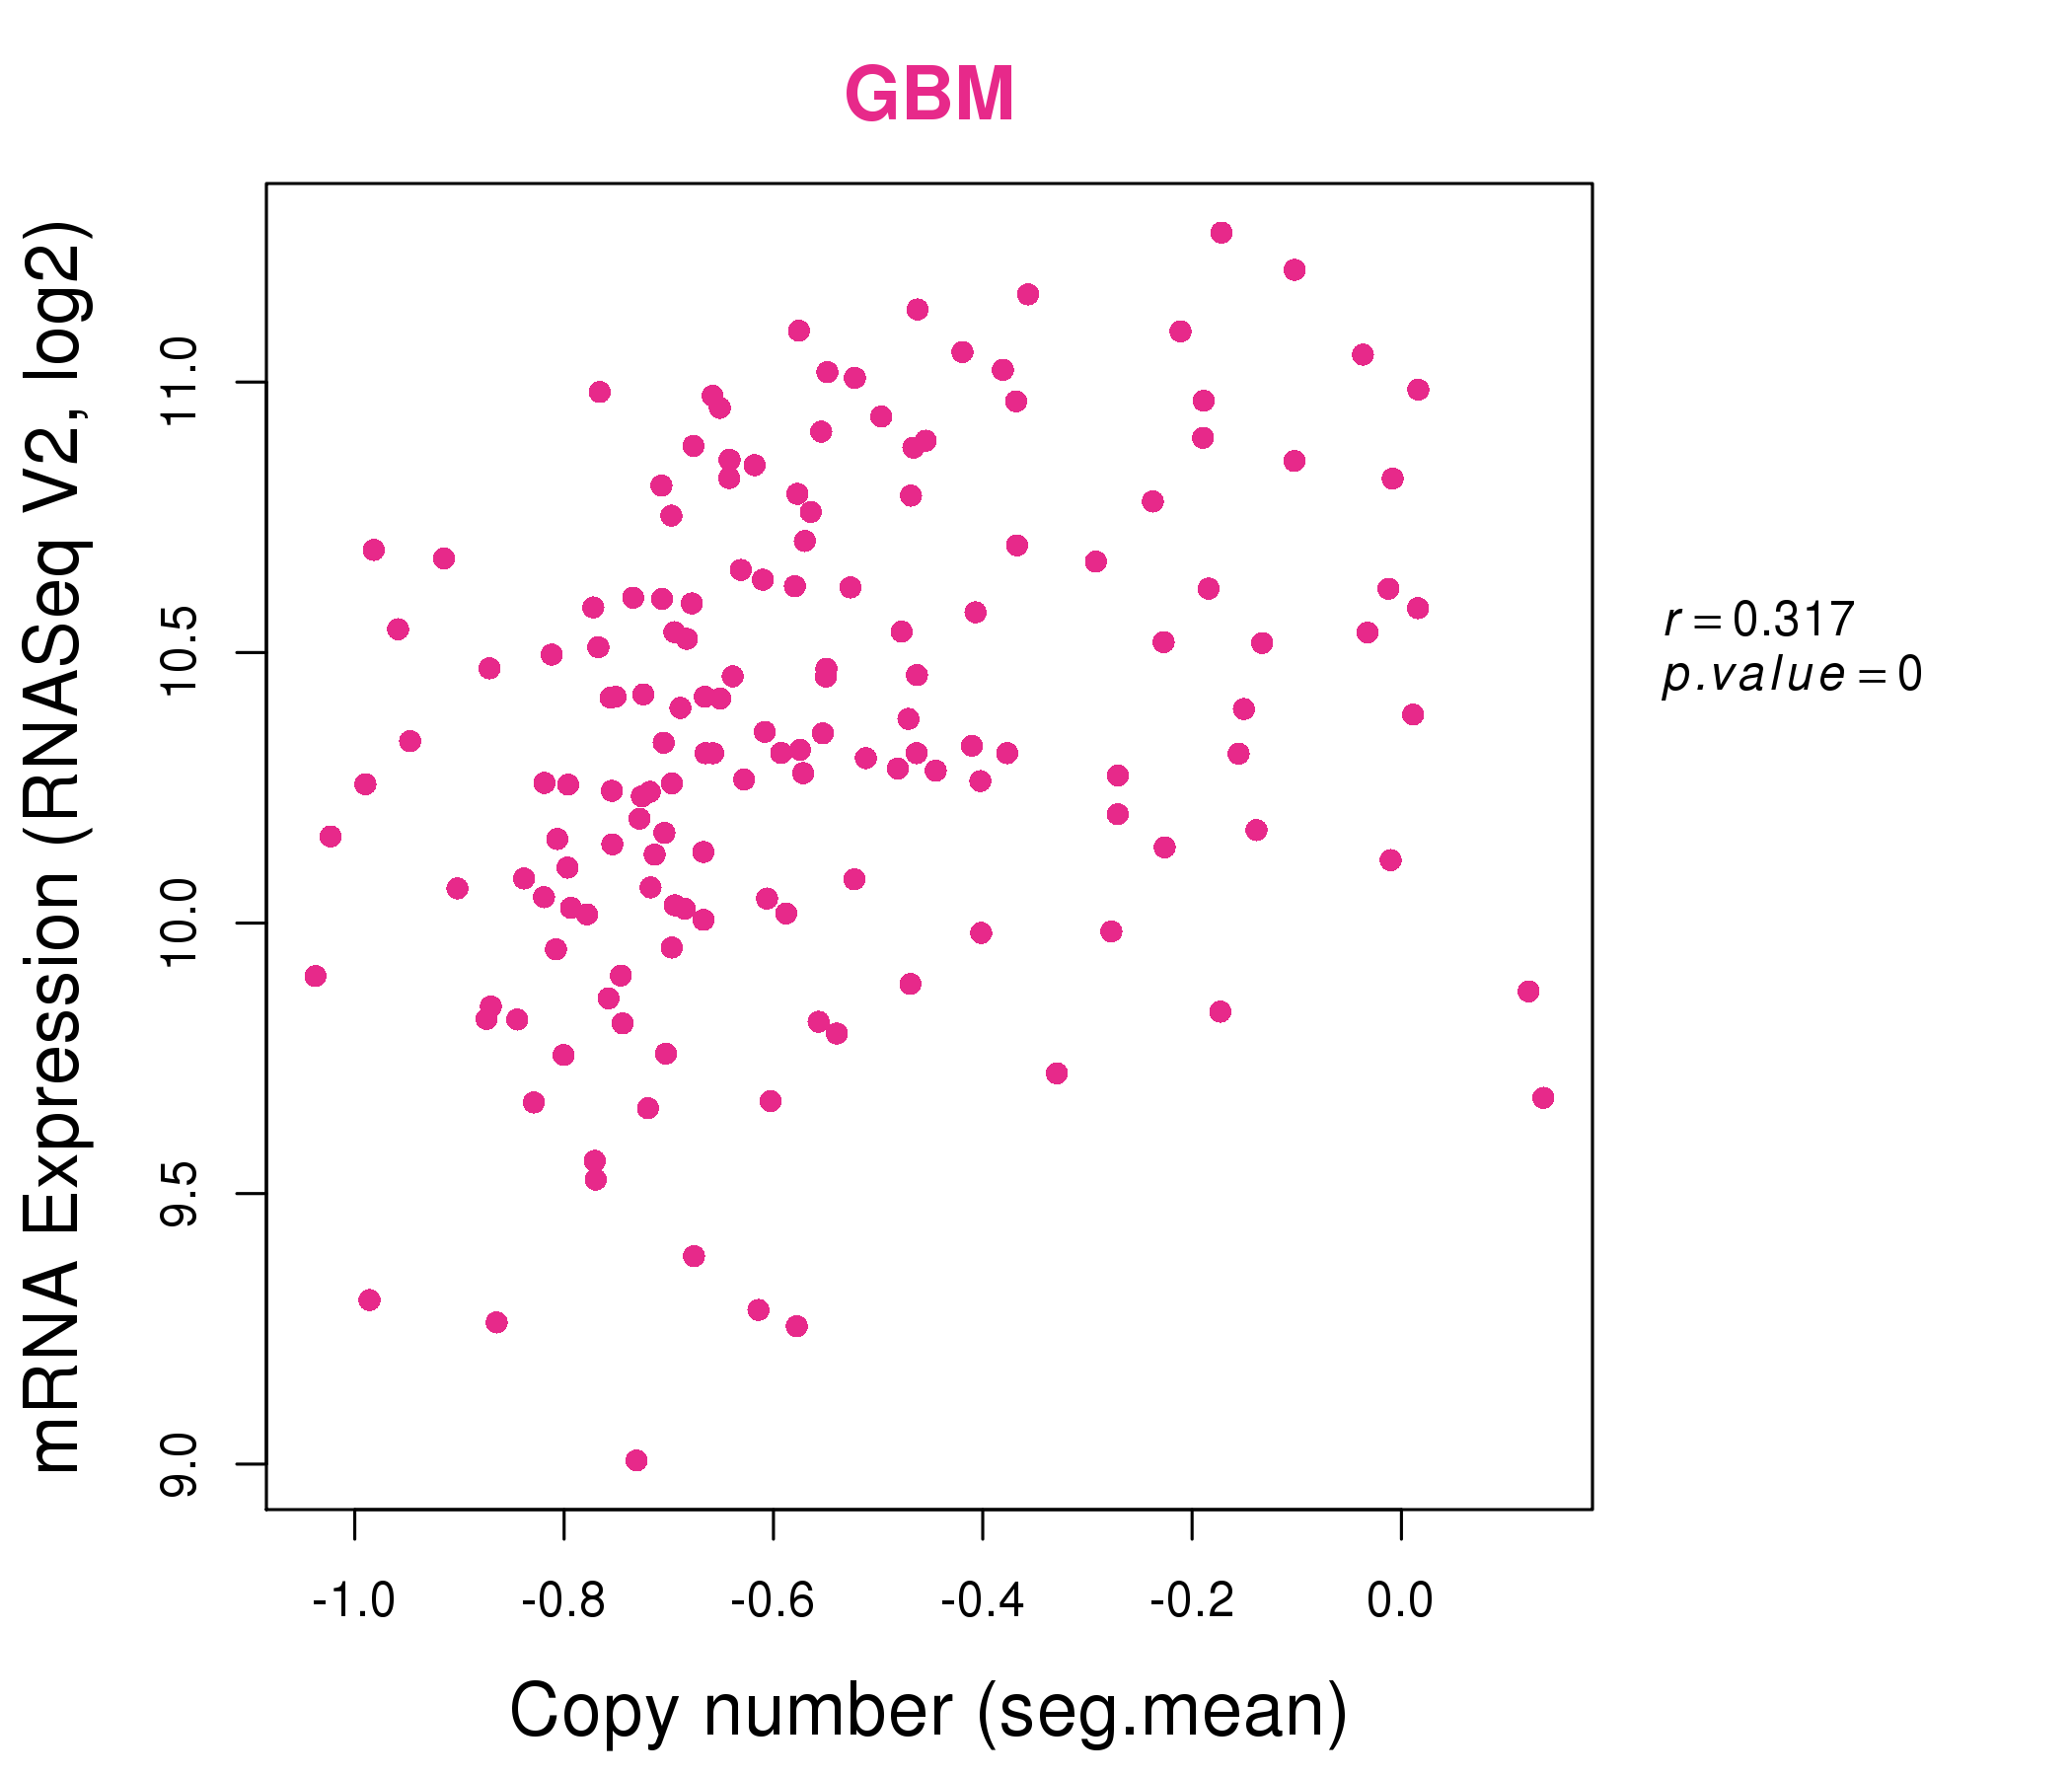
| * Normalized gene expression data of RNASeqV2 was extracted from TCGA using R package TCGA-Assembler. The URLs of all public data files on TCGA DCC data server were gathered at Jan-05-2015. Only eight cancer types have enough normal control samples for differential expression analysis. (t test, adjusted p<0.05 (using Benjamini-Hochberg FDR)) |
 |
| Top |
| * This plots show the correlation between CNV and gene expression. |
: Open all plots for all cancer types
 |
|
 |
|
| Top |
| Gene-Gene Network Information |
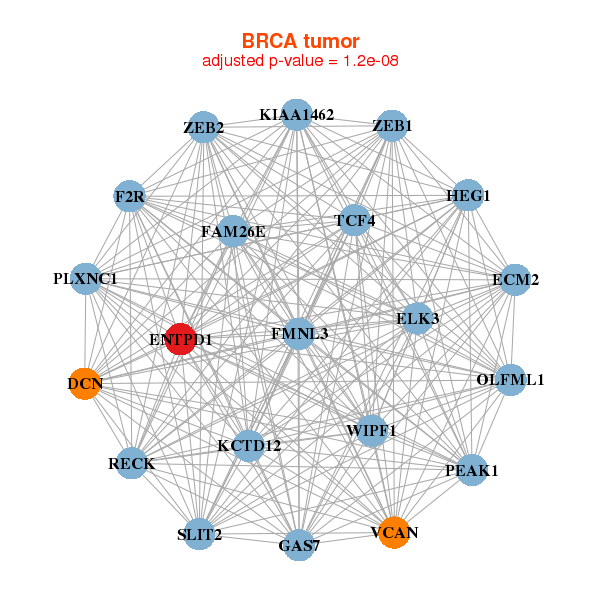
| * Co-Expression network figures were drawn using R package igraph. Only the top 20 genes with the highest correlations were shown. Red circle: input gene, orange circle: cell metabolism gene, sky circle: other gene |
: Open all plots for all cancer types
 |
|
| DCN,ECM2,ELK3,ENTPD1,F2R,FAM26E,FMNL3, GAS7,HEG1,KCTD12,KIAA1462,OLFML1,PLXNC1,RECK, PEAK1,SLIT2,TCF4,VCAN,WIPF1,ZEB1,ZEB2 | ABCC4,CDH11,CHST15,CNTN4,CYP1B1,DNAJC10,ENTPD1, F2R,F2RL2,LRRC16A,MICAL2,MXRA5,MYO1E,PLXDC1, PLXNC1,SEC24D,SERPINE2,STARD4,TLR7,UGGT1,WWC3 |
 |
|
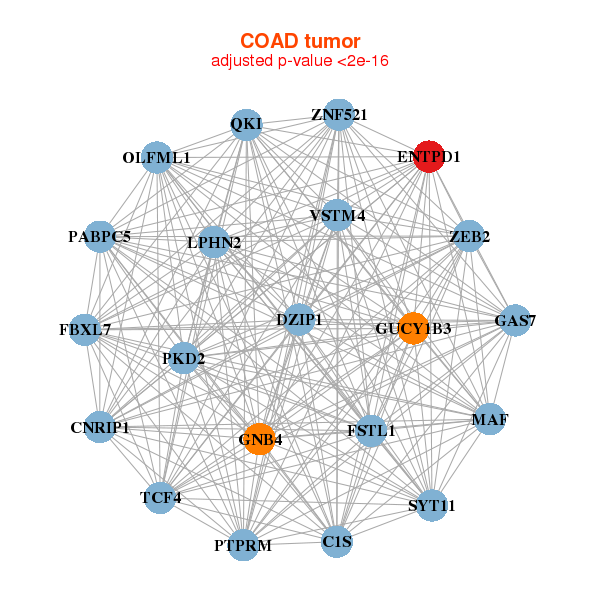
| VSTM4,C1S,CNRIP1,DZIP1,ENTPD1,FBXL7,FSTL1, GAS7,GNB4,GUCY1B3,LPHN2,MAF,OLFML1,PABPC5, PKD2,PTPRM,QKI,SYT11,TCF4,ZEB2,ZNF521 | ACTA2,ACTG2,ACTN1,ANXA6,CASQ2,CNN1,CSRP1, ENTPD1,FHL3,RBFOX3,ILDR2,ILK,ITGB3,LGALS1, LOC100192378,NLGN1,PDLIM7,TAGLN,TMEM200B,TUBA1A,ZFHX4 |

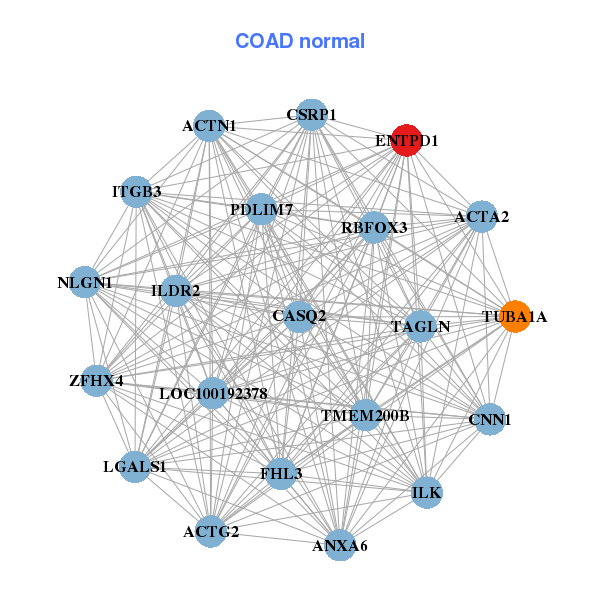
| * Co-Expression network figures were drawn using R package igraph. Only the top 20 genes with the highest correlations were shown. Red circle: input gene, orange circle: cell metabolism gene, sky circle: other gene |
: Open all plots for all cancer types
| Top |
: Open all interacting genes' information including KEGG pathway for all interacting genes from DAVID
| Top |
| Pharmacological Information for ENTPD1 |
| There's no related Drug. |
| Top |
| Cross referenced IDs for ENTPD1 |
| * We obtained these cross-references from Uniprot database. It covers 150 different DBs, 18 categories. http://www.uniprot.org/help/cross_references_section |
: Open all cross reference information
|
Copyright © 2016-Present - The Univsersity of Texas Health Science Center at Houston @ |