|
||||||||||||||||||||||||||||||||||||||||||||||||||||||||||||||||||||||||||||||||||||||||||||||||||||||||||||||||||||||||||||||||||||||||||||||||||||||||||||||||||||||||||||||||||||||||||||||||||||||||||||||||||||||||||||||||||||||||||||||||||||||||||||||||||||||||||||||||||||||||||||||||||||||||||||||||||||||||||
| |
| Phenotypic Information (metabolism pathway, cancer, disease, phenome) |
| |
| |
| Gene-Gene Network Information: Co-Expression Network, Interacting Genes & KEGG |
| |
|


| Gene Summary for POLR1C |
| Basic gene info. | Gene symbol | POLR1C |
| Gene name | polymerase (RNA) I polypeptide C, 30kDa | |
| Synonyms | RPA39|RPA40|RPA5|RPAC1|TCS3 | |
| Cytomap | UCSC genome browser: 6p21.1 | |
| Genomic location | chr6 :43484776-43489246 | |
| Type of gene | protein-coding | |
| RefGenes | NM_203290.2, NM_004875.2, | |
| Ensembl id | ENSG00000171453 | |
| Description | AC40DNA-directed RNA polymerase I subunit CDNA-directed RNA polymerases I and III 40 kDa polypeptideDNA-directed RNA polymerases I and III subunit RPAC1RNA polymerases I and III subunit AC1RPC40 | |
| Modification date | 20141219 | |
| dbXrefs | MIM : 610060 | |
| HGNC : HGNC | ||
| Ensembl : ENSG00000171453 | ||
| HPRD : 09661 | ||
| Vega : OTTHUMG00000014739 | ||
| Protein | UniProt: O15160 go to UniProt's Cross Reference DB Table | |
| Expression | CleanEX: HS_POLR1C | |
| BioGPS: 9533 | ||
| Gene Expression Atlas: ENSG00000171453 | ||
| The Human Protein Atlas: ENSG00000171453 | ||
| Pathway | NCI Pathway Interaction Database: POLR1C | |
| KEGG: POLR1C | ||
| REACTOME: POLR1C | ||
| ConsensusPathDB | ||
| Pathway Commons: POLR1C | ||
| Metabolism | MetaCyc: POLR1C | |
| HUMANCyc: POLR1C | ||
| Regulation | Ensembl's Regulation: ENSG00000171453 | |
| miRBase: chr6 :43,484,776-43,489,246 | ||
| TargetScan: NM_203290 | ||
| cisRED: ENSG00000171453 | ||
| Context | iHOP: POLR1C | |
| cancer metabolism search in PubMed: POLR1C | ||
| UCL Cancer Institute: POLR1C | ||
| Assigned class in ccmGDB | B - This gene belongs to cancer gene. | |
| Top |
| Phenotypic Information for POLR1C(metabolism pathway, cancer, disease, phenome) |
| Cancer | CGAP: POLR1C |
| Familial Cancer Database: POLR1C | |
| * This gene is included in those cancer gene databases. |
|
|
|
|
|
| . | ||||||||||||||||||||||||||||||||||||||||||||||||||||||||||||||||||||||||||||||||||||||||||||||||||||||||||||||||||||||||||||||||||||||||||||||||||||||||||||||||||||||||||||||||||||||||||||||||||||||||||||||||||||||||||||||||||||||||||||||||||||||||||||||||||||||||||||||||||||||||||||||||||||||||||||||||||||
Oncogene 1 | Significant driver gene in | |||||||||||||||||||||||||||||||||||||||||||||||||||||||||||||||||||||||||||||||||||||||||||||||||||||||||||||||||||||||||||||||||||||||||||||||||||||||||||||||||||||||||||||||||||||||||||||||||||||||||||||||||||||||||||||||||||||||||||||||||||||||||||||||||||||||||||||||||||||||||||||||||||||||||||||||||||||||||
| cf) number; DB name 1 Oncogene; http://nar.oxfordjournals.org/content/35/suppl_1/D721.long, 2 Tumor Suppressor gene; https://bioinfo.uth.edu/TSGene/, 3 Cancer Gene Census; http://www.nature.com/nrc/journal/v4/n3/abs/nrc1299.html, 4 CancerGenes; http://nar.oxfordjournals.org/content/35/suppl_1/D721.long, 5 Network of Cancer Gene; http://ncg.kcl.ac.uk/index.php, 1Therapeutic Vulnerabilities in Cancer; http://cbio.mskcc.org/cancergenomics/statius/ |
| KEGG_PURINE_METABOLISM KEGG_PYRIMIDINE_METABOLISM | |
| OMIM | 248390; phenotype. 610060; gene. |
| Orphanet | 861; Treacher-Collins syndrome. |
| Disease | KEGG Disease: POLR1C |
| MedGen: POLR1C (Human Medical Genetics with Condition) | |
| ClinVar: POLR1C | |
| Phenotype | MGI: POLR1C (International Mouse Phenotyping Consortium) |
| PhenomicDB: POLR1C | |
| Mutations for POLR1C |
| * Under tables are showing count per each tissue to give us broad intuition about tissue specific mutation patterns.You can go to the detailed page for each mutation database's web site. |
| There's no structural variation information in COSMIC data for this gene. |
| * From mRNA Sanger sequences, Chitars2.0 arranged chimeric transcripts. This table shows POLR1C related fusion information. |
| ID | Head Gene | Tail Gene | Accession | Gene_a | qStart_a | qEnd_a | Chromosome_a | tStart_a | tEnd_a | Gene_a | qStart_a | qEnd_a | Chromosome_a | tStart_a | tEnd_a |
| Top |
| Mutation type/ Tissue ID | brca | cns | cerv | endome | haematopo | kidn | Lintest | liver | lung | ns | ovary | pancre | prost | skin | stoma | thyro | urina | |||
| Total # sample | 1 | |||||||||||||||||||
| GAIN (# sample) | 1 | |||||||||||||||||||
| LOSS (# sample) |
| cf) Tissue ID; Tissue type (1; Breast, 2; Central_nervous_system, 3; Cervix, 4; Endometrium, 5; Haematopoietic_and_lymphoid_tissue, 6; Kidney, 7; Large_intestine, 8; Liver, 9; Lung, 10; NS, 11; Ovary, 12; Pancreas, 13; Prostate, 14; Skin, 15; Stomach, 16; Thyroid, 17; Urinary_tract) |
| Top |
|
 |
| Top |
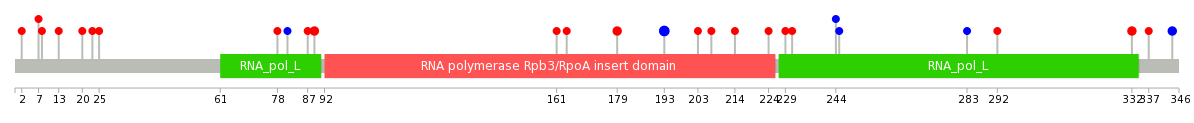
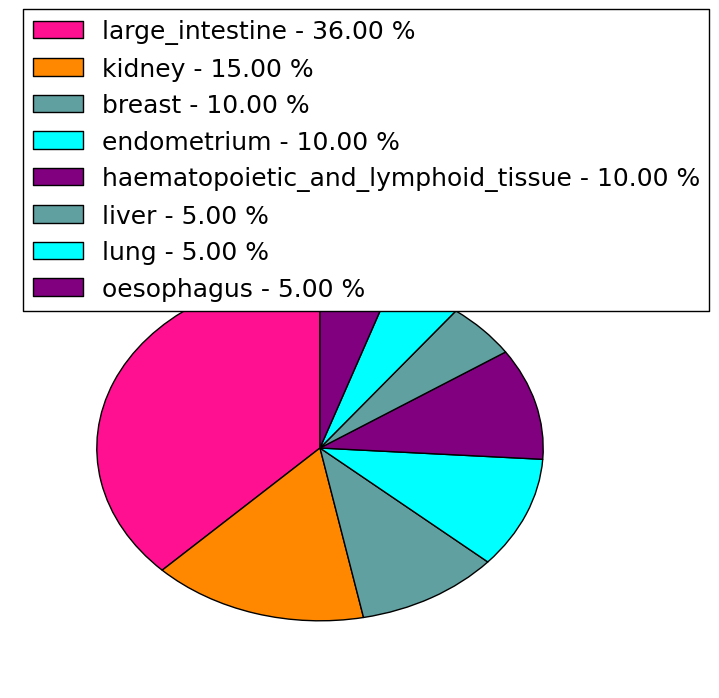
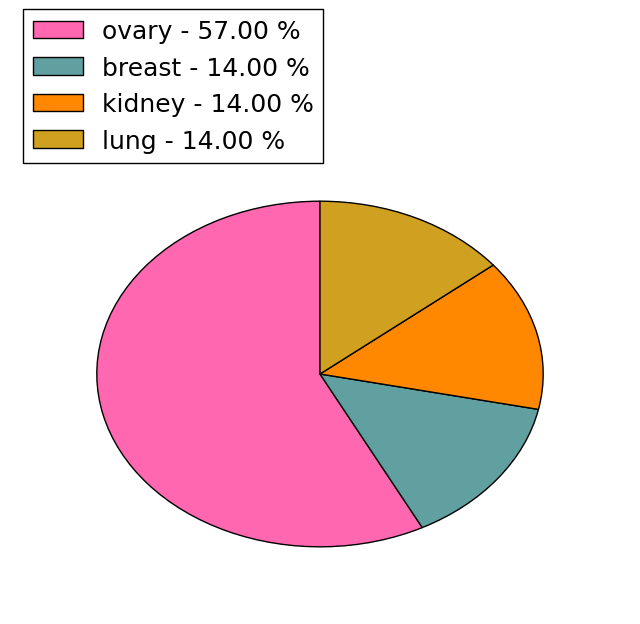
| Stat. for Non-Synonymous SNVs (# total SNVs=19) | (# total SNVs=7) |
 |  |
(# total SNVs=0) | (# total SNVs=0) |
| Top |
| * When you move the cursor on each content, you can see more deailed mutation information on the Tooltip. Those are primary_site,primary_histology,mutation(aa),pubmedID. |
| GRCh37 position | Mutation(aa) | Unique sampleID count |
| chr6:43488089-43488089 | p.V193V | 4 |
| chr6:43488991-43488991 | p.K332Q | 2 |
| chr6:43489029-43489029 | p.Q344Q | 2 |
| chr6:43487460-43487460 | p.V89G | 2 |
| chr6:43488045-43488045 | p.G179W | 2 |
| chr6:43488771-43488771 | p.R303* | 1 |
| chr6:43487161-43487161 | p.R78* | 1 |
| chr6:43488129-43488129 | p.E207K | 1 |
| chr6:43487162-43487162 | p.R78Q | 1 |
| chr6:43488150-43488150 | p.C214R | 1 |
| Top |
|
 |
| Point Mutation/ Tissue ID | 1 | 2 | 3 | 4 | 5 | 6 | 7 | 8 | 9 | 10 | 11 | 12 | 13 | 14 | 15 | 16 | 17 | 18 | 19 | 20 |
| # sample | 1 | 1 | 2 | 1 | 4 | 1 | 1 | 1 | 2 | 2 | 2 | |||||||||
| # mutation | 1 | 1 | 4 | 1 | 3 | 1 | 1 | 1 | 2 | 2 | 2 | |||||||||
| nonsynonymous SNV | 1 | 1 | 4 | 1 | 2 | 1 | 1 | 1 | 1 | 2 | ||||||||||
| synonymous SNV | 1 | 1 | 1 | 1 |
| cf) Tissue ID; Tissue type (1; BLCA[Bladder Urothelial Carcinoma], 2; BRCA[Breast invasive carcinoma], 3; CESC[Cervical squamous cell carcinoma and endocervical adenocarcinoma], 4; COAD[Colon adenocarcinoma], 5; GBM[Glioblastoma multiforme], 6; Glioma Low Grade, 7; HNSC[Head and Neck squamous cell carcinoma], 8; KICH[Kidney Chromophobe], 9; KIRC[Kidney renal clear cell carcinoma], 10; KIRP[Kidney renal papillary cell carcinoma], 11; LAML[Acute Myeloid Leukemia], 12; LUAD[Lung adenocarcinoma], 13; LUSC[Lung squamous cell carcinoma], 14; OV[Ovarian serous cystadenocarcinoma ], 15; PAAD[Pancreatic adenocarcinoma], 16; PRAD[Prostate adenocarcinoma], 17; SKCM[Skin Cutaneous Melanoma], 18:STAD[Stomach adenocarcinoma], 19:THCA[Thyroid carcinoma], 20:UCEC[Uterine Corpus Endometrial Carcinoma]) |
| Top |
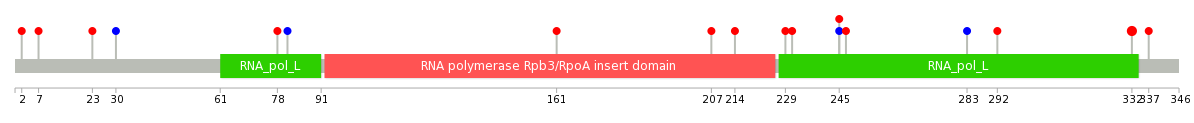
| * We represented just top 10 SNVs. When you move the cursor on each content, you can see more deailed mutation information on the Tooltip. Those are primary_site, primary_histology, mutation(aa), pubmedID. |
| Genomic Position | Mutation(aa) | Unique sampleID count |
| chr6:43488991 | p.K332Q | 3 |
| chr6:43488129 | p.C214R | 1 |
| chr6:43488150 | p.A229T | 1 |
| chr6:43488392 | p.A231T | 1 |
| chr6:43488398 | p.V245M | 1 |
| chr6:43484852 | p.V245V | 1 |
| chr6:43488440 | p.G247V | 1 |
| chr6:43484866 | p.F283F | 1 |
| chr6:43488442 | p.K292M | 1 |
| chr6:43484915 | p.A2V | 1 |
| * Copy number data were extracted from TCGA using R package TCGA-Assembler. The URLs of all public data files on TCGA DCC data server were gathered on Jan-05-2015. Function ProcessCNAData in TCGA-Assembler package was used to obtain gene-level copy number value which is calculated as the average copy number of the genomic region of a gene. |
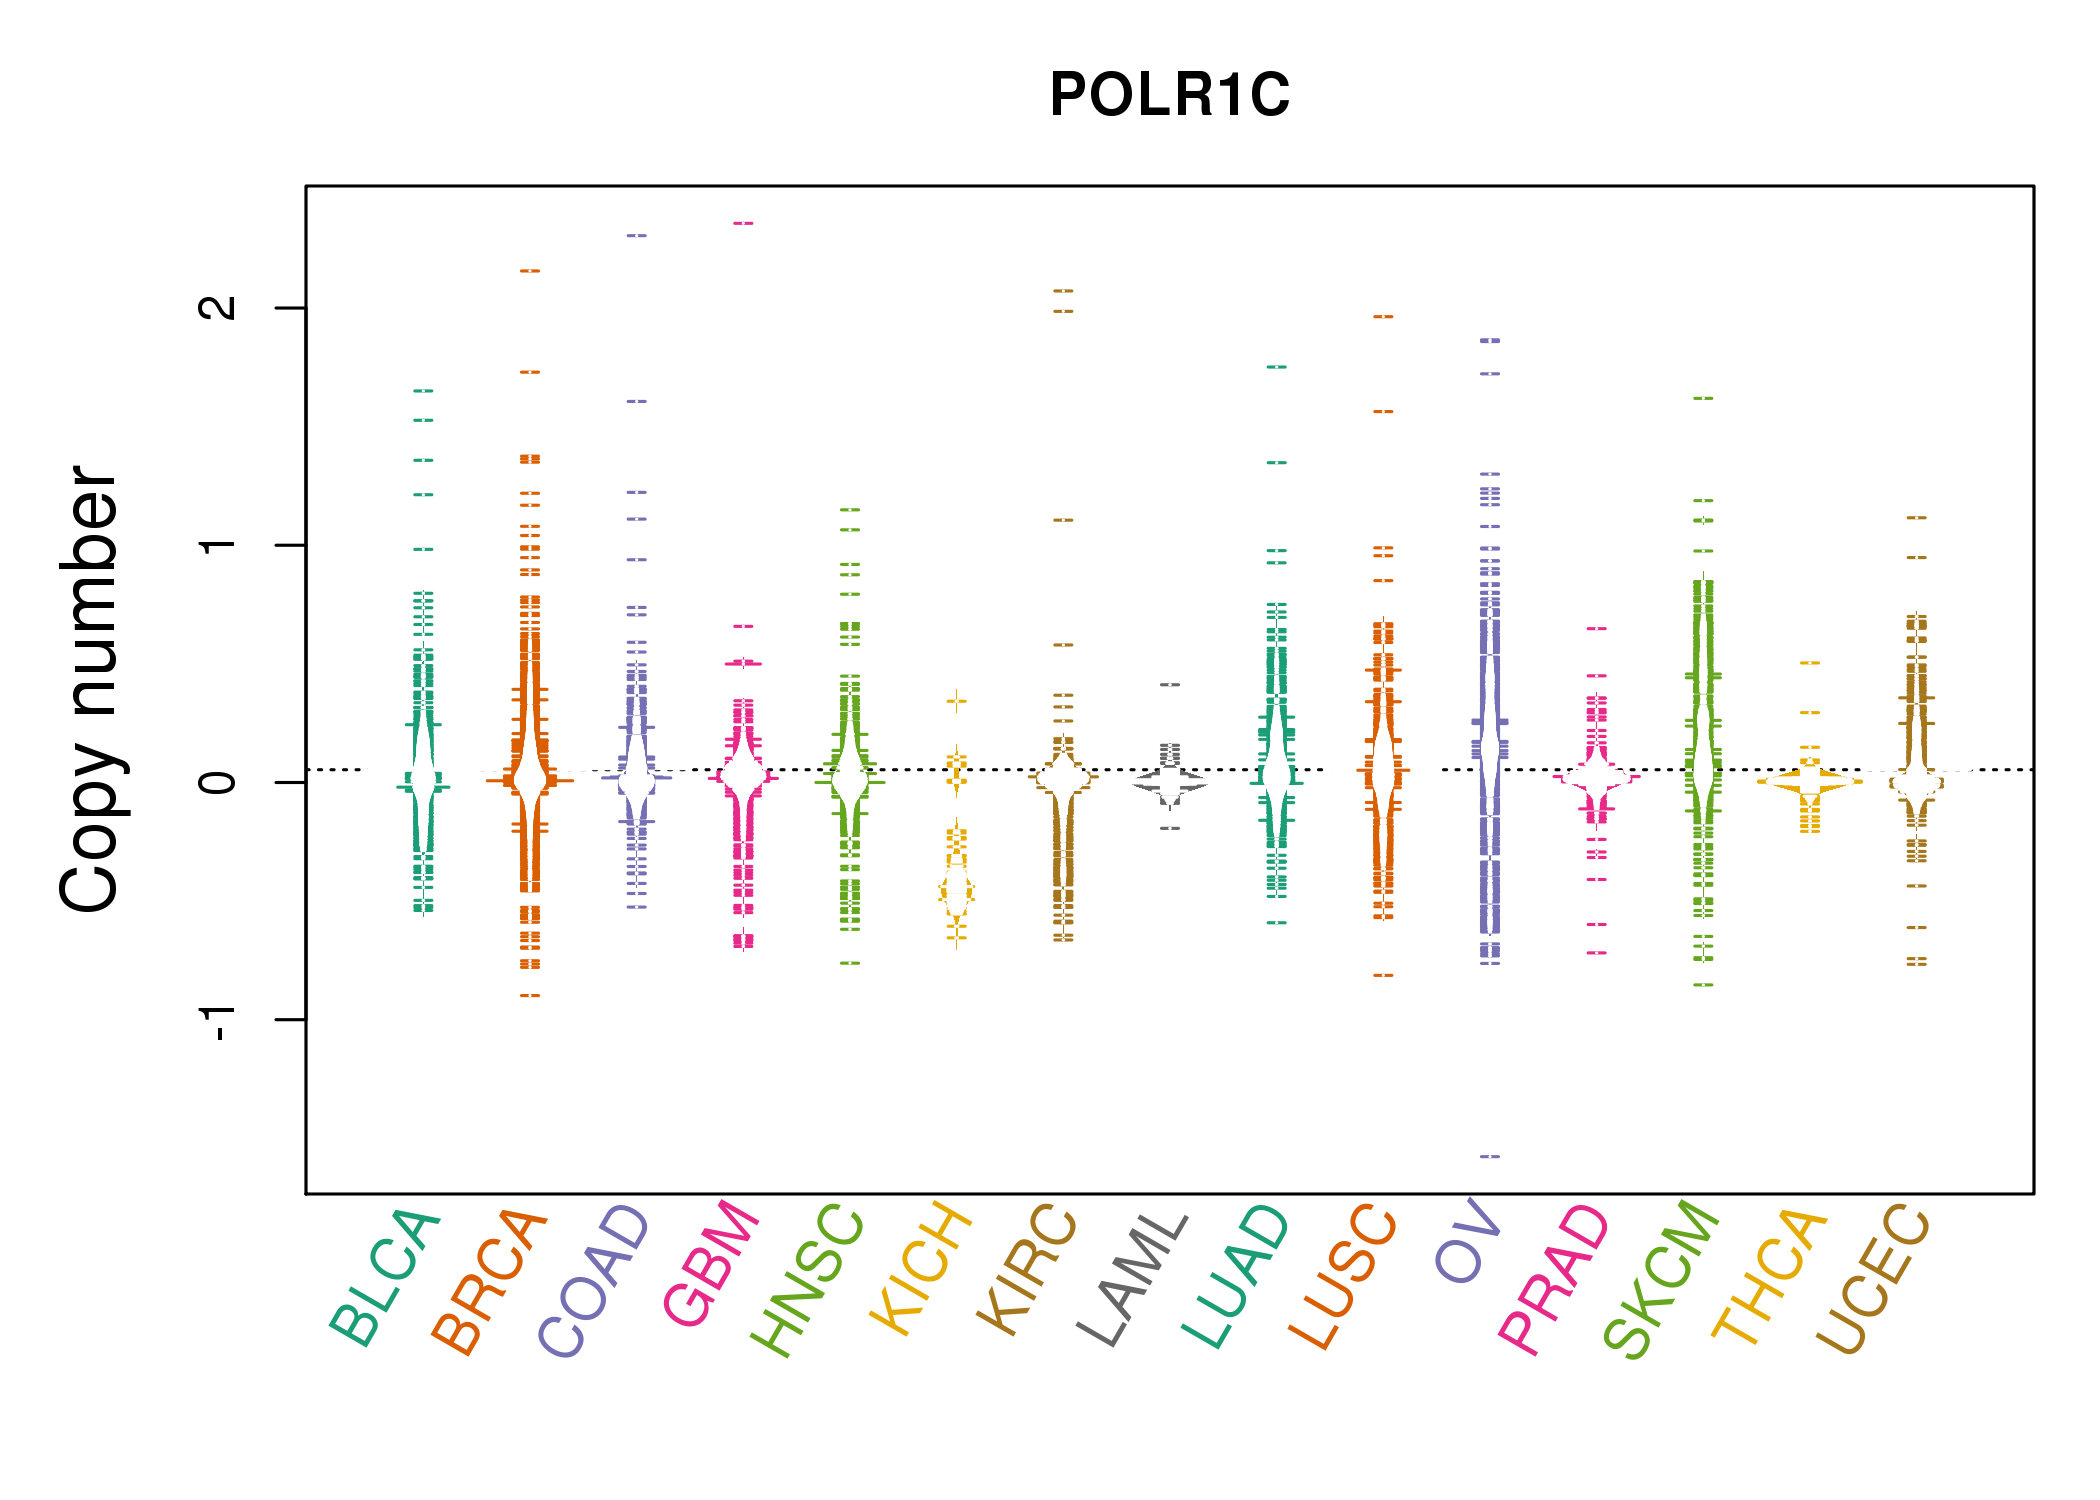 |
| cf) Tissue ID[Tissue type]: BLCA[Bladder Urothelial Carcinoma], BRCA[Breast invasive carcinoma], CESC[Cervical squamous cell carcinoma and endocervical adenocarcinoma], COAD[Colon adenocarcinoma], GBM[Glioblastoma multiforme], Glioma Low Grade, HNSC[Head and Neck squamous cell carcinoma], KICH[Kidney Chromophobe], KIRC[Kidney renal clear cell carcinoma], KIRP[Kidney renal papillary cell carcinoma], LAML[Acute Myeloid Leukemia], LUAD[Lung adenocarcinoma], LUSC[Lung squamous cell carcinoma], OV[Ovarian serous cystadenocarcinoma ], PAAD[Pancreatic adenocarcinoma], PRAD[Prostate adenocarcinoma], SKCM[Skin Cutaneous Melanoma], STAD[Stomach adenocarcinoma], THCA[Thyroid carcinoma], UCEC[Uterine Corpus Endometrial Carcinoma] |
| Top |
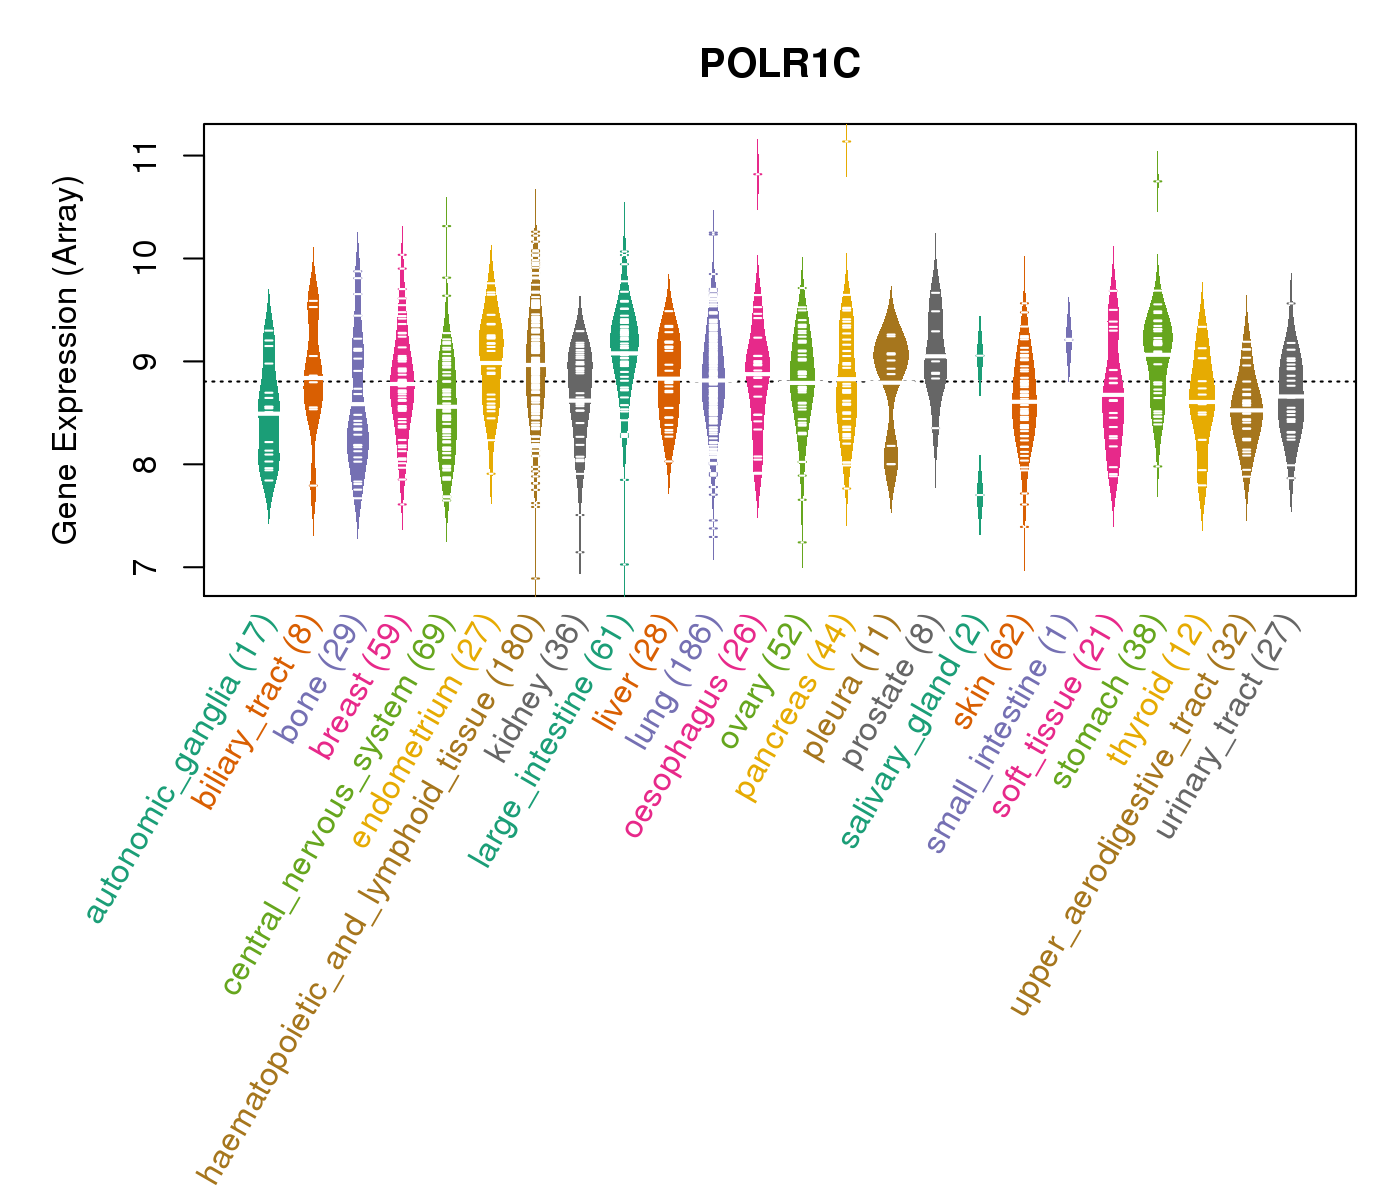
| Gene Expression for POLR1C |
| * CCLE gene expression data were extracted from CCLE_Expression_Entrez_2012-10-18.res: Gene-centric RMA-normalized mRNA expression data. |
 |
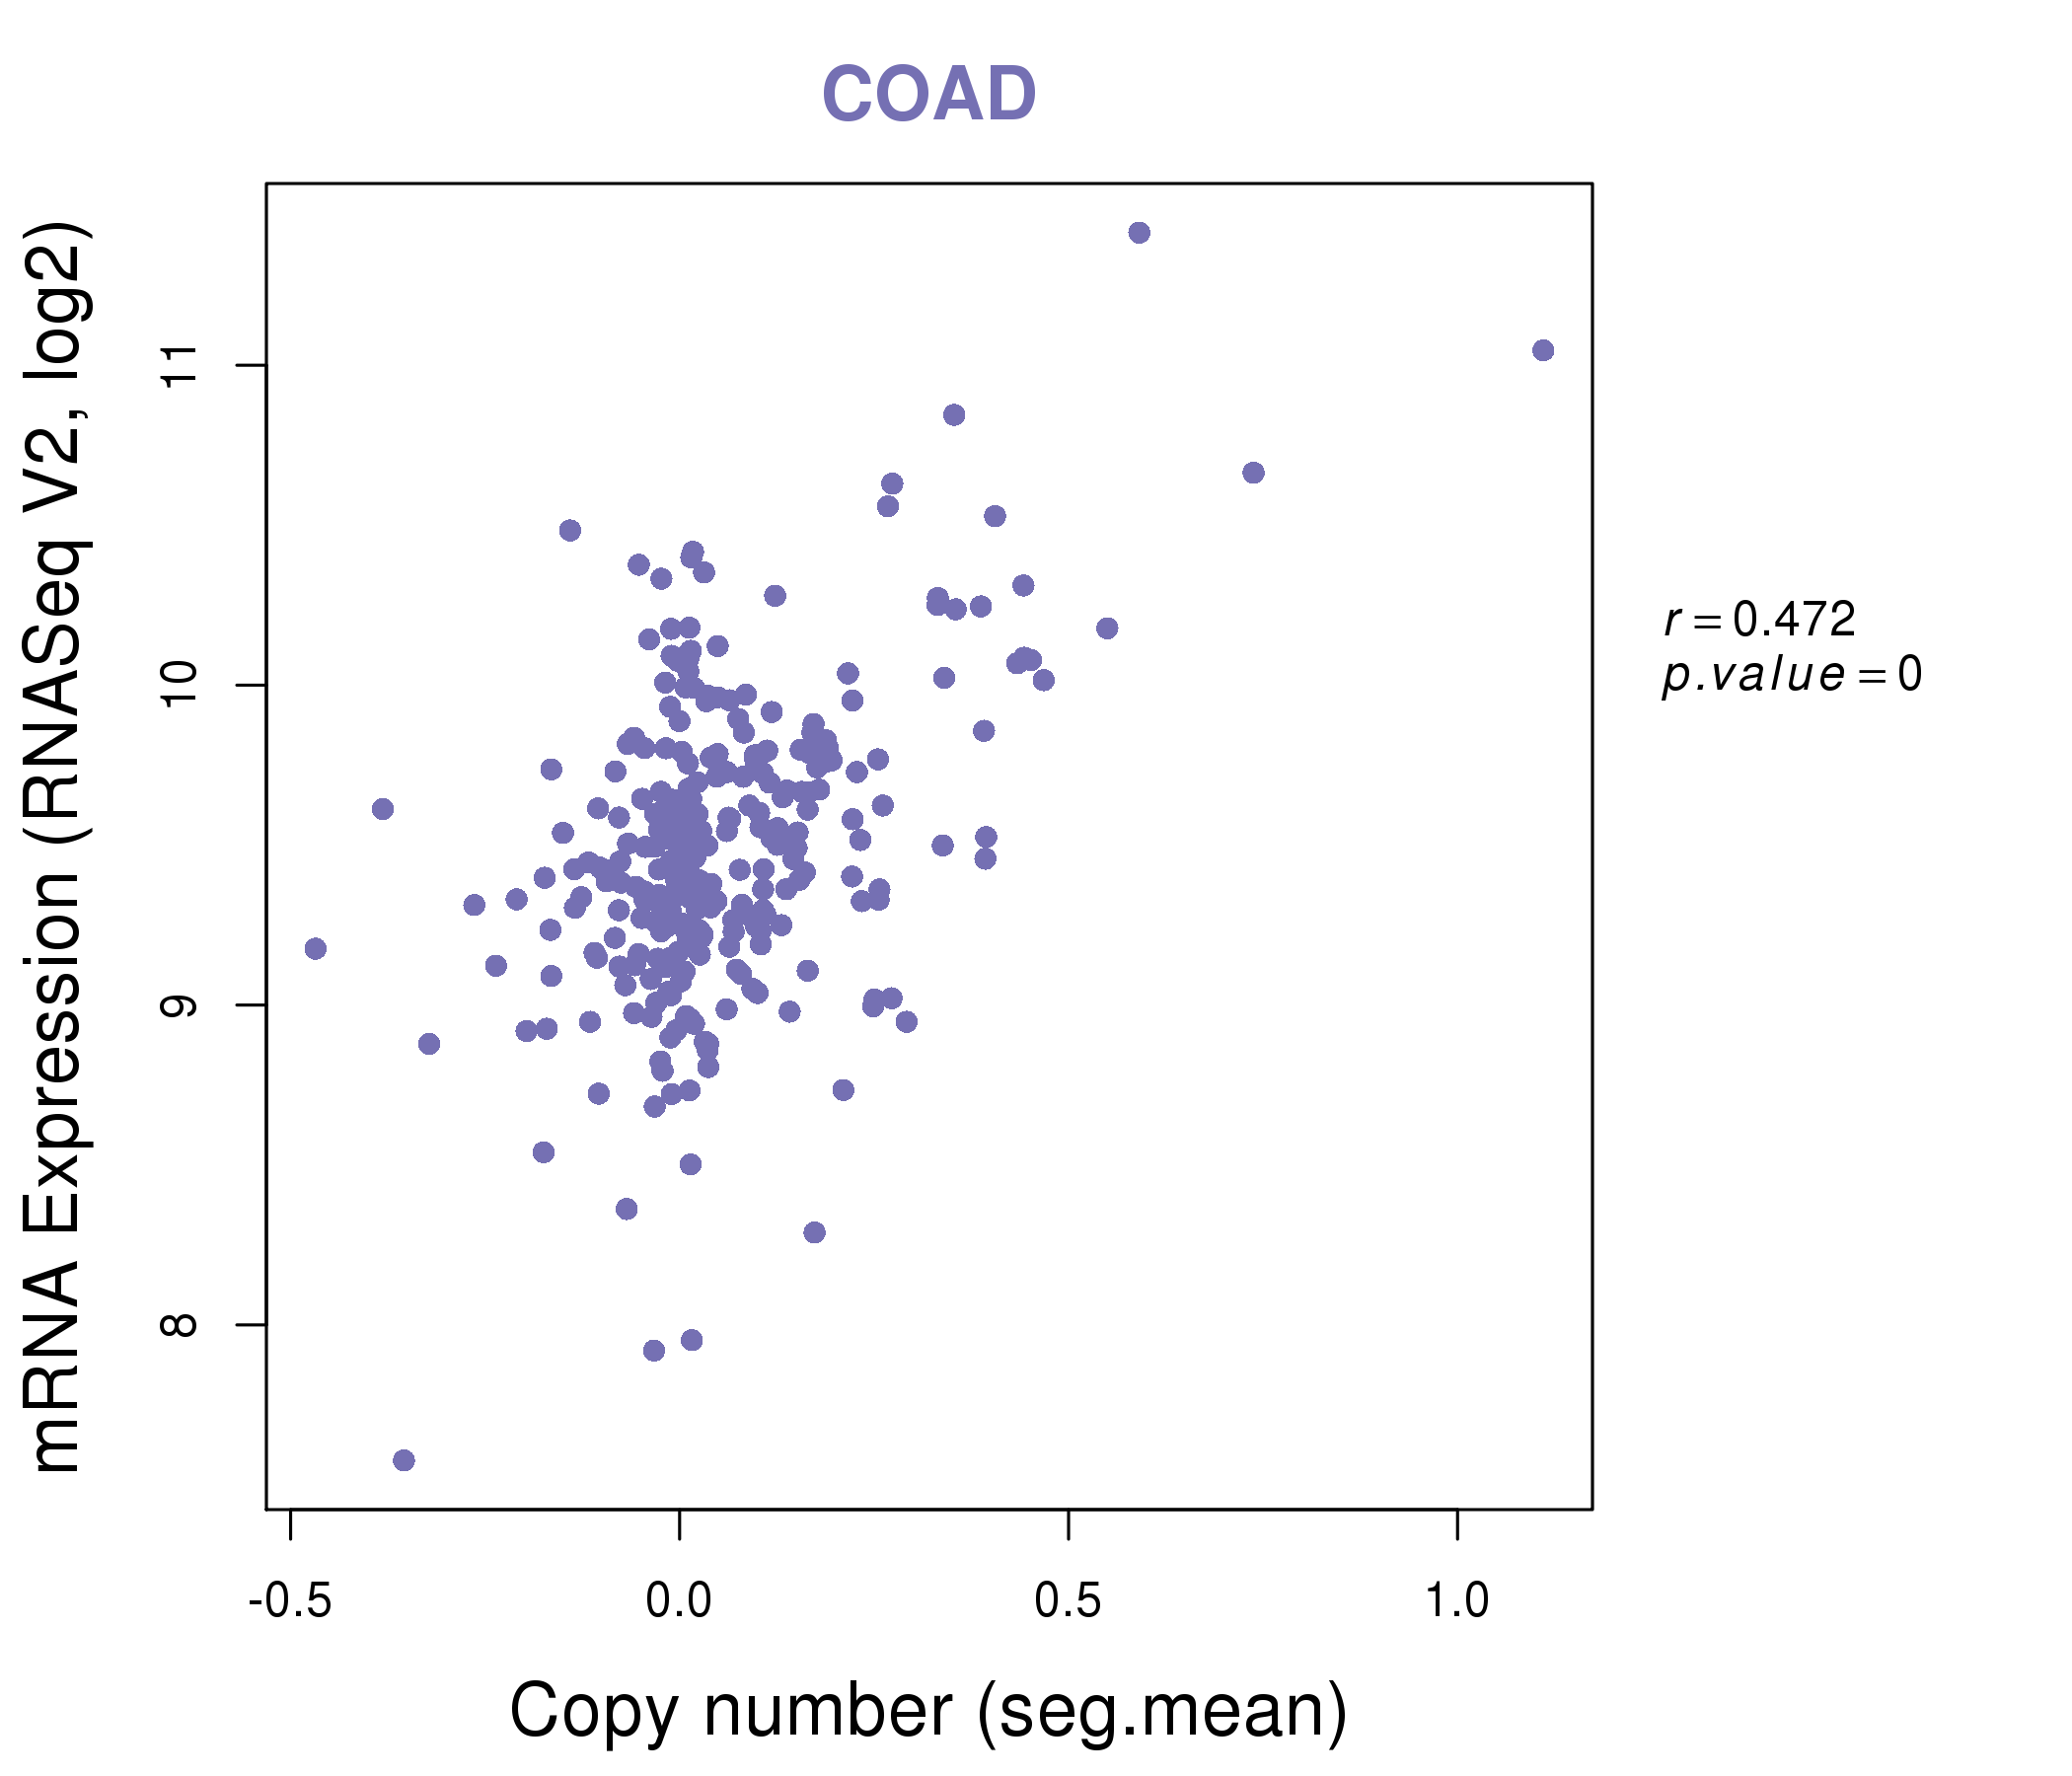
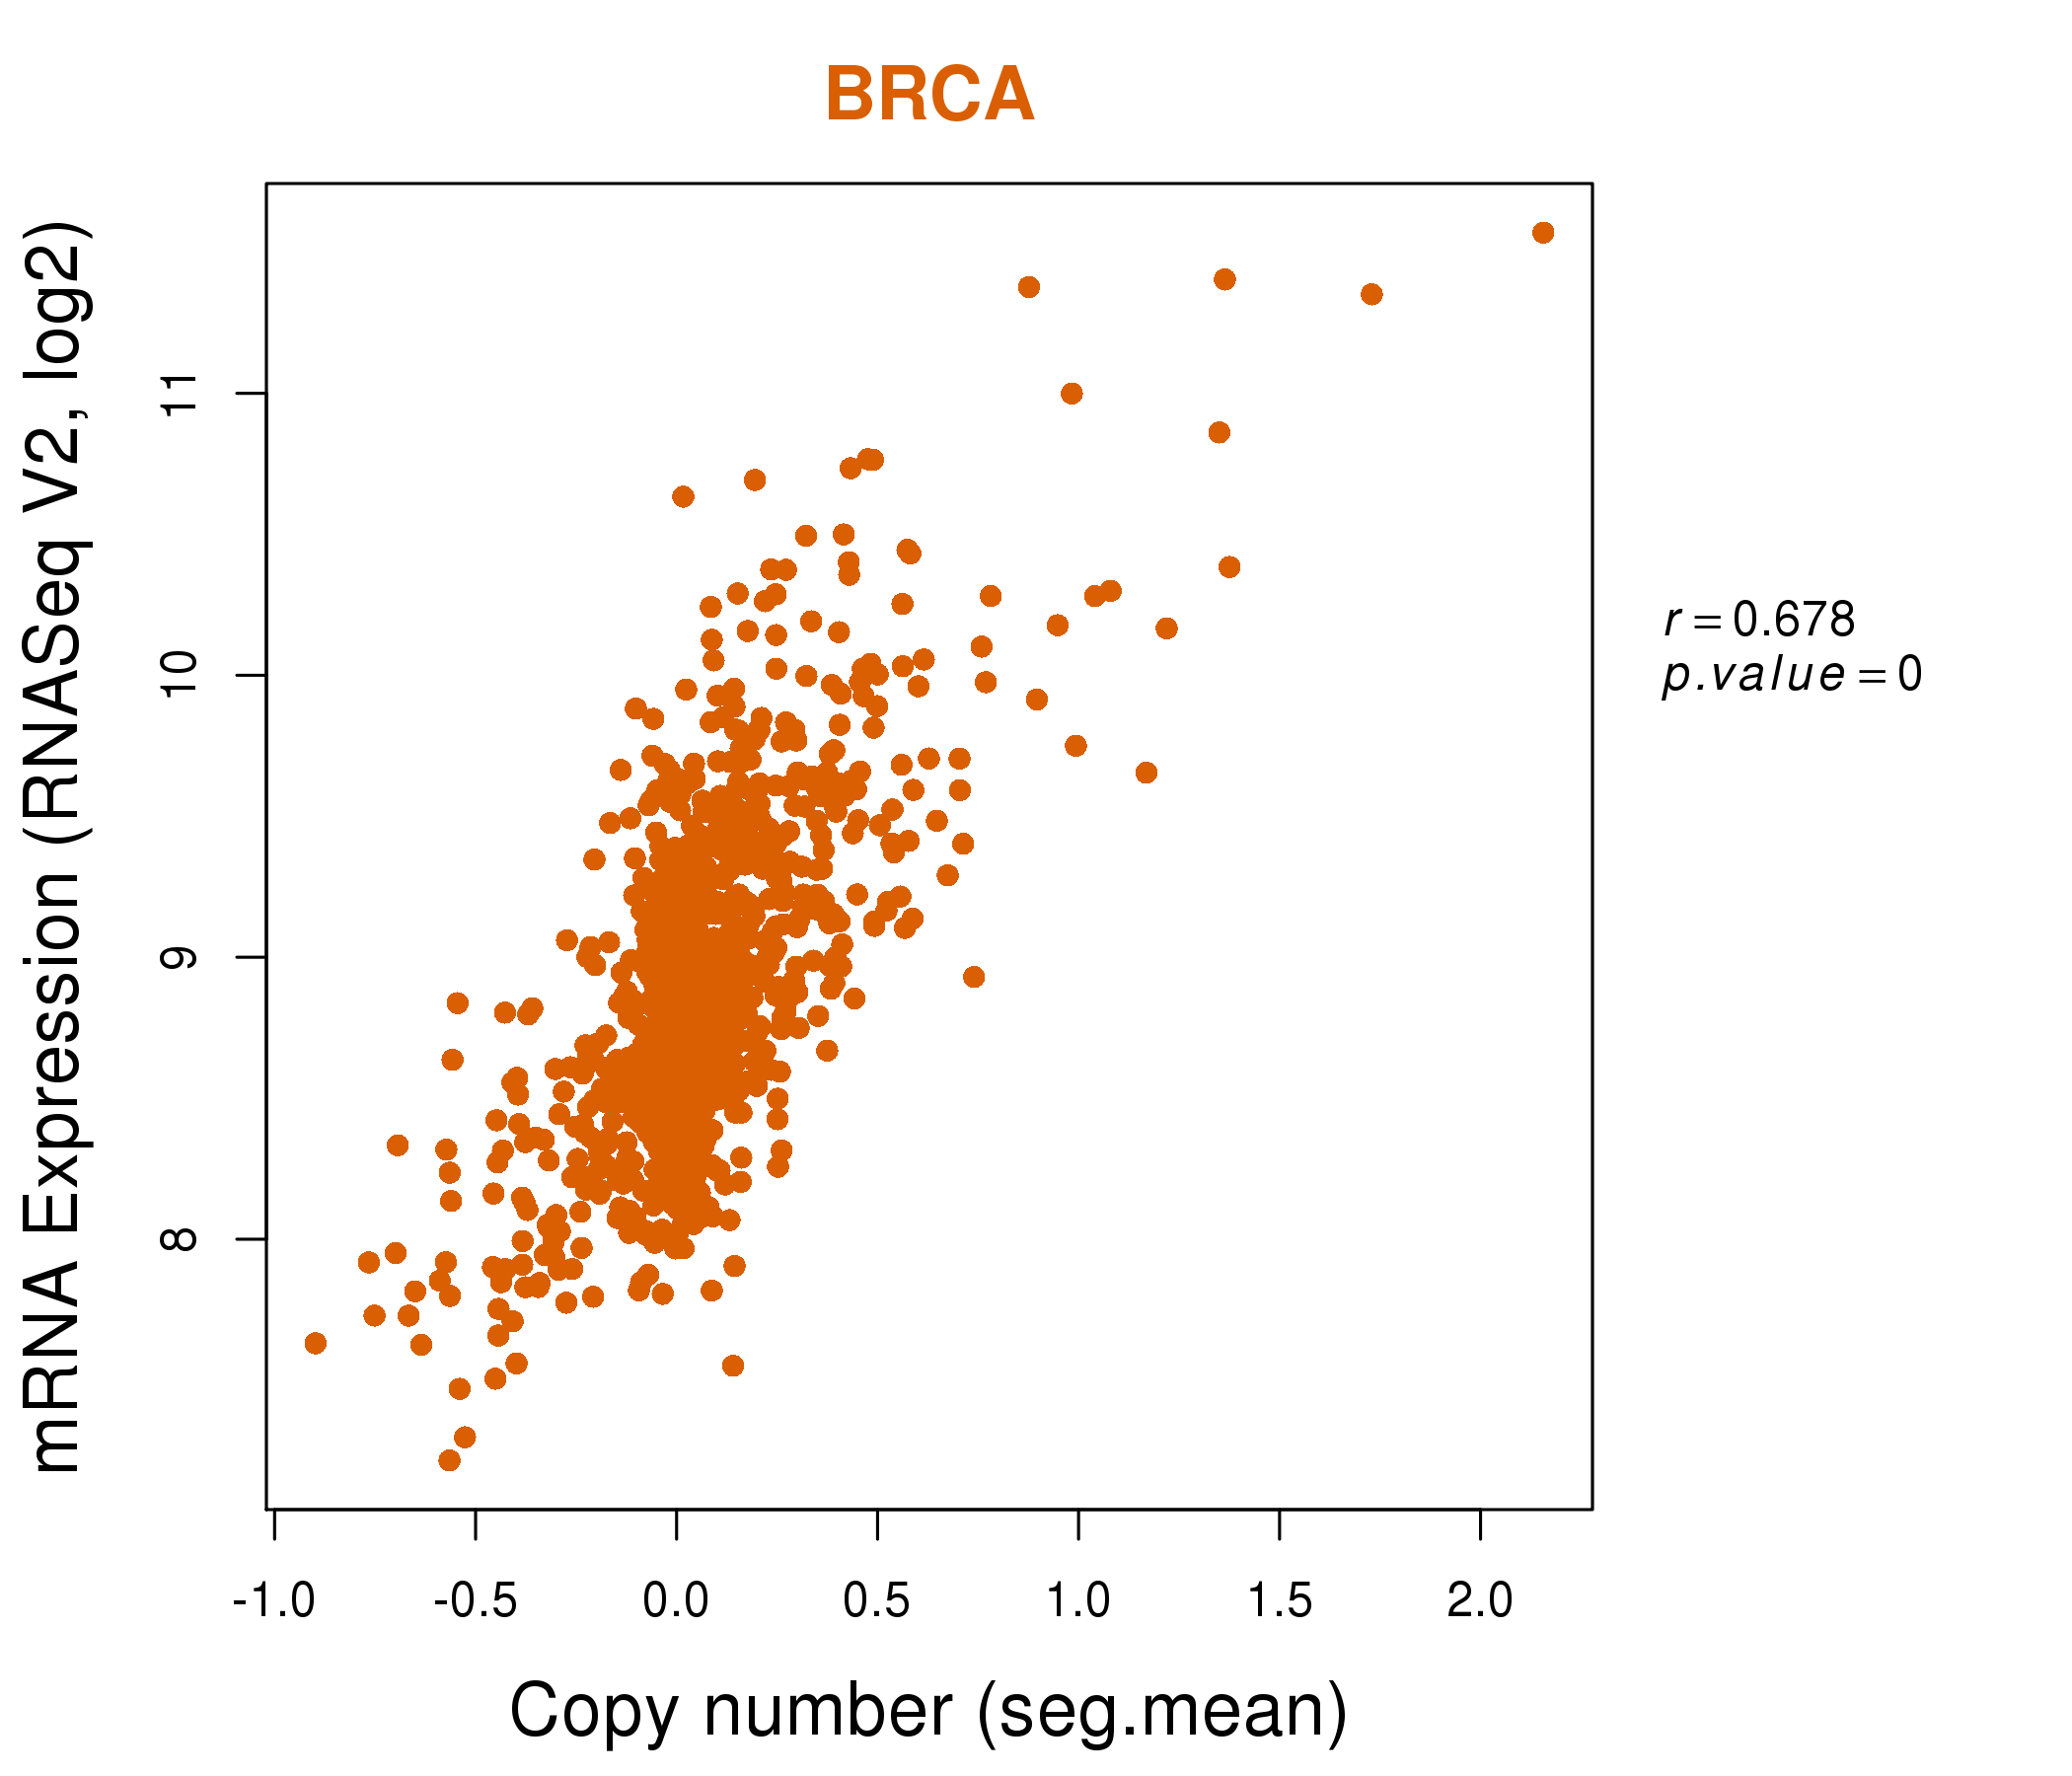
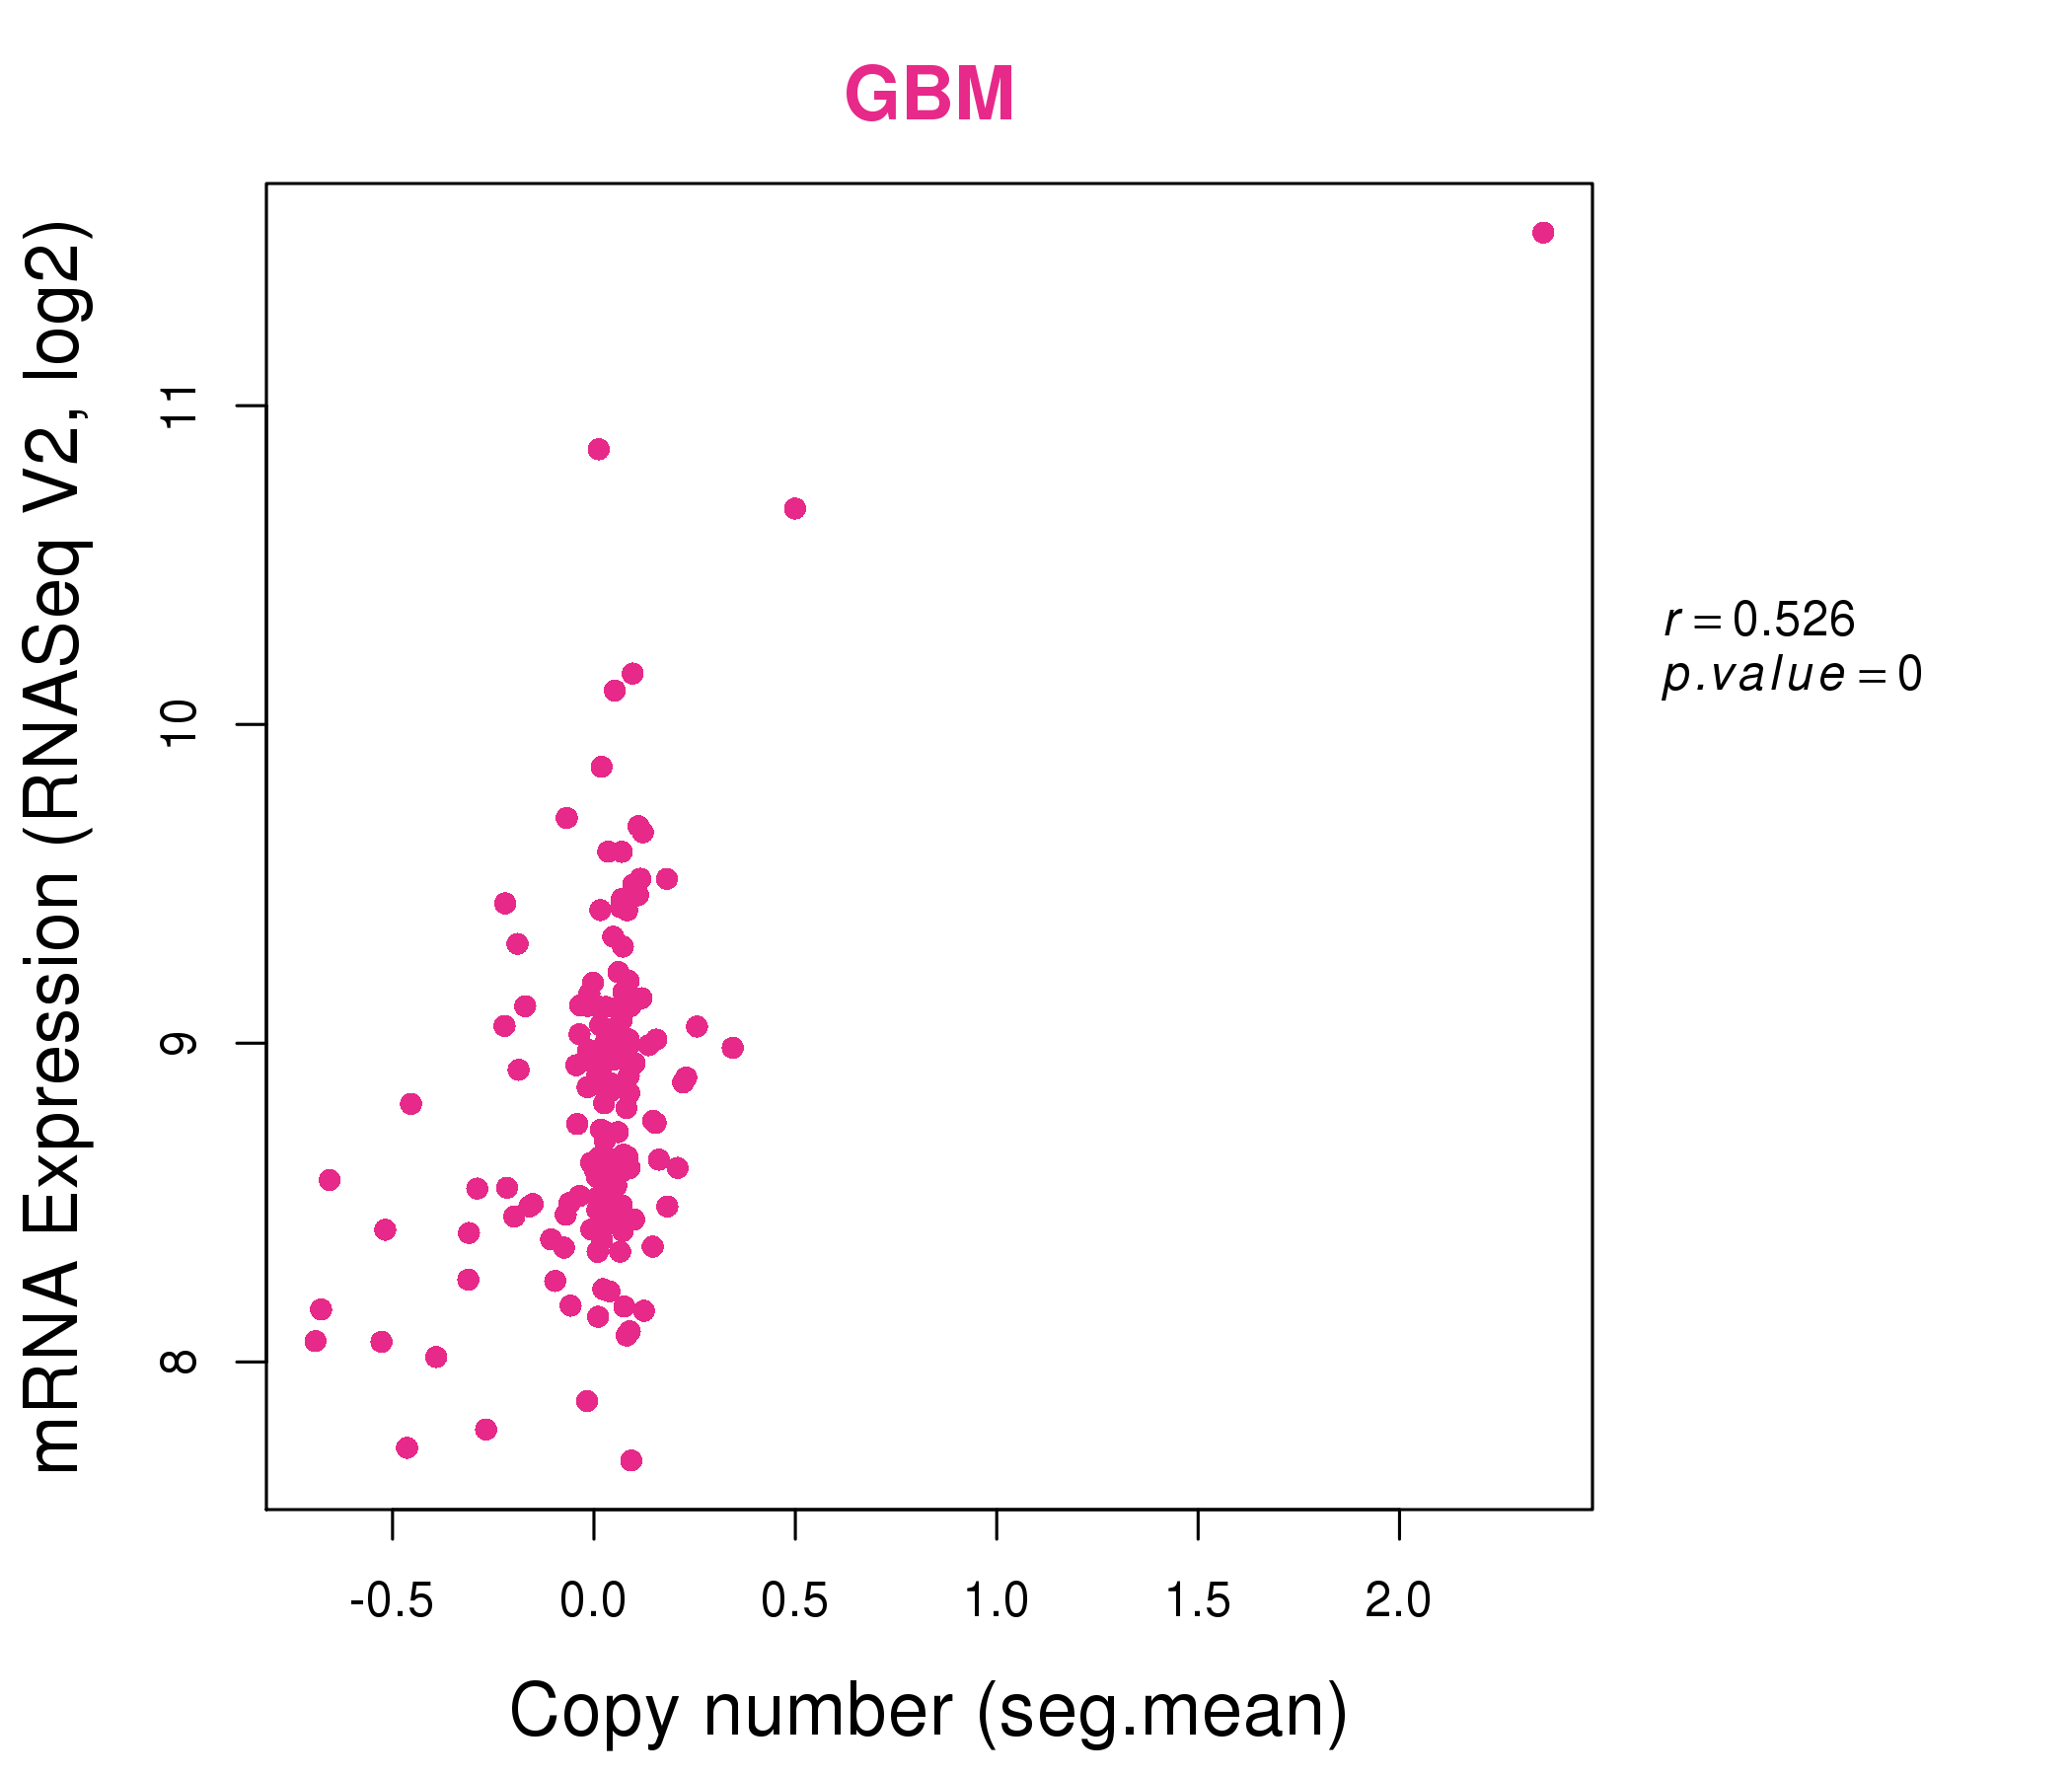
| * Normalized gene expression data of RNASeqV2 was extracted from TCGA using R package TCGA-Assembler. The URLs of all public data files on TCGA DCC data server were gathered at Jan-05-2015. Only eight cancer types have enough normal control samples for differential expression analysis. (t test, adjusted p<0.05 (using Benjamini-Hochberg FDR)) |
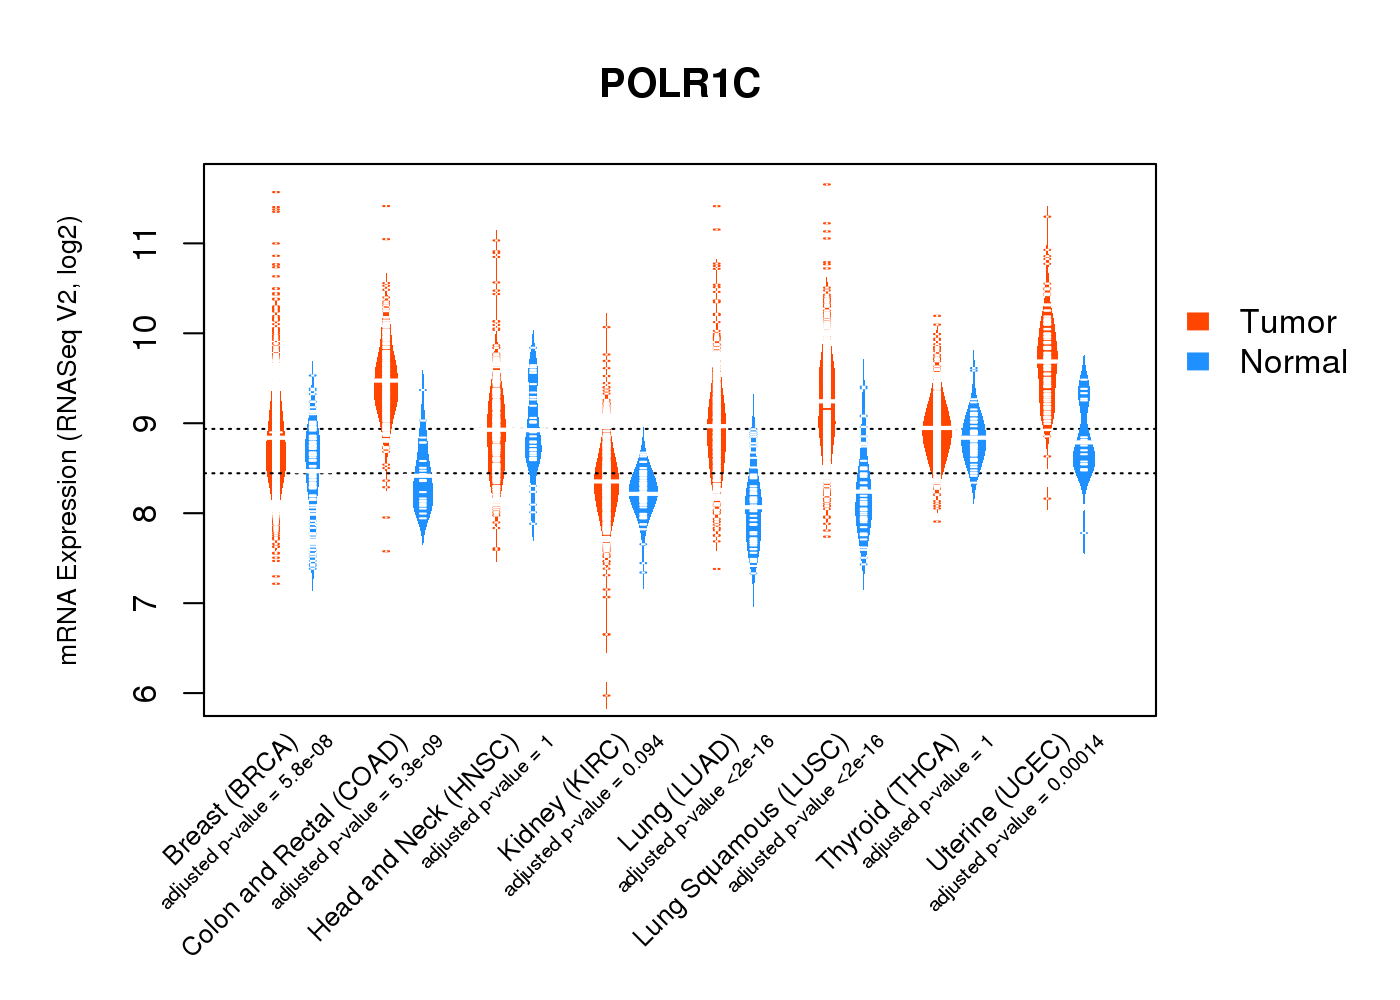 |
| Top |
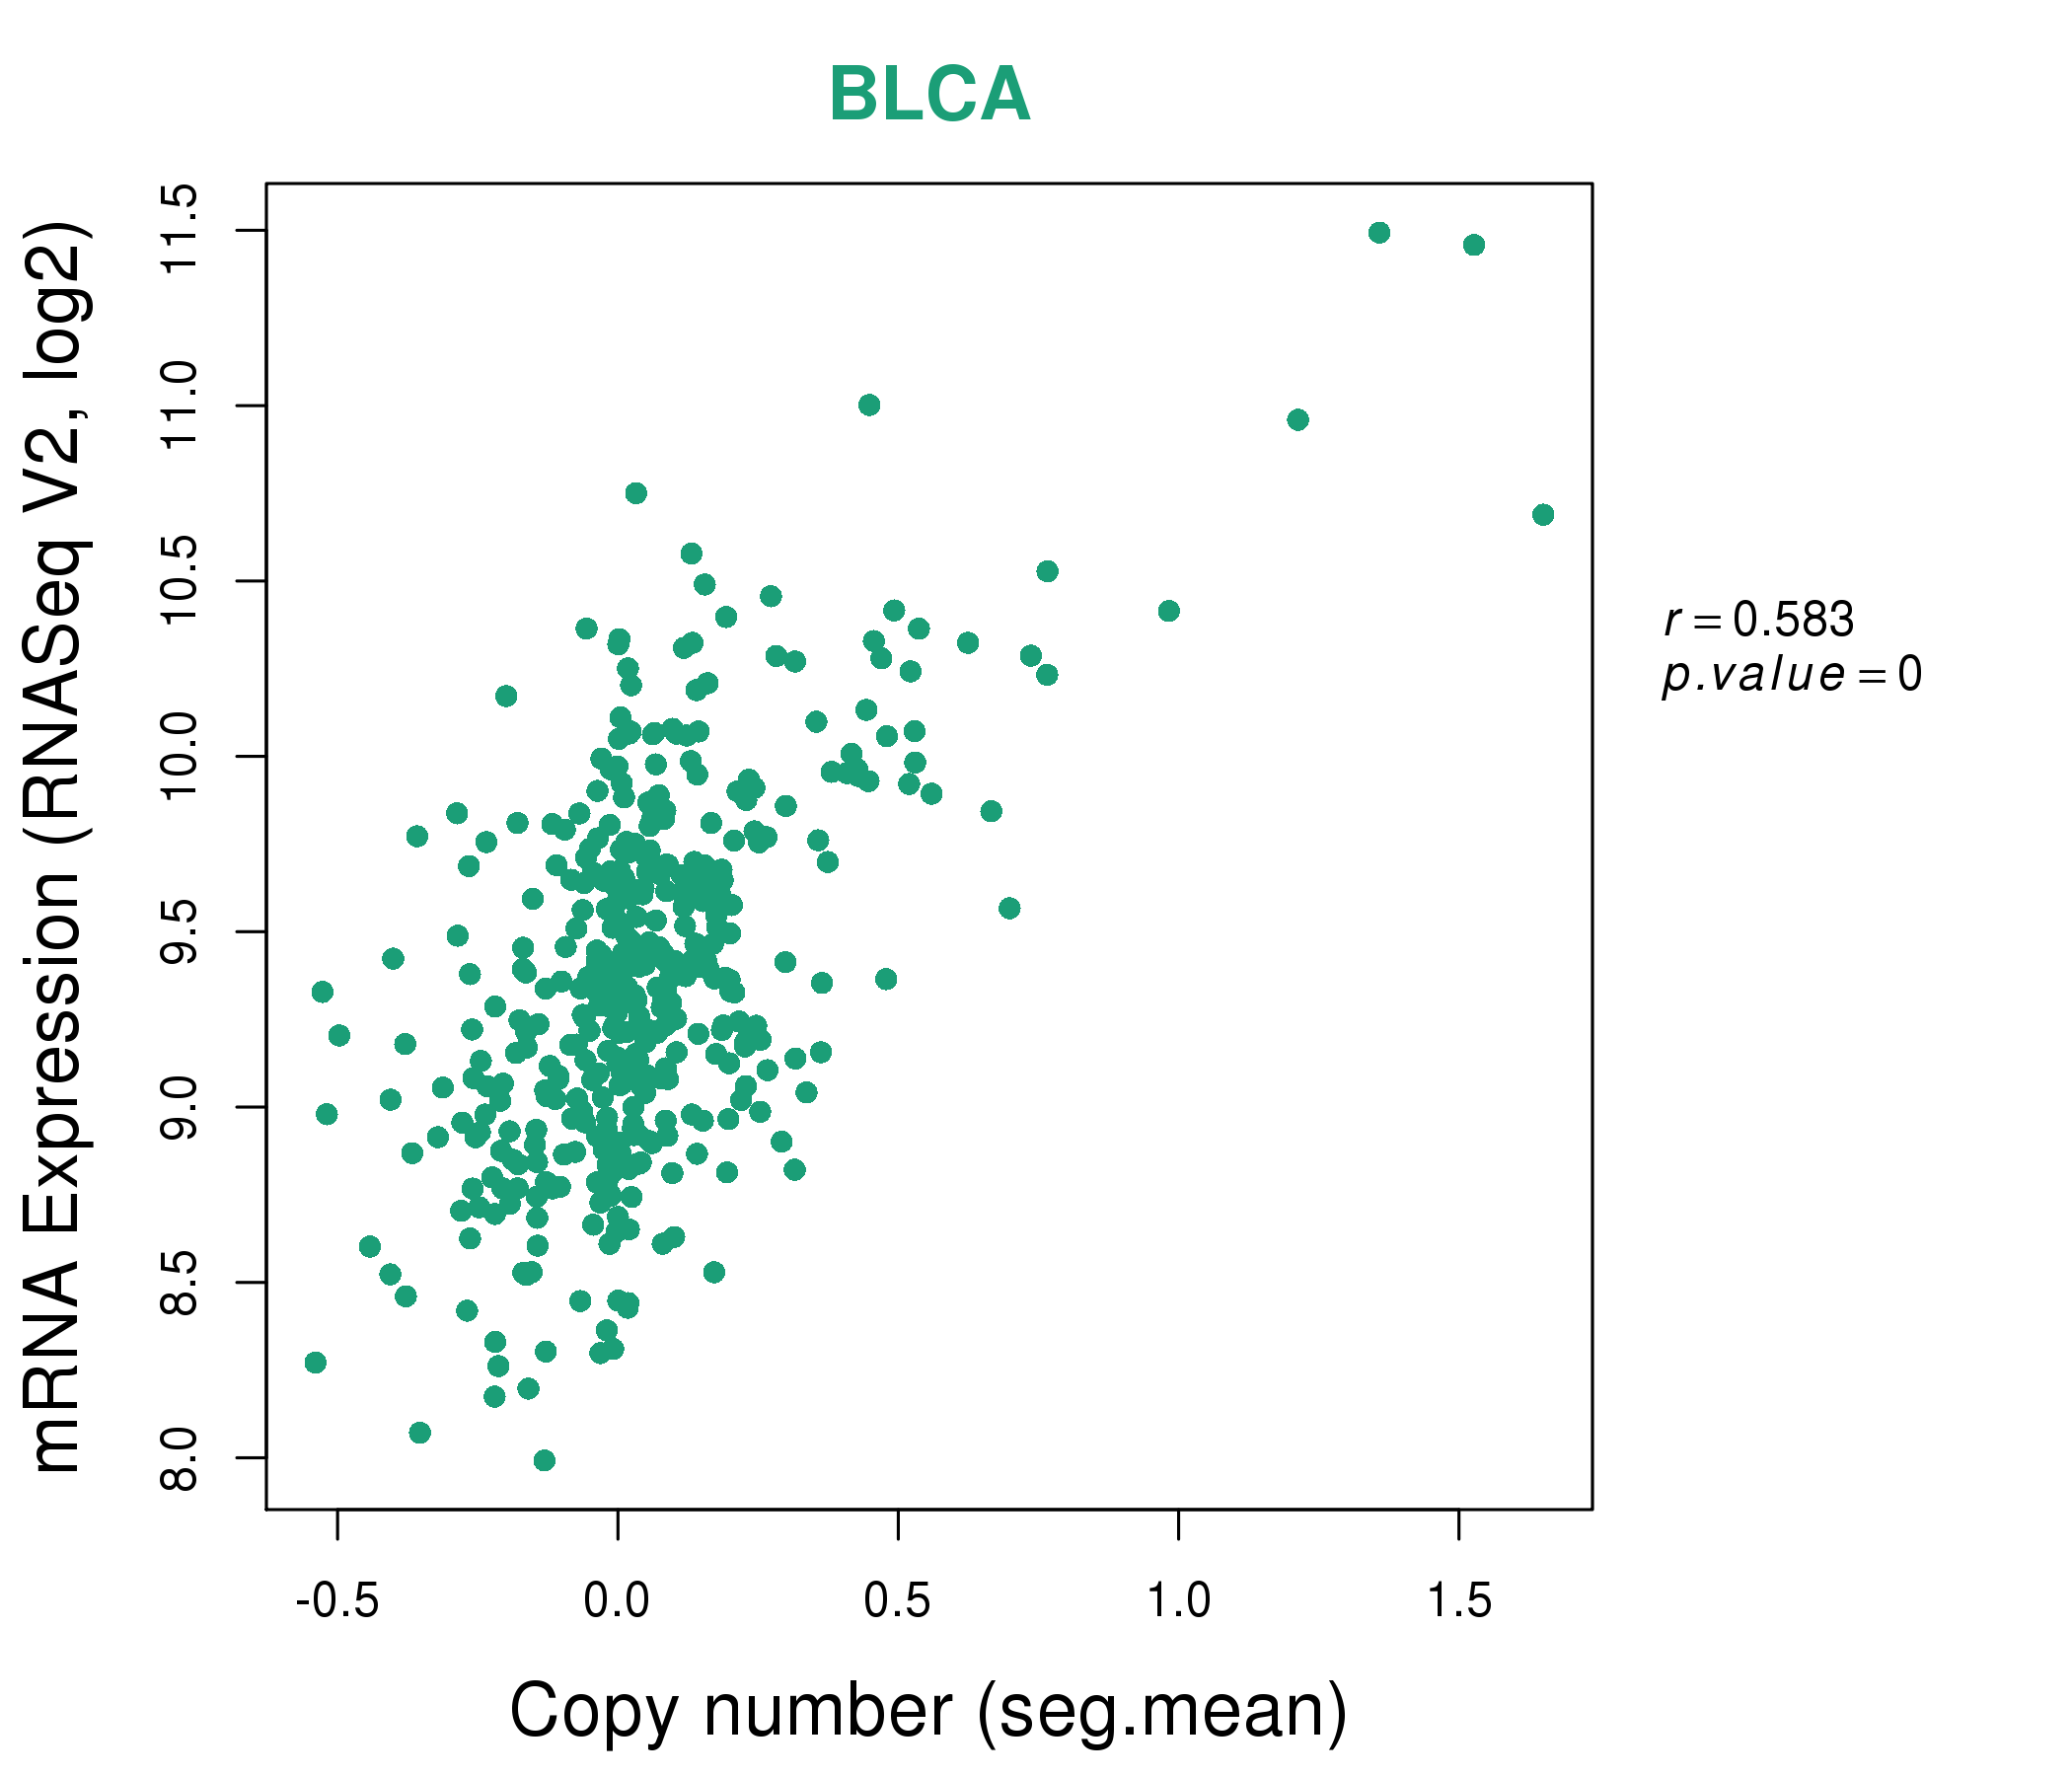
| * This plots show the correlation between CNV and gene expression. |
: Open all plots for all cancer types
 |
|
 |
|
| Top |
| Gene-Gene Network Information |
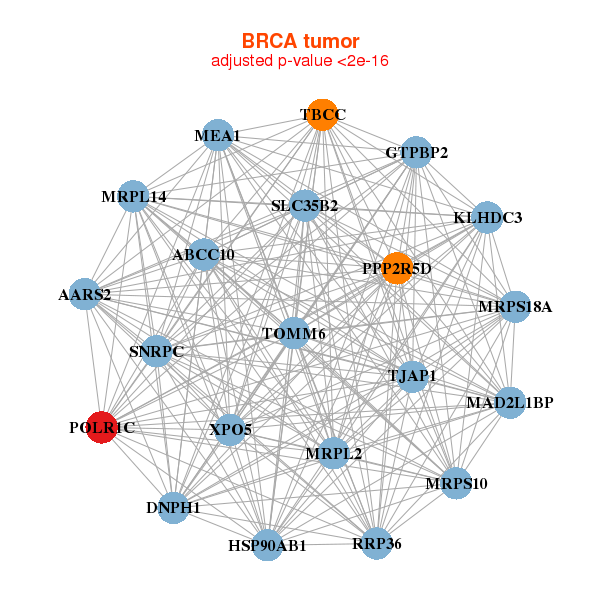
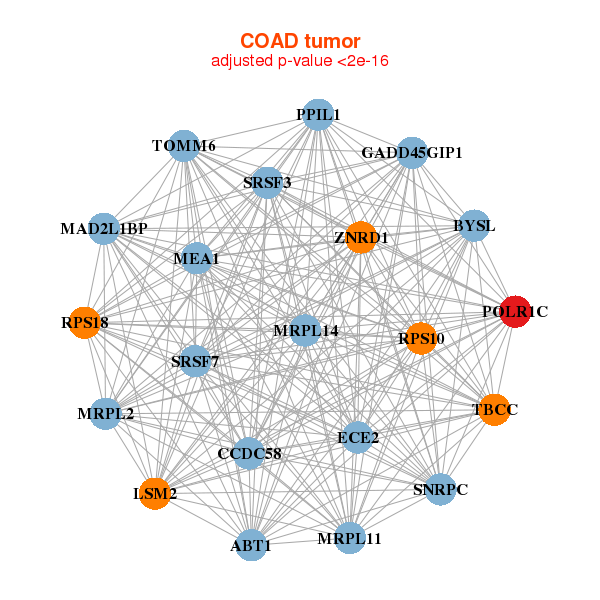
| * Co-Expression network figures were drawn using R package igraph. Only the top 20 genes with the highest correlations were shown. Red circle: input gene, orange circle: cell metabolism gene, sky circle: other gene |
: Open all plots for all cancer types
 |
|
| AARS2,ABCC10,DNPH1,RRP36,GTPBP2,HSP90AB1,KLHDC3, MAD2L1BP,MEA1,MRPL14,MRPL2,MRPS10,MRPS18A,POLR1C, PPP2R5D,SLC35B2,SNRPC,TBCC,TJAP1,TOMM6,XPO5 | ALKBH2,DKC1,DTNB,EIF3D,ELMO3,FBL,H2AFY2, IMPDH2,KRTCAP3,LAD1,MRTO4,NPM3,POLR1C,PPAP2C, PRSS8,RAB25,RPL3,RTKN,TOMM34,TP53,TRIM27 |
 |
|
| ABT1,BYSL,CCDC58,ECE2,GADD45GIP1,LSM2,MAD2L1BP, MEA1,MRPL11,MRPL14,MRPL2,POLR1C,PPIL1,RPS10, RPS18,SRSF3,SRSF7,SNRPC,TBCC,TOMM6,ZNRD1 | BNIP1,BOLA3,CCT2,DCAF13,ENOPH1,GNL3,MRPL3, MRTO4,NHP2,NHP2L1,NME2,NR2C2AP,NUP37,PAK1IP1, PDCD2,POLR1C,POLR2D,PTRH2,SNRNP40,SRPRB,TOMM6 |

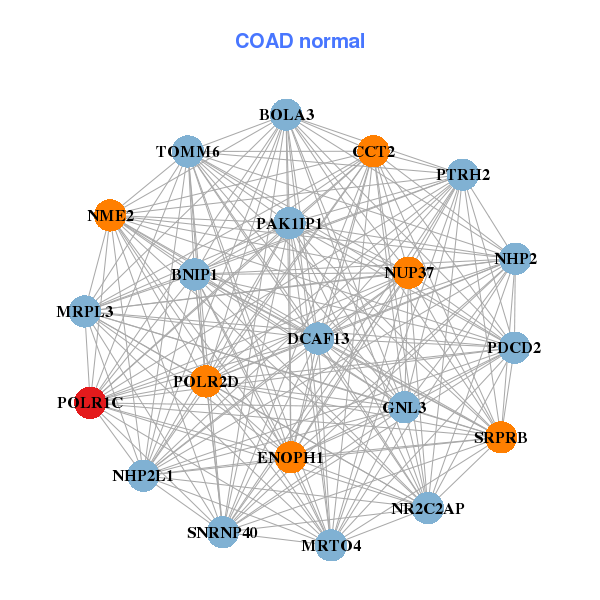
| * Co-Expression network figures were drawn using R package igraph. Only the top 20 genes with the highest correlations were shown. Red circle: input gene, orange circle: cell metabolism gene, sky circle: other gene |
: Open all plots for all cancer types
| Top |
: Open all interacting genes' information including KEGG pathway for all interacting genes from DAVID
| Top |
| Pharmacological Information for POLR1C |
| There's no related Drug. |
| Top |
| Cross referenced IDs for POLR1C |
| * We obtained these cross-references from Uniprot database. It covers 150 different DBs, 18 categories. http://www.uniprot.org/help/cross_references_section |
: Open all cross reference information
|
Copyright © 2016-Present - The Univsersity of Texas Health Science Center at Houston @ |