|
||||||||||||||||||||||||||||||||||||||||||||||||||||||||||||||||||||||||||||||||||||||||||||||||||||||||||||||||||||||||||||||||||||||||||||||||||||||||||||||||||||||||||||||||||||||||||||||||||||||||||||||||||||||||||||||||||||||||||||||||||||||||||||||||||||||||||||||||||||||||||||||||||||||||||||||||||||||||||||||||||||||||||||||||||||||||||||
| |
| Phenotypic Information (metabolism pathway, cancer, disease, phenome) |
| |
| |
| Gene-Gene Network Information: Co-Expression Network, Interacting Genes & KEGG |
| |
|


| Gene Summary for PTGES |
| Basic gene info. | Gene symbol | PTGES |
| Gene name | prostaglandin E synthase | |
| Synonyms | MGST-IV|MGST1-L1|MGST1L1|MPGES|PGES|PIG12|PP102|PP1294|TP53I12|mPGES-1 | |
| Cytomap | UCSC genome browser: 9q34.3 | |
| Genomic location | chr9 :132500614-132515344 | |
| Type of gene | protein-coding | |
| RefGenes | NM_004878.4, NM_198797.1, | |
| Ensembl id | ENSG00000148344 | |
| Description | MGST1-like 1glutathione S-transferase 1-like 1microsomal glutathione S-transferase 1-like 1microsomal prostaglandin E synthase 1microsomal prostaglandin E synthase-1p53-induced apoptosis protein 12p53-induced gene 12 proteintumor protein p53 induci | |
| Modification date | 20141207 | |
| dbXrefs | MIM : 605172 | |
| HGNC : HGNC | ||
| Ensembl : ENSG00000148344 | ||
| HPRD : 05528 | ||
| Vega : OTTHUMG00000020791 | ||
| Protein | UniProt: O14684 go to UniProt's Cross Reference DB Table | |
| Expression | CleanEX: HS_PTGES | |
| BioGPS: 9536 | ||
| Gene Expression Atlas: ENSG00000148344 | ||
| The Human Protein Atlas: ENSG00000148344 | ||
| Pathway | NCI Pathway Interaction Database: PTGES | |
| KEGG: PTGES | ||
| REACTOME: PTGES | ||
| ConsensusPathDB | ||
| Pathway Commons: PTGES | ||
| Metabolism | MetaCyc: PTGES | |
| HUMANCyc: PTGES | ||
| Regulation | Ensembl's Regulation: ENSG00000148344 | |
| miRBase: chr9 :132,500,614-132,515,344 | ||
| TargetScan: NM_004878 | ||
| cisRED: ENSG00000148344 | ||
| Context | iHOP: PTGES | |
| cancer metabolism search in PubMed: PTGES | ||
| UCL Cancer Institute: PTGES | ||
| Assigned class in ccmGDB | B - This gene belongs to cancer gene. | |
| Top |
| Phenotypic Information for PTGES(metabolism pathway, cancer, disease, phenome) |
| Cancer | CGAP: PTGES |
| Familial Cancer Database: PTGES | |
| * This gene is included in those cancer gene databases. |
|
|
|
|
|
|
| ||||||||||||||||||||||||||||||||||||||||||||||||||||||||||||||||||||||||||||||||||||||||||||||||||||||||||||||||||||||||||||||||||||||||||||||||||||||||||||||||||||||||||||||||||||||||||||||||||||||||||||||||||||||||||||||||||||||||||||||||||||||||||||||||||||||||||||||||||||||||||||||||||||||||||||||||||||||||||||||||||||||||||||||||||||||
Oncogene 1 | Significant driver gene in | |||||||||||||||||||||||||||||||||||||||||||||||||||||||||||||||||||||||||||||||||||||||||||||||||||||||||||||||||||||||||||||||||||||||||||||||||||||||||||||||||||||||||||||||||||||||||||||||||||||||||||||||||||||||||||||||||||||||||||||||||||||||||||||||||||||||||||||||||||||||||||||||||||||||||||||||||||||||||||||||||||||||||||||||||||||||||||
| cf) number; DB name 1 Oncogene; http://nar.oxfordjournals.org/content/35/suppl_1/D721.long, 2 Tumor Suppressor gene; https://bioinfo.uth.edu/TSGene/, 3 Cancer Gene Census; http://www.nature.com/nrc/journal/v4/n3/abs/nrc1299.html, 4 CancerGenes; http://nar.oxfordjournals.org/content/35/suppl_1/D721.long, 5 Network of Cancer Gene; http://ncg.kcl.ac.uk/index.php, 1Therapeutic Vulnerabilities in Cancer; http://cbio.mskcc.org/cancergenomics/statius/ |
| KEGG_ARACHIDONIC_ACID_METABOLISM | |
| OMIM | 605172; gene. |
| Orphanet | |
| Disease | KEGG Disease: PTGES |
| MedGen: PTGES (Human Medical Genetics with Condition) | |
| ClinVar: PTGES | |
| Phenotype | MGI: PTGES (International Mouse Phenotyping Consortium) |
| PhenomicDB: PTGES | |
| Mutations for PTGES |
| * Under tables are showing count per each tissue to give us broad intuition about tissue specific mutation patterns.You can go to the detailed page for each mutation database's web site. |
| - Statistics for Tissue and Mutation type | Top |
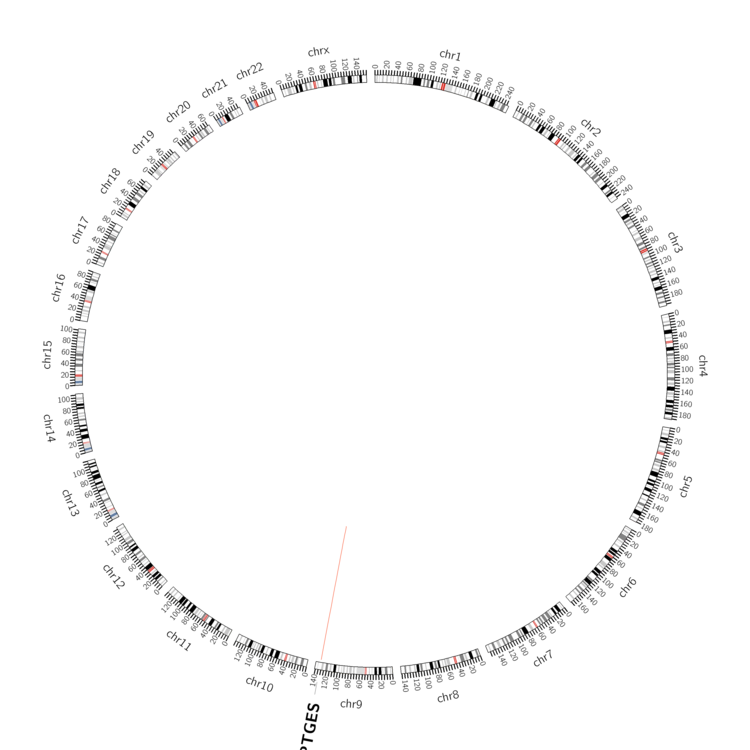 |
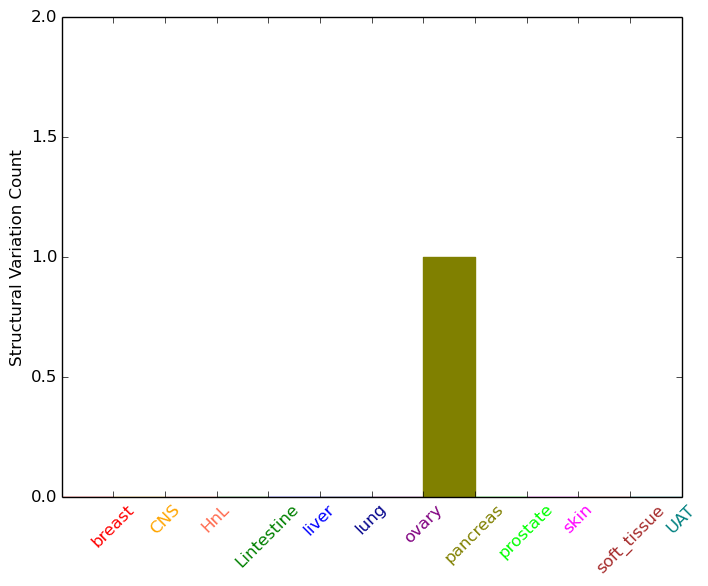
| - For Inter-chromosomal Variations |
| There's no inter-chromosomal structural variation. |
| - For Intra-chromosomal Variations |
| * Intra-chromosomal variantions includes 'intrachromosomal amplicon to amplicon', 'intrachromosomal amplicon to non-amplified dna', 'intrachromosomal deletion', 'intrachromosomal fold-back inversion', 'intrachromosomal inversion', 'intrachromosomal tandem duplication', 'Intrachromosomal unknown type', 'intrachromosomal with inverted orientation', 'intrachromosomal with non-inverted orientation'. |
 |
| Sample | Symbol_a | Chr_a | Start_a | End_a | Symbol_b | Chr_b | Start_b | End_b |
| pancreas | PTGES | chr9 | 132501490 | 132501510 | PTGES | chr9 | 132503537 | 132503557 |
| cf) Tissue number; Tissue name (1;Breast, 2;Central_nervous_system, 3;Haematopoietic_and_lymphoid_tissue, 4;Large_intestine, 5;Liver, 6;Lung, 7;Ovary, 8;Pancreas, 9;Prostate, 10;Skin, 11;Soft_tissue, 12;Upper_aerodigestive_tract) |
| * From mRNA Sanger sequences, Chitars2.0 arranged chimeric transcripts. This table shows PTGES related fusion information. |
| ID | Head Gene | Tail Gene | Accession | Gene_a | qStart_a | qEnd_a | Chromosome_a | tStart_a | tEnd_a | Gene_a | qStart_a | qEnd_a | Chromosome_a | tStart_a | tEnd_a |
| BM797058 | IVD | 1 | 103 | 15 | 40711358 | 40711460 | PTGES | 99 | 434 | 9 | 132500840 | 132501175 | |
| T03380 | PTGES | 1 | 70 | 9 | 132500629 | 132500698 | SOX2-OT | 67 | 376 | 3 | 181457795 | 181458101 | |
| Top |
| Mutation type/ Tissue ID | brca | cns | cerv | endome | haematopo | kidn | Lintest | liver | lung | ns | ovary | pancre | prost | skin | stoma | thyro | urina | |||
| Total # sample | 1 | |||||||||||||||||||
| GAIN (# sample) | 1 | |||||||||||||||||||
| LOSS (# sample) |
| cf) Tissue ID; Tissue type (1; Breast, 2; Central_nervous_system, 3; Cervix, 4; Endometrium, 5; Haematopoietic_and_lymphoid_tissue, 6; Kidney, 7; Large_intestine, 8; Liver, 9; Lung, 10; NS, 11; Ovary, 12; Pancreas, 13; Prostate, 14; Skin, 15; Stomach, 16; Thyroid, 17; Urinary_tract) |
| Top |
|
 |
| Top |
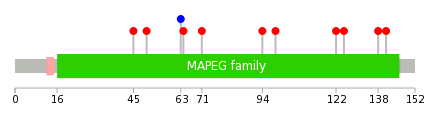
| Stat. for Non-Synonymous SNVs (# total SNVs=7) | (# total SNVs=0) |
 | |
(# total SNVs=0) | (# total SNVs=0) |
| Top |
| * When you move the cursor on each content, you can see more deailed mutation information on the Tooltip. Those are primary_site,primary_histology,mutation(aa),pubmedID. |
| GRCh37 position | Mutation(aa) | Unique sampleID count |
| chr9:132501928-132501928 | p.A141P | 1 |
| chr9:132501937-132501937 | p.A138T | 1 |
| chr9:132501975-132501975 | p.I125T | 1 |
| chr9:132501984-132501984 | p.R122Q | 1 |
| chr9:132502053-132502053 | p.A99V | 1 |
| chr9:132502069-132502069 | p.P94T | 1 |
| chr9:132502137-132502137 | p.A71V | 1 |
| chr9:132510953-132510953 | p.D64H | 1 |
| chr9:132510954-132510954 | p.P63P | 1 |
| chr9:132510994-132510994 | p.A50V | 1 |
| Top |
|
 |
| Point Mutation/ Tissue ID | 1 | 2 | 3 | 4 | 5 | 6 | 7 | 8 | 9 | 10 | 11 | 12 | 13 | 14 | 15 | 16 | 17 | 18 | 19 | 20 |
| # sample | 1 | 1 | 1 | 1 | 1 | 2 | ||||||||||||||
| # mutation | 1 | 1 | 1 | 1 | 1 | 2 | ||||||||||||||
| nonsynonymous SNV | 1 | 1 | 1 | 1 | 2 | |||||||||||||||
| synonymous SNV | 1 |
| cf) Tissue ID; Tissue type (1; BLCA[Bladder Urothelial Carcinoma], 2; BRCA[Breast invasive carcinoma], 3; CESC[Cervical squamous cell carcinoma and endocervical adenocarcinoma], 4; COAD[Colon adenocarcinoma], 5; GBM[Glioblastoma multiforme], 6; Glioma Low Grade, 7; HNSC[Head and Neck squamous cell carcinoma], 8; KICH[Kidney Chromophobe], 9; KIRC[Kidney renal clear cell carcinoma], 10; KIRP[Kidney renal papillary cell carcinoma], 11; LAML[Acute Myeloid Leukemia], 12; LUAD[Lung adenocarcinoma], 13; LUSC[Lung squamous cell carcinoma], 14; OV[Ovarian serous cystadenocarcinoma ], 15; PAAD[Pancreatic adenocarcinoma], 16; PRAD[Prostate adenocarcinoma], 17; SKCM[Skin Cutaneous Melanoma], 18:STAD[Stomach adenocarcinoma], 19:THCA[Thyroid carcinoma], 20:UCEC[Uterine Corpus Endometrial Carcinoma]) |
| Top |
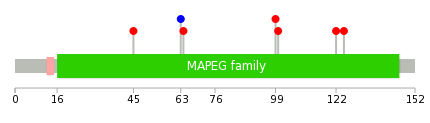
| * We represented just top 10 SNVs. When you move the cursor on each content, you can see more deailed mutation information on the Tooltip. Those are primary_site, primary_histology, mutation(aa), pubmedID. |
| Genomic Position | Mutation(aa) | Unique sampleID count |
| chr9:132501975 | p.I125T | 1 |
| chr9:132501984 | p.R122Q | 1 |
| chr9:132502051 | p.W100G | 1 |
| chr9:132502053 | p.A99V | 1 |
| chr9:132510953 | p.D64H | 1 |
| chr9:132510954 | p.P63P | 1 |
| chr9:132511009 | p.A45V | 1 |
| * Copy number data were extracted from TCGA using R package TCGA-Assembler. The URLs of all public data files on TCGA DCC data server were gathered on Jan-05-2015. Function ProcessCNAData in TCGA-Assembler package was used to obtain gene-level copy number value which is calculated as the average copy number of the genomic region of a gene. |
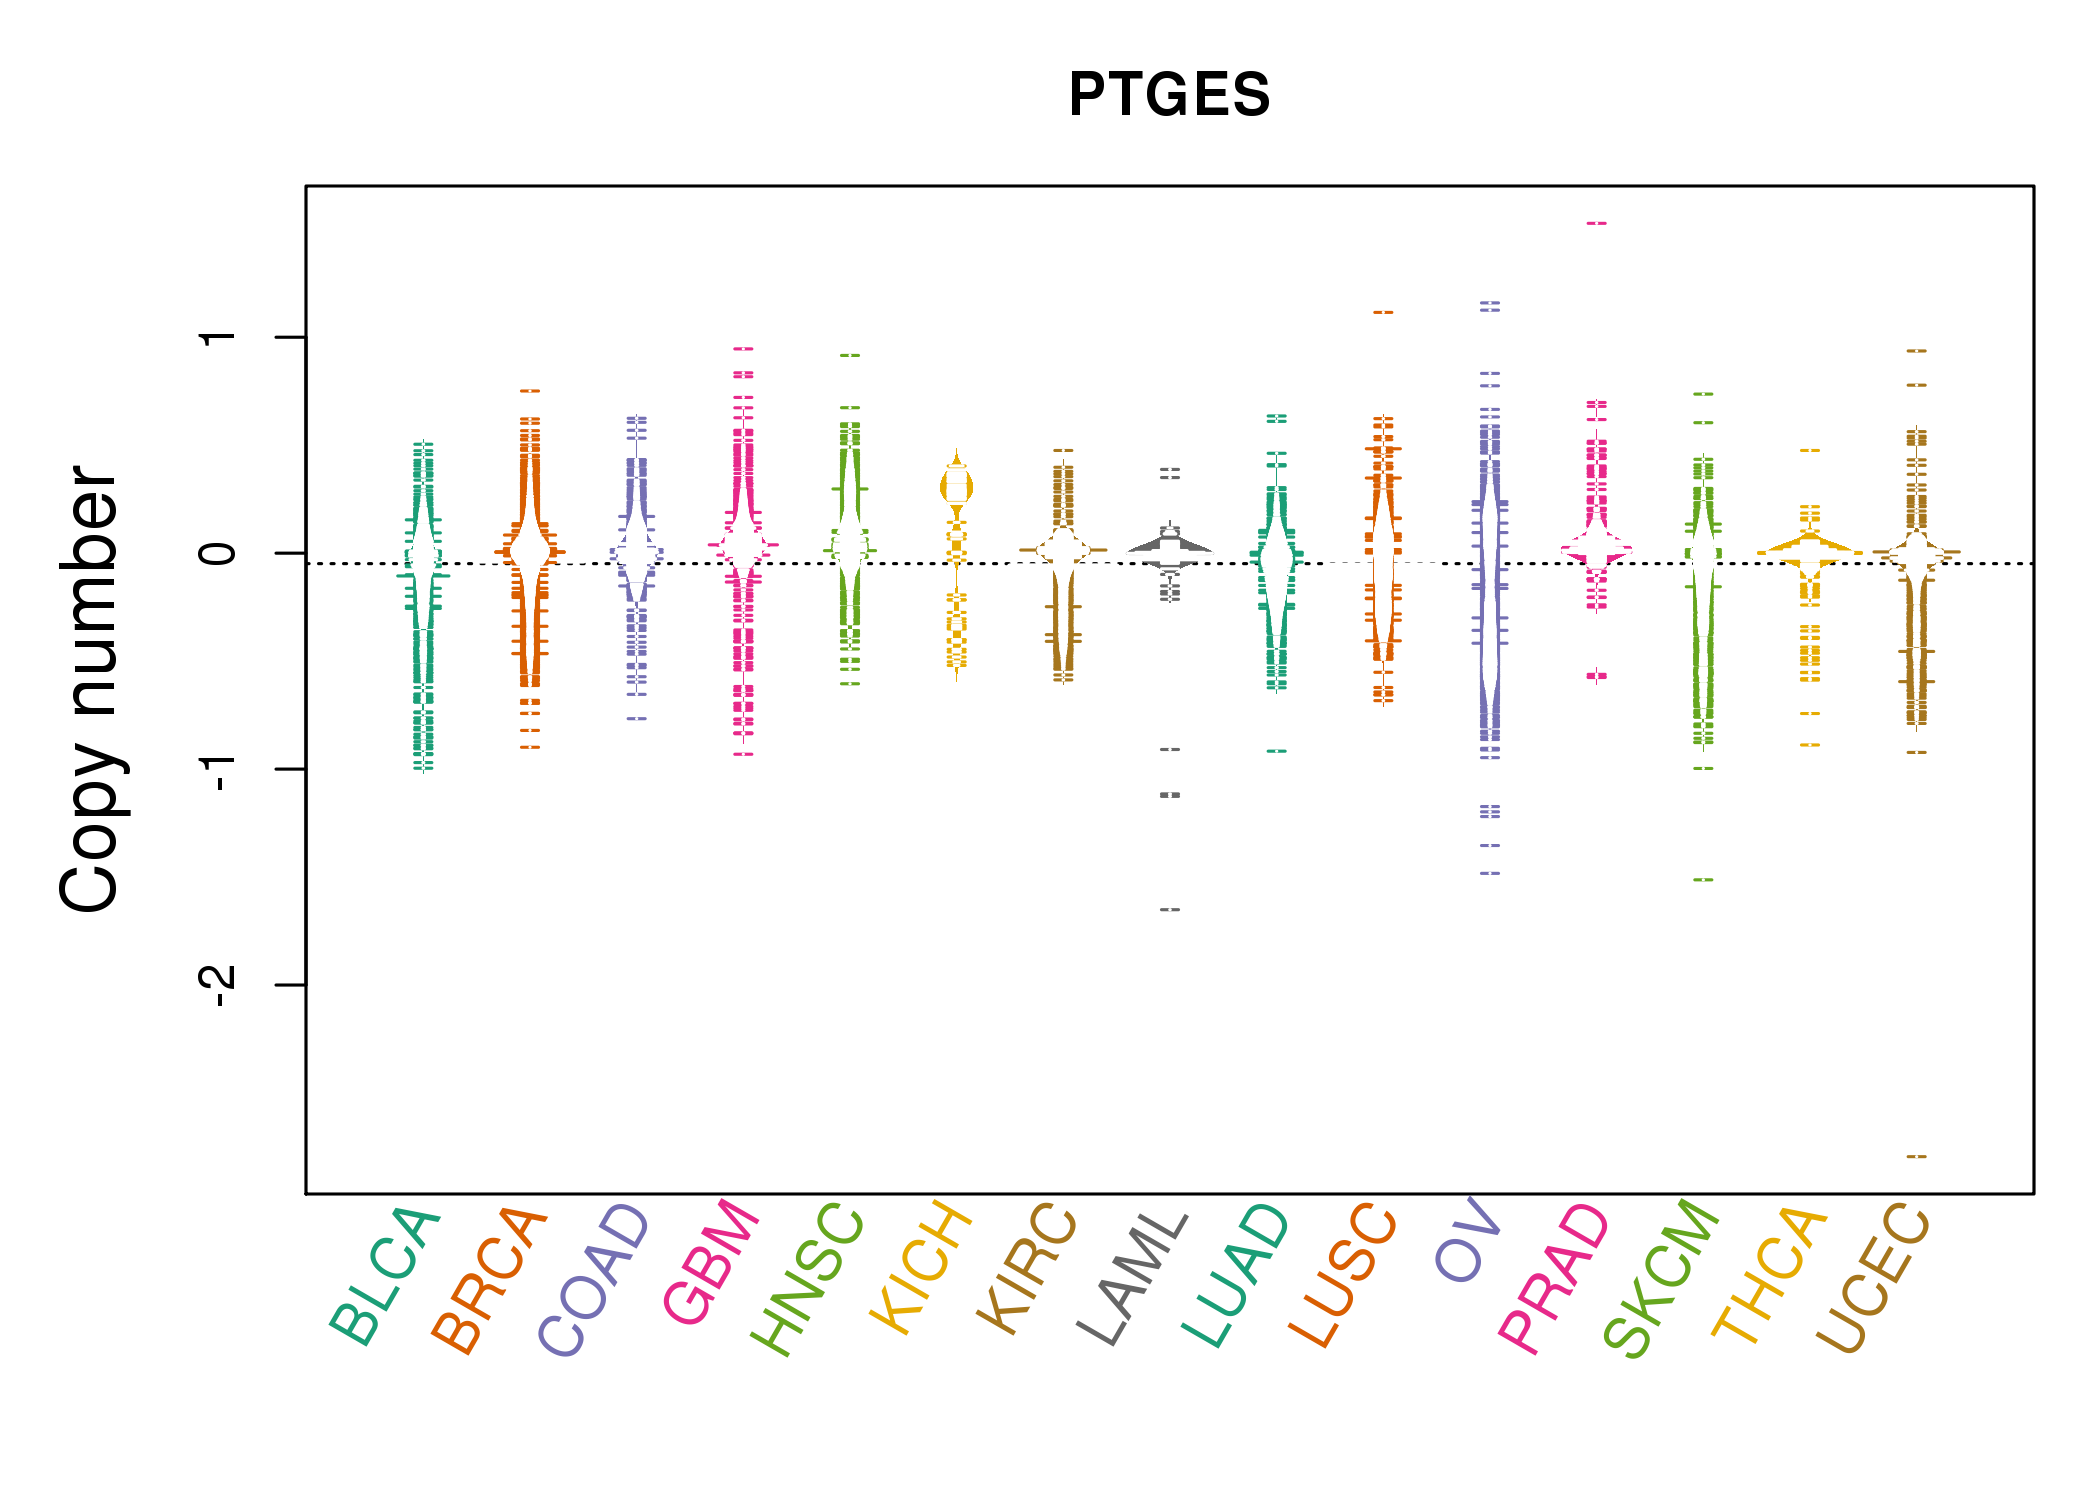 |
| cf) Tissue ID[Tissue type]: BLCA[Bladder Urothelial Carcinoma], BRCA[Breast invasive carcinoma], CESC[Cervical squamous cell carcinoma and endocervical adenocarcinoma], COAD[Colon adenocarcinoma], GBM[Glioblastoma multiforme], Glioma Low Grade, HNSC[Head and Neck squamous cell carcinoma], KICH[Kidney Chromophobe], KIRC[Kidney renal clear cell carcinoma], KIRP[Kidney renal papillary cell carcinoma], LAML[Acute Myeloid Leukemia], LUAD[Lung adenocarcinoma], LUSC[Lung squamous cell carcinoma], OV[Ovarian serous cystadenocarcinoma ], PAAD[Pancreatic adenocarcinoma], PRAD[Prostate adenocarcinoma], SKCM[Skin Cutaneous Melanoma], STAD[Stomach adenocarcinoma], THCA[Thyroid carcinoma], UCEC[Uterine Corpus Endometrial Carcinoma] |
| Top |
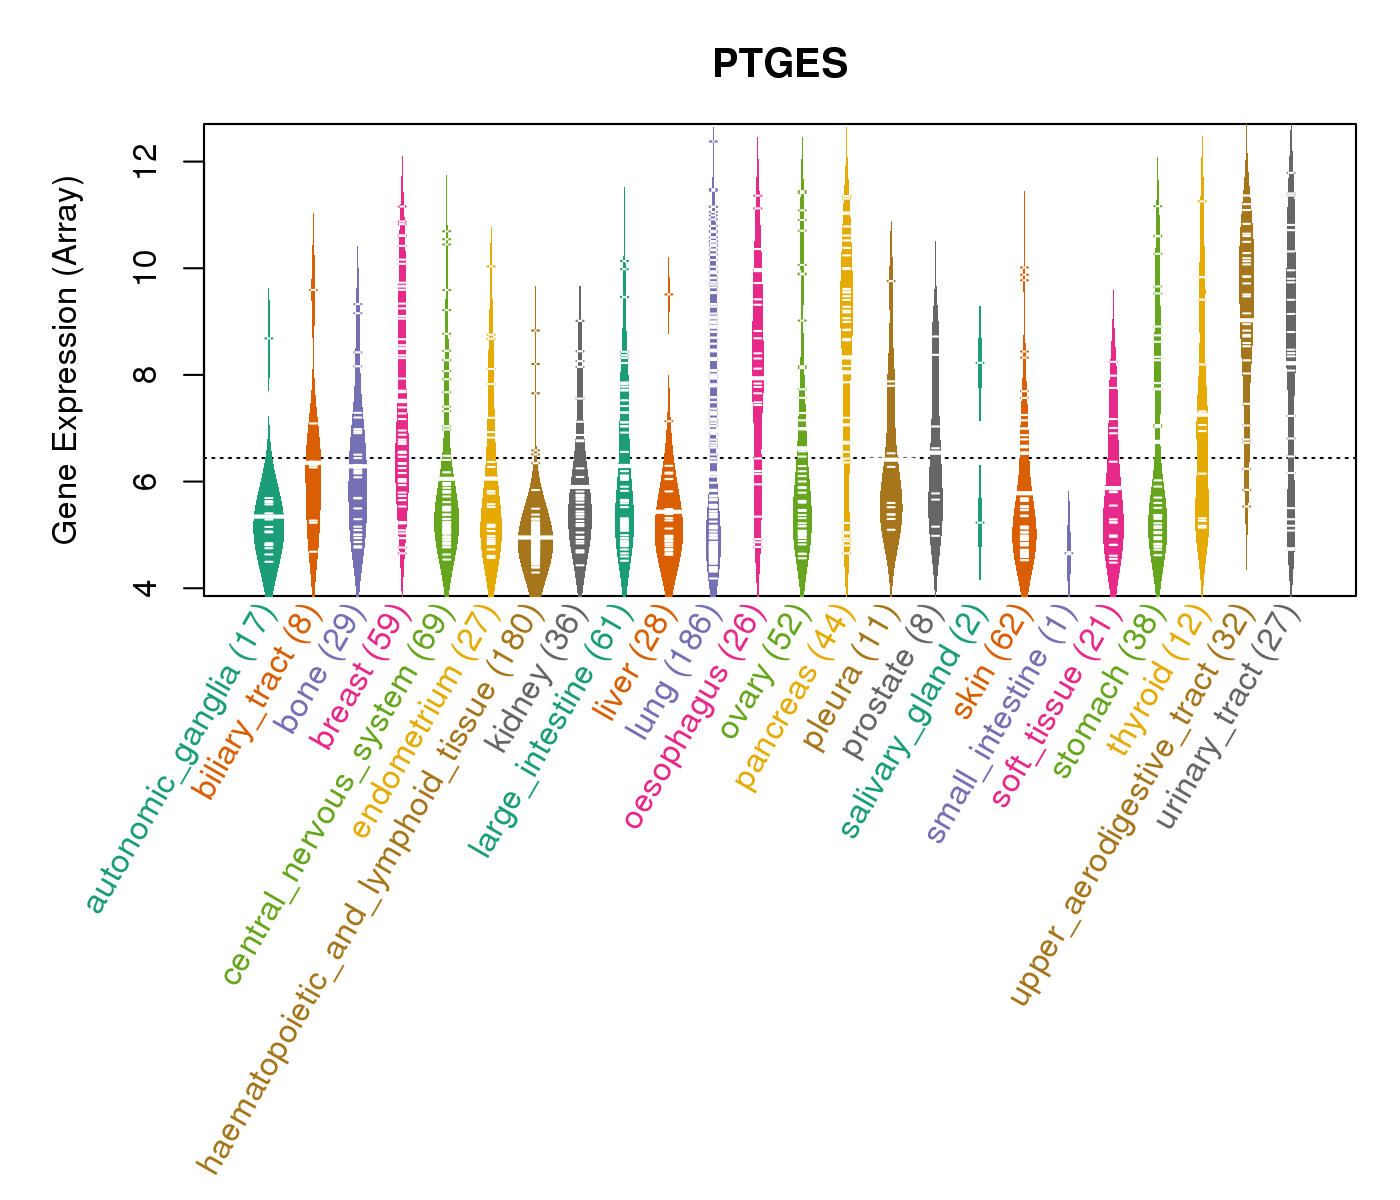
| Gene Expression for PTGES |
| * CCLE gene expression data were extracted from CCLE_Expression_Entrez_2012-10-18.res: Gene-centric RMA-normalized mRNA expression data. |
 |
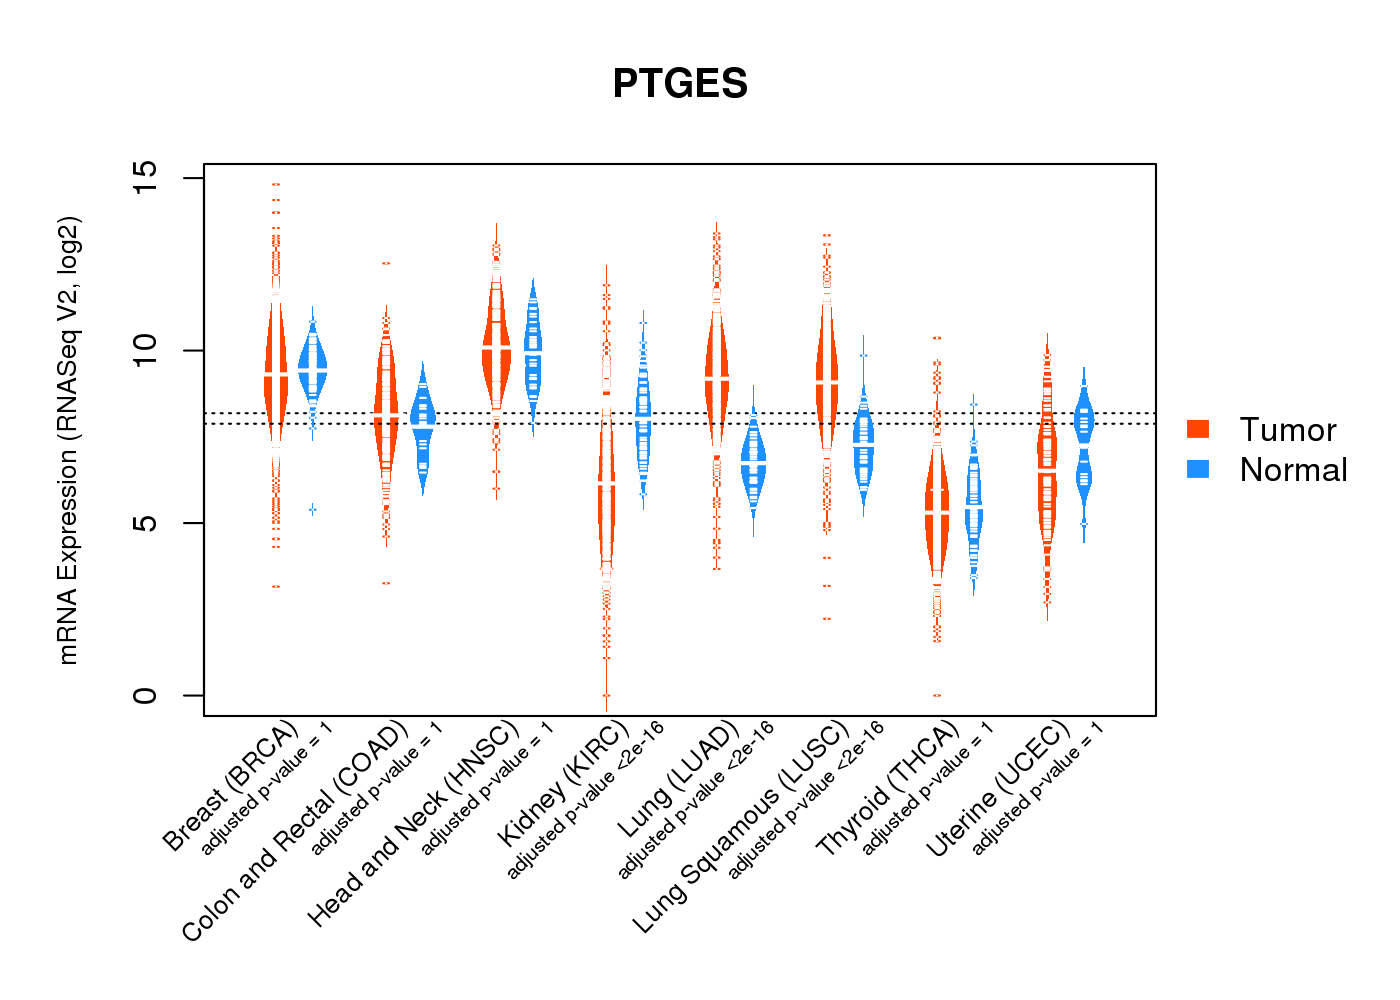
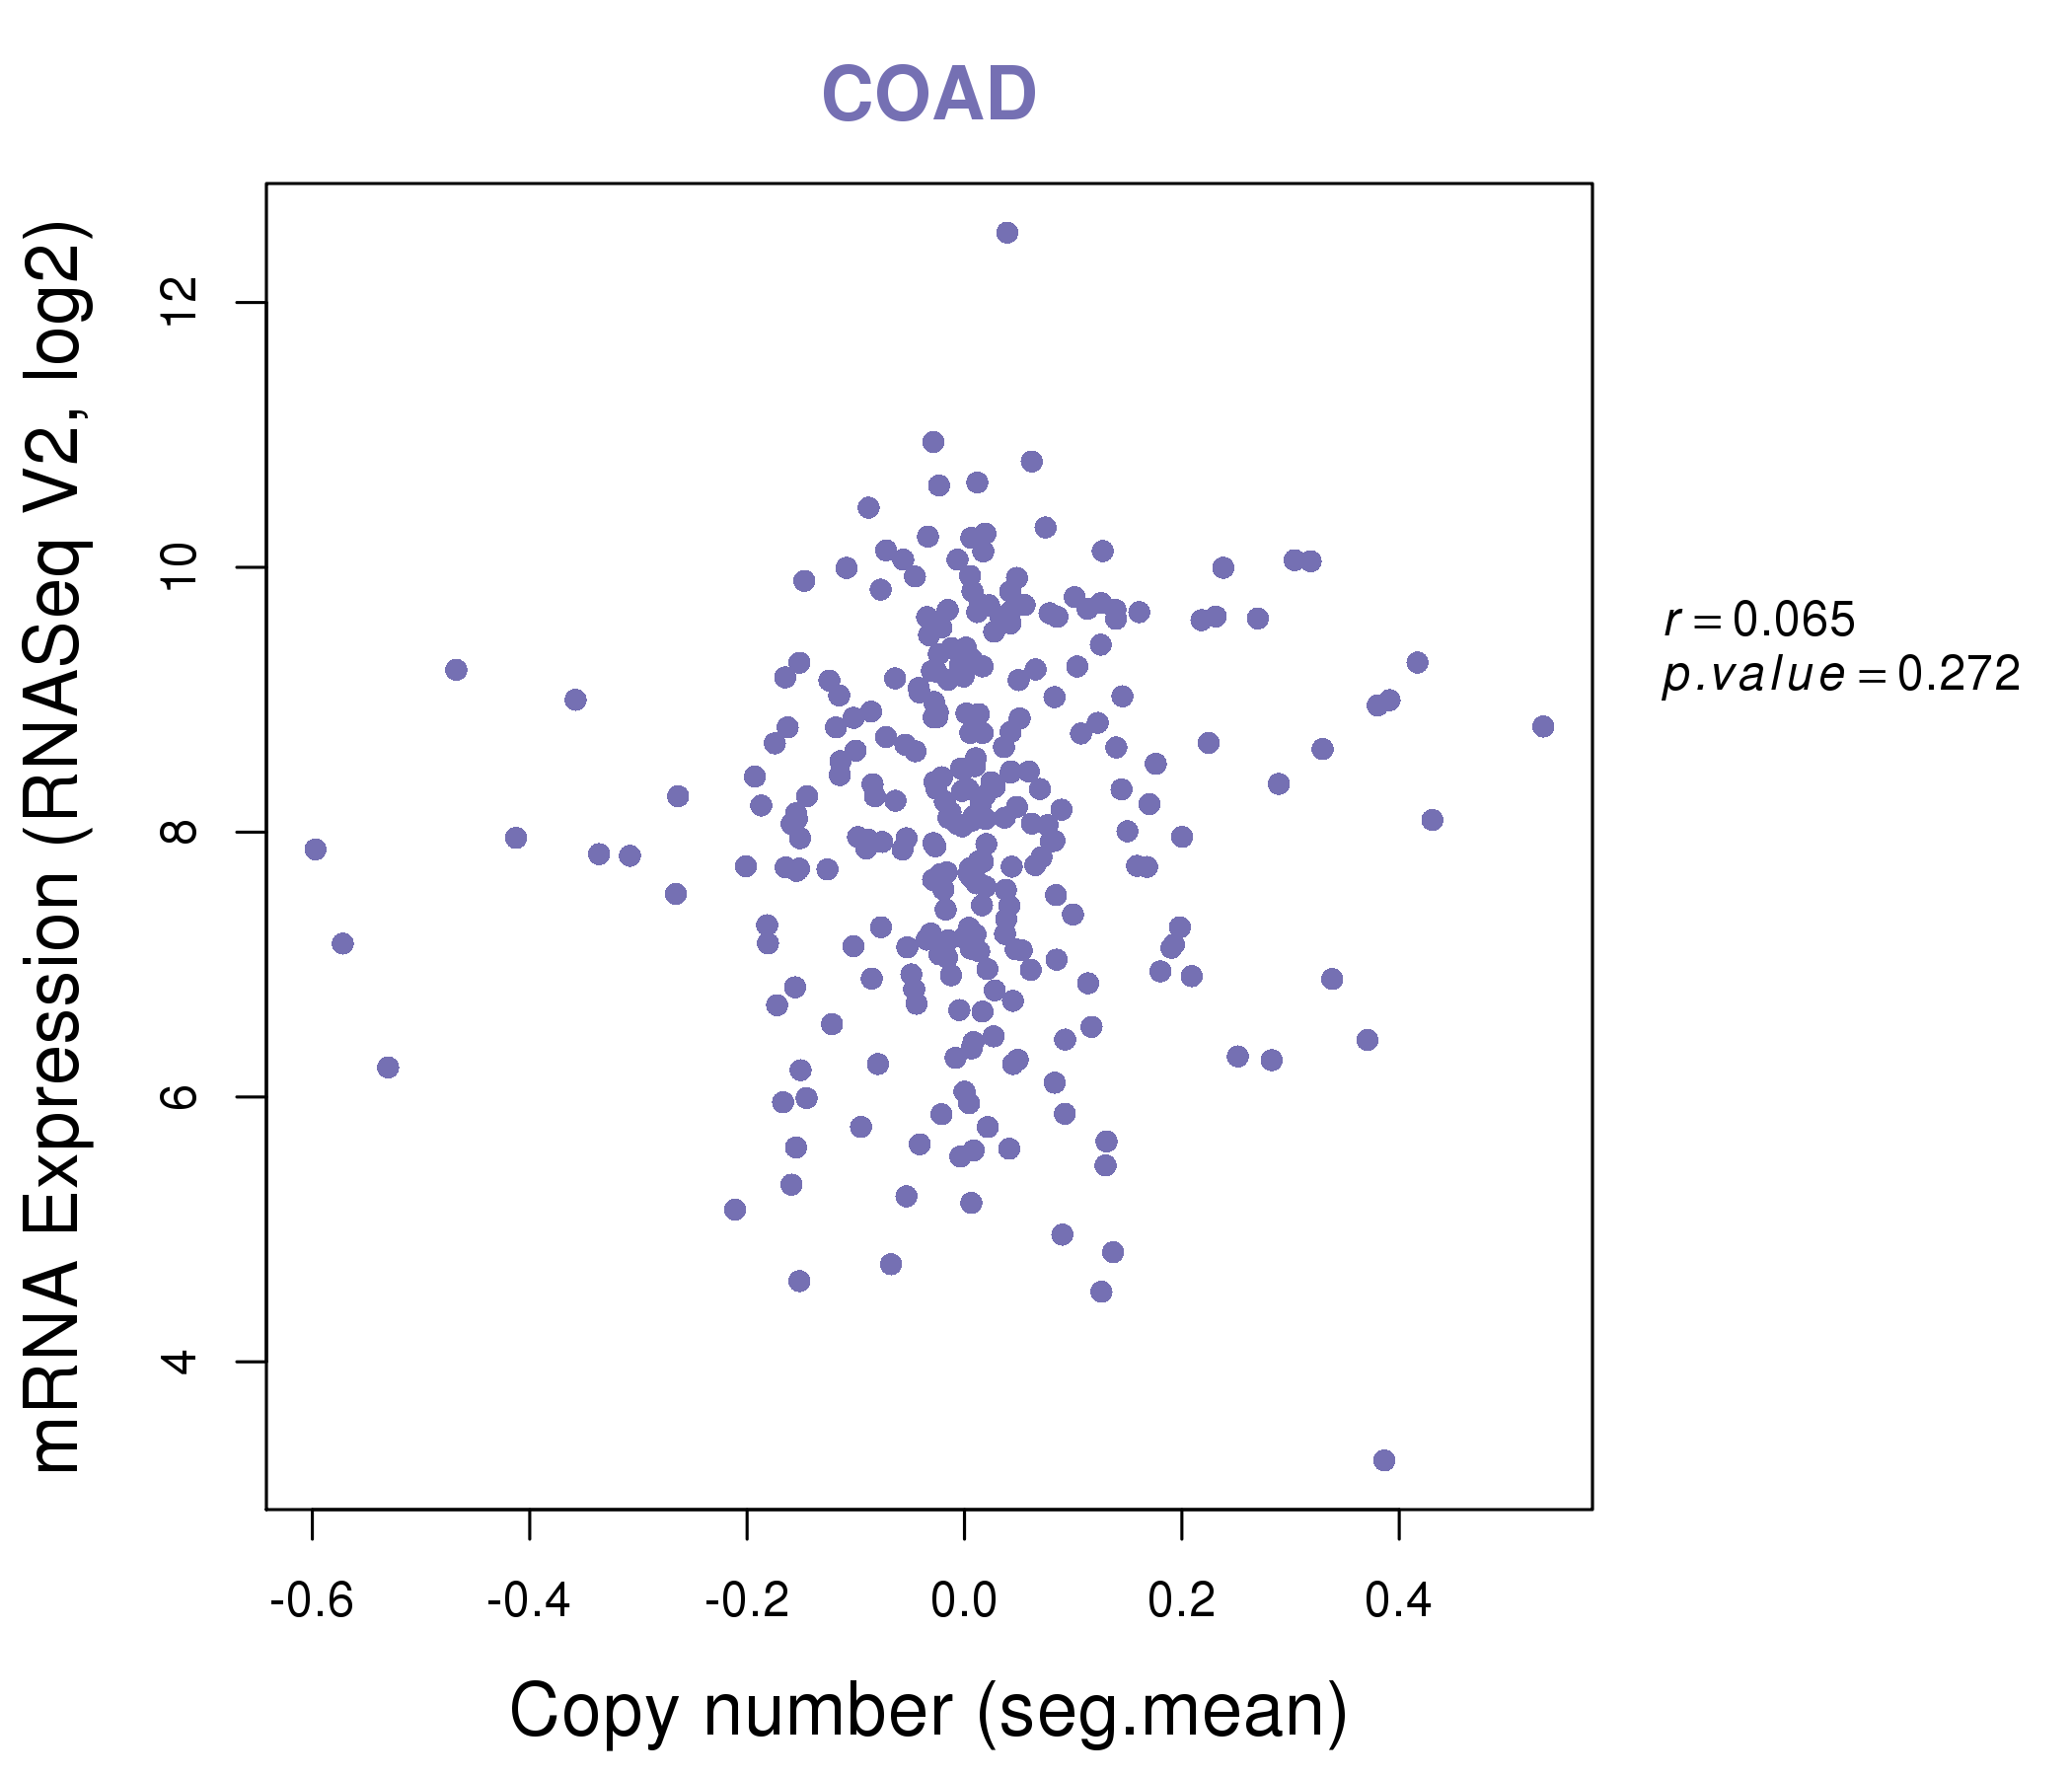
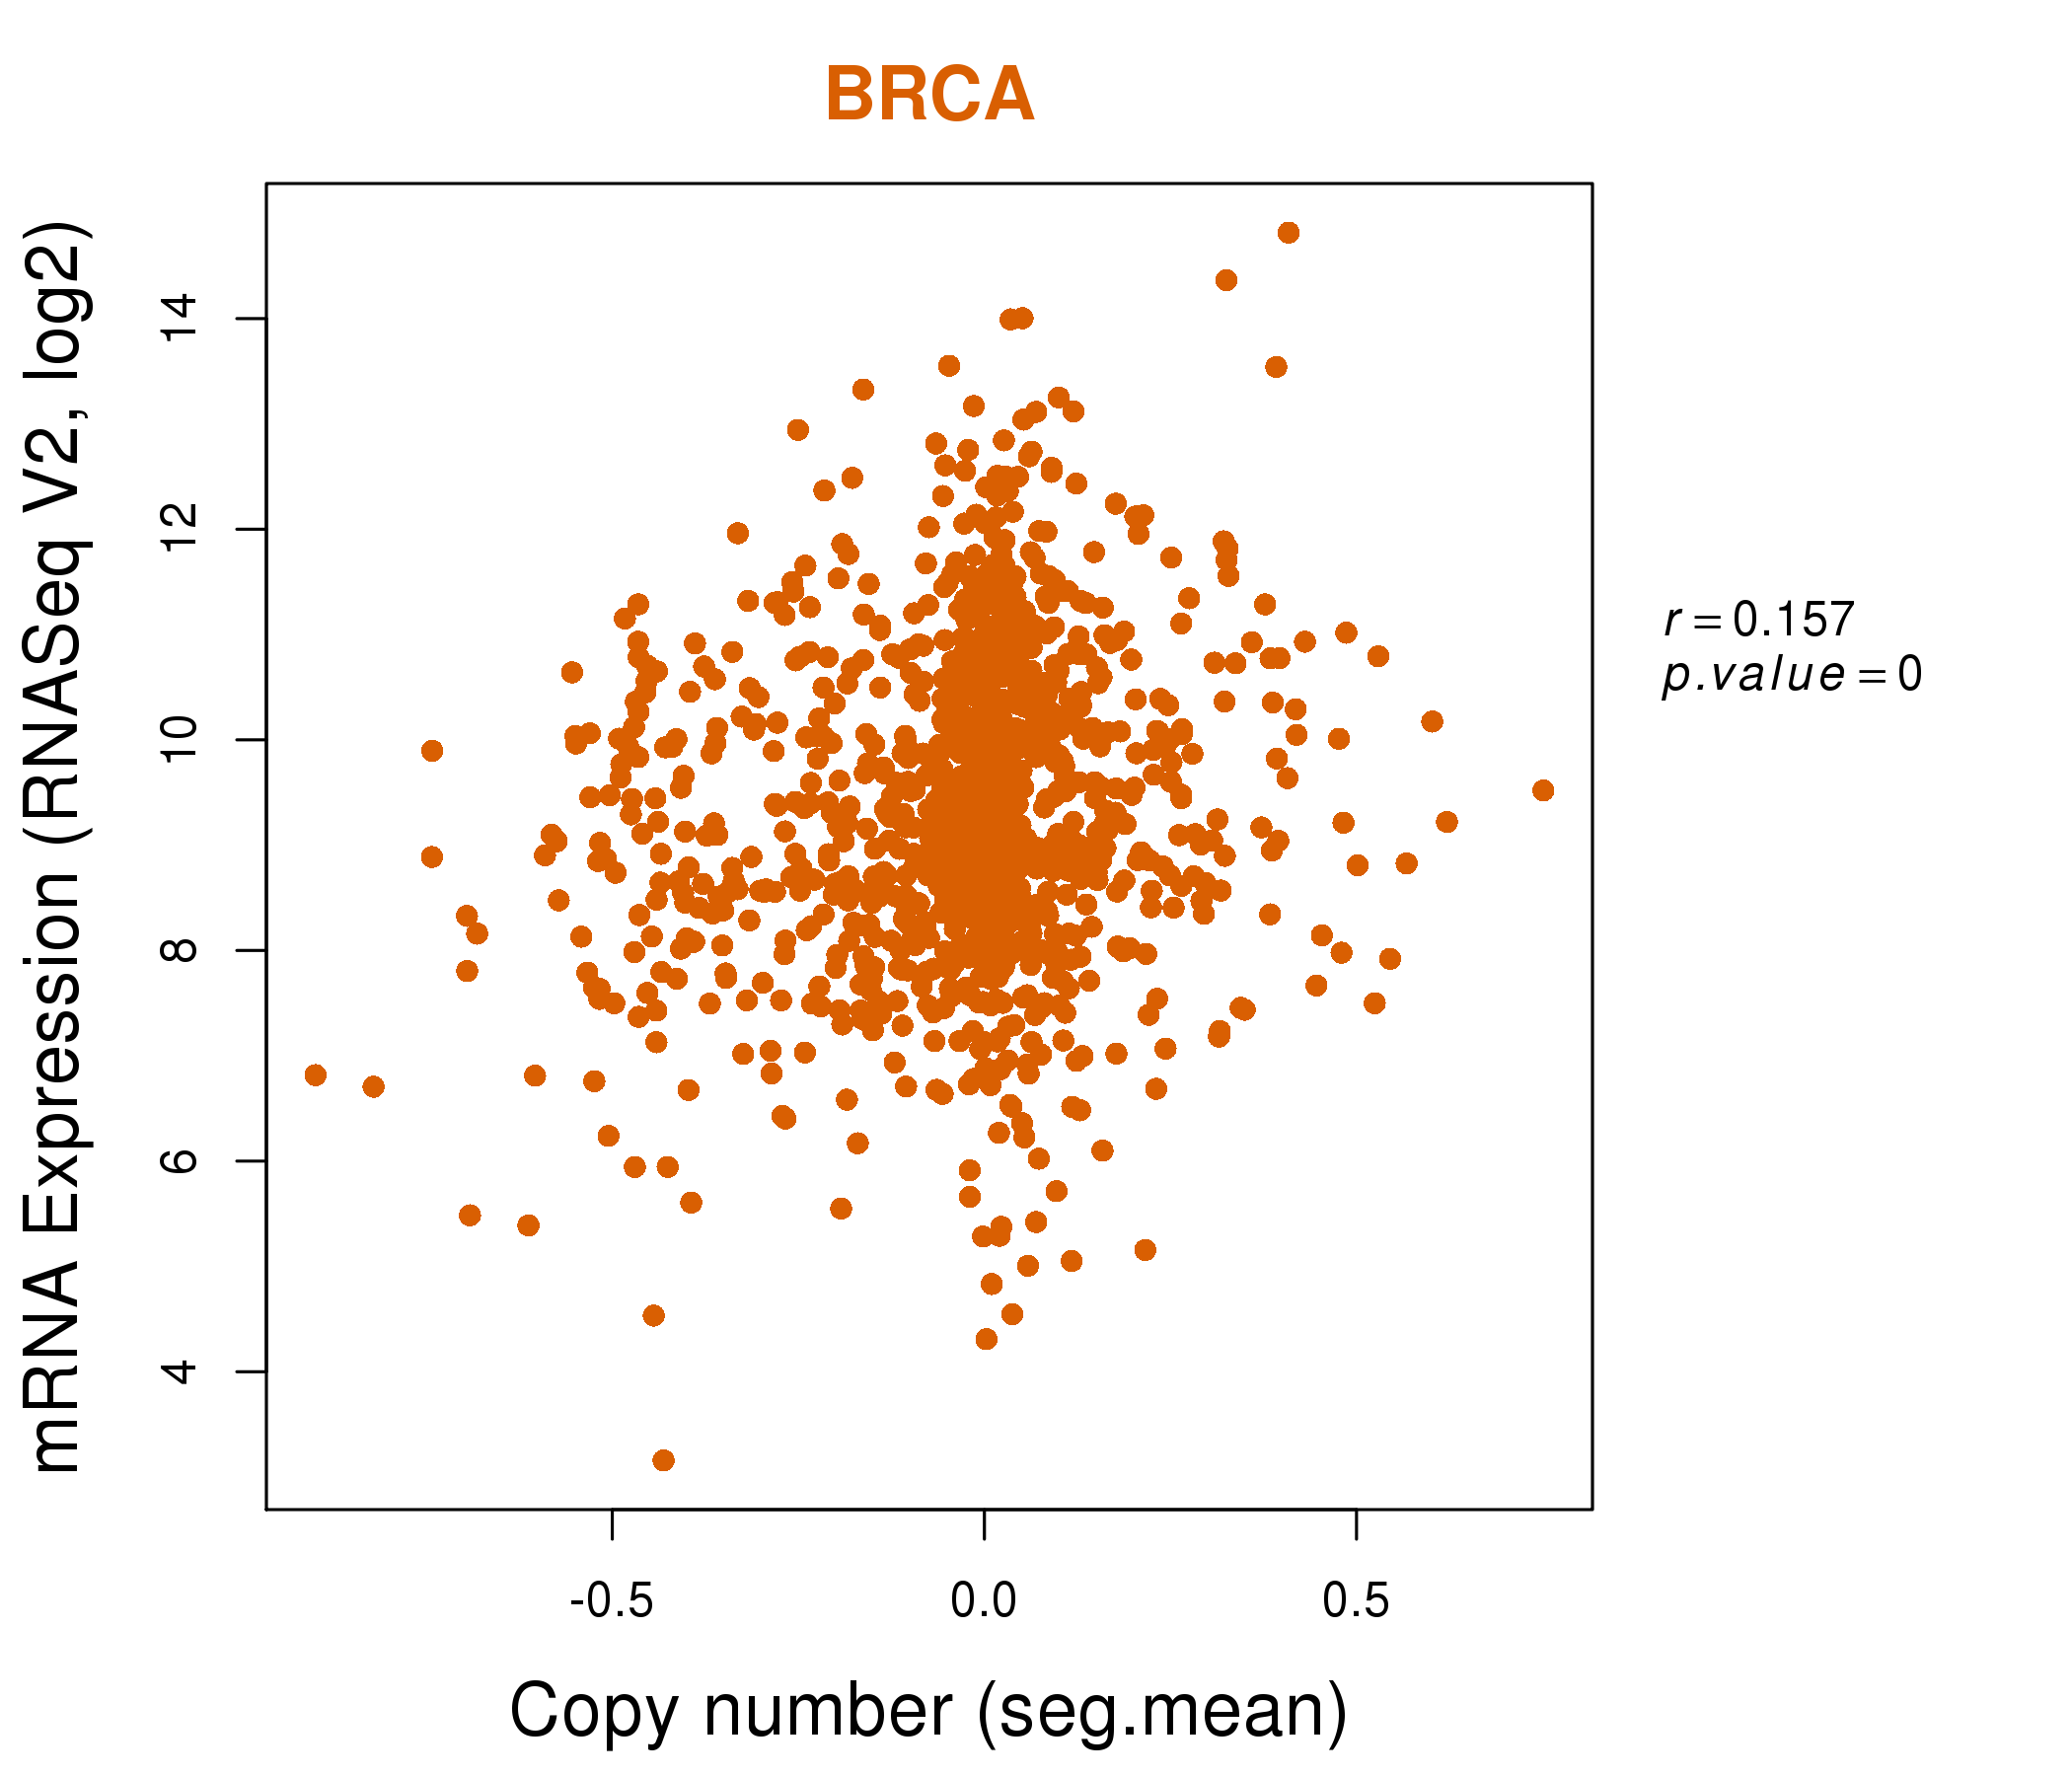
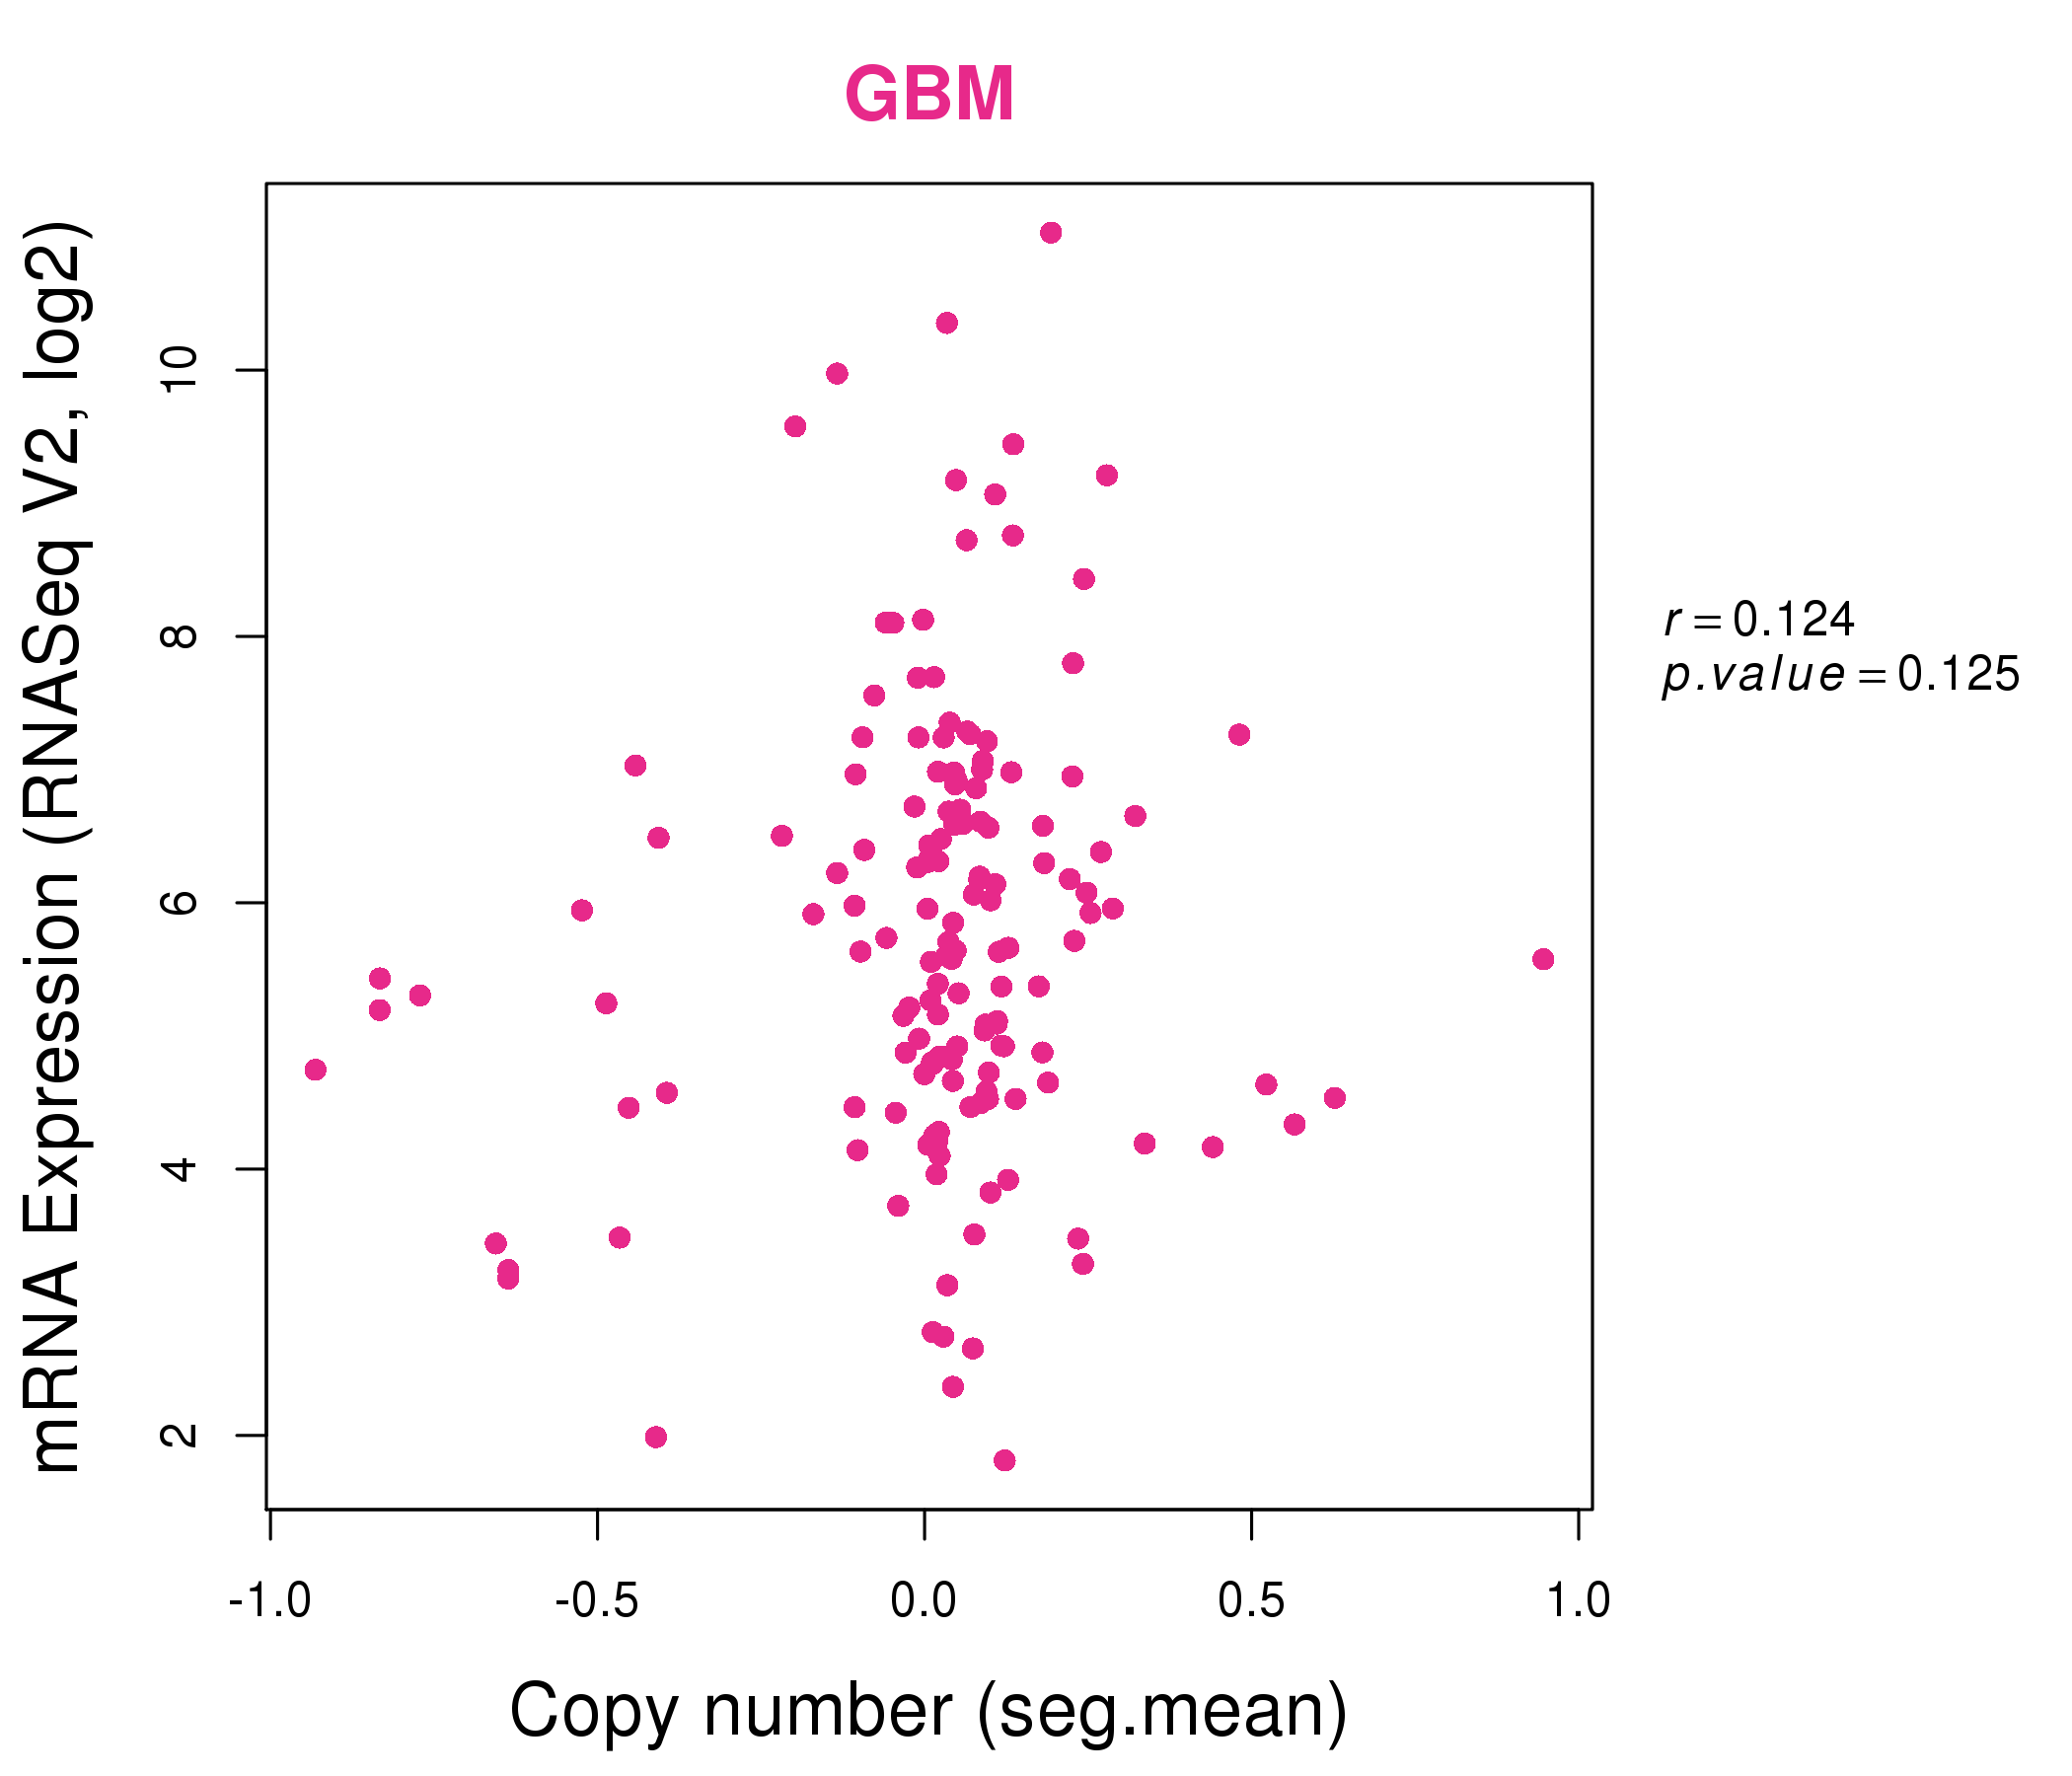
| * Normalized gene expression data of RNASeqV2 was extracted from TCGA using R package TCGA-Assembler. The URLs of all public data files on TCGA DCC data server were gathered at Jan-05-2015. Only eight cancer types have enough normal control samples for differential expression analysis. (t test, adjusted p<0.05 (using Benjamini-Hochberg FDR)) |
 |
| Top |
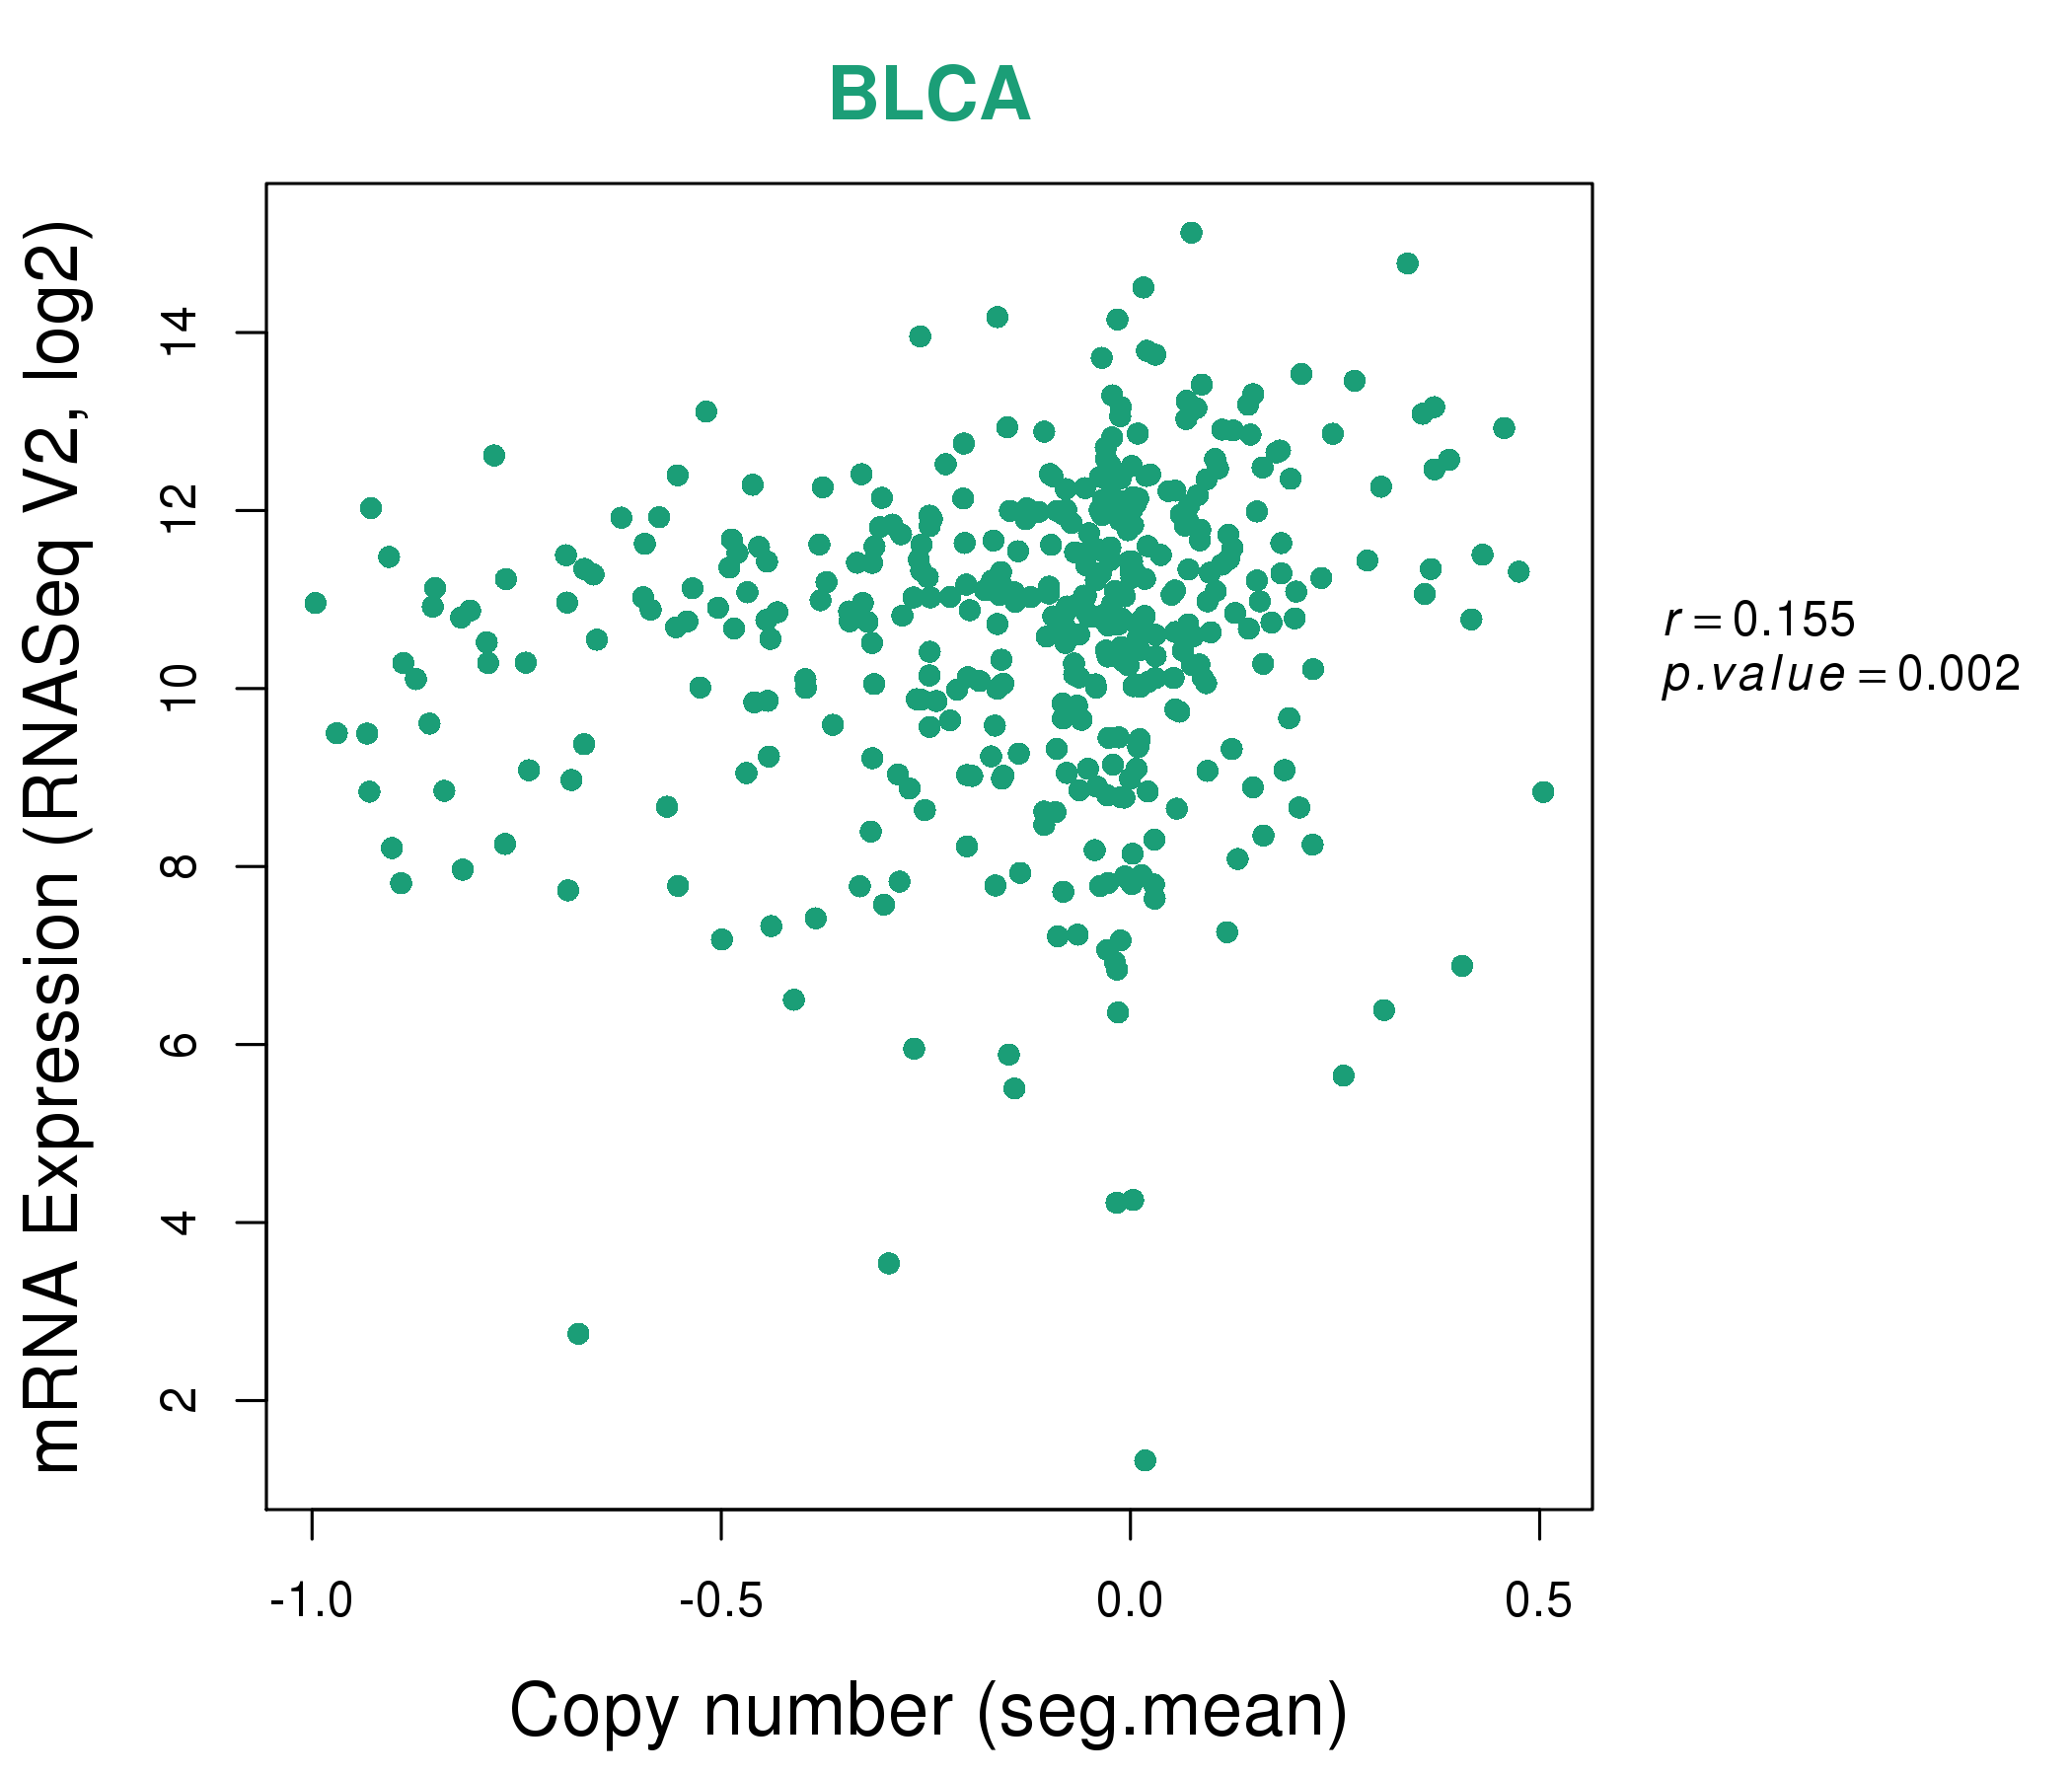
| * This plots show the correlation between CNV and gene expression. |
: Open all plots for all cancer types
 |
|
 |
|
| Top |
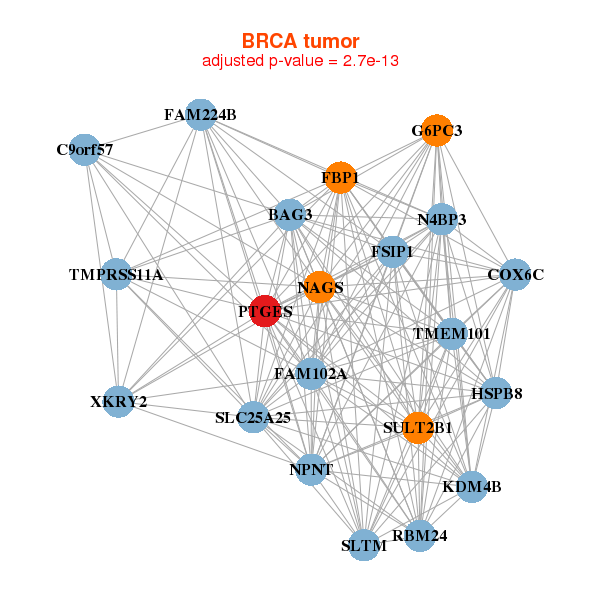
| Gene-Gene Network Information |
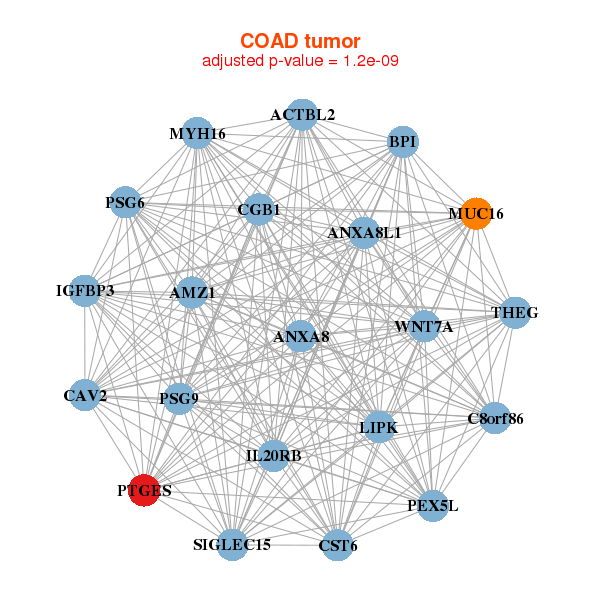
| * Co-Expression network figures were drawn using R package igraph. Only the top 20 genes with the highest correlations were shown. Red circle: input gene, orange circle: cell metabolism gene, sky circle: other gene |
: Open all plots for all cancer types
 |
| ||||
| AURKAIP1,UQCC3,C19orf60,C9orf142,C9orf16,RABL6,CCDC124, DOHH,EDF1,GADD45GIP1,NTMT1,NDUFA11,NDUFB7,PMPCA, PTGES2,REXO4,RPL35,RPS19BP1,SSNA1,SURF2,TIMM13 | ADRM1,ATP5D,RABL6,ESRRA,EMC9,FAM195A,FASTK, CPTP,MAP2K2,NTMT1,MRPL12,MRPL14,NDUFA13,NDUFV1, NOSIP,PCBP4,PHPT1,PMF1,PTGES2,STK11,TIMM17B | ||||
 |
| ||||
| ATP5D,AURKAIP1,UQCC3,C9orf142,COQ4,ENDOG,FPGS, NTMT1,MRPL12,MRPL41,MRPS2,MRPS5,NDUFV1,PMPCA, PTGES2,PTRH1,SLC25A10,TUBB4B,UBAC1,WDR34,ZMYND19 | APEH,ASL,AURKAIP1,CDK2AP2,CYBA,DUS1L,SLC52A2, LMAN2,MAEA,MRPL12,MRPS34,NDUFS6,NDUFS7,NDUFV1, PTGES2,SLC25A10,SLC25A39,TIMM13,TLCD1,TUFM,UQCRC1 |
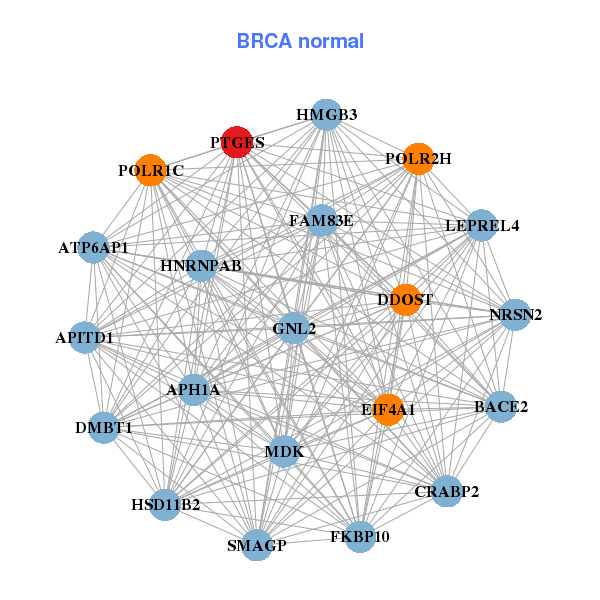
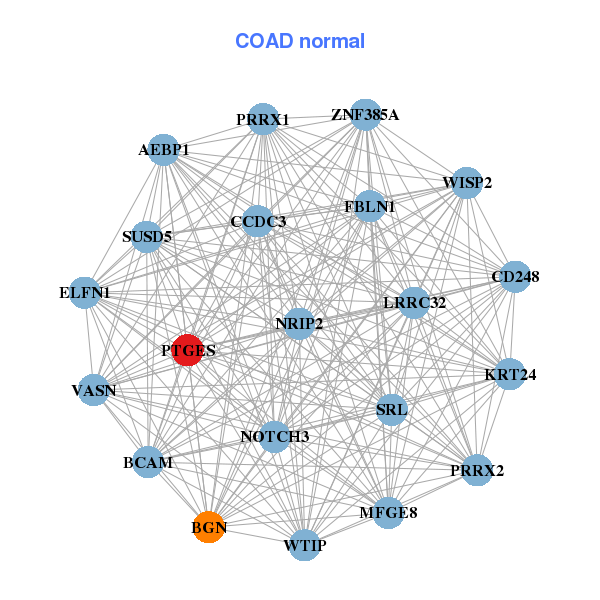
| * Co-Expression network figures were drawn using R package igraph. Only the top 20 genes with the highest correlations were shown. Red circle: input gene, orange circle: cell metabolism gene, sky circle: other gene |
: Open all plots for all cancer types
| Top |
: Open all interacting genes' information including KEGG pathway for all interacting genes from DAVID
| Top |
| Pharmacological Information for PTGES |
| DB Category | DB Name | DB's ID and Url link |
| Chemistry | BindingDB | O14684; -. |
| Chemistry | ChEMBL | CHEMBL5658; -. |
| Organism-specific databases | PharmGKB | PA33948; -. |
| Organism-specific databases | CTD | 9536; -. |
| * Gene Centered Interaction Network. |
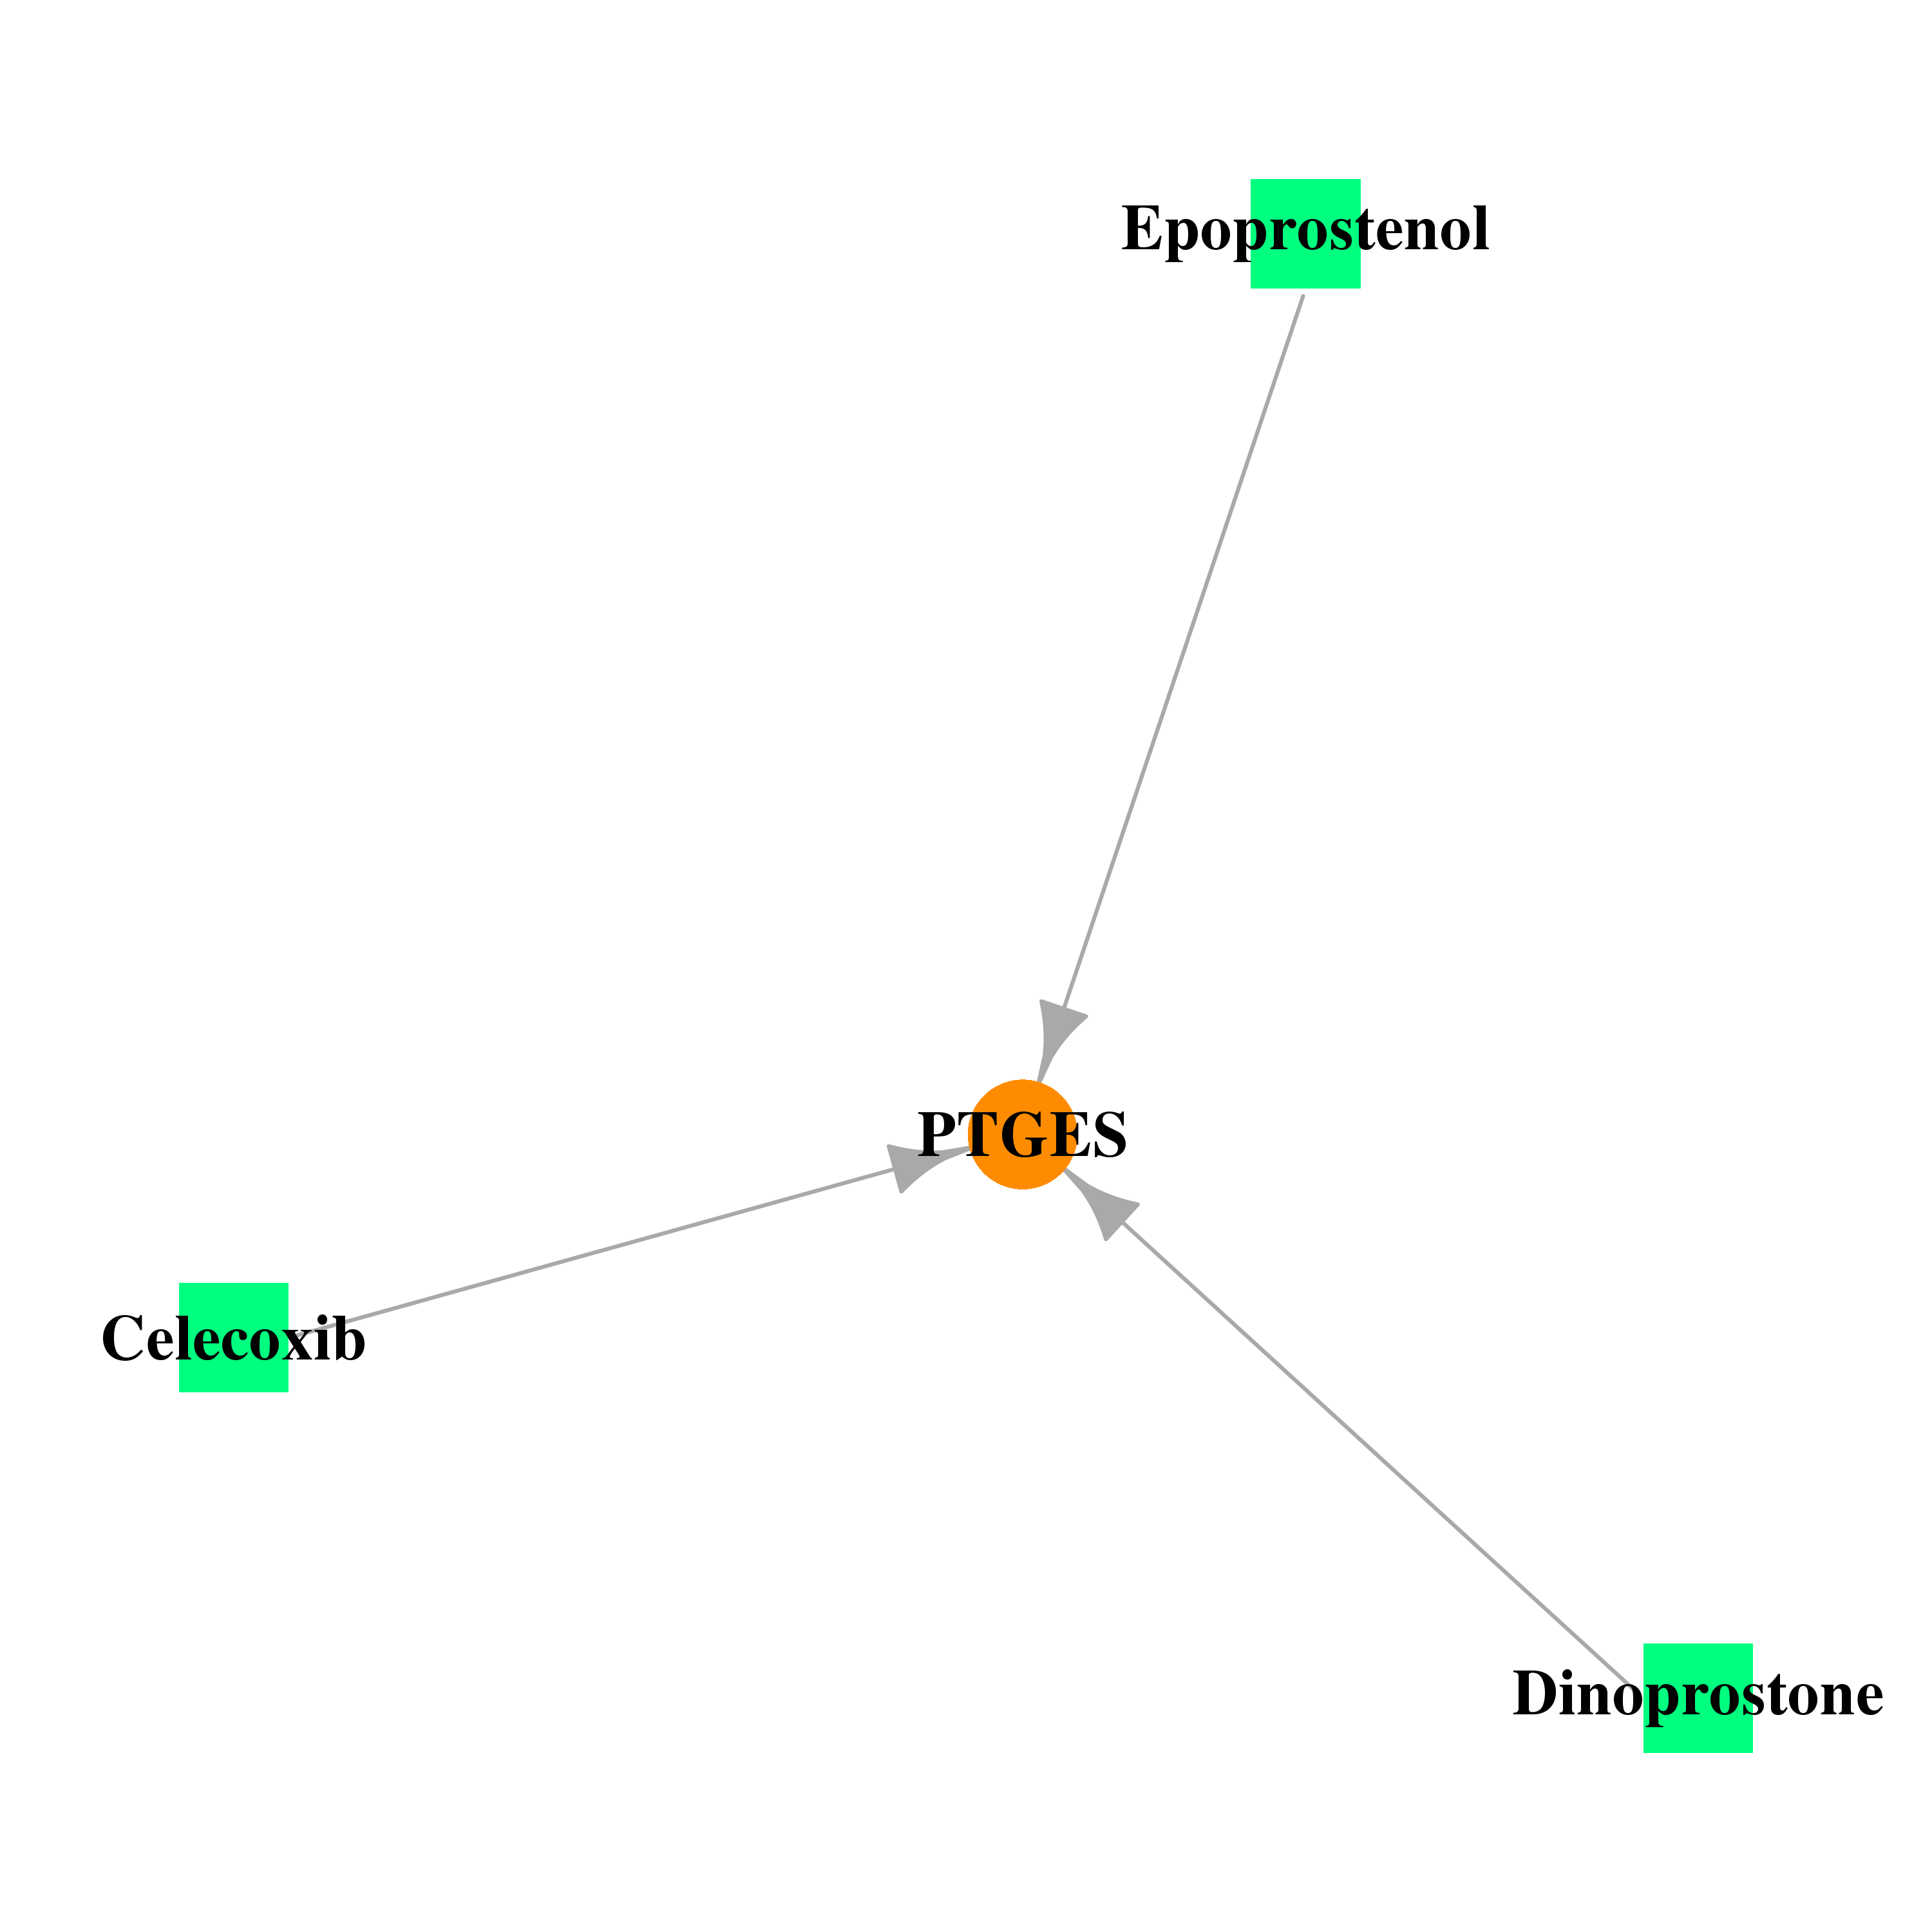 |
| * Drug Centered Interaction Network. |
| DrugBank ID | Target Name | Drug Groups | Generic Name | Drug Centered Network | Drug Structure |
| DB00917 | prostaglandin E synthase | approved | Dinoprostone | 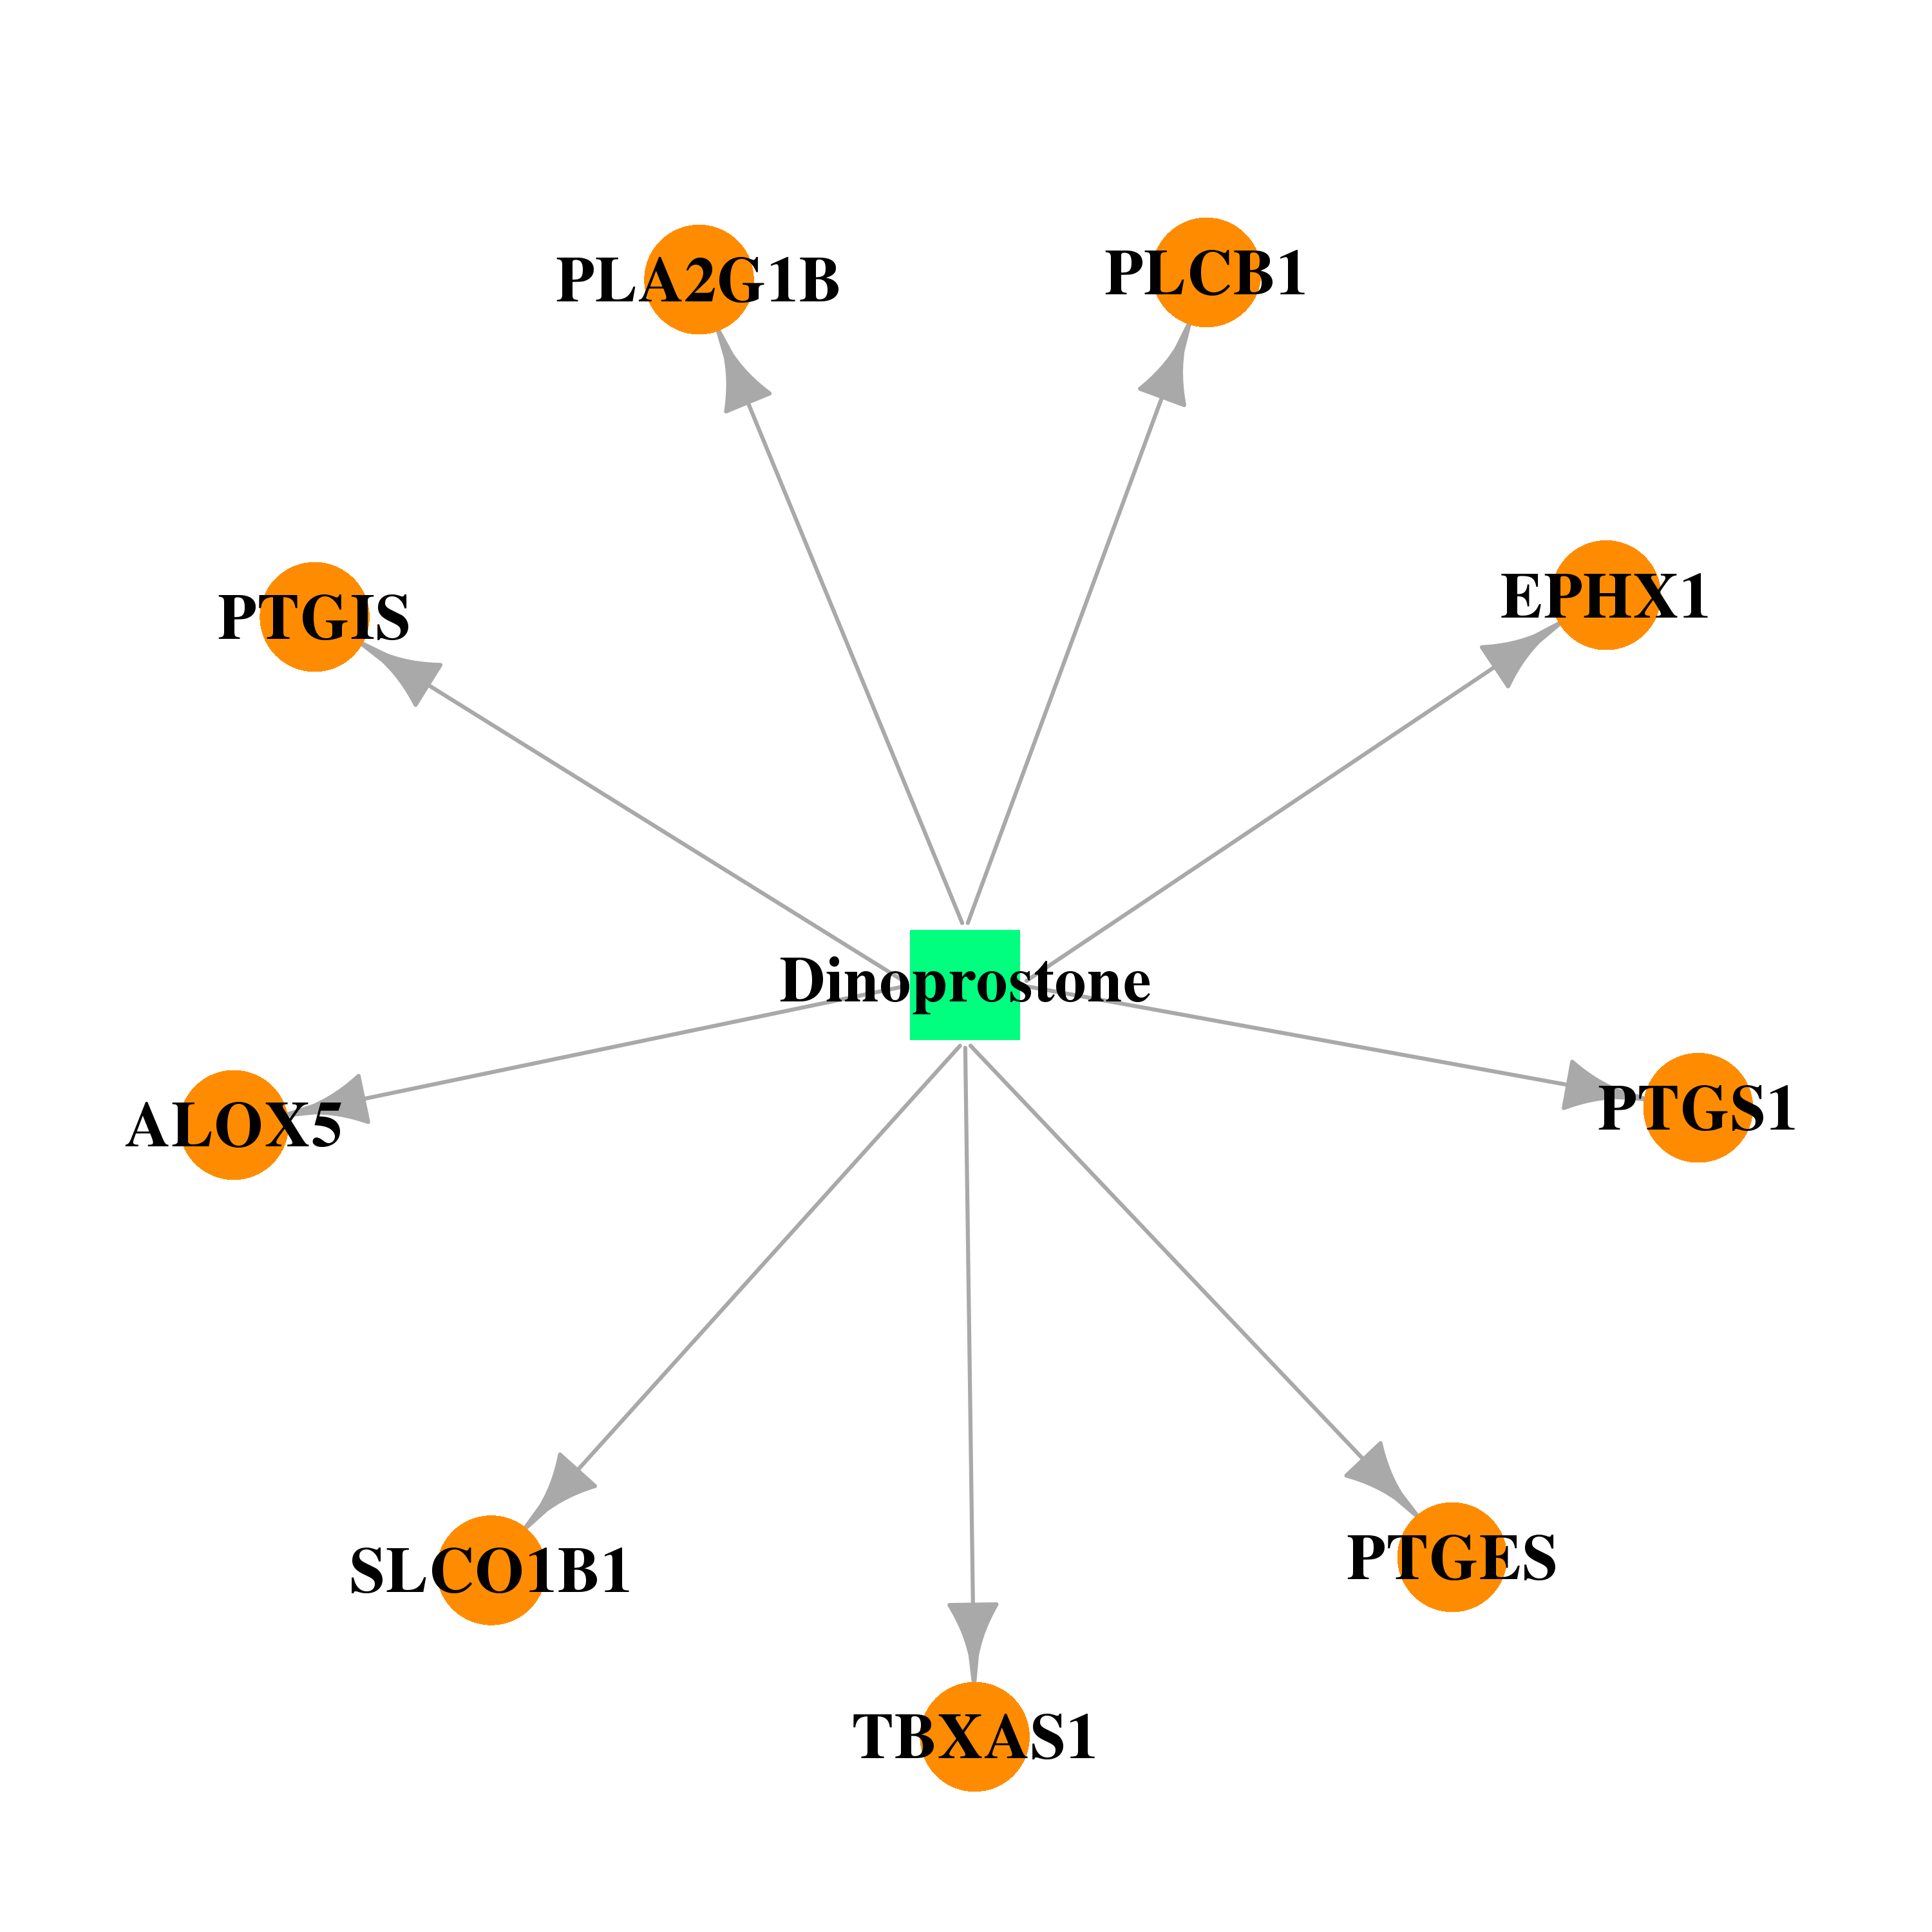 |  |
| DB01240 | prostaglandin E synthase | approved | Epoprostenol | 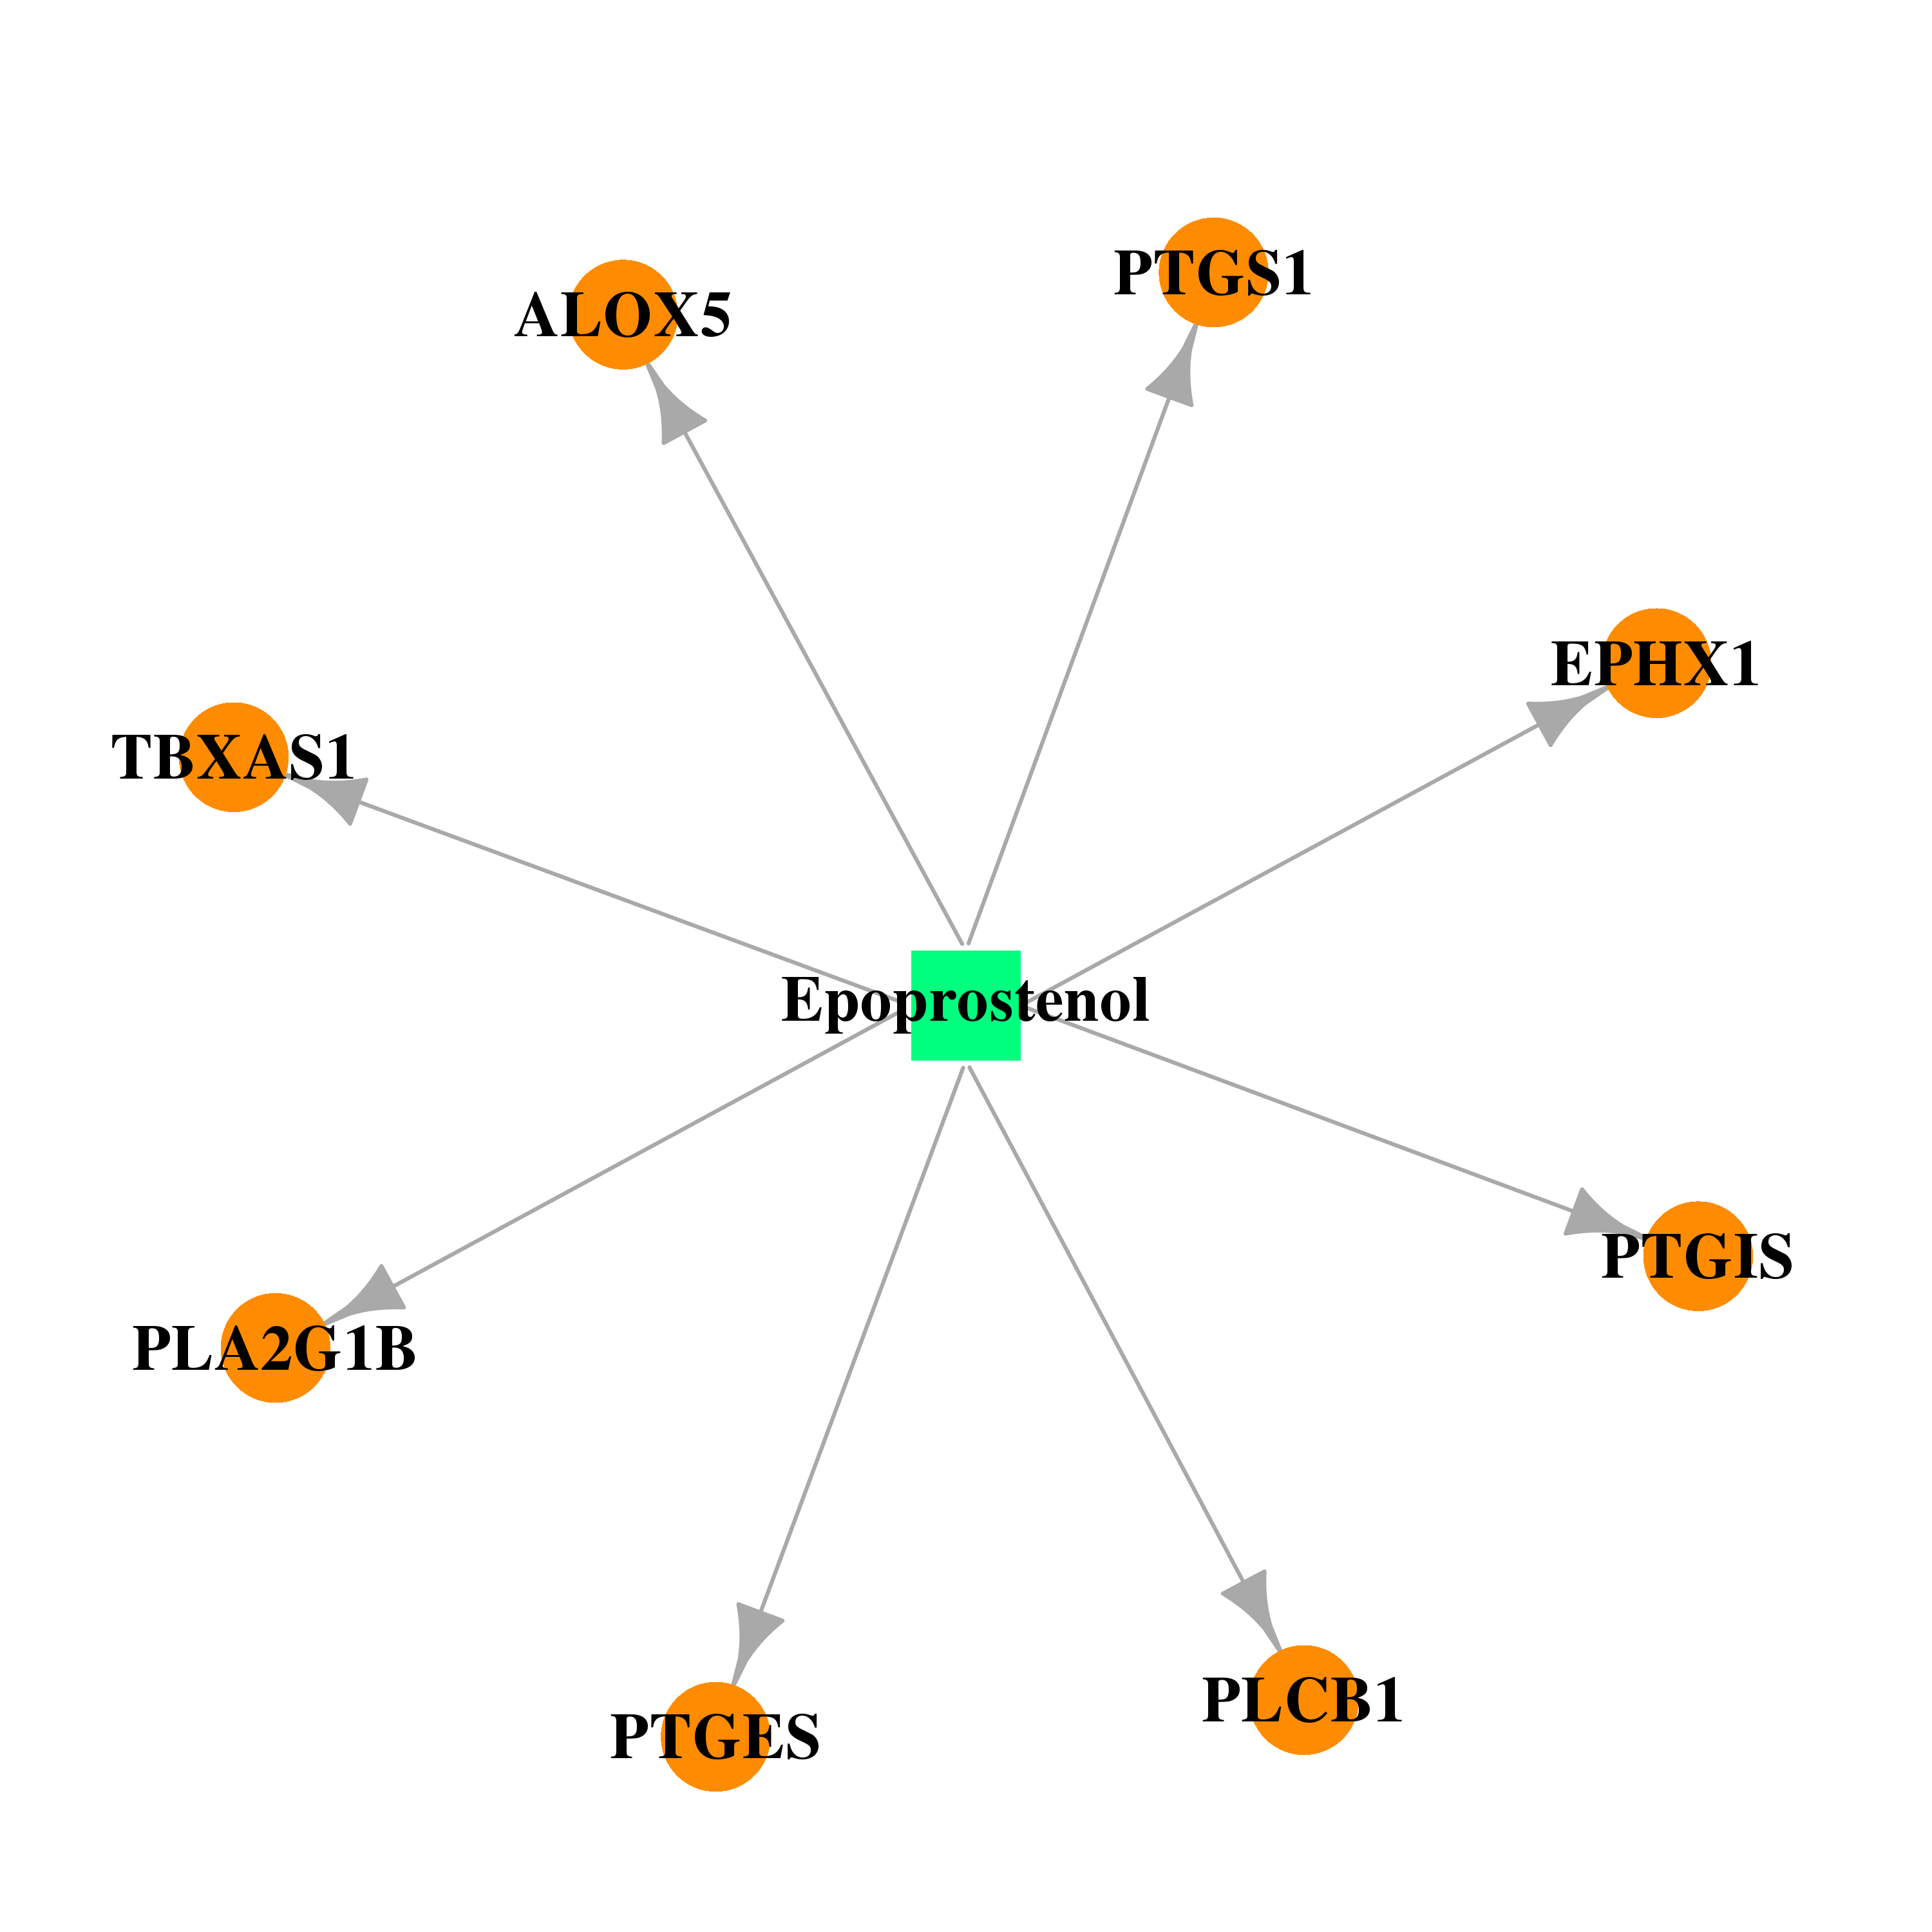 | 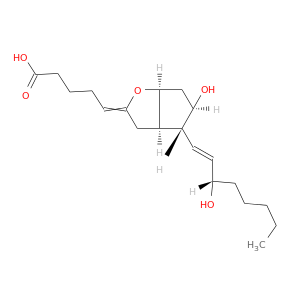 |
| DB00482 | prostaglandin E synthase | approved; investigational | Celecoxib | 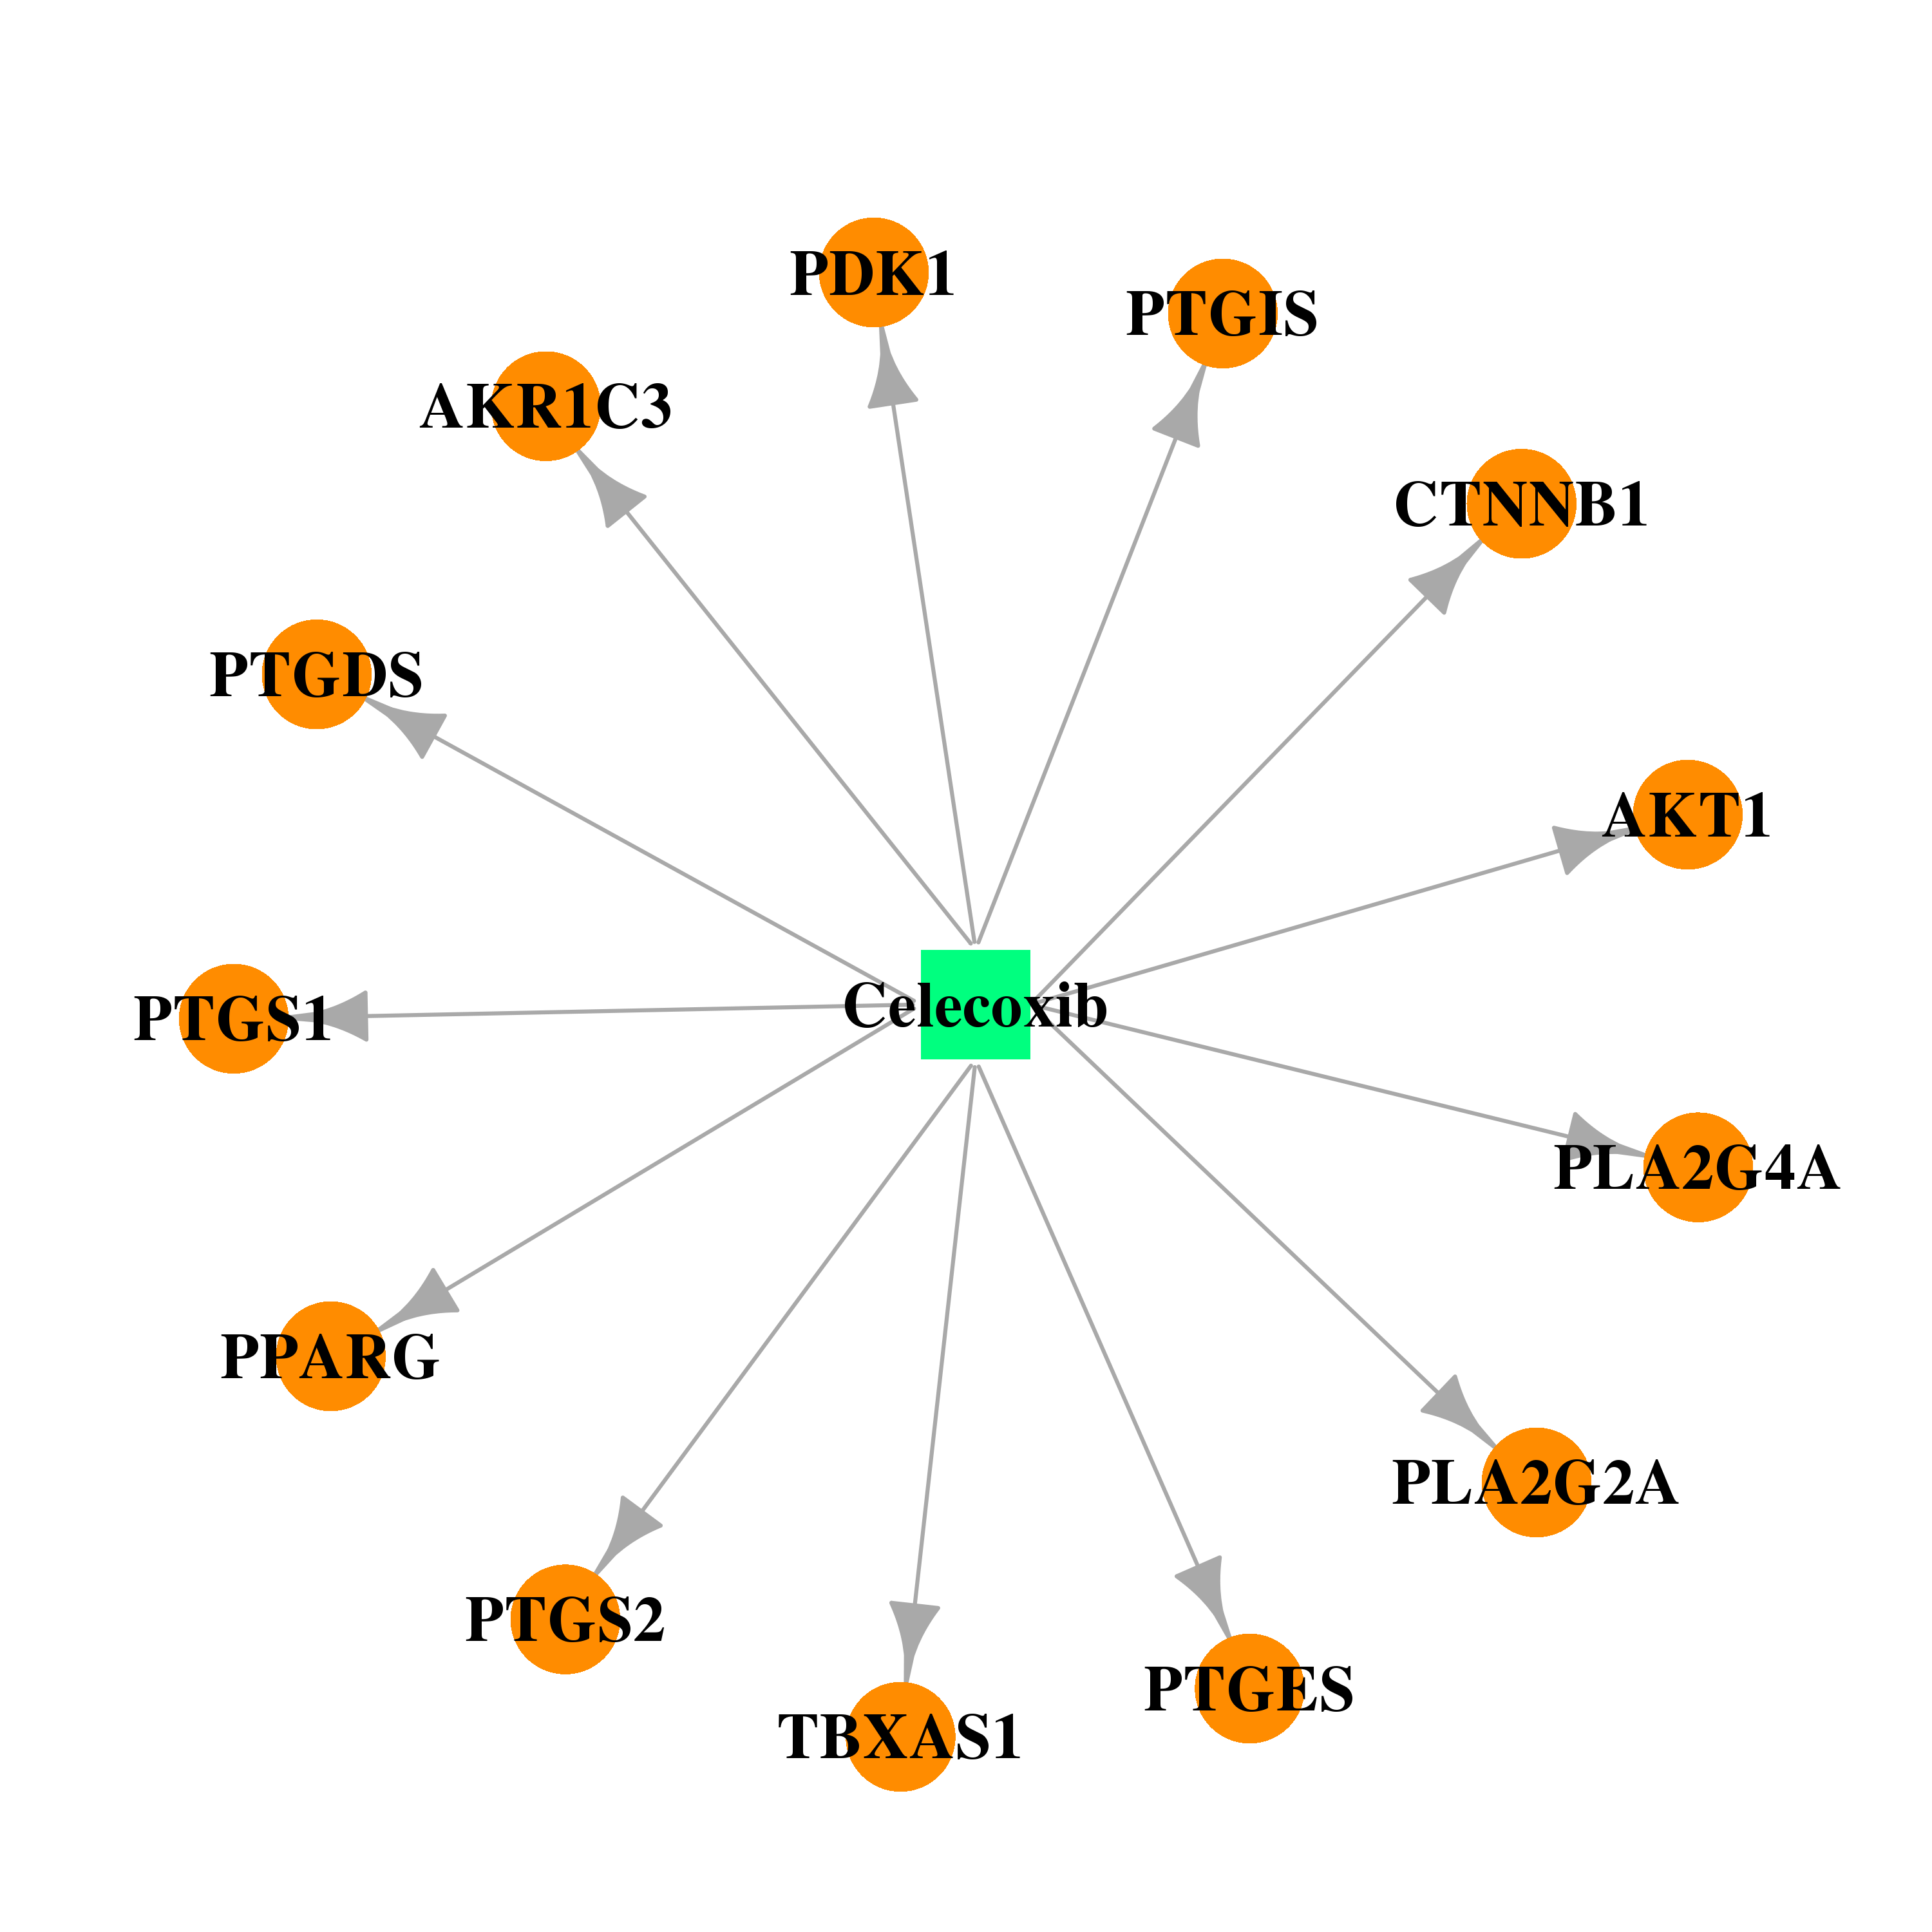 |  |
| Top |
| Cross referenced IDs for PTGES |
| * We obtained these cross-references from Uniprot database. It covers 150 different DBs, 18 categories. http://www.uniprot.org/help/cross_references_section |
: Open all cross reference information
|
Copyright © 2016-Present - The Univsersity of Texas Health Science Center at Houston @ |