|
||||||||||||||||||||
| |
| Phenotypic Information (metabolism pathway, cancer, disease, phenome) |
| |
| |
| Gene-Gene Network Information: Co-Expression Network, Interacting Genes & KEGG |
| |
|


| Gene Summary for ENTPD2 |
| Top |
| Phenotypic Information for ENTPD2(metabolism pathway, cancer, disease, phenome) |
| Cancer | CGAP: ENTPD2 |
| Familial Cancer Database: ENTPD2 | |
| * This gene is included in those cancer gene databases. |
|
|
|
|
|
| . | ||||||||||||||
Oncogene 1 | Significant driver gene in | |||||||||||||||||||
| cf) number; DB name 1 Oncogene; http://nar.oxfordjournals.org/content/35/suppl_1/D721.long, 2 Tumor Suppressor gene; https://bioinfo.uth.edu/TSGene/, 3 Cancer Gene Census; http://www.nature.com/nrc/journal/v4/n3/abs/nrc1299.html, 4 CancerGenes; http://nar.oxfordjournals.org/content/35/suppl_1/D721.long, 5 Network of Cancer Gene; http://ncg.kcl.ac.uk/index.php, 1Therapeutic Vulnerabilities in Cancer; http://cbio.mskcc.org/cancergenomics/statius/ |
| KEGG_PURINE_METABOLISM | |
| OMIM | |
| Orphanet | |
| Disease | KEGG Disease: ENTPD2 |
| MedGen: ENTPD2 (Human Medical Genetics with Condition) | |
| ClinVar: ENTPD2 | |
| Phenotype | MGI: ENTPD2 (International Mouse Phenotyping Consortium) |
| PhenomicDB: ENTPD2 | |
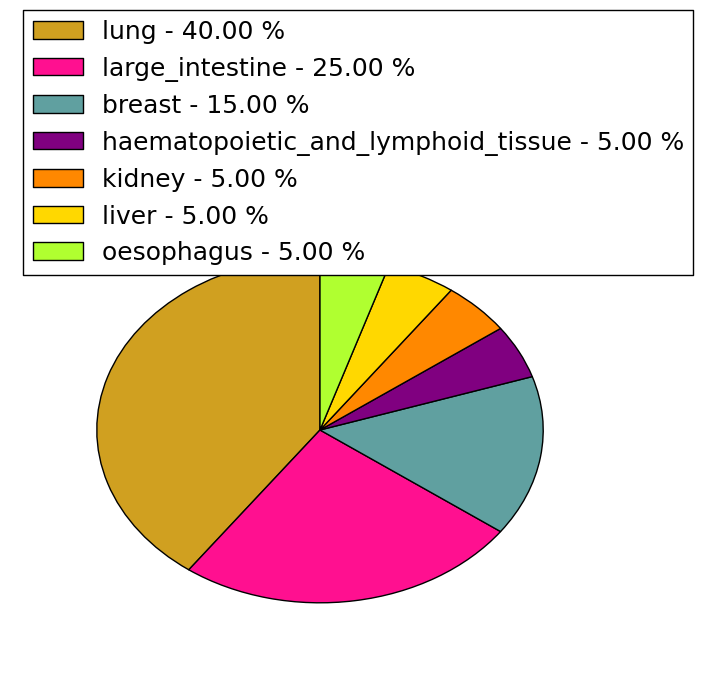
| Mutations for ENTPD2 |
| * Under tables are showing count per each tissue to give us broad intuition about tissue specific mutation patterns.You can go to the detailed page for each mutation database's web site. |
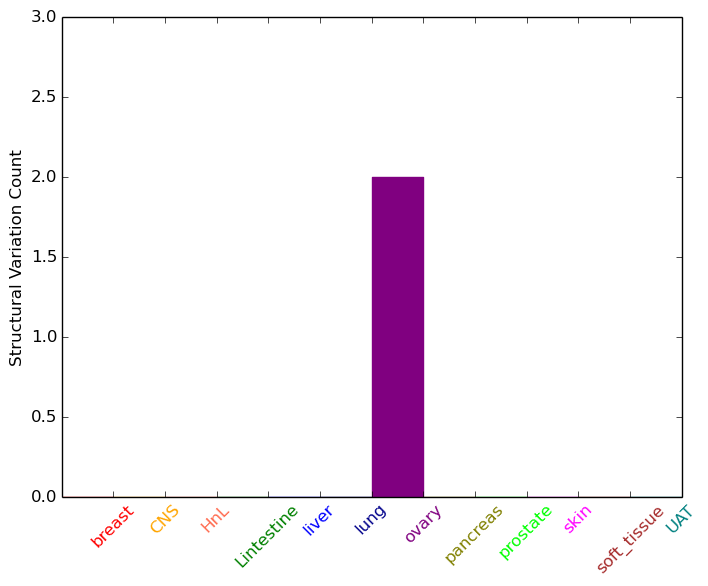
| - Statistics for Tissue and Mutation type | Top |
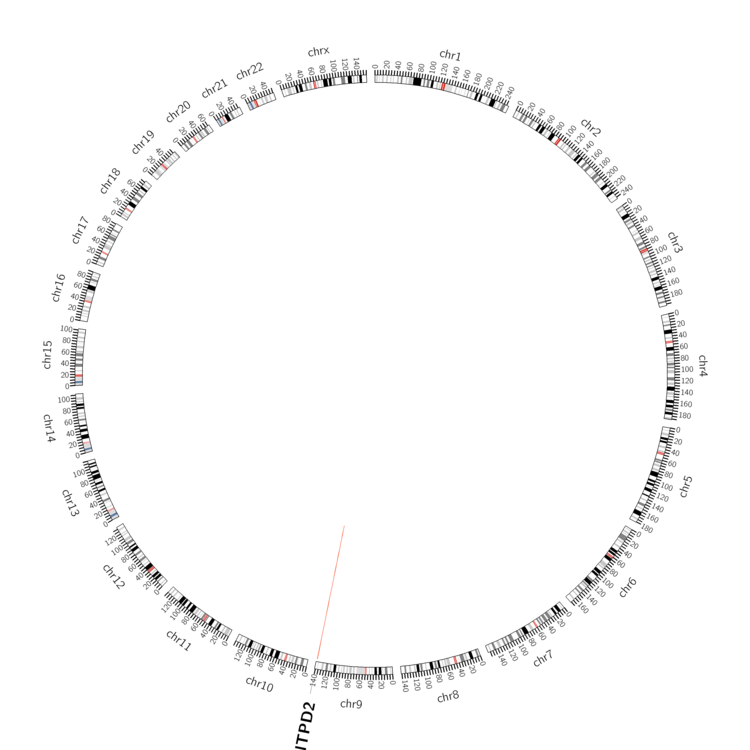 |
| - For Inter-chromosomal Variations |
| There's no inter-chromosomal structural variation. |
| - For Intra-chromosomal Variations |
| * Intra-chromosomal variantions includes 'intrachromosomal amplicon to amplicon', 'intrachromosomal amplicon to non-amplified dna', 'intrachromosomal deletion', 'intrachromosomal fold-back inversion', 'intrachromosomal inversion', 'intrachromosomal tandem duplication', 'Intrachromosomal unknown type', 'intrachromosomal with inverted orientation', 'intrachromosomal with non-inverted orientation'. |
 |
| Sample | Symbol_a | Chr_a | Start_a | End_a | Symbol_b | Chr_b | Start_b | End_b |
| ovary | ENTPD2 | chr9 | 139947465 | 139947485 | chr9 | 139689213 | 139689233 |
| cf) Tissue number; Tissue name (1;Breast, 2;Central_nervous_system, 3;Haematopoietic_and_lymphoid_tissue, 4;Large_intestine, 5;Liver, 6;Lung, 7;Ovary, 8;Pancreas, 9;Prostate, 10;Skin, 11;Soft_tissue, 12;Upper_aerodigestive_tract) |
| * From mRNA Sanger sequences, Chitars2.0 arranged chimeric transcripts. This table shows ENTPD2 related fusion information. |
| ID | Head Gene | Tail Gene | Accession | Gene_a | qStart_a | qEnd_a | Chromosome_a | tStart_a | tEnd_a | Gene_a | qStart_a | qEnd_a | Chromosome_a | tStart_a | tEnd_a |
| BG958300 | ENTPD2 | 51 | 70 | 9 | 139943055 | 139943074 | CLEC16A | 65 | 184 | 16 | 11273588 | 11273707 | |
| AA583398 | ENTPD2 | 1 | 100 | 9 | 139942563 | 139942662 | C1S | 95 | 523 | 12 | 7173119 | 7175022 | |
| Top |
| There's no copy number variation information in COSMIC data for this gene. |
| Top |
|
 |
| Top |
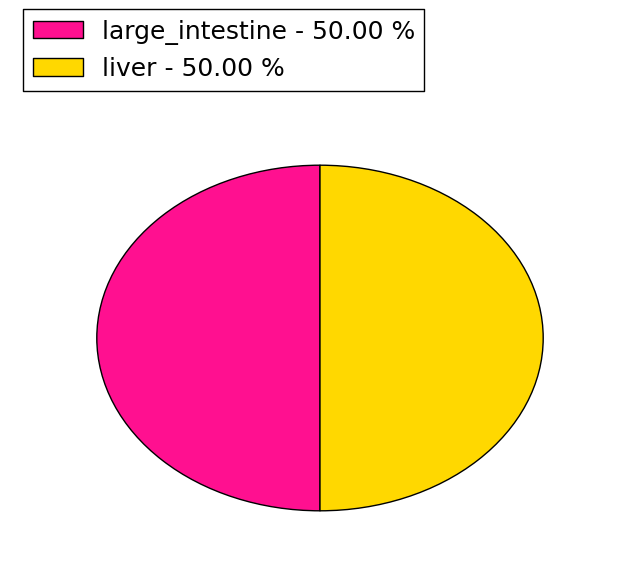
| Stat. for Non-Synonymous SNVs (# total SNVs=20) | (# total SNVs=15) |
 | 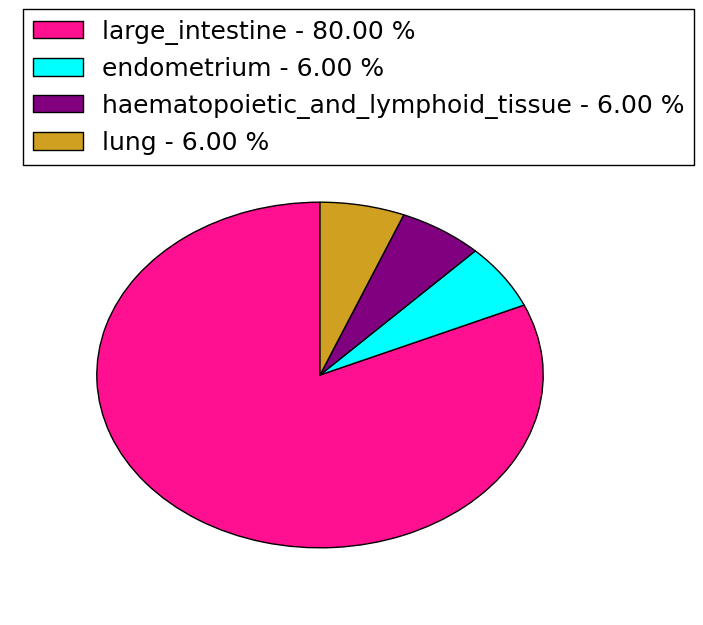 |
(# total SNVs=2) | (# total SNVs=0) |
 |
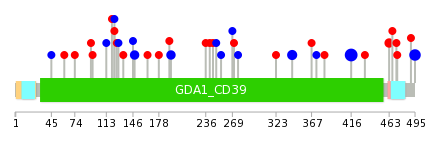
| Top |
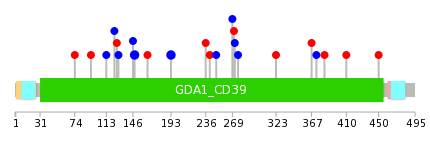
| * When you move the cursor on each content, you can see more deailed mutation information on the Tooltip. Those are primary_site,primary_histology,mutation(aa),pubmedID. |
| GRCh37 position | Mutation(aa) | Unique sampleID count |
| chr9:139943429-139943429 | p.D416D | 11 |
| chr9:139943112-139943112 | p.I495I | 6 |
| chr9:139944736-139944736 | p.V343V | 3 |
| chr9:139945765-139945765 | p.T148T | 2 |
| chr9:139945809-139945809 | p.E134* | 2 |
| chr9:139943209-139943209 | p.S463F | 2 |
| chr9:139945549-139945549 | p.R193R | 2 |
| chr9:139945395-139945395 | p.R245C | 1 |
| chr9:139943128-139943128 | p.K490R | 1 |
| chr9:139944729-139944729 | p.? | 1 |
| Top |
|
 |
| Point Mutation/ Tissue ID | 1 | 2 | 3 | 4 | 5 | 6 | 7 | 8 | 9 | 10 | 11 | 12 | 13 | 14 | 15 | 16 | 17 | 18 | 19 | 20 |
| # sample | 2 | 2 | 4 | 1 | 3 | 2 | 6 | 1 | 1 | |||||||||||
| # mutation | 3 | 2 | 4 | 1 | 3 | 2 | 7 | 1 | 1 | |||||||||||
| nonsynonymous SNV | 1 | 2 | 2 | 2 | 2 | 3 | ||||||||||||||
| synonymous SNV | 2 | 2 | 1 | 1 | 4 | 1 | 1 |
| cf) Tissue ID; Tissue type (1; BLCA[Bladder Urothelial Carcinoma], 2; BRCA[Breast invasive carcinoma], 3; CESC[Cervical squamous cell carcinoma and endocervical adenocarcinoma], 4; COAD[Colon adenocarcinoma], 5; GBM[Glioblastoma multiforme], 6; Glioma Low Grade, 7; HNSC[Head and Neck squamous cell carcinoma], 8; KICH[Kidney Chromophobe], 9; KIRC[Kidney renal clear cell carcinoma], 10; KIRP[Kidney renal papillary cell carcinoma], 11; LAML[Acute Myeloid Leukemia], 12; LUAD[Lung adenocarcinoma], 13; LUSC[Lung squamous cell carcinoma], 14; OV[Ovarian serous cystadenocarcinoma ], 15; PAAD[Pancreatic adenocarcinoma], 16; PRAD[Prostate adenocarcinoma], 17; SKCM[Skin Cutaneous Melanoma], 18:STAD[Stomach adenocarcinoma], 19:THCA[Thyroid carcinoma], 20:UCEC[Uterine Corpus Endometrial Carcinoma]) |
| Top |
| * We represented just top 10 SNVs. When you move the cursor on each content, you can see more deailed mutation information on the Tooltip. Those are primary_site, primary_histology, mutation(aa), pubmedID. |
| Genomic Position | Mutation(aa) | Unique sampleID count |
| chr9:139945549 | p.R193R,ENTPD2 | 2 |
| chr9:139945765 | p.T148T,ENTPD2 | 2 |
| chr9:139946697 | p.Q383H,ENTPD2 | 1 |
| chr9:139943299 | p.R126C,ENTPD2 | 1 |
| chr9:139945421 | p.A373A,ENTPD2 | 1 |
| chr9:139944322 | p.A123A,ENTPD2 | 1 |
| chr9:139944352 | p.Q367R,ENTPD2 | 1 |
| chr9:139945719 | p.A113A,ENTPD2 | 1 |
| chr9:139944371 | p.C323Y,ENTPD2 | 1 |
| chr9:139944797 | p.Q94E,ENTPD2 | 1 |
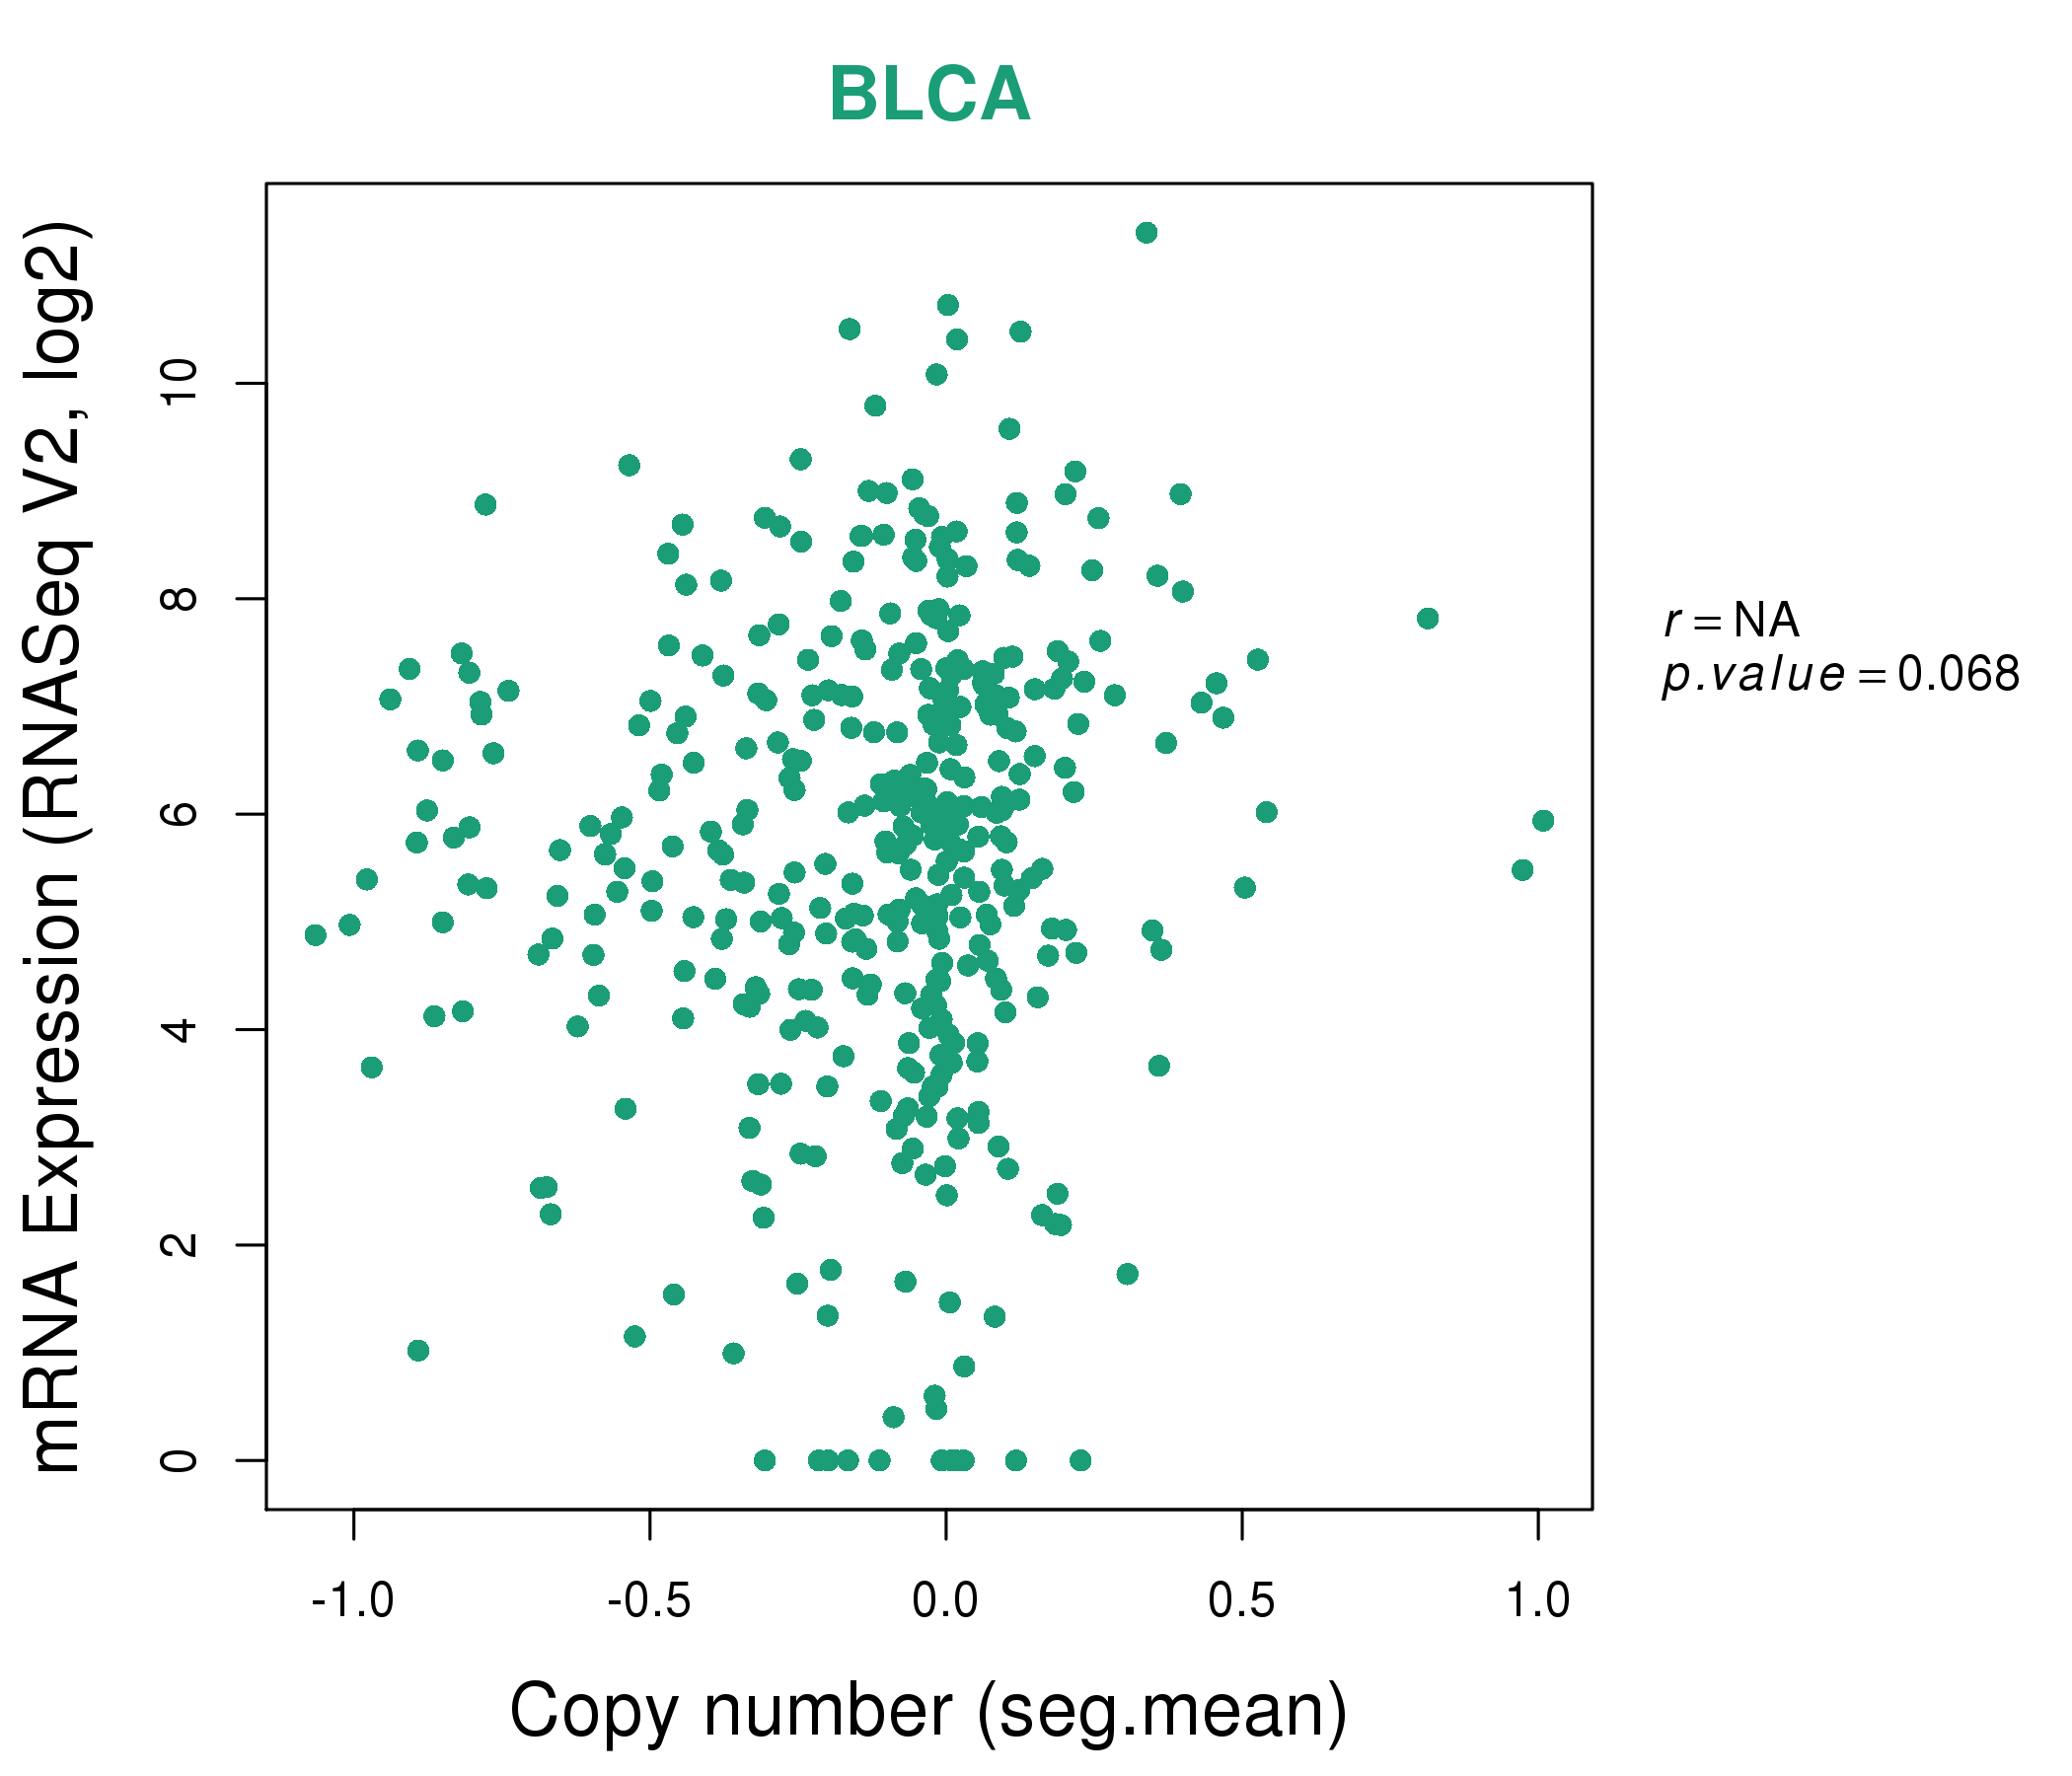
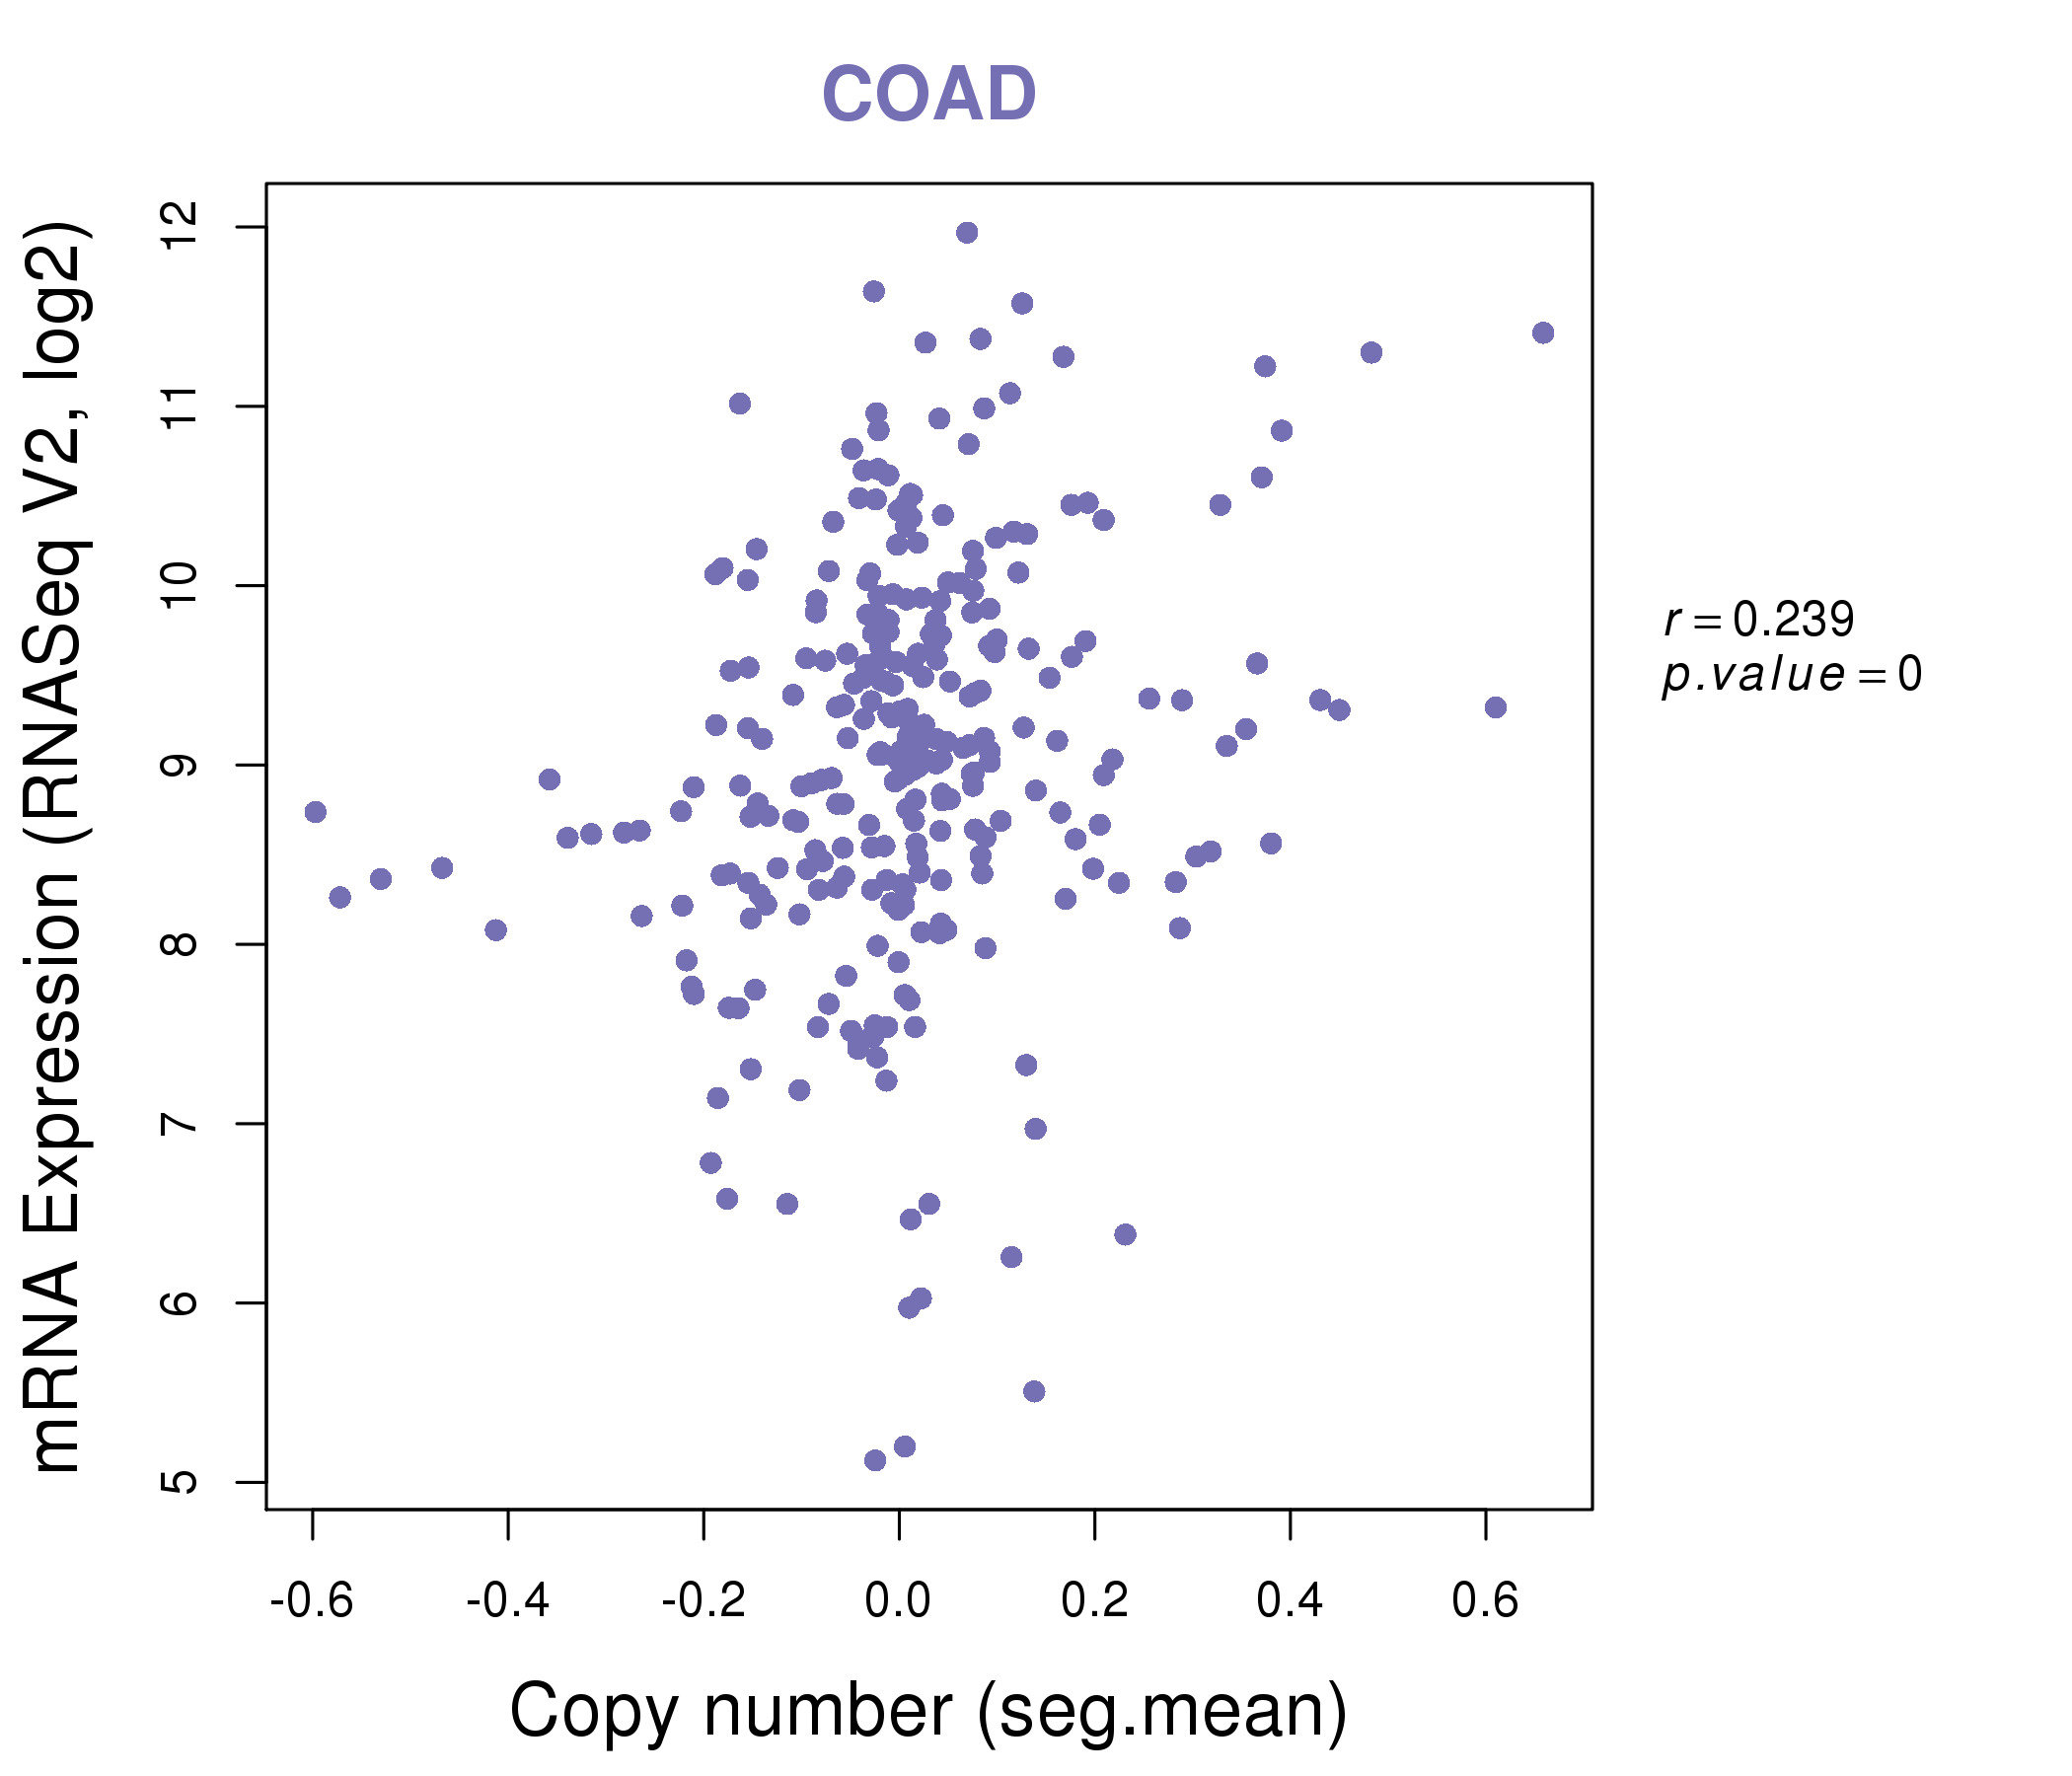
| * Copy number data were extracted from TCGA using R package TCGA-Assembler. The URLs of all public data files on TCGA DCC data server were gathered on Jan-05-2015. Function ProcessCNAData in TCGA-Assembler package was used to obtain gene-level copy number value which is calculated as the average copy number of the genomic region of a gene. |
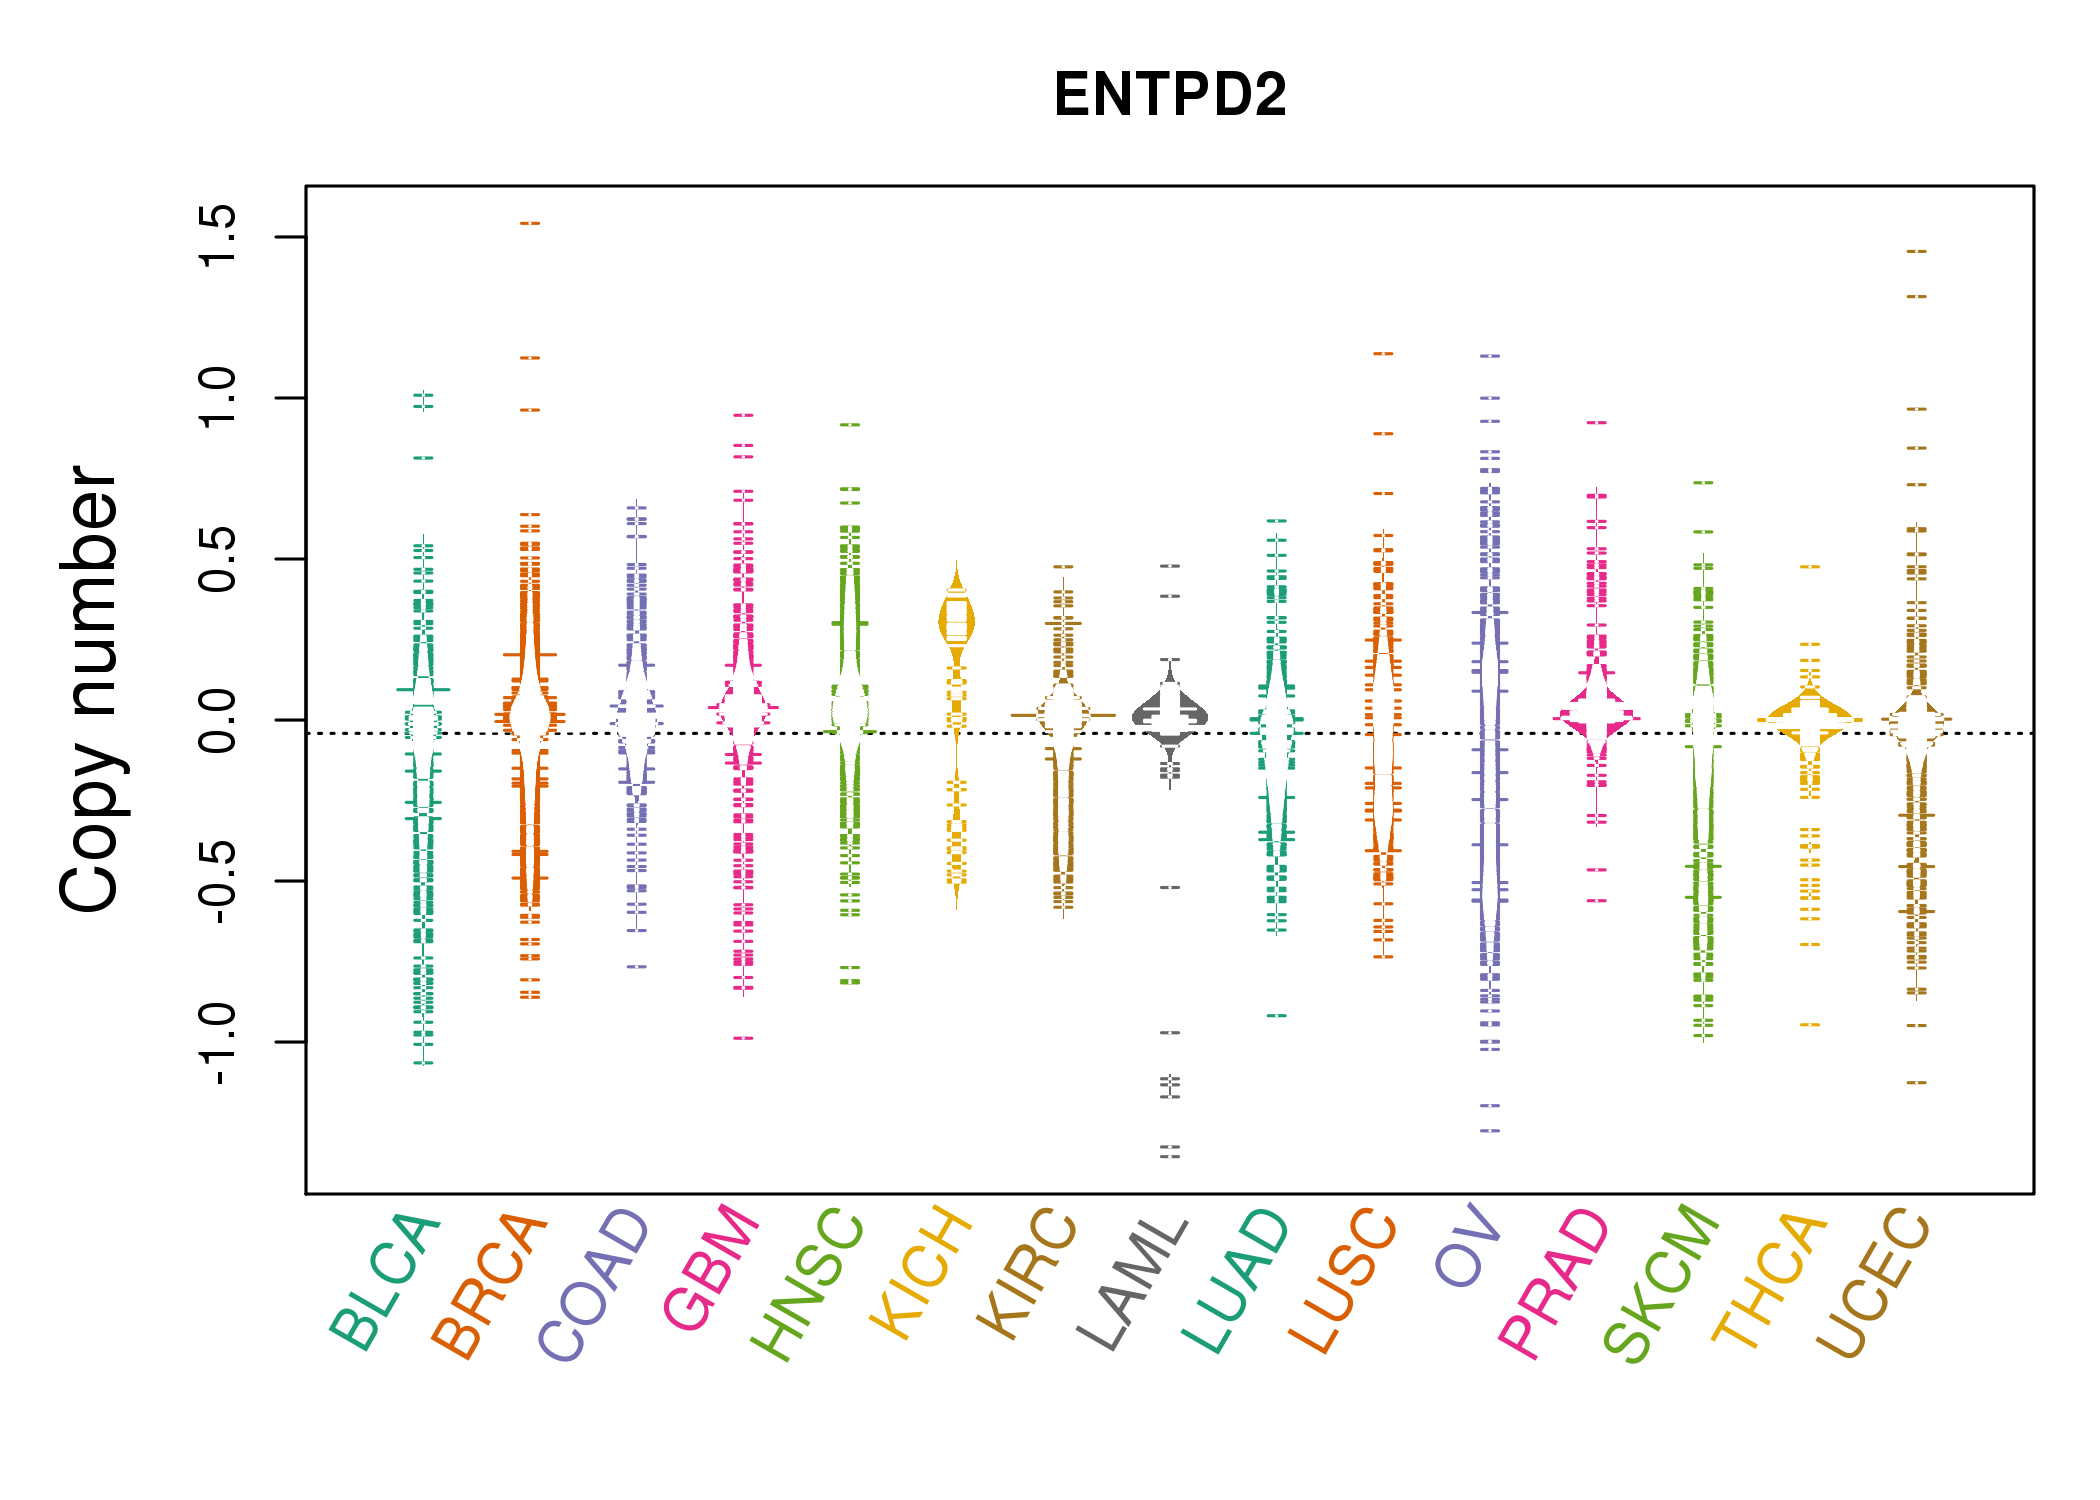 |
| cf) Tissue ID[Tissue type]: BLCA[Bladder Urothelial Carcinoma], BRCA[Breast invasive carcinoma], CESC[Cervical squamous cell carcinoma and endocervical adenocarcinoma], COAD[Colon adenocarcinoma], GBM[Glioblastoma multiforme], Glioma Low Grade, HNSC[Head and Neck squamous cell carcinoma], KICH[Kidney Chromophobe], KIRC[Kidney renal clear cell carcinoma], KIRP[Kidney renal papillary cell carcinoma], LAML[Acute Myeloid Leukemia], LUAD[Lung adenocarcinoma], LUSC[Lung squamous cell carcinoma], OV[Ovarian serous cystadenocarcinoma ], PAAD[Pancreatic adenocarcinoma], PRAD[Prostate adenocarcinoma], SKCM[Skin Cutaneous Melanoma], STAD[Stomach adenocarcinoma], THCA[Thyroid carcinoma], UCEC[Uterine Corpus Endometrial Carcinoma] |
| Top |
| Gene Expression for ENTPD2 |
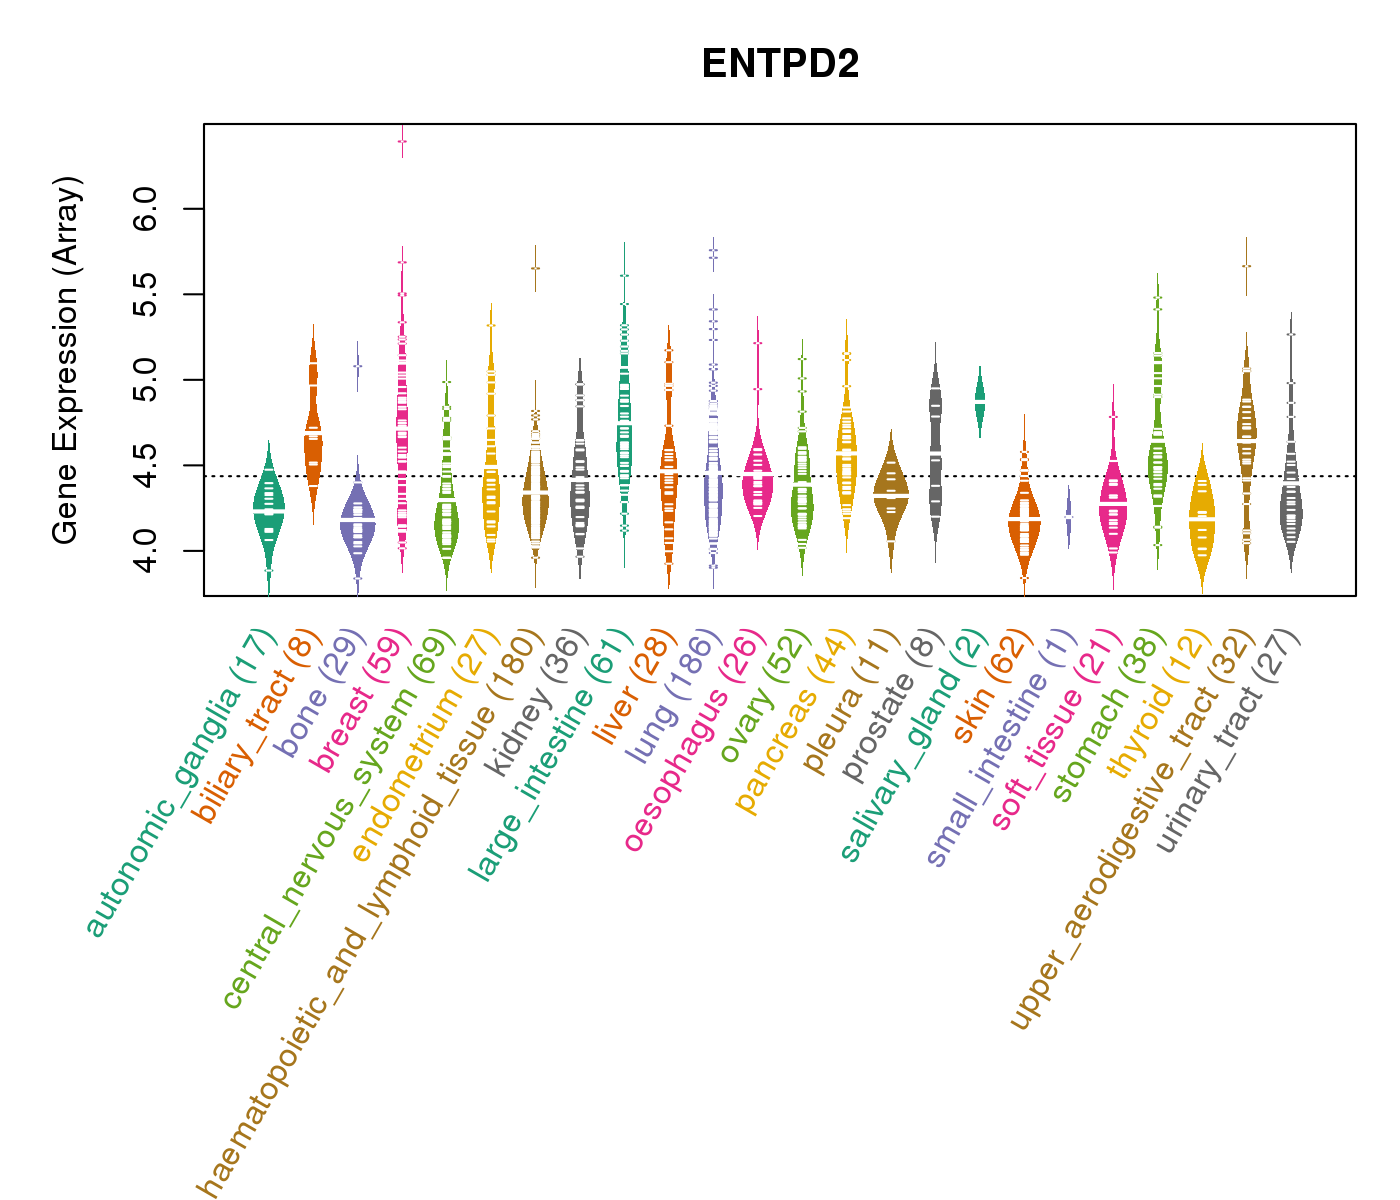
| * CCLE gene expression data were extracted from CCLE_Expression_Entrez_2012-10-18.res: Gene-centric RMA-normalized mRNA expression data. |
 |
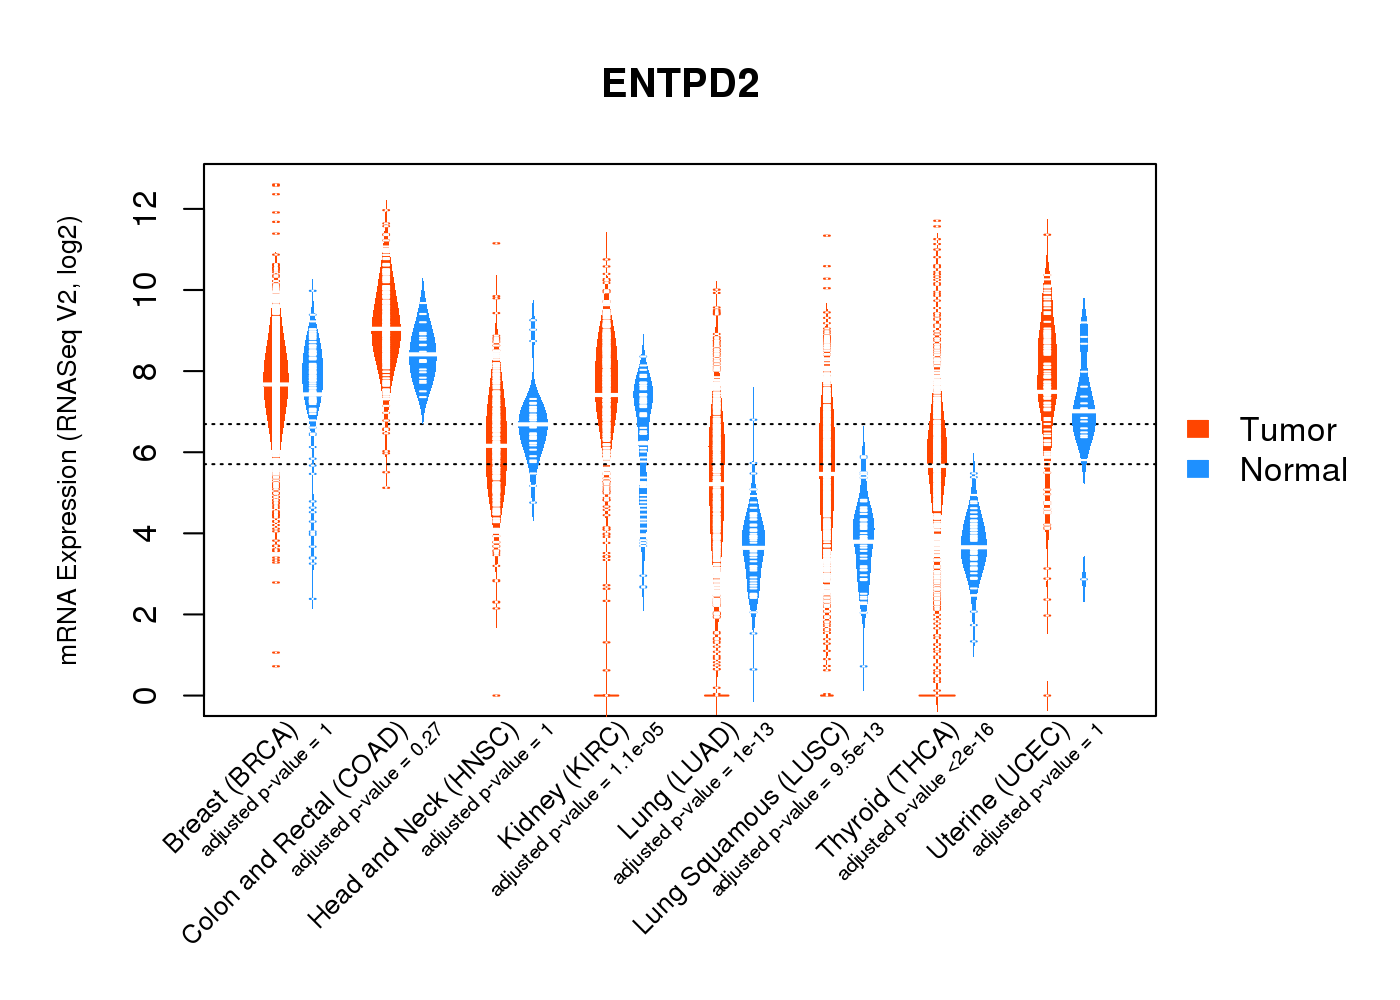
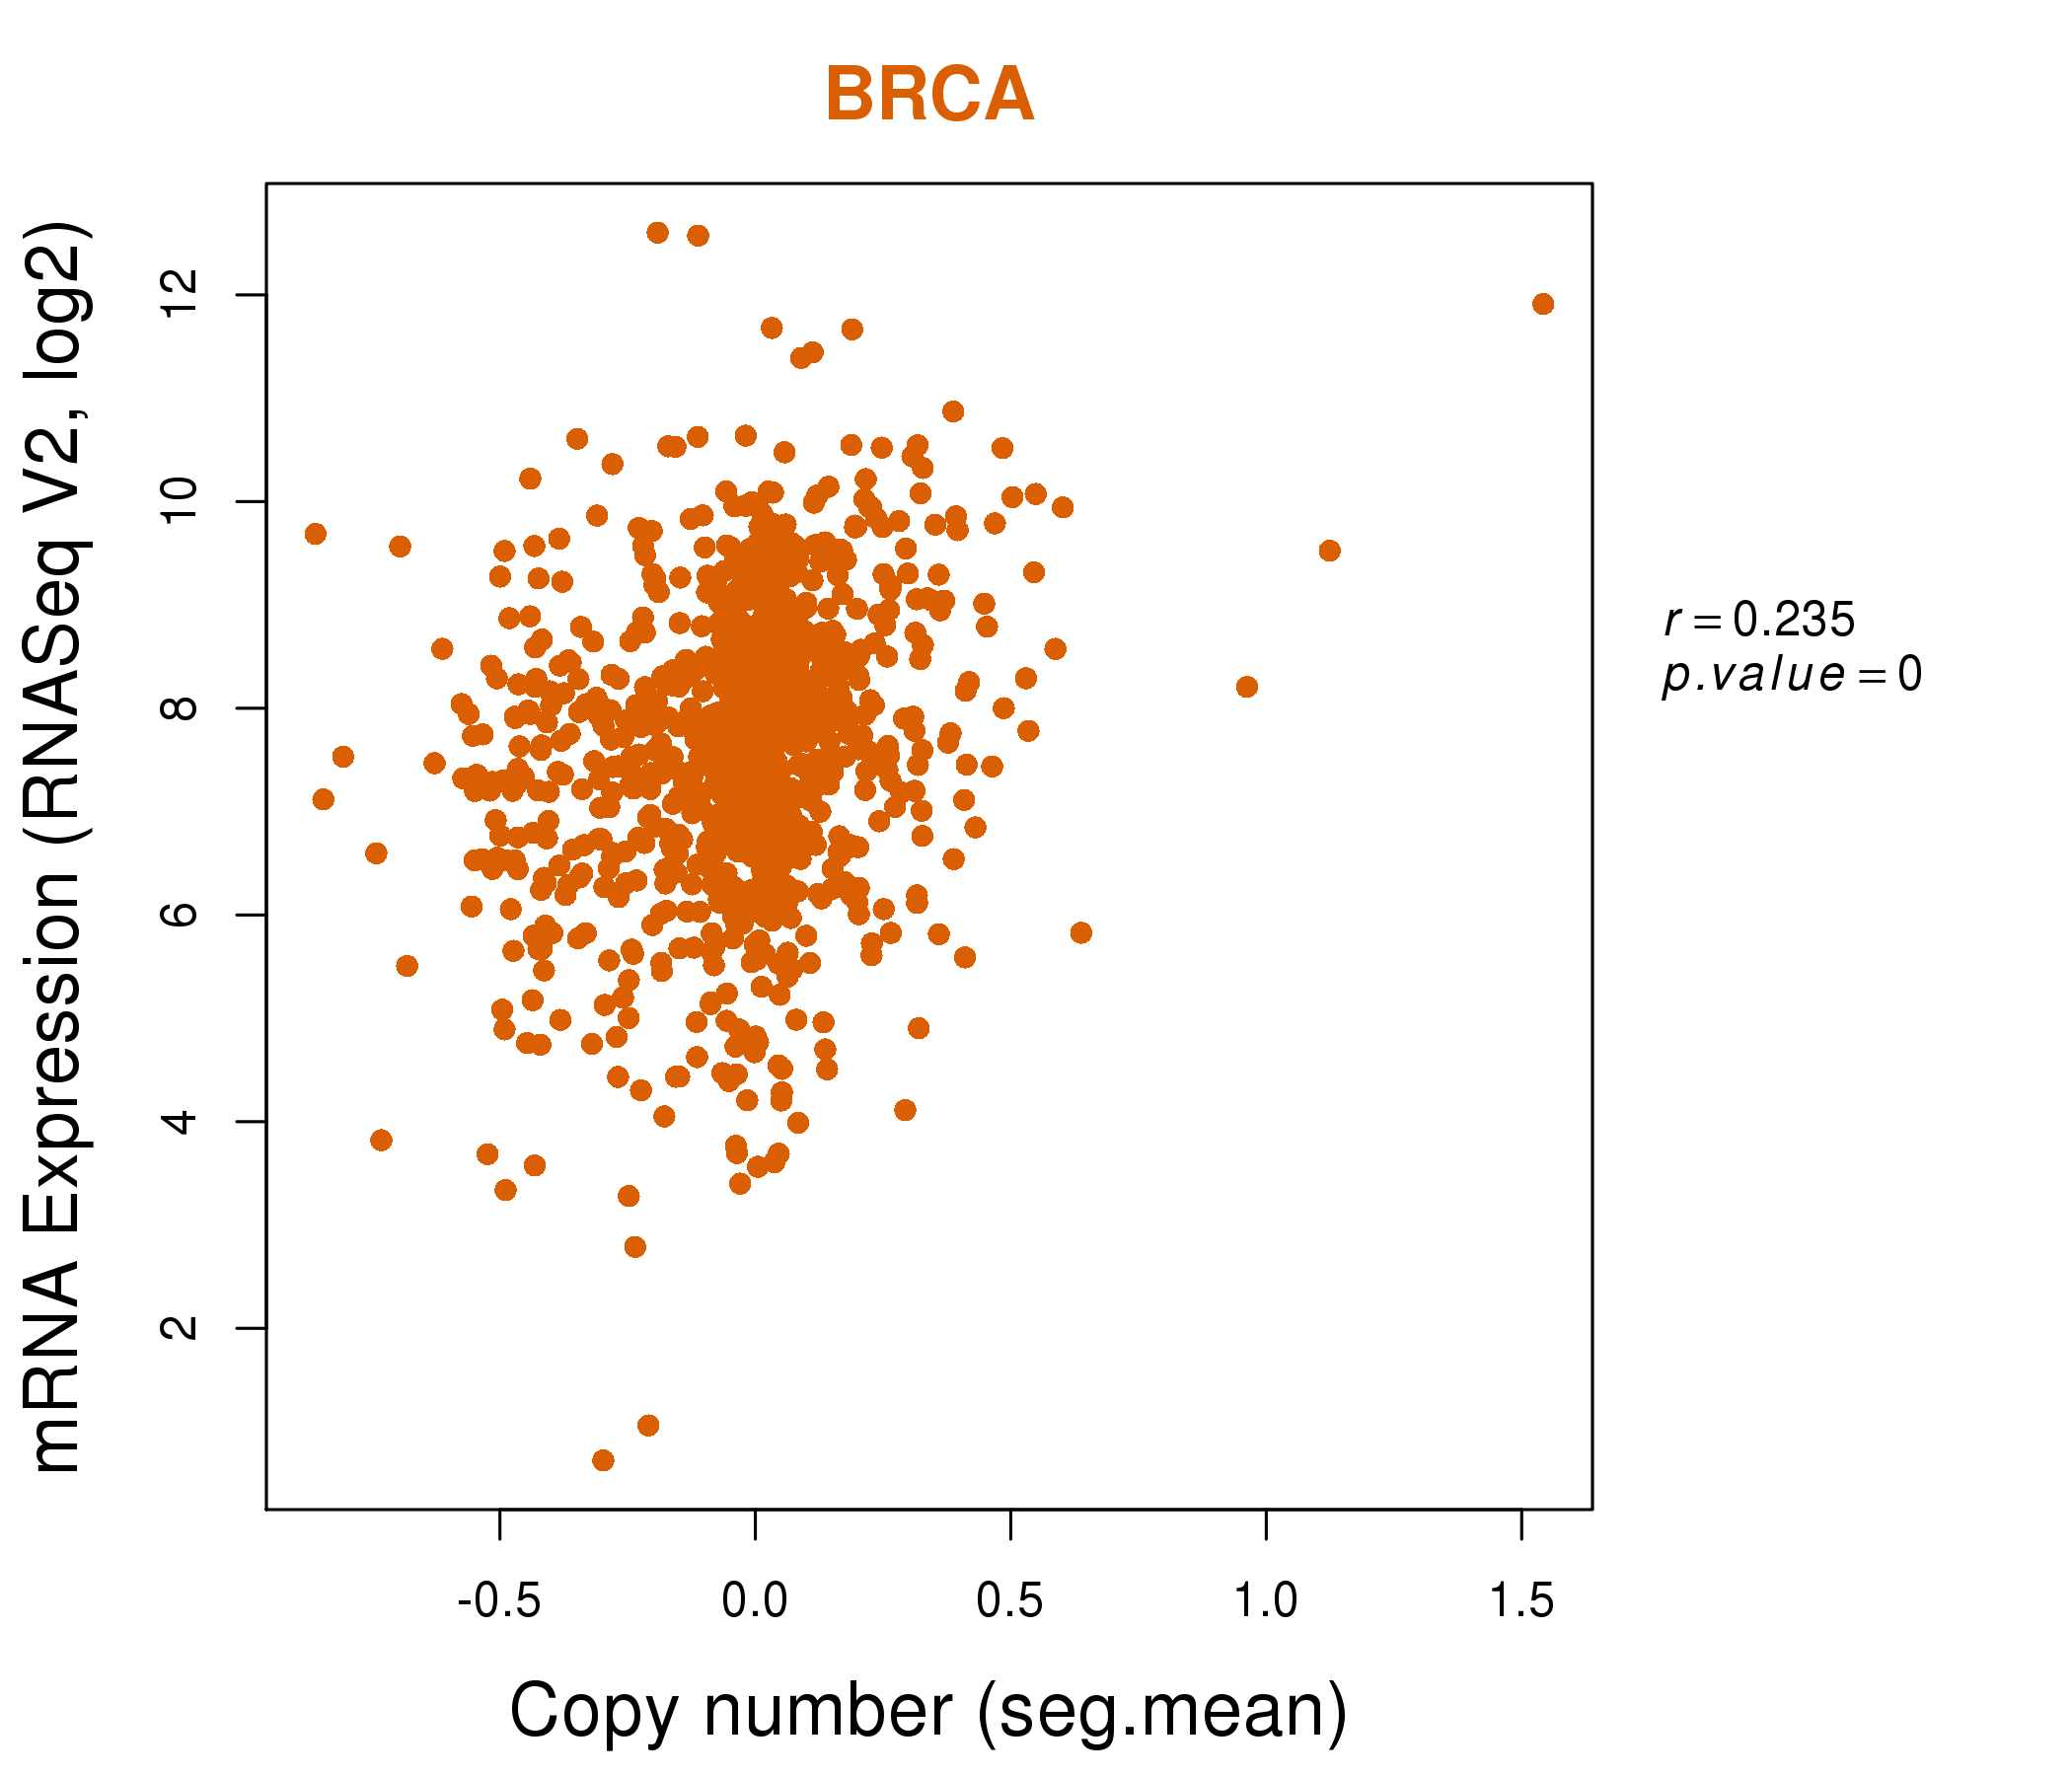
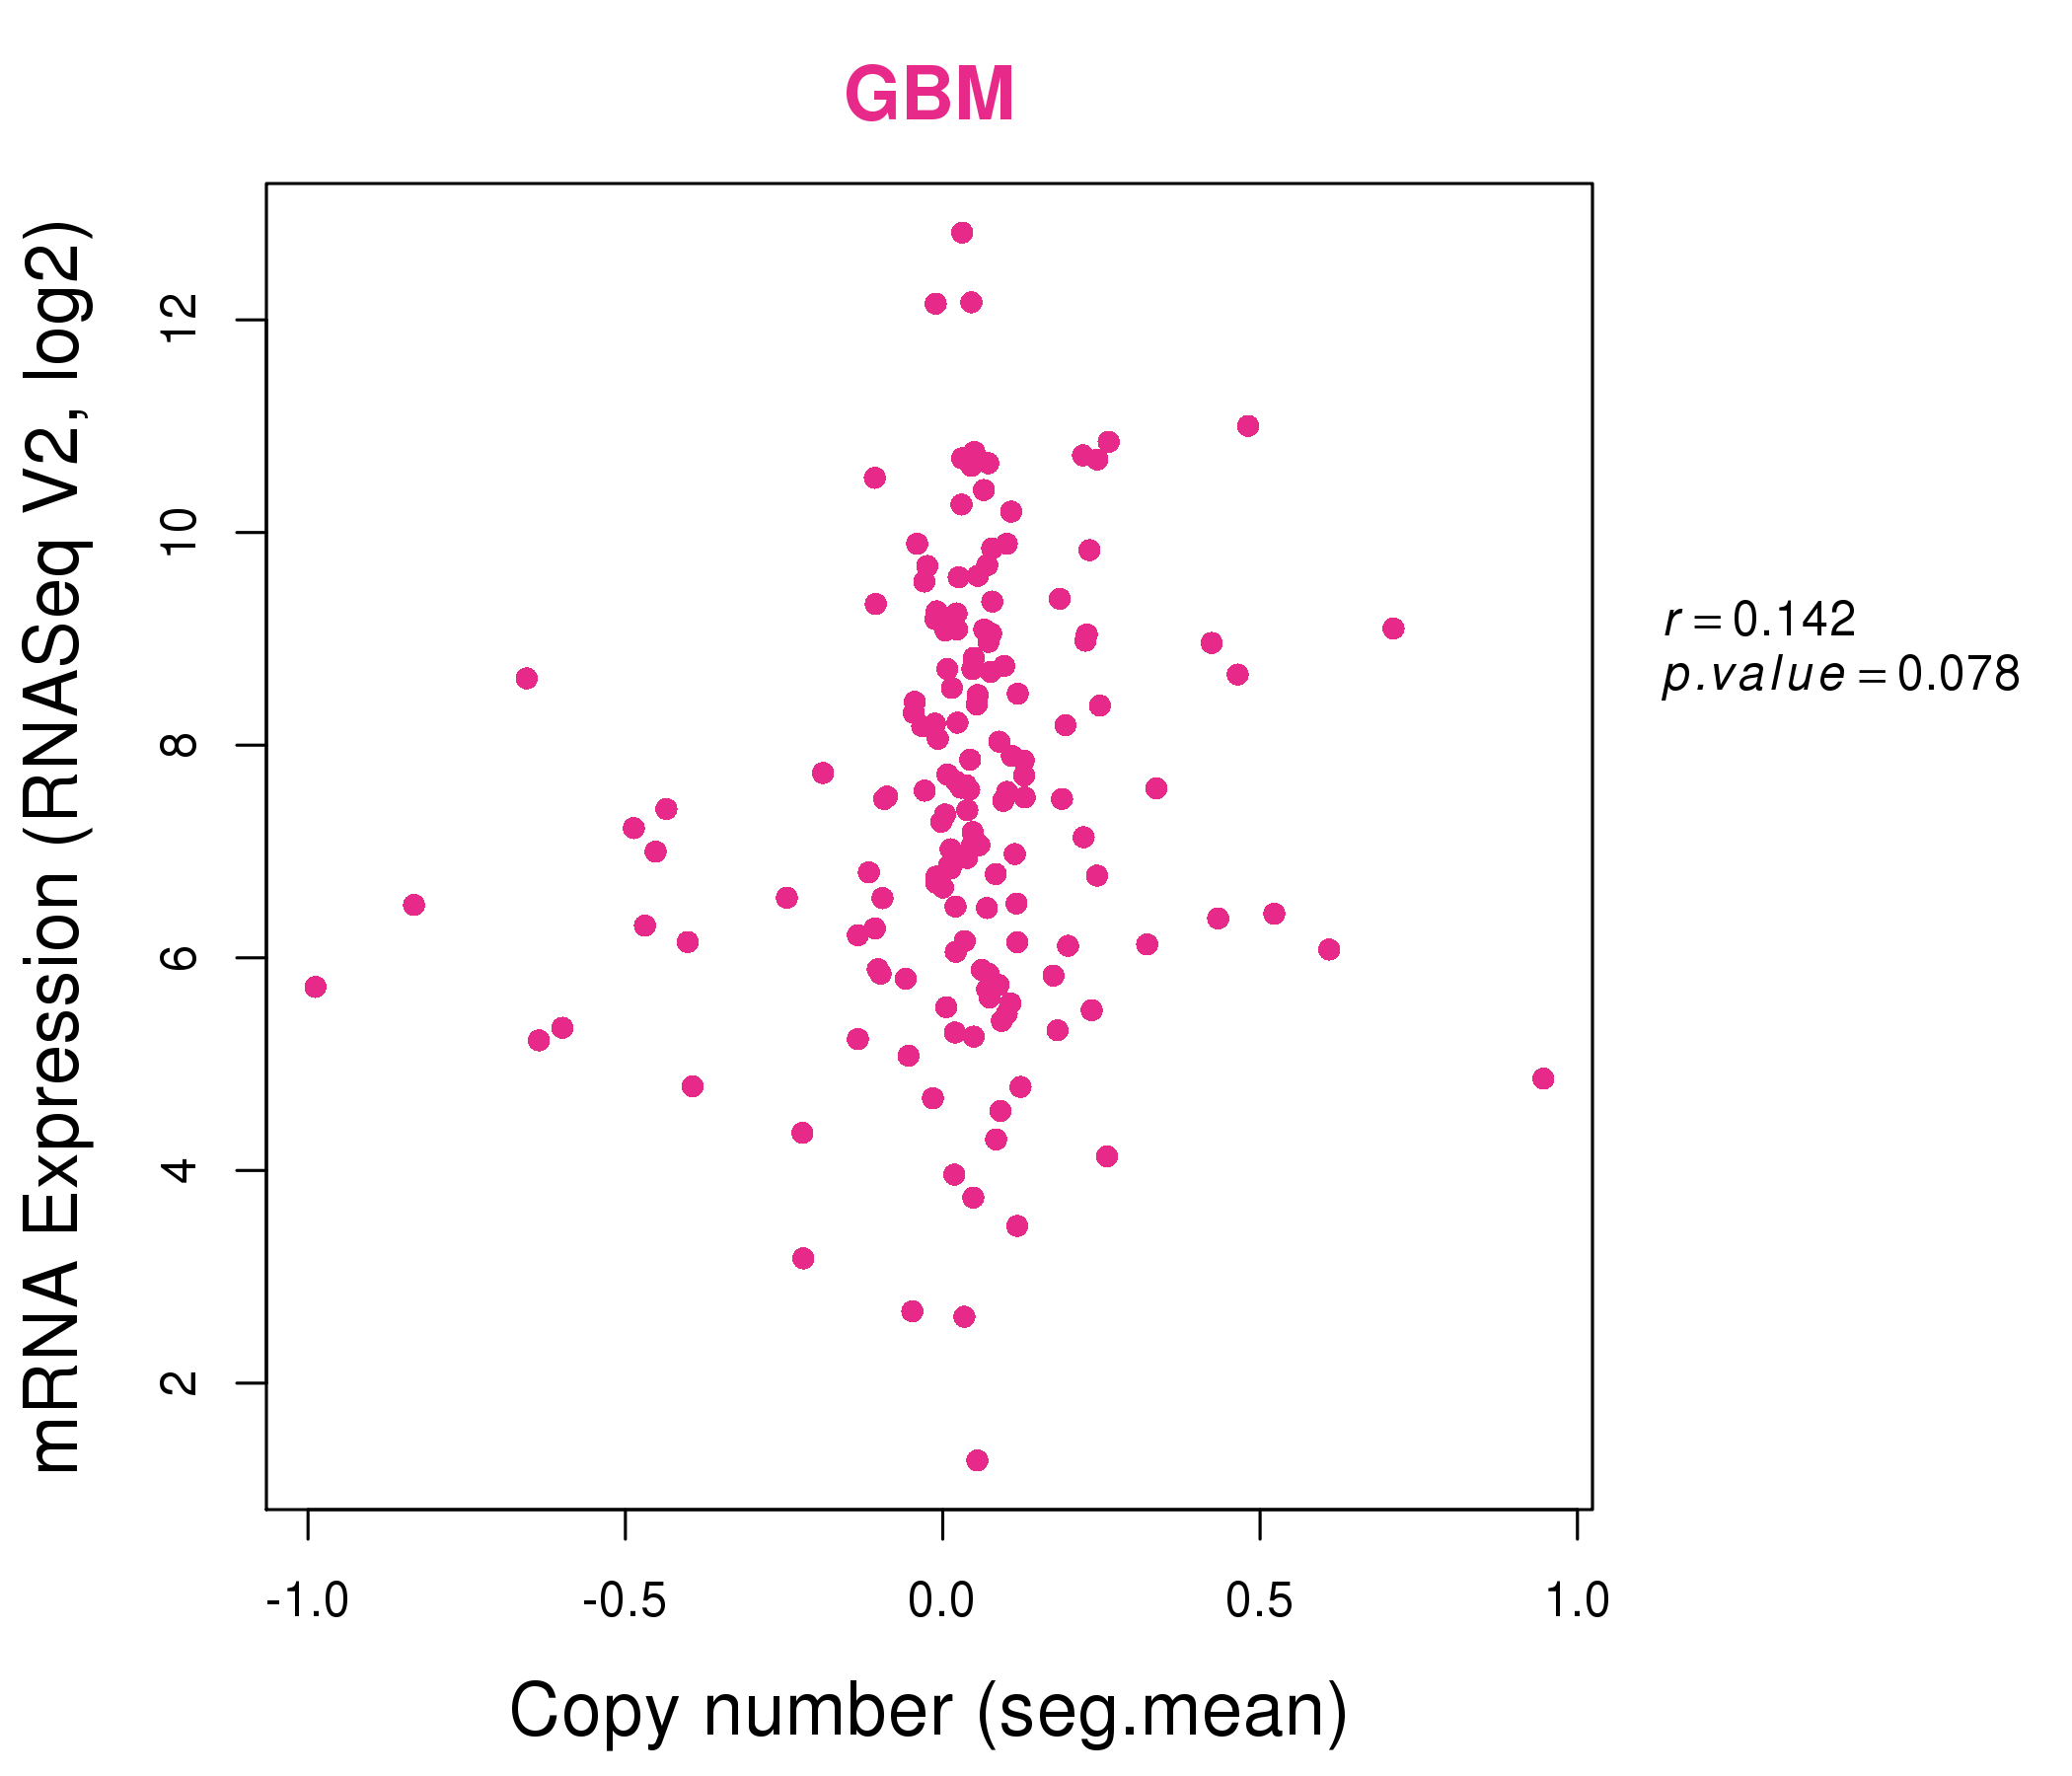
| * Normalized gene expression data of RNASeqV2 was extracted from TCGA using R package TCGA-Assembler. The URLs of all public data files on TCGA DCC data server were gathered at Jan-05-2015. Only eight cancer types have enough normal control samples for differential expression analysis. (t test, adjusted p<0.05 (using Benjamini-Hochberg FDR)) |
 |
| Top |
| * This plots show the correlation between CNV and gene expression. |
: Open all plots for all cancer types
 |
|
 |
|
| Top |
| Gene-Gene Network Information |
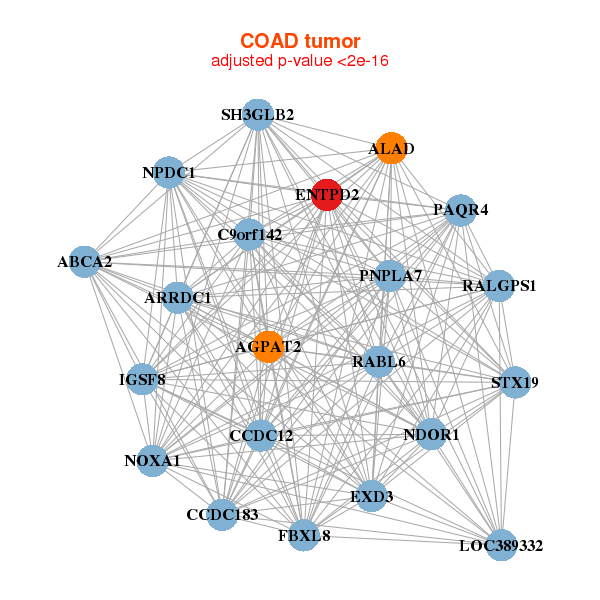
| * Co-Expression network figures were drawn using R package igraph. Only the top 20 genes with the highest correlations were shown. Red circle: input gene, orange circle: cell metabolism gene, sky circle: other gene |
: Open all plots for all cancer types
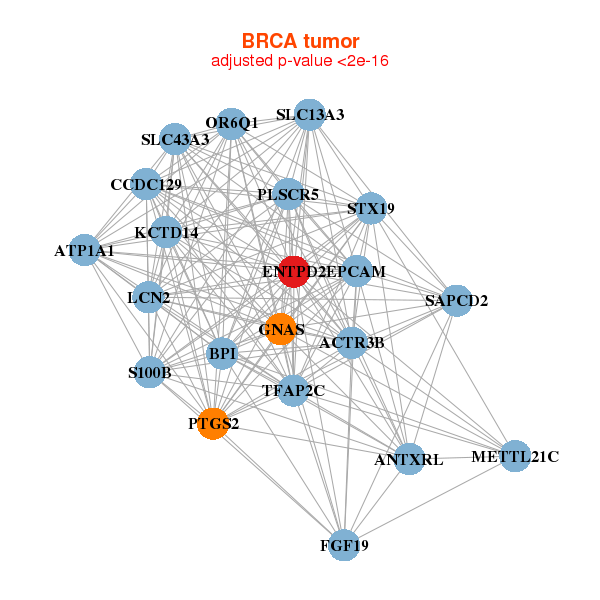 |
|
| ACTR3B,ANTXRL,ATP1A1,BPI,METTL21C,SAPCD2,CCDC129, ENTPD2,EPCAM,FGF19,GNAS,KCTD14,LCN2,OR6Q1, PLSCR5,PTGS2,S100B,SLC13A3,SLC43A3,STX19,TFAP2C | SYNE4,CACFD1,CBLC,ELMO3,ENTPD2,FBXW9,ISYNA1, LOC92659,LPAR2,LSR,MIA,PAFAH1B3,PKP3,PODNL1, PPAP2C,PRRG2,RTKN,SPINT1,STXBP2,SYT12,SYTL1 |
 |
|
| ABCA2,AGPAT2,ALAD,ARRDC1,C9orf142,RABL6,CCDC12, ENTPD2,EXD3,FBXL8,IGSF8,CCDC183,LOC389332,NDOR1, NOXA1,NPDC1,PAQR4,PNPLA7,RALGPS1,SH3GLB2,STX19 | ACSF3,ADPRHL1,ANKH,LMNTD2,C1orf116,RABL6,CLPTM1, ENTPD2,EPN1,GIT1,HDAC10,IGSF8,KIAA0195,PGAP2, POMT1,PRKCSH,RNF128,TMC4,TMEM191A,ZBED1,ZNF784 |
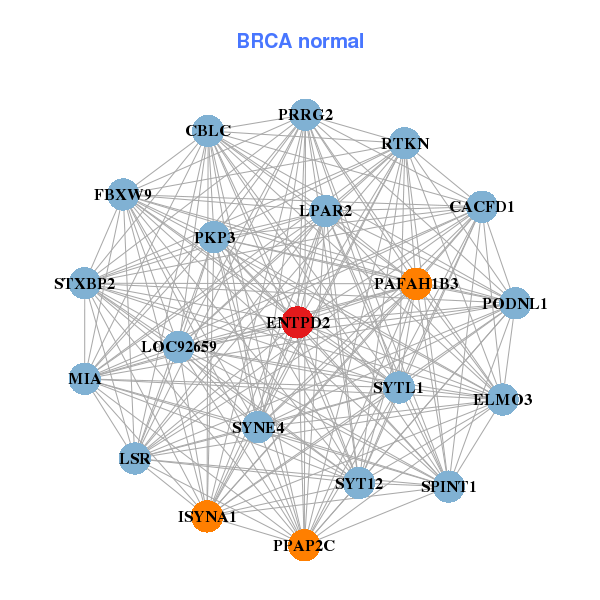
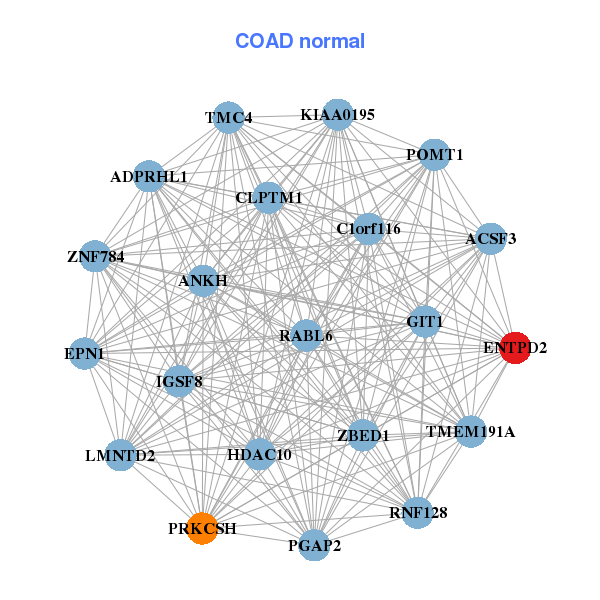
| * Co-Expression network figures were drawn using R package igraph. Only the top 20 genes with the highest correlations were shown. Red circle: input gene, orange circle: cell metabolism gene, sky circle: other gene |
: Open all plots for all cancer types
| Top |
: Open all interacting genes' information including KEGG pathway for all interacting genes from DAVID
| Top |
| Pharmacological Information for ENTPD2 |
| There's no related Drug. |
| Top |
| Cross referenced IDs for ENTPD2 |
| * We obtained these cross-references from Uniprot database. It covers 150 different DBs, 18 categories. http://www.uniprot.org/help/cross_references_section |
: Open all cross reference information
|
Copyright © 2016-Present - The Univsersity of Texas Health Science Center at Houston @ |