|
||||||||||||||||||||||||||||||||||||||||||||||||||||||||||||||||||||||||||||||||||||||||||||||||||||||||||||||||||||||||||||||||||||||||||||||||||||||||||||||||||||||||||||||||||||||||||||||||||||||||||||||||||||||||||||||||||||||||||||||||||||||||||||||||||||||||||||||||||||||||||||||||||||||||||||||||||||||||||
| |
| Phenotypic Information (metabolism pathway, cancer, disease, phenome) |
| |
| |
| Gene-Gene Network Information: Co-Expression Network, Interacting Genes & KEGG |
| |
|


| Gene Summary for MINPP1 |
| Basic gene info. | Gene symbol | MINPP1 |
| Gene name | multiple inositol-polyphosphate phosphatase 1 | |
| Synonyms | HIPER1|MINPP2|MIPP | |
| Cytomap | UCSC genome browser: 10q23 | |
| Genomic location | chr10 :89264222-89313218 | |
| Type of gene | protein-coding | |
| RefGenes | NM_001178117.1, NM_001178118.1,NM_004897.4, | |
| Ensembl id | ENSG00000107789 | |
| Description | 2,3-BPG phosphatase2,3-bisphosphoglycerate 3-phosphataseinositol (1,3,4,5)-tetrakisphosphate 3-phosphataseins(1,3,4,5)P(4) 3-phosphatasemultiple inositol polyphosphate histidine phosphatase, 1multiple inositol polyphosphate phosphatase 1multiple ino | |
| Modification date | 20141207 | |
| dbXrefs | MIM : 605391 | |
| HGNC : HGNC | ||
| Ensembl : ENSG00000107789 | ||
| HPRD : 05652 | ||
| Vega : OTTHUMG00000018678 | ||
| Protein | UniProt: go to UniProt's Cross Reference DB Table | |
| Expression | CleanEX: HS_MINPP1 | |
| BioGPS: 9562 | ||
| Gene Expression Atlas: ENSG00000107789 | ||
| The Human Protein Atlas: ENSG00000107789 | ||
| Pathway | NCI Pathway Interaction Database: MINPP1 | |
| KEGG: MINPP1 | ||
| REACTOME: MINPP1 | ||
| ConsensusPathDB | ||
| Pathway Commons: MINPP1 | ||
| Metabolism | MetaCyc: MINPP1 | |
| HUMANCyc: MINPP1 | ||
| Regulation | Ensembl's Regulation: ENSG00000107789 | |
| miRBase: chr10 :89,264,222-89,313,218 | ||
| TargetScan: NM_001178117 | ||
| cisRED: ENSG00000107789 | ||
| Context | iHOP: MINPP1 | |
| cancer metabolism search in PubMed: MINPP1 | ||
| UCL Cancer Institute: MINPP1 | ||
| Assigned class in ccmGDB | C | |
| Top |
| Phenotypic Information for MINPP1(metabolism pathway, cancer, disease, phenome) |
| Cancer | CGAP: MINPP1 |
| Familial Cancer Database: MINPP1 | |
| * This gene is included in those cancer gene databases. |
|
|
|
|
|
|
| ||||||||||||||||||||||||||||||||||||||||||||||||||||||||||||||||||||||||||||||||||||||||||||||||||||||||||||||||||||||||||||||||||||||||||||||||||||||||||||||||||||||||||||||||||||||||||||||||||||||||||||||||||||||||||||||||||||||||||||||||||||||||||||||||||||||||||||||||||||||||||||||||||||||||||||||||||||
Oncogene 1 | Significant driver gene in | |||||||||||||||||||||||||||||||||||||||||||||||||||||||||||||||||||||||||||||||||||||||||||||||||||||||||||||||||||||||||||||||||||||||||||||||||||||||||||||||||||||||||||||||||||||||||||||||||||||||||||||||||||||||||||||||||||||||||||||||||||||||||||||||||||||||||||||||||||||||||||||||||||||||||||||||||||||||||
| cf) number; DB name 1 Oncogene; http://nar.oxfordjournals.org/content/35/suppl_1/D721.long, 2 Tumor Suppressor gene; https://bioinfo.uth.edu/TSGene/, 3 Cancer Gene Census; http://www.nature.com/nrc/journal/v4/n3/abs/nrc1299.html, 4 CancerGenes; http://nar.oxfordjournals.org/content/35/suppl_1/D721.long, 5 Network of Cancer Gene; http://ncg.kcl.ac.uk/index.php, 1Therapeutic Vulnerabilities in Cancer; http://cbio.mskcc.org/cancergenomics/statius/ |
| KEGG_INOSITOL_PHOSPHATE_METABOLISM | |
| OMIM | |
| Orphanet | |
| Disease | KEGG Disease: MINPP1 |
| MedGen: MINPP1 (Human Medical Genetics with Condition) | |
| ClinVar: MINPP1 | |
| Phenotype | MGI: MINPP1 (International Mouse Phenotyping Consortium) |
| PhenomicDB: MINPP1 | |
| Mutations for MINPP1 |
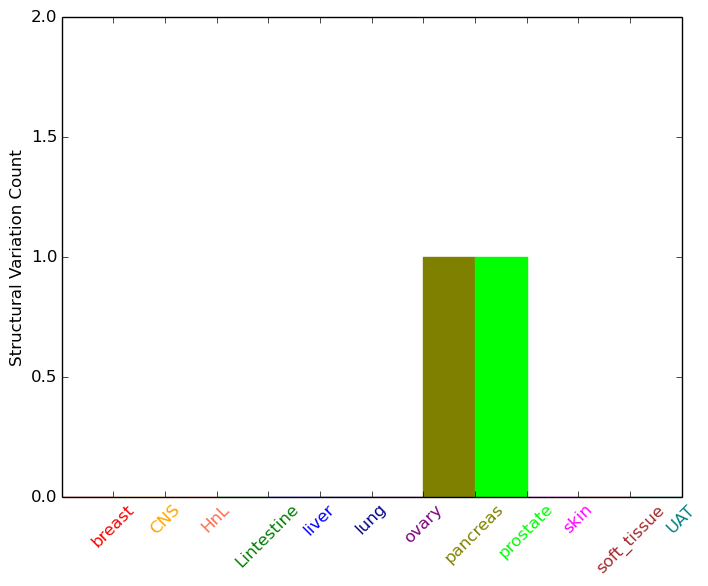
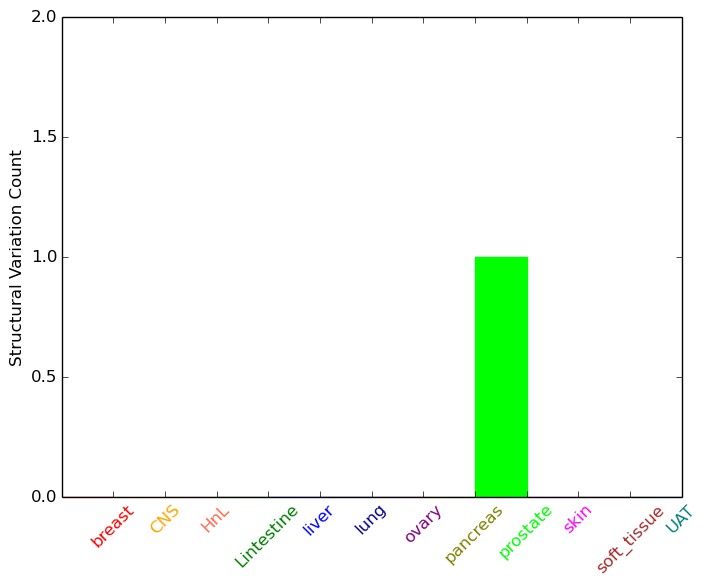
| * Under tables are showing count per each tissue to give us broad intuition about tissue specific mutation patterns.You can go to the detailed page for each mutation database's web site. |
| - Statistics for Tissue and Mutation type | Top |
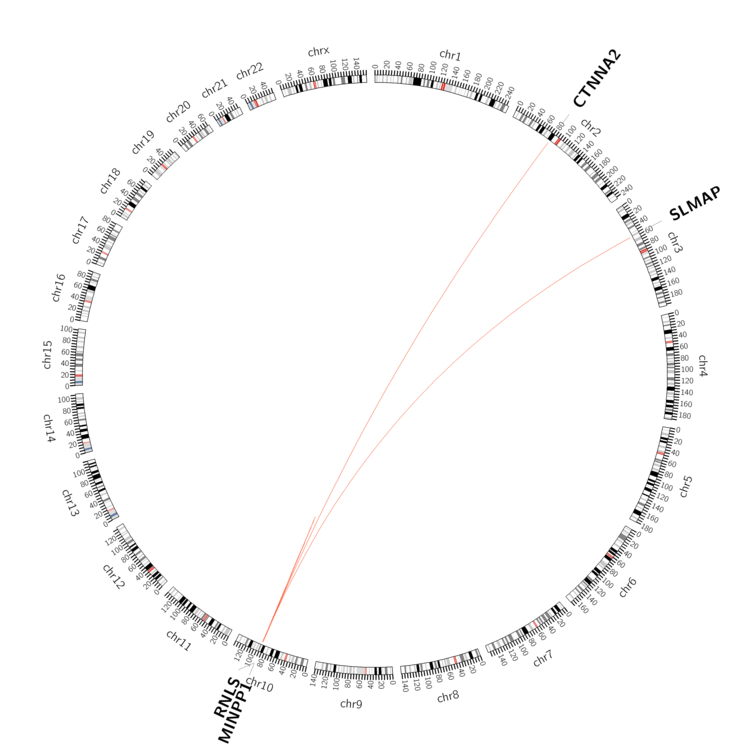 |
| - For Inter-chromosomal Variations |
| * Inter-chromosomal variantions includes 'interchromosomal amplicon to amplicon', 'interchromosomal amplicon to non-amplified dna', 'interchromosomal insertion', 'Interchromosomal unknown type'. |
 |
| - For Intra-chromosomal Variations |
| * Intra-chromosomal variantions includes 'intrachromosomal amplicon to amplicon', 'intrachromosomal amplicon to non-amplified dna', 'intrachromosomal deletion', 'intrachromosomal fold-back inversion', 'intrachromosomal inversion', 'intrachromosomal tandem duplication', 'Intrachromosomal unknown type', 'intrachromosomal with inverted orientation', 'intrachromosomal with non-inverted orientation'. |
 |
| Sample | Symbol_a | Chr_a | Start_a | End_a | Symbol_b | Chr_b | Start_b | End_b |
| prostate | MINPP1 | chr10 | 89277832 | 89279832 | RNLS | chr10 | 90299963 | 90301963 |
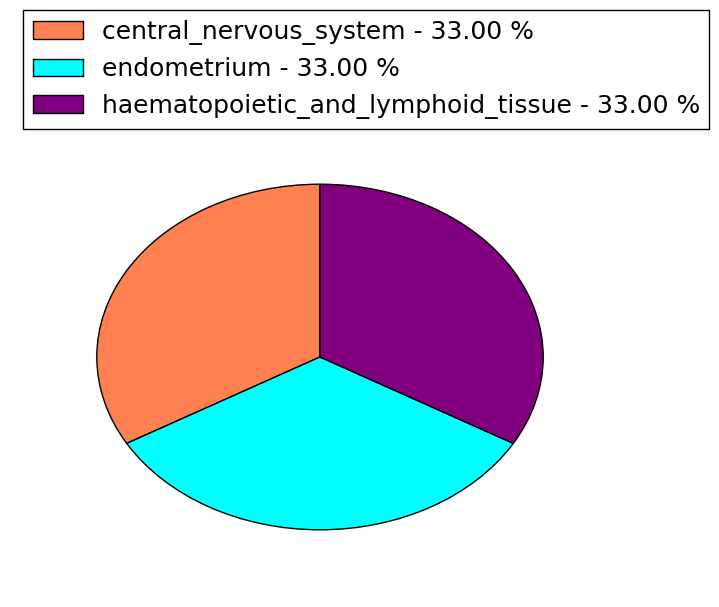
| cf) Tissue number; Tissue name (1;Breast, 2;Central_nervous_system, 3;Haematopoietic_and_lymphoid_tissue, 4;Large_intestine, 5;Liver, 6;Lung, 7;Ovary, 8;Pancreas, 9;Prostate, 10;Skin, 11;Soft_tissue, 12;Upper_aerodigestive_tract) |
| * From mRNA Sanger sequences, Chitars2.0 arranged chimeric transcripts. This table shows MINPP1 related fusion information. |
| ID | Head Gene | Tail Gene | Accession | Gene_a | qStart_a | qEnd_a | Chromosome_a | tStart_a | tEnd_a | Gene_a | qStart_a | qEnd_a | Chromosome_a | tStart_a | tEnd_a |
| AW946996 | OSBPL8 | 16 | 126 | 12 | 76767139 | 76769091 | MINPP1 | 112 | 185 | 10 | 89294320 | 89294393 | |
| Top |
| Mutation type/ Tissue ID | brca | cns | cerv | endome | haematopo | kidn | Lintest | liver | lung | ns | ovary | pancre | prost | skin | stoma | thyro | urina | |||
| Total # sample | 1 | 3 | 2 | 2 | ||||||||||||||||
| GAIN (# sample) | ||||||||||||||||||||
| LOSS (# sample) | 1 | 3 | 2 | 2 |
| cf) Tissue ID; Tissue type (1; Breast, 2; Central_nervous_system, 3; Cervix, 4; Endometrium, 5; Haematopoietic_and_lymphoid_tissue, 6; Kidney, 7; Large_intestine, 8; Liver, 9; Lung, 10; NS, 11; Ovary, 12; Pancreas, 13; Prostate, 14; Skin, 15; Stomach, 16; Thyroid, 17; Urinary_tract) |
| Top |
|
 |
| Top |
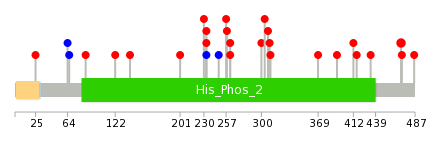
| Stat. for Non-Synonymous SNVs (# total SNVs=18) | (# total SNVs=3) |
 |  |
(# total SNVs=1) | (# total SNVs=0) |
 |
| Top |
| * When you move the cursor on each content, you can see more deailed mutation information on the Tooltip. Those are primary_site,primary_histology,mutation(aa),pubmedID. |
| GRCh37 position | Mutation(aa) | Unique sampleID count |
| chr10:89268239-89268239 | p.L262I | 1 |
| chr10:89311946-89311946 | p.A392V | 1 |
| chr10:89265273-89265273 | p.H201Y | 1 |
| chr10:89268241-89268241 | p.L262F | 1 |
| chr10:89312005-89312005 | p.A412T | 1 |
| chr10:89268084-89268084 | p.? | 1 |
| chr10:89272873-89272873 | p.? | 1 |
| chr10:89312018-89312018 | p.I416R | 1 |
| chr10:89268092-89268092 | p.? | 1 |
| chr10:89272943-89272943 | p.P300S | 1 |
| Top |
|
 |
| Point Mutation/ Tissue ID | 1 | 2 | 3 | 4 | 5 | 6 | 7 | 8 | 9 | 10 | 11 | 12 | 13 | 14 | 15 | 16 | 17 | 18 | 19 | 20 |
| # sample | 1 | 5 | 1 | 1 | 1 | 1 | 4 | 4 | ||||||||||||
| # mutation | 1 | 5 | 1 | 1 | 1 | 1 | 4 | 4 | ||||||||||||
| nonsynonymous SNV | 1 | 5 | 1 | 1 | 4 | 3 | ||||||||||||||
| synonymous SNV | 1 | 1 | 1 |
| cf) Tissue ID; Tissue type (1; BLCA[Bladder Urothelial Carcinoma], 2; BRCA[Breast invasive carcinoma], 3; CESC[Cervical squamous cell carcinoma and endocervical adenocarcinoma], 4; COAD[Colon adenocarcinoma], 5; GBM[Glioblastoma multiforme], 6; Glioma Low Grade, 7; HNSC[Head and Neck squamous cell carcinoma], 8; KICH[Kidney Chromophobe], 9; KIRC[Kidney renal clear cell carcinoma], 10; KIRP[Kidney renal papillary cell carcinoma], 11; LAML[Acute Myeloid Leukemia], 12; LUAD[Lung adenocarcinoma], 13; LUSC[Lung squamous cell carcinoma], 14; OV[Ovarian serous cystadenocarcinoma ], 15; PAAD[Pancreatic adenocarcinoma], 16; PRAD[Prostate adenocarcinoma], 17; SKCM[Skin Cutaneous Melanoma], 18:STAD[Stomach adenocarcinoma], 19:THCA[Thyroid carcinoma], 20:UCEC[Uterine Corpus Endometrial Carcinoma]) |
| Top |
| * We represented just top 10 SNVs. When you move the cursor on each content, you can see more deailed mutation information on the Tooltip. Those are primary_site, primary_histology, mutation(aa), pubmedID. |
| Genomic Position | Mutation(aa) | Unique sampleID count |
| chr10:89312018 | p.S98Y,MINPP1 | 1 |
| chr10:89268152 | p.V103D,MINPP1 | 1 |
| chr10:89312069 | p.D107Y,MINPP1 | 1 |
| chr10:89268199 | p.D107V,MINPP1 | 1 |
| chr10:89312182 | p.K110Q,MINPP1 | 1 |
| chr10:89268226 | p.V292L,MINPP1 | 1 |
| chr10:89272941 | p.A191V,MINPP1 | 1 |
| chr10:89272956 | p.I215R,MINPP1 | 1 |
| chr10:89264702 | p.R10R,MINPP1 | 1 |
| chr10:89272967 | p.R232Q,MINPP1 | 1 |
| * Copy number data were extracted from TCGA using R package TCGA-Assembler. The URLs of all public data files on TCGA DCC data server were gathered on Jan-05-2015. Function ProcessCNAData in TCGA-Assembler package was used to obtain gene-level copy number value which is calculated as the average copy number of the genomic region of a gene. |
 |
| cf) Tissue ID[Tissue type]: BLCA[Bladder Urothelial Carcinoma], BRCA[Breast invasive carcinoma], CESC[Cervical squamous cell carcinoma and endocervical adenocarcinoma], COAD[Colon adenocarcinoma], GBM[Glioblastoma multiforme], Glioma Low Grade, HNSC[Head and Neck squamous cell carcinoma], KICH[Kidney Chromophobe], KIRC[Kidney renal clear cell carcinoma], KIRP[Kidney renal papillary cell carcinoma], LAML[Acute Myeloid Leukemia], LUAD[Lung adenocarcinoma], LUSC[Lung squamous cell carcinoma], OV[Ovarian serous cystadenocarcinoma ], PAAD[Pancreatic adenocarcinoma], PRAD[Prostate adenocarcinoma], SKCM[Skin Cutaneous Melanoma], STAD[Stomach adenocarcinoma], THCA[Thyroid carcinoma], UCEC[Uterine Corpus Endometrial Carcinoma] |
| Top |
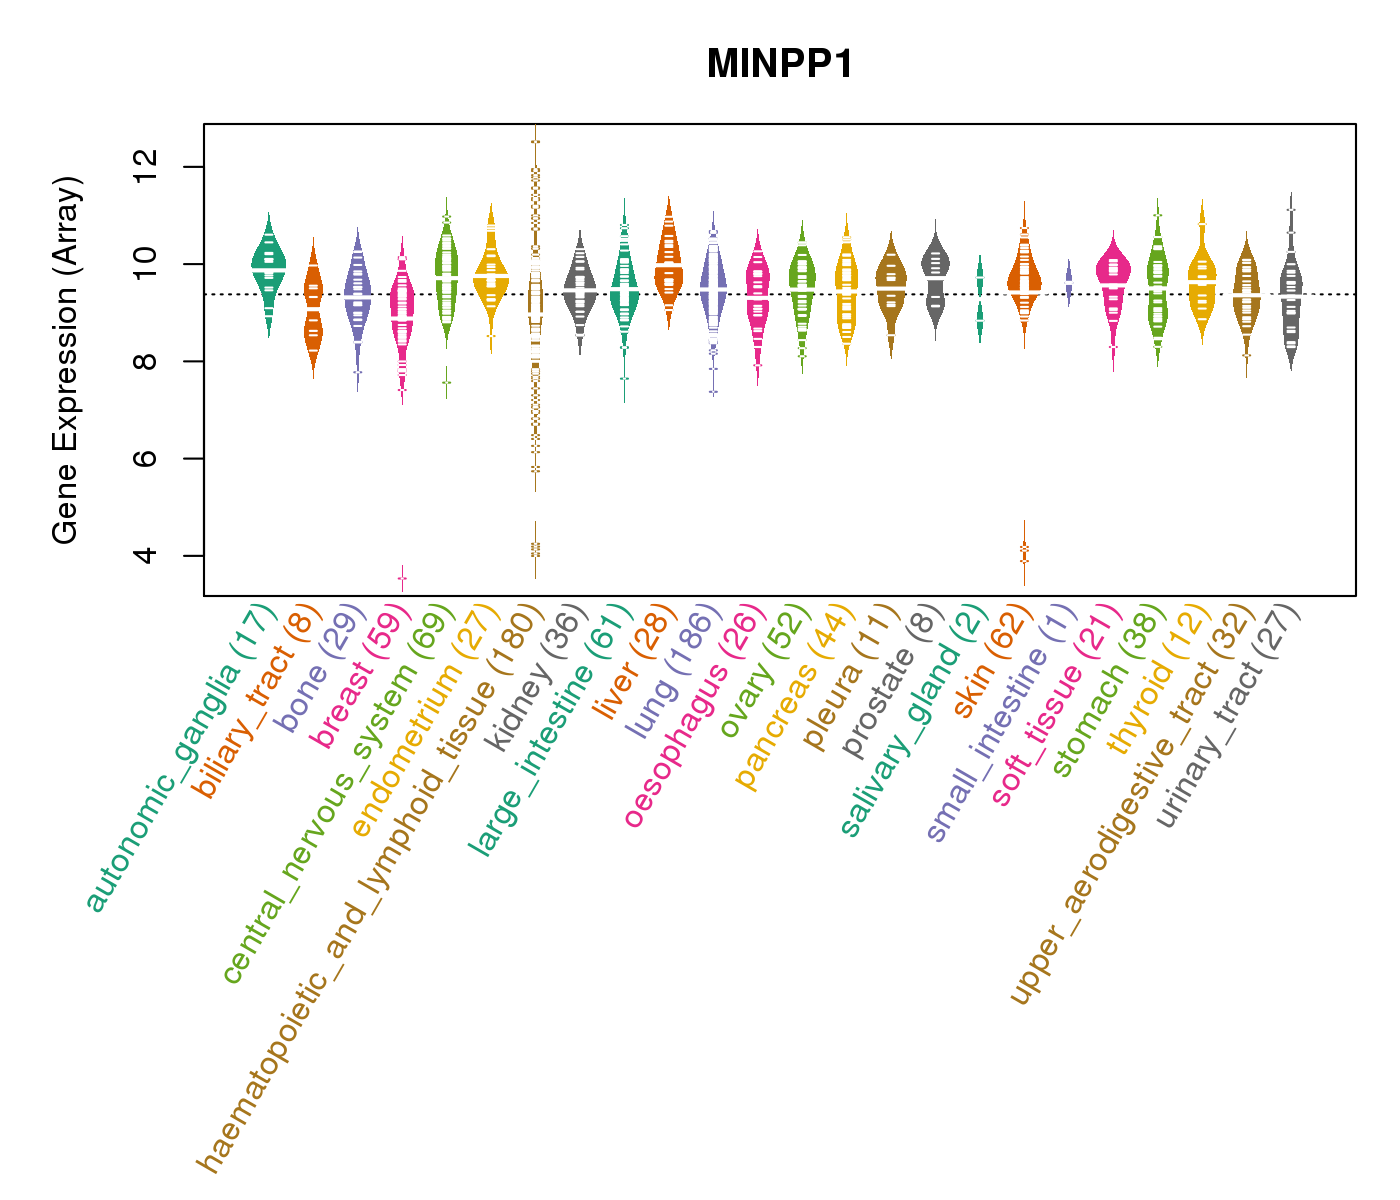
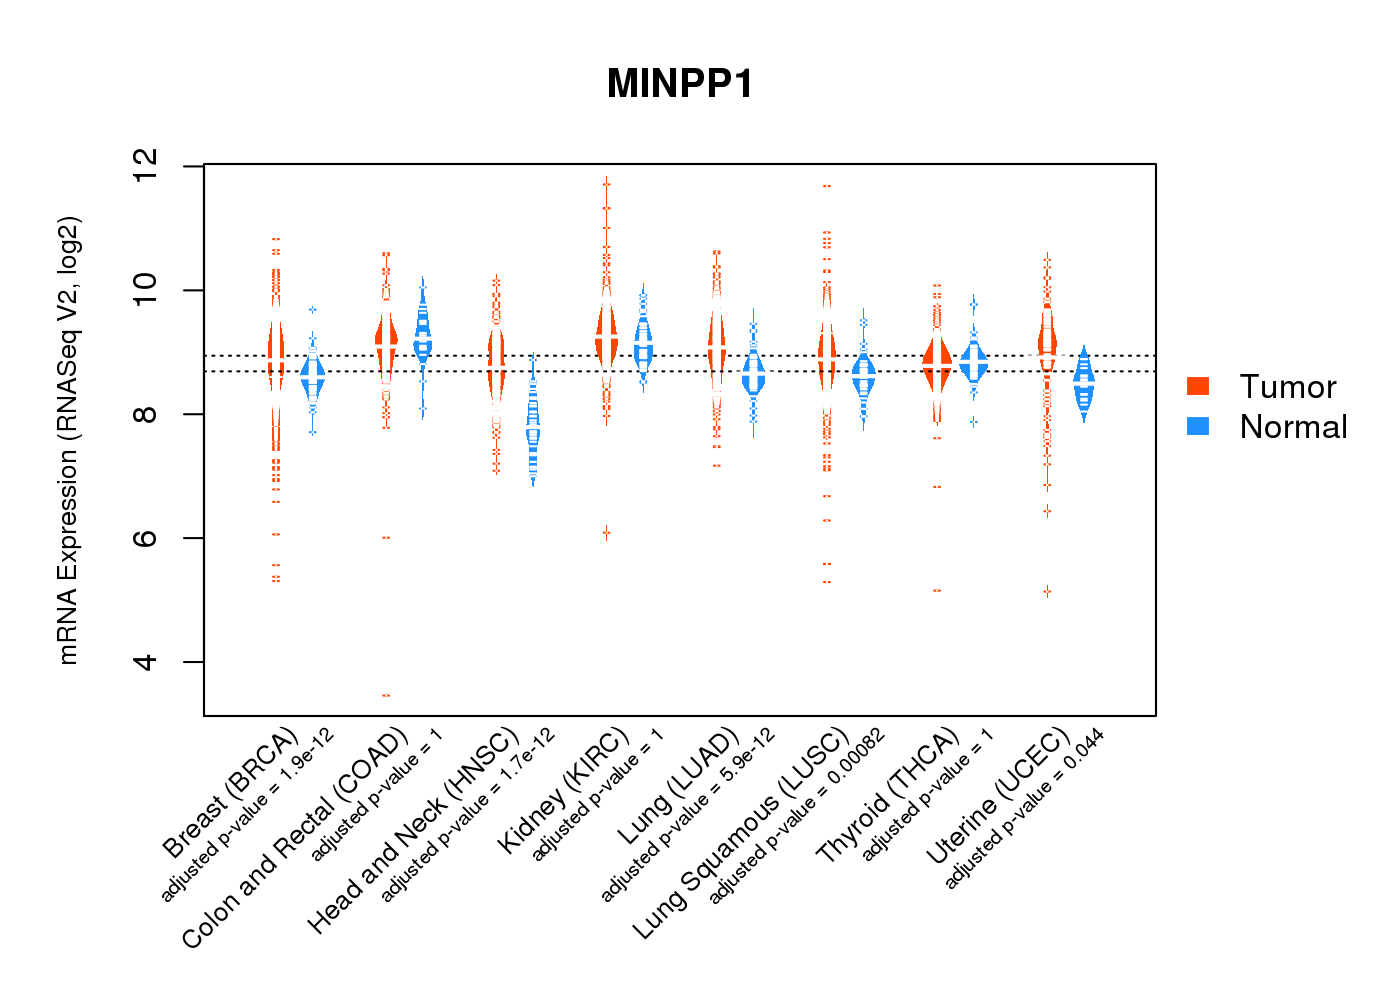
| Gene Expression for MINPP1 |
| * CCLE gene expression data were extracted from CCLE_Expression_Entrez_2012-10-18.res: Gene-centric RMA-normalized mRNA expression data. |
 |
| * Normalized gene expression data of RNASeqV2 was extracted from TCGA using R package TCGA-Assembler. The URLs of all public data files on TCGA DCC data server were gathered at Jan-05-2015. Only eight cancer types have enough normal control samples for differential expression analysis. (t test, adjusted p<0.05 (using Benjamini-Hochberg FDR)) |
 |
| Top |
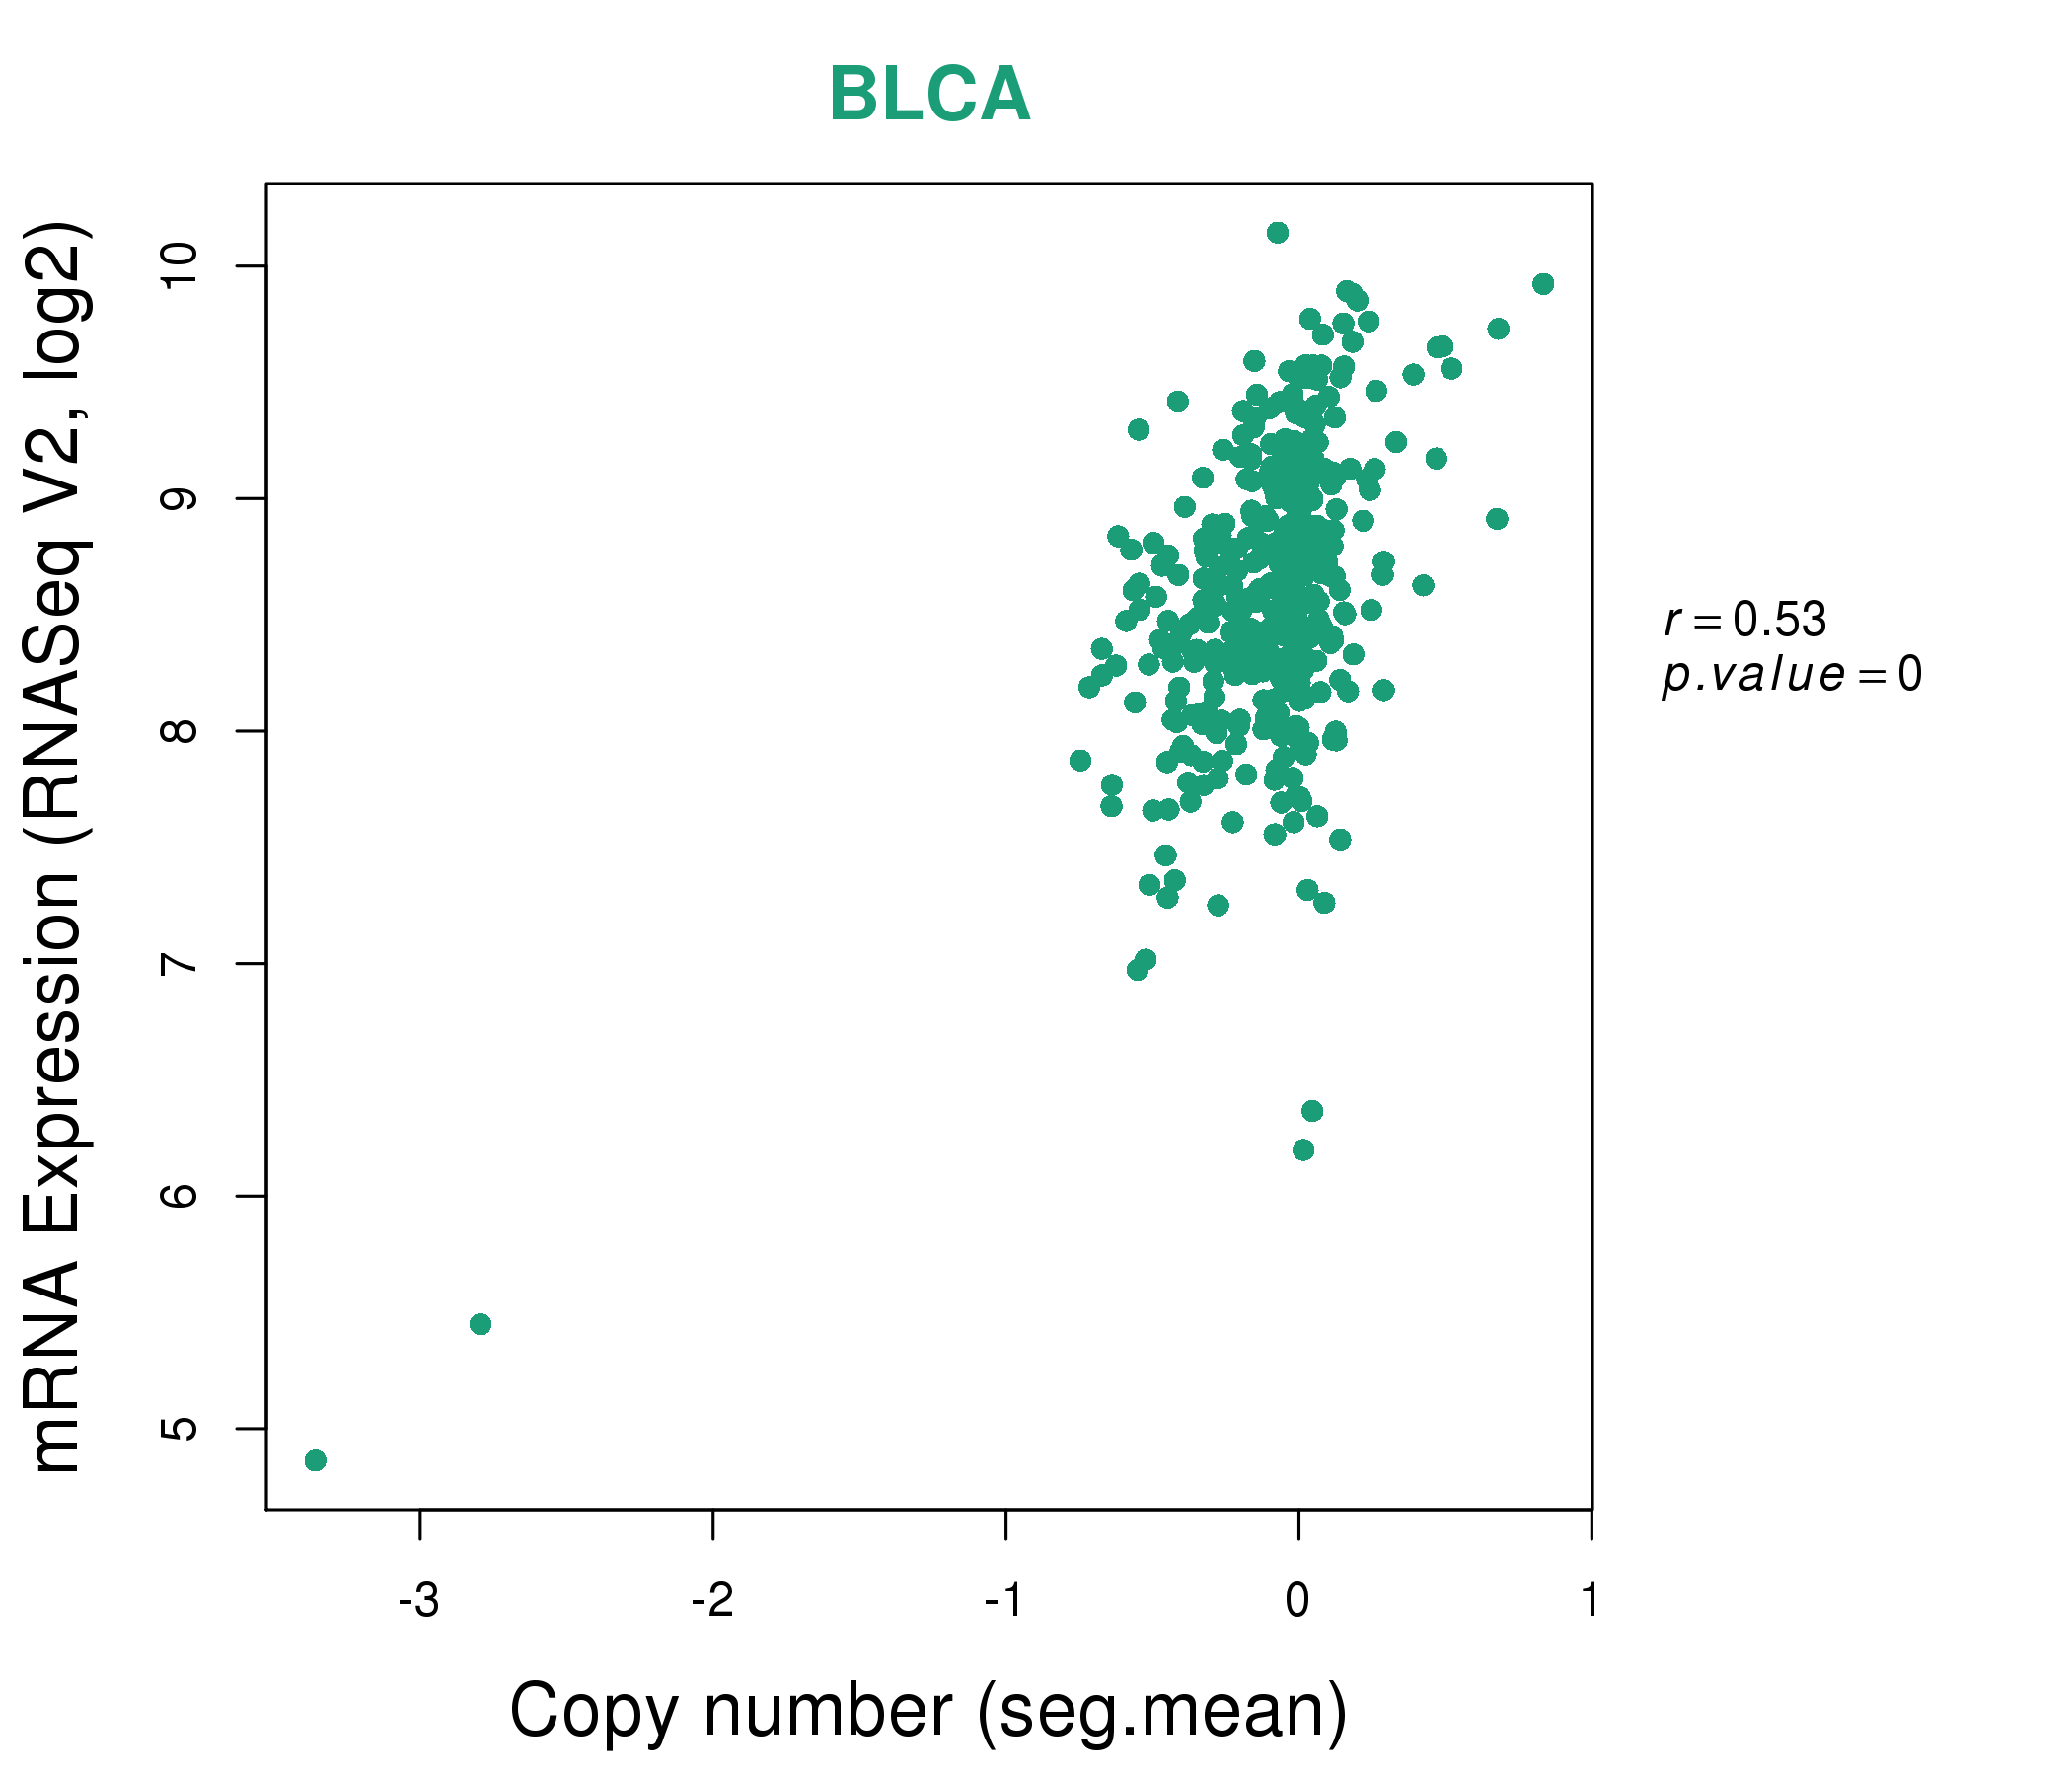
| * This plots show the correlation between CNV and gene expression. |
: Open all plots for all cancer types
 |
|
 |
|


| Top |
| Gene-Gene Network Information |
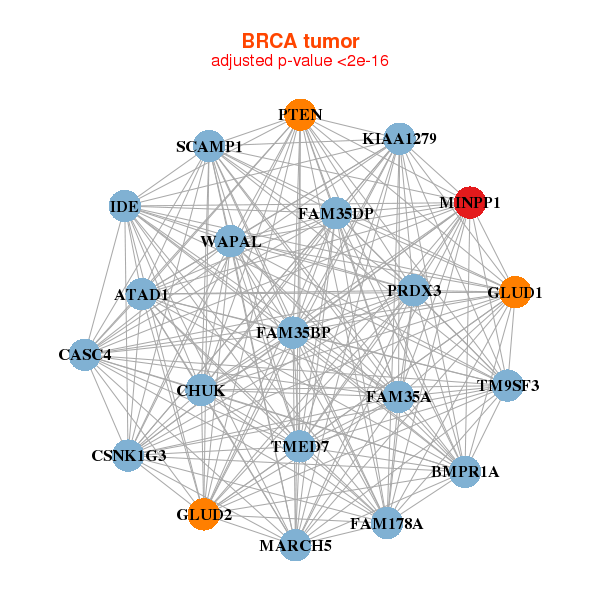
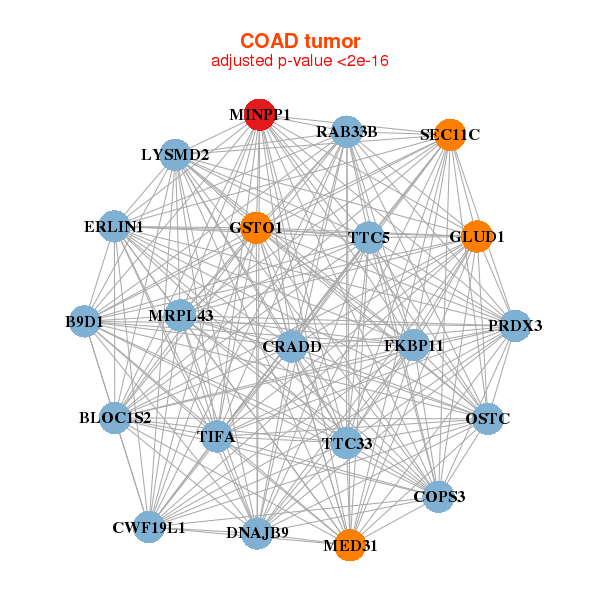
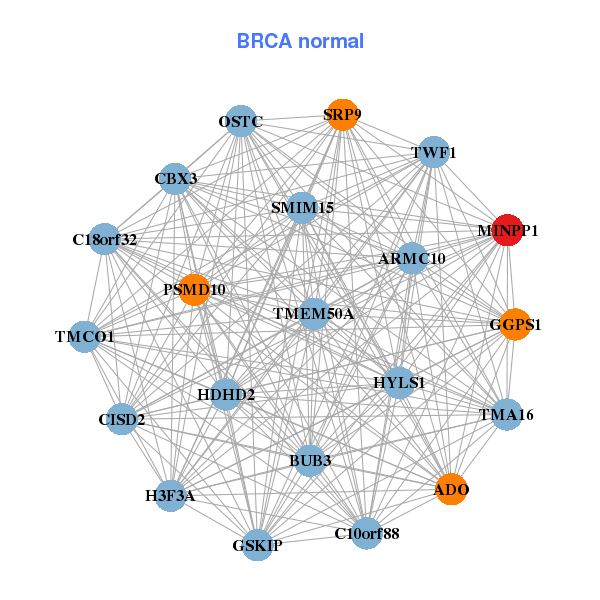
| * Co-Expression network figures were drawn using R package igraph. Only the top 20 genes with the highest correlations were shown. Red circle: input gene, orange circle: cell metabolism gene, sky circle: other gene |
: Open all plots for all cancer types
 |
|
| ATAD1,BMPR1A,CASC4,CHUK,CSNK1G3,FAM178A,FAM35A, FAM35DP,FAM35BP,GLUD1,GLUD2,IDE,KIAA1279,MARCH5, MINPP1,PRDX3,PTEN,SCAMP1,TM9SF3,TMED7,WAPAL | ADO,ARMC10,BUB3,C10orf88,GSKIP,C18orf32,TMA16, SMIM15,CBX3,CISD2,GGPS1,H3F3A,HDHD2,HYLS1, MINPP1,OSTC,PSMD10,SRP9,TMCO1,TMEM50A,TWF1 |
 |
|
| B9D1,BLOC1S2,COPS3,CRADD,CWF19L1,DNAJB9,ERLIN1, FKBP11,GLUD1,GSTO1,LYSMD2,MED31,MINPP1,MRPL43, OSTC,PRDX3,RAB33B,SEC11C,TIFA,TTC33,TTC5 | ACER2,ALB,AMBP,APOA2,B3GNT2,C12orf75,C1orf210, CD164,CPNE2,FER1L6,GALNT12,GUCA2A,HAO1,LOC100130933, MINPP1,P2RX4,P2RY4,PLG,SLC17A5,TMCO1,TSPAN3 |
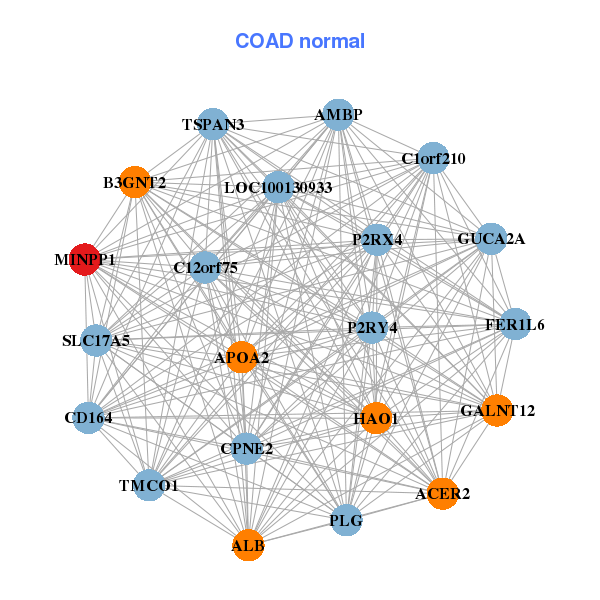
| * Co-Expression network figures were drawn using R package igraph. Only the top 20 genes with the highest correlations were shown. Red circle: input gene, orange circle: cell metabolism gene, sky circle: other gene |
: Open all plots for all cancer types
| Top |
: Open all interacting genes' information including KEGG pathway for all interacting genes from DAVID
| Top |
| Pharmacological Information for MINPP1 |
| There's no related Drug. |
| Top |
| Cross referenced IDs for MINPP1 |
| * We obtained these cross-references from Uniprot database. It covers 150 different DBs, 18 categories. http://www.uniprot.org/help/cross_references_section |
: Open all cross reference information
|
Copyright © 2016-Present - The Univsersity of Texas Health Science Center at Houston @ |