|
||||||||||||||||||||||||||||||||||||||||||||||||||||||||||||||||||||||||||||||||||||||||||||||||||||||||||||||||||||||||||||||||||||||||||||||||||||||||||||||||||||||||||||||||||||||||||||||||||||||||||||||||||||||||||||||||||||||||||||||||||||||||||||||||||||||||||||||||||||||||||||||||||||||||||||||||||||||||||
| |
| Phenotypic Information (metabolism pathway, cancer, disease, phenome) |
| |
| |
| Gene-Gene Network Information: Co-Expression Network, Interacting Genes & KEGG |
| |
|


| Gene Summary for ENTPD4 |
| Basic gene info. | Gene symbol | ENTPD4 |
| Gene name | ectonucleoside triphosphate diphosphohydrolase 4 | |
| Synonyms | LALP70|LAP70|LYSAL1|NTPDase-4|UDPase | |
| Cytomap | UCSC genome browser: 8p21.3 | |
| Genomic location | chr8 :23286664-23315244 | |
| Type of gene | protein-coding | |
| RefGenes | NM_001128930.2, NM_004901.4, | |
| Ensembl id | ENSG00000197217 | |
| Description | golgi luminal UDPaseguanosine-diphosphatase like proteinlysosomal apyrase-like 1lysosomal apyrase-like protein of 70 kDauridine-diphosphatase | |
| Modification date | 20141207 | |
| dbXrefs | MIM : 607577 | |
| HGNC : HGNC | ||
| Ensembl : ENSG00000197217 | ||
| HPRD : 09618 | ||
| Vega : OTTHUMG00000097852 | ||
| Protein | UniProt: go to UniProt's Cross Reference DB Table | |
| Expression | CleanEX: HS_ENTPD4 | |
| BioGPS: 9583 | ||
| Gene Expression Atlas: ENSG00000197217 | ||
| The Human Protein Atlas: ENSG00000197217 | ||
| Pathway | NCI Pathway Interaction Database: ENTPD4 | |
| KEGG: ENTPD4 | ||
| REACTOME: ENTPD4 | ||
| ConsensusPathDB | ||
| Pathway Commons: ENTPD4 | ||
| Metabolism | MetaCyc: ENTPD4 | |
| HUMANCyc: ENTPD4 | ||
| Regulation | Ensembl's Regulation: ENSG00000197217 | |
| miRBase: chr8 :23,286,664-23,315,244 | ||
| TargetScan: NM_001128930 | ||
| cisRED: ENSG00000197217 | ||
| Context | iHOP: ENTPD4 | |
| cancer metabolism search in PubMed: ENTPD4 | ||
| UCL Cancer Institute: ENTPD4 | ||
| Assigned class in ccmGDB | C | |
| Top |
| Phenotypic Information for ENTPD4(metabolism pathway, cancer, disease, phenome) |
| Cancer | CGAP: ENTPD4 |
| Familial Cancer Database: ENTPD4 | |
| * This gene is included in those cancer gene databases. |
|
|
|
|
|
|
| ||||||||||||||||||||||||||||||||||||||||||||||||||||||||||||||||||||||||||||||||||||||||||||||||||||||||||||||||||||||||||||||||||||||||||||||||||||||||||||||||||||||||||||||||||||||||||||||||||||||||||||||||||||||||||||||||||||||||||||||||||||||||||||||||||||||||||||||||||||||||||||||||||||||||||||||||||||
Oncogene 1 | Significant driver gene in | |||||||||||||||||||||||||||||||||||||||||||||||||||||||||||||||||||||||||||||||||||||||||||||||||||||||||||||||||||||||||||||||||||||||||||||||||||||||||||||||||||||||||||||||||||||||||||||||||||||||||||||||||||||||||||||||||||||||||||||||||||||||||||||||||||||||||||||||||||||||||||||||||||||||||||||||||||||||||
| cf) number; DB name 1 Oncogene; http://nar.oxfordjournals.org/content/35/suppl_1/D721.long, 2 Tumor Suppressor gene; https://bioinfo.uth.edu/TSGene/, 3 Cancer Gene Census; http://www.nature.com/nrc/journal/v4/n3/abs/nrc1299.html, 4 CancerGenes; http://nar.oxfordjournals.org/content/35/suppl_1/D721.long, 5 Network of Cancer Gene; http://ncg.kcl.ac.uk/index.php, 1Therapeutic Vulnerabilities in Cancer; http://cbio.mskcc.org/cancergenomics/statius/ |
| KEGG_PURINE_METABOLISM KEGG_PYRIMIDINE_METABOLISM | |
| OMIM | |
| Orphanet | |
| Disease | KEGG Disease: ENTPD4 |
| MedGen: ENTPD4 (Human Medical Genetics with Condition) | |
| ClinVar: ENTPD4 | |
| Phenotype | MGI: ENTPD4 (International Mouse Phenotyping Consortium) |
| PhenomicDB: ENTPD4 | |
| Mutations for ENTPD4 |
| * Under tables are showing count per each tissue to give us broad intuition about tissue specific mutation patterns.You can go to the detailed page for each mutation database's web site. |
| There's no structural variation information in COSMIC data for this gene. |
| * From mRNA Sanger sequences, Chitars2.0 arranged chimeric transcripts. This table shows ENTPD4 related fusion information. |
| ID | Head Gene | Tail Gene | Accession | Gene_a | qStart_a | qEnd_a | Chromosome_a | tStart_a | tEnd_a | Gene_a | qStart_a | qEnd_a | Chromosome_a | tStart_a | tEnd_a |
| AA465661 | C17orf62 | 32 | 91 | 17 | 80400519 | 80400578 | ENTPD4 | 82 | 370 | 8 | 23289140 | 23289429 | |
| BI001449 | ENTPD4 | 7 | 222 | 8 | 23293720 | 23293935 | ENTPD4 | 217 | 280 | 8 | 23293440 | 23293503 | |
| BF872346 | ENTPD4 | 1 | 248 | 8 | 23297311 | 23299236 | ENTPD4 | 239 | 292 | 8 | 23299526 | 23299579 | |
| BF084356 | C14orf37 | 14 | 307 | 14 | 58686232 | 58686526 | ENTPD4 | 299 | 383 | 8 | 23267941 | 23268025 | |
| BE932194 | CNOT1 | 7 | 84 | 16 | 58589686 | 58589764 | ENTPD4 | 80 | 276 | 8 | 23299520 | 23302001 | |
| Top |
| Mutation type/ Tissue ID | brca | cns | cerv | endome | haematopo | kidn | Lintest | liver | lung | ns | ovary | pancre | prost | skin | stoma | thyro | urina | |||
| Total # sample | 1 | |||||||||||||||||||
| GAIN (# sample) | ||||||||||||||||||||
| LOSS (# sample) | 1 |
| cf) Tissue ID; Tissue type (1; Breast, 2; Central_nervous_system, 3; Cervix, 4; Endometrium, 5; Haematopoietic_and_lymphoid_tissue, 6; Kidney, 7; Large_intestine, 8; Liver, 9; Lung, 10; NS, 11; Ovary, 12; Pancreas, 13; Prostate, 14; Skin, 15; Stomach, 16; Thyroid, 17; Urinary_tract) |
| Top |
|
 |
| Top |
| Stat. for Non-Synonymous SNVs (# total SNVs=44) | (# total SNVs=14) |
 |  |
(# total SNVs=0) | (# total SNVs=1) |
 |
| Top |
| * When you move the cursor on each content, you can see more deailed mutation information on the Tooltip. Those are primary_site,primary_histology,mutation(aa),pubmedID. |
| GRCh37 position | Mutation(aa) | Unique sampleID count |
| chr8:23305332-23305332 | p.I91I | 3 |
| chr8:23306283-23306283 | p.R60* | 2 |
| chr8:23292985-23292985 | p.Y460Y | 2 |
| chr8:23290534-23290534 | p.R586W | 2 |
| chr8:23301973-23301973 | p.E187K | 2 |
| chr8:23294586-23294586 | p.S412F | 2 |
| chr8:23305377-23305377 | p.D76D | 2 |
| chr8:23305378-23305378 | p.D76G | 2 |
| chr8:23290492-23290492 | p.A600T | 2 |
| chr8:23291937-23291937 | p.S505S | 2 |
| Top |
|
 |
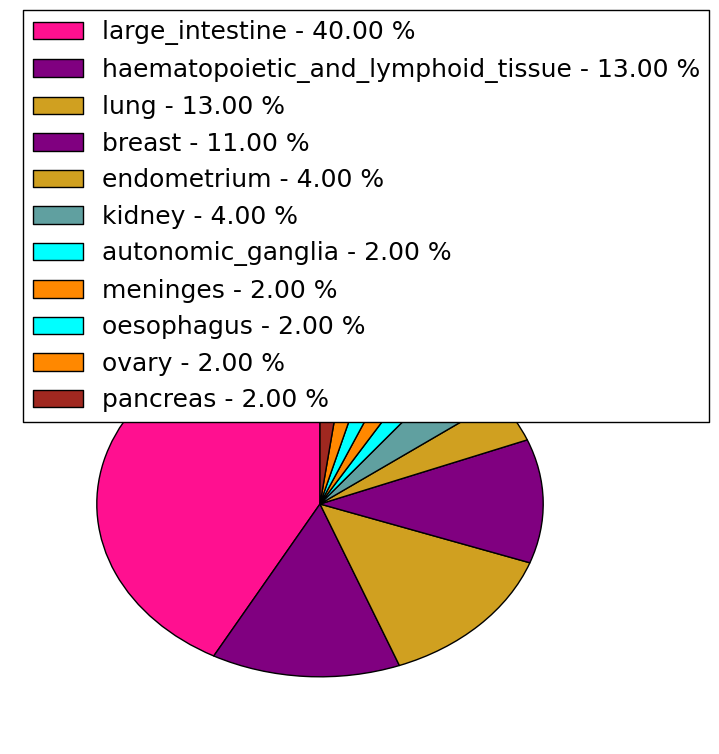
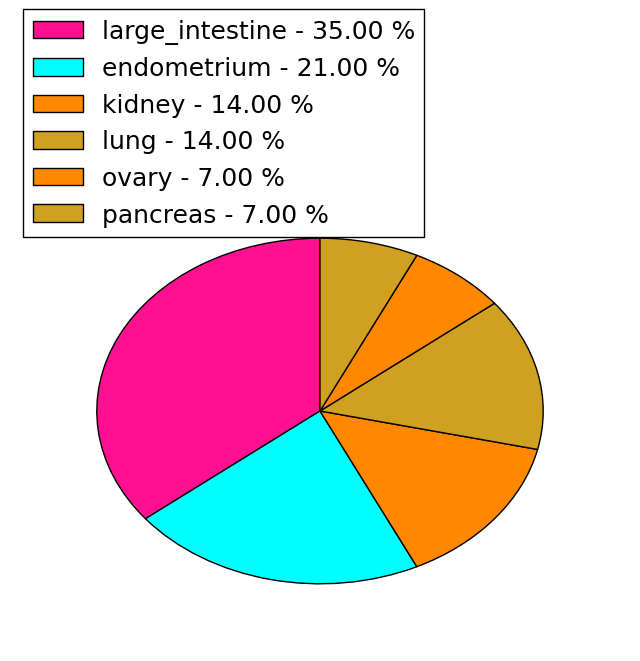
| Point Mutation/ Tissue ID | 1 | 2 | 3 | 4 | 5 | 6 | 7 | 8 | 9 | 10 | 11 | 12 | 13 | 14 | 15 | 16 | 17 | 18 | 19 | 20 |
| # sample | 1 | 3 | 14 | 3 | 2 | 3 | 1 | 1 | 1 | 6 | 9 | 4 | ||||||||
| # mutation | 1 | 3 | 13 | 3 | 2 | 4 | 1 | 1 | 1 | 7 | 10 | 5 | ||||||||
| nonsynonymous SNV | 3 | 11 | 3 | 1 | 2 | 3 | 7 | 2 | ||||||||||||
| synonymous SNV | 1 | 2 | 1 | 2 | 1 | 1 | 1 | 4 | 3 | 3 |
| cf) Tissue ID; Tissue type (1; BLCA[Bladder Urothelial Carcinoma], 2; BRCA[Breast invasive carcinoma], 3; CESC[Cervical squamous cell carcinoma and endocervical adenocarcinoma], 4; COAD[Colon adenocarcinoma], 5; GBM[Glioblastoma multiforme], 6; Glioma Low Grade, 7; HNSC[Head and Neck squamous cell carcinoma], 8; KICH[Kidney Chromophobe], 9; KIRC[Kidney renal clear cell carcinoma], 10; KIRP[Kidney renal papillary cell carcinoma], 11; LAML[Acute Myeloid Leukemia], 12; LUAD[Lung adenocarcinoma], 13; LUSC[Lung squamous cell carcinoma], 14; OV[Ovarian serous cystadenocarcinoma ], 15; PAAD[Pancreatic adenocarcinoma], 16; PRAD[Prostate adenocarcinoma], 17; SKCM[Skin Cutaneous Melanoma], 18:STAD[Stomach adenocarcinoma], 19:THCA[Thyroid carcinoma], 20:UCEC[Uterine Corpus Endometrial Carcinoma]) |
| Top |
| * We represented just top 10 SNVs. When you move the cursor on each content, you can see more deailed mutation information on the Tooltip. Those are primary_site, primary_histology, mutation(aa), pubmedID. |
| Genomic Position | Mutation(aa) | Unique sampleID count |
| chr8:23305332 | p.T430T,ENTPD4 | 2 |
| chr8:23305378 | p.A592T,ENTPD4 | 2 |
| chr8:23291937 | p.I91I,ENTPD4 | 2 |
| chr8:23290492 | p.D76G,ENTPD4 | 2 |
| chr8:23294507 | p.S497S,ENTPD4 | 2 |
| chr8:23294509 | p.A42V,ENTPD4 | 1 |
| chr8:23299142 | p.E187K,ENTPD4 | 1 |
| chr8:23290619 | p.T430A,ENTPD4 | 1 |
| chr8:23294525 | p.P186P,ENTPD4 | 1 |
| chr8:23299143 | p.A590A,ENTPD4 | 1 |
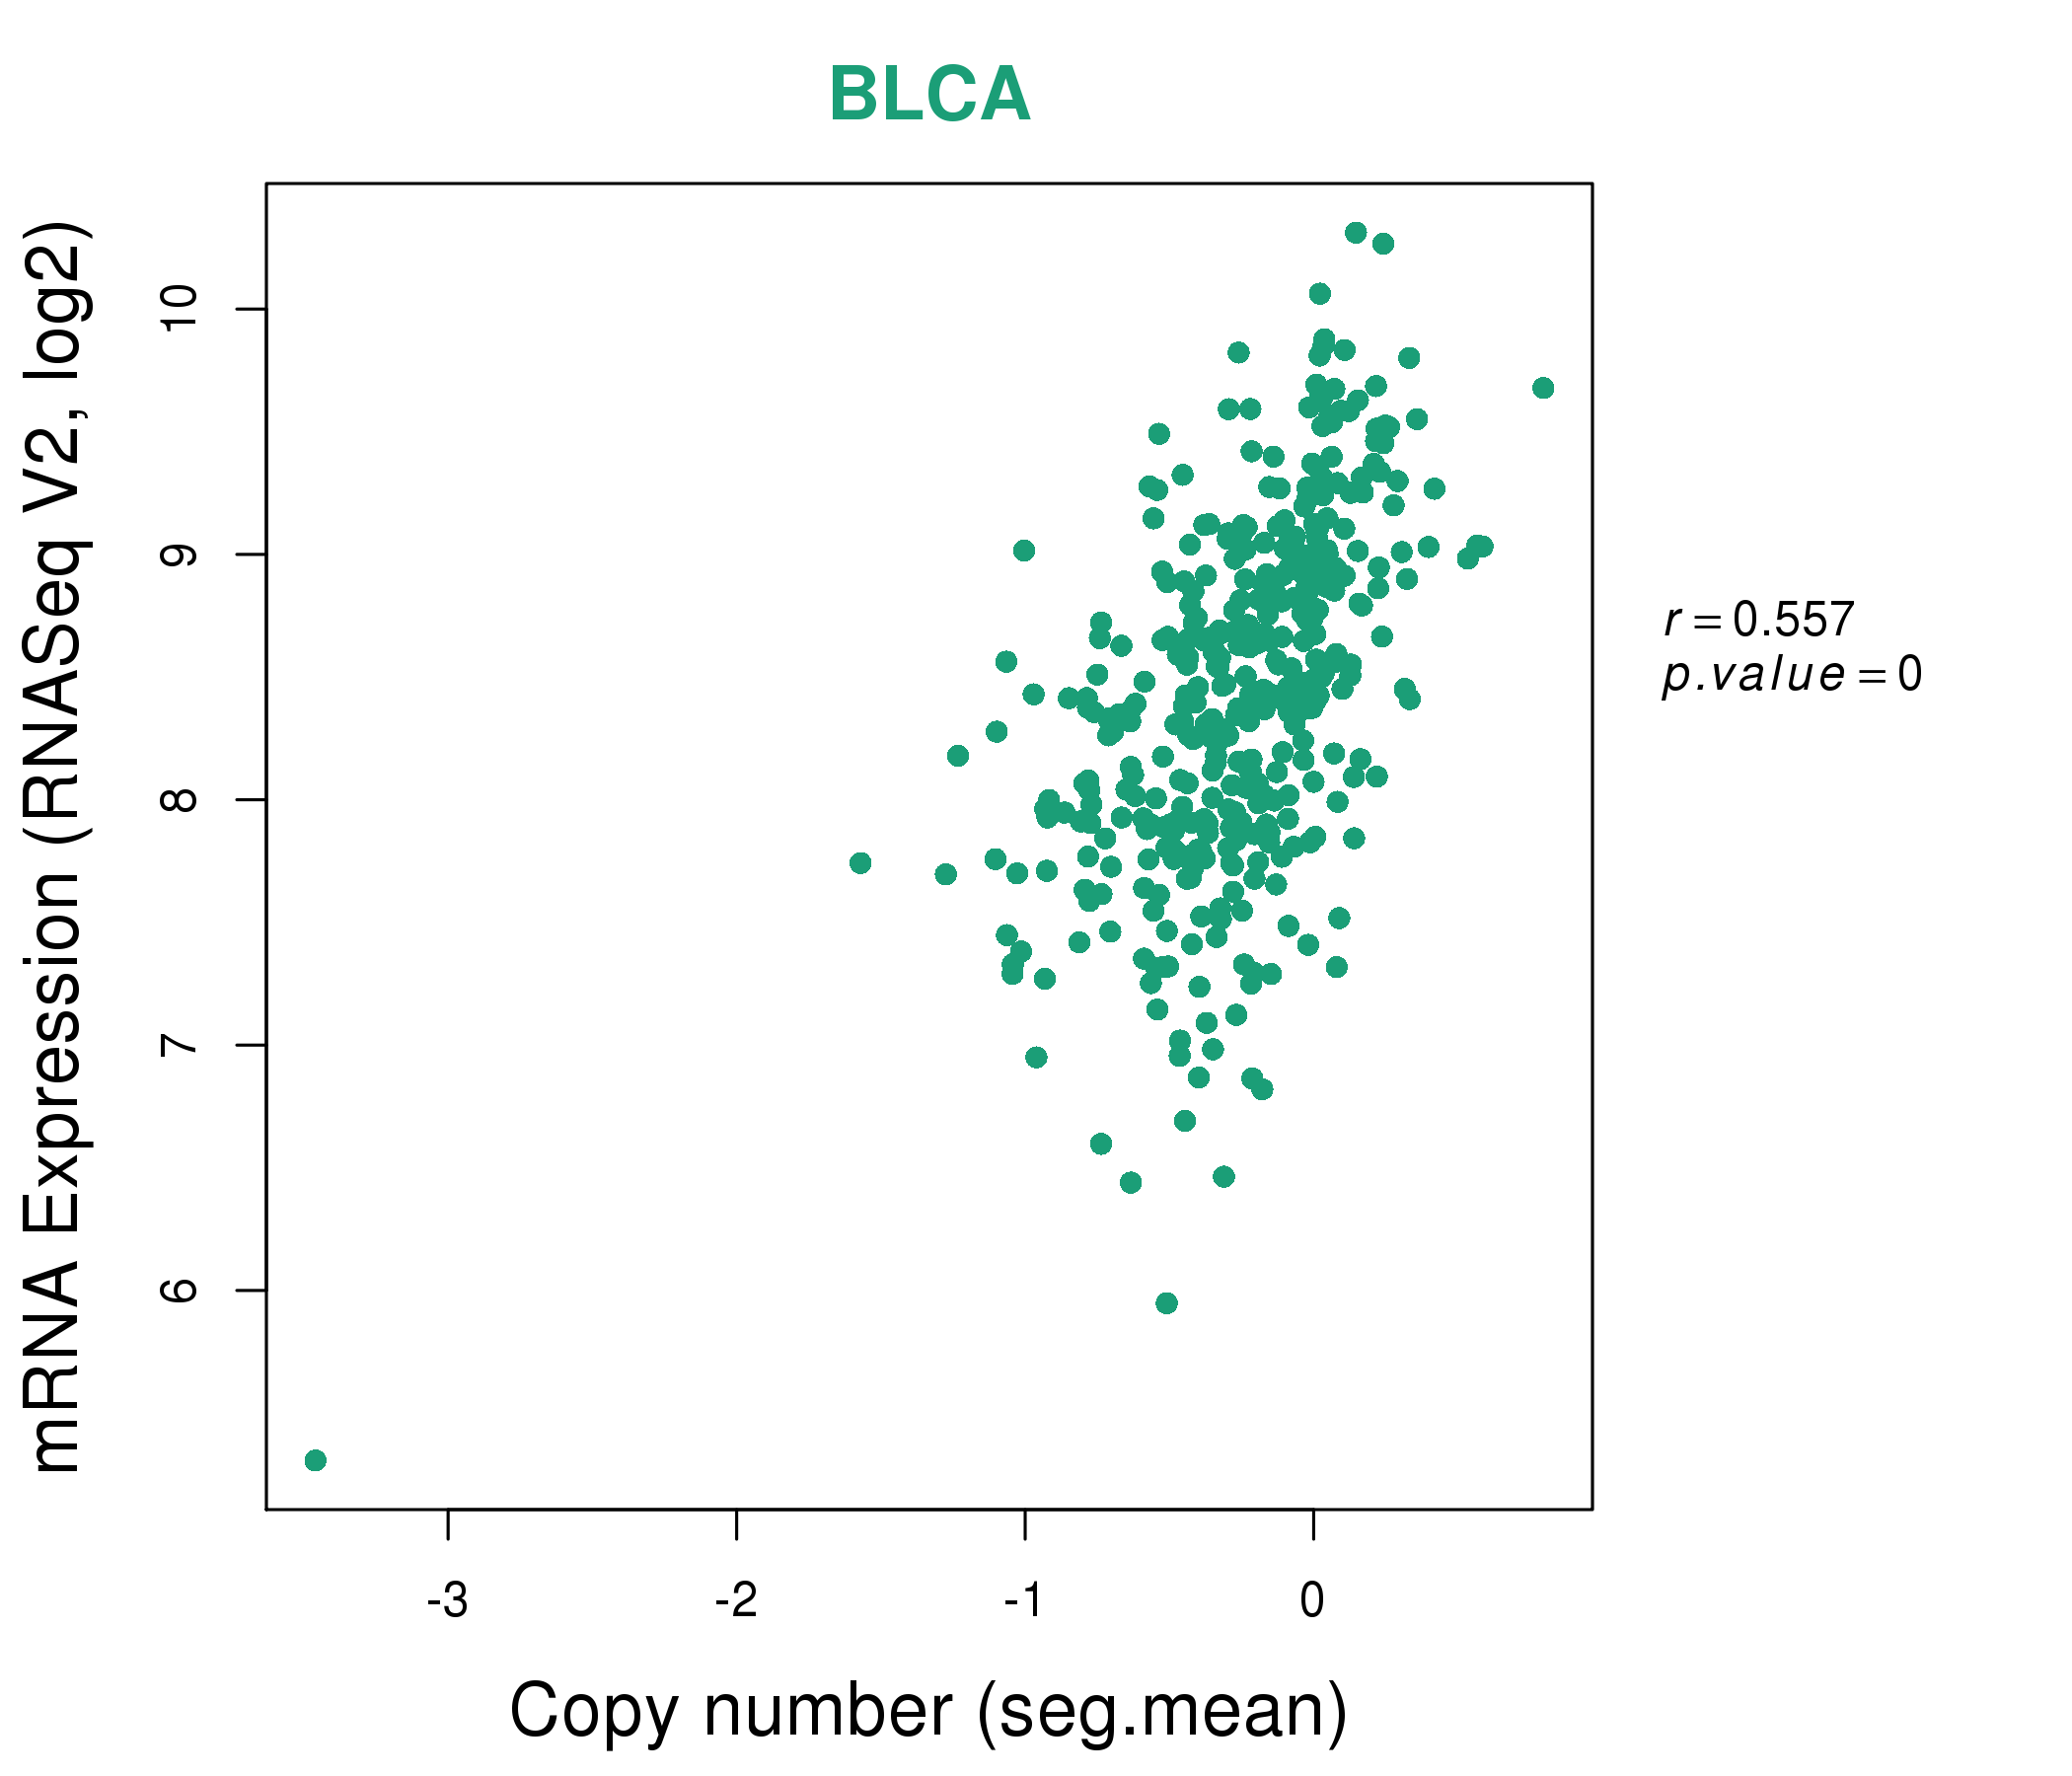
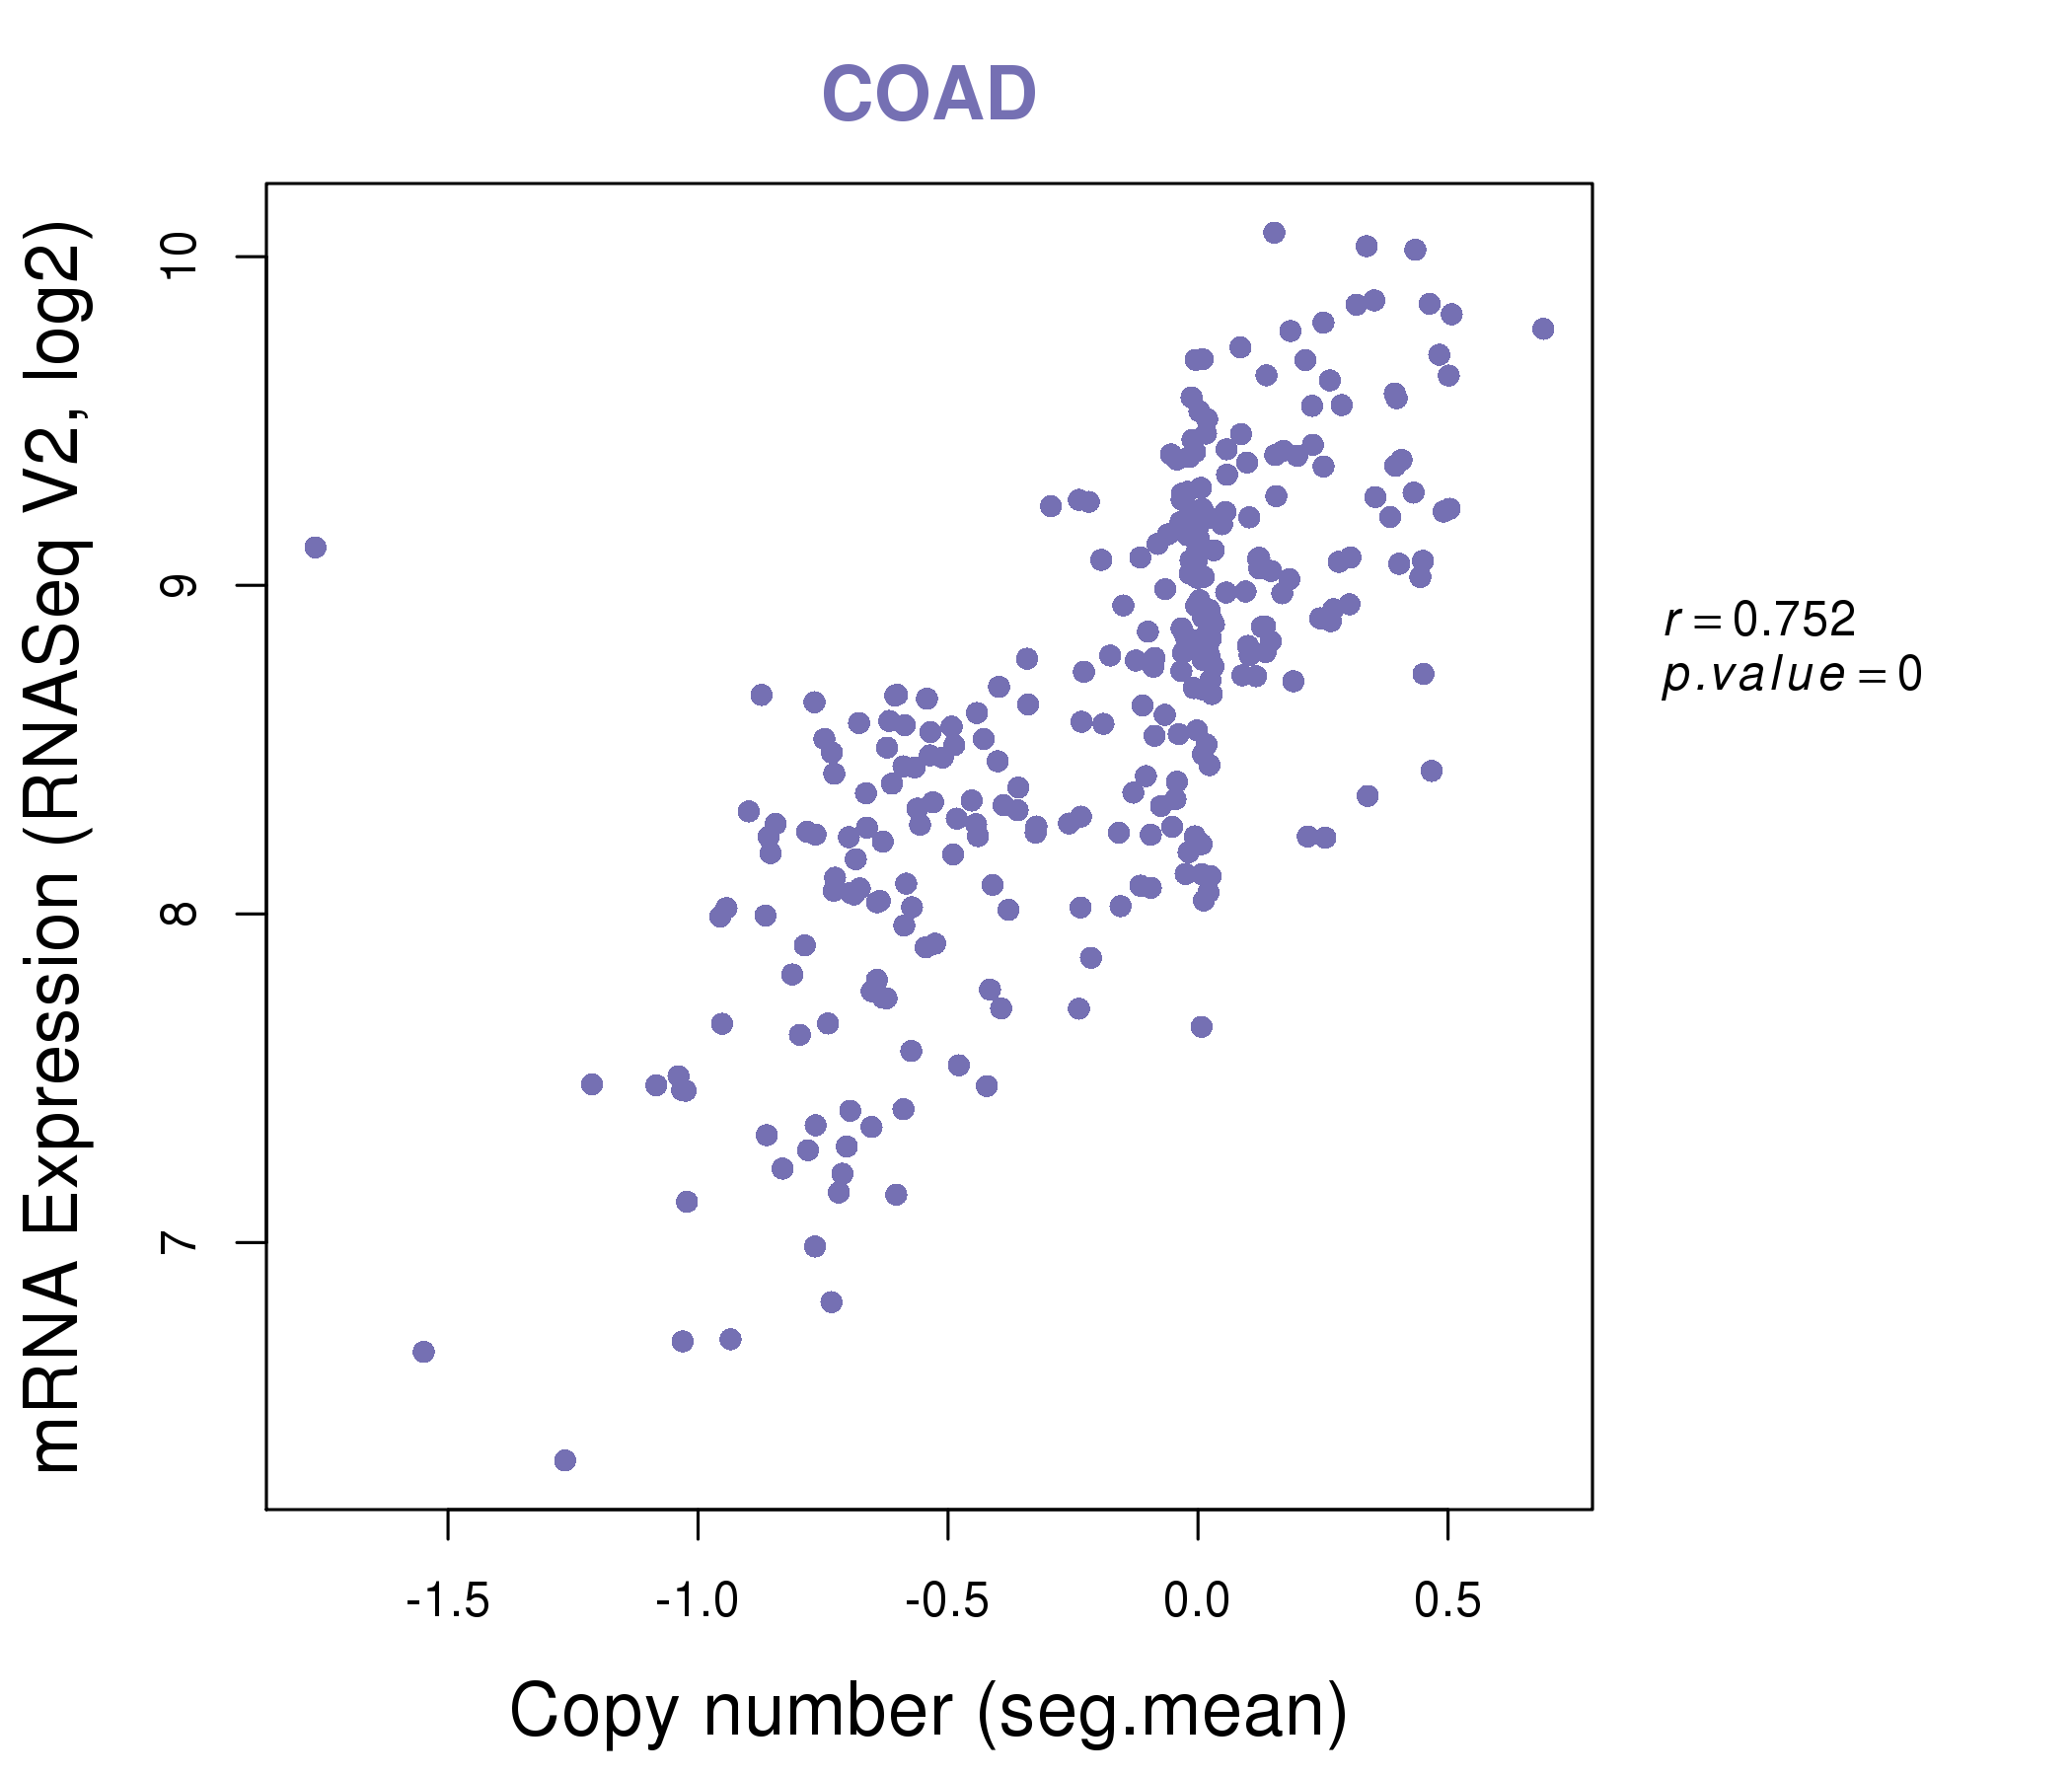
| * Copy number data were extracted from TCGA using R package TCGA-Assembler. The URLs of all public data files on TCGA DCC data server were gathered on Jan-05-2015. Function ProcessCNAData in TCGA-Assembler package was used to obtain gene-level copy number value which is calculated as the average copy number of the genomic region of a gene. |
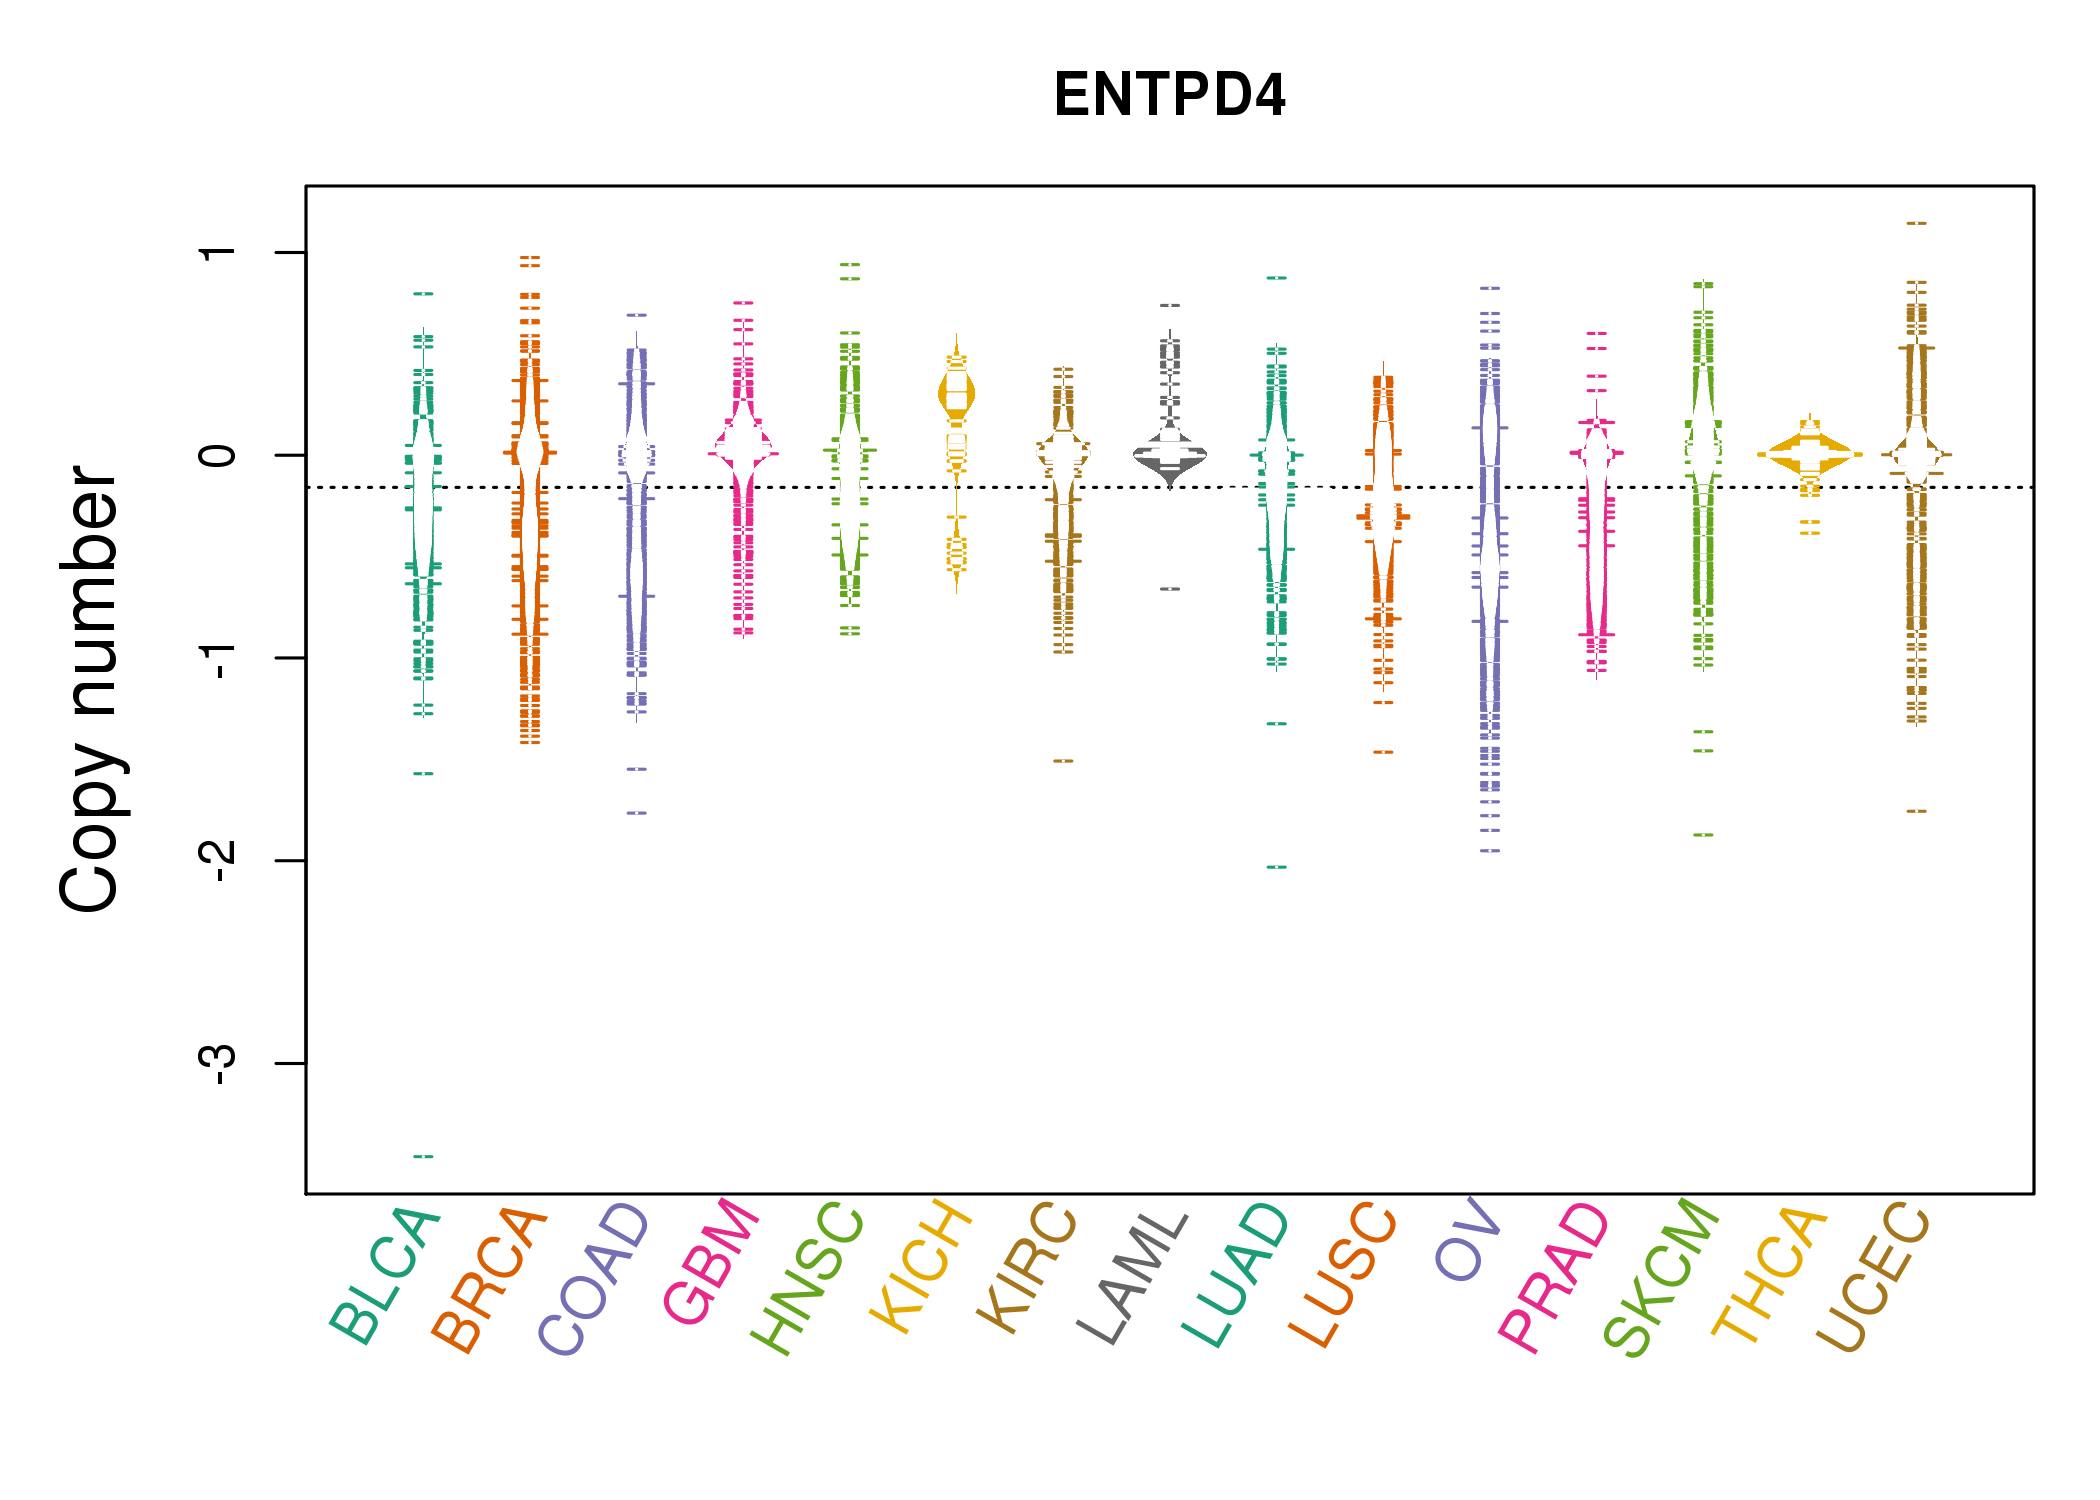 |
| cf) Tissue ID[Tissue type]: BLCA[Bladder Urothelial Carcinoma], BRCA[Breast invasive carcinoma], CESC[Cervical squamous cell carcinoma and endocervical adenocarcinoma], COAD[Colon adenocarcinoma], GBM[Glioblastoma multiforme], Glioma Low Grade, HNSC[Head and Neck squamous cell carcinoma], KICH[Kidney Chromophobe], KIRC[Kidney renal clear cell carcinoma], KIRP[Kidney renal papillary cell carcinoma], LAML[Acute Myeloid Leukemia], LUAD[Lung adenocarcinoma], LUSC[Lung squamous cell carcinoma], OV[Ovarian serous cystadenocarcinoma ], PAAD[Pancreatic adenocarcinoma], PRAD[Prostate adenocarcinoma], SKCM[Skin Cutaneous Melanoma], STAD[Stomach adenocarcinoma], THCA[Thyroid carcinoma], UCEC[Uterine Corpus Endometrial Carcinoma] |
| Top |
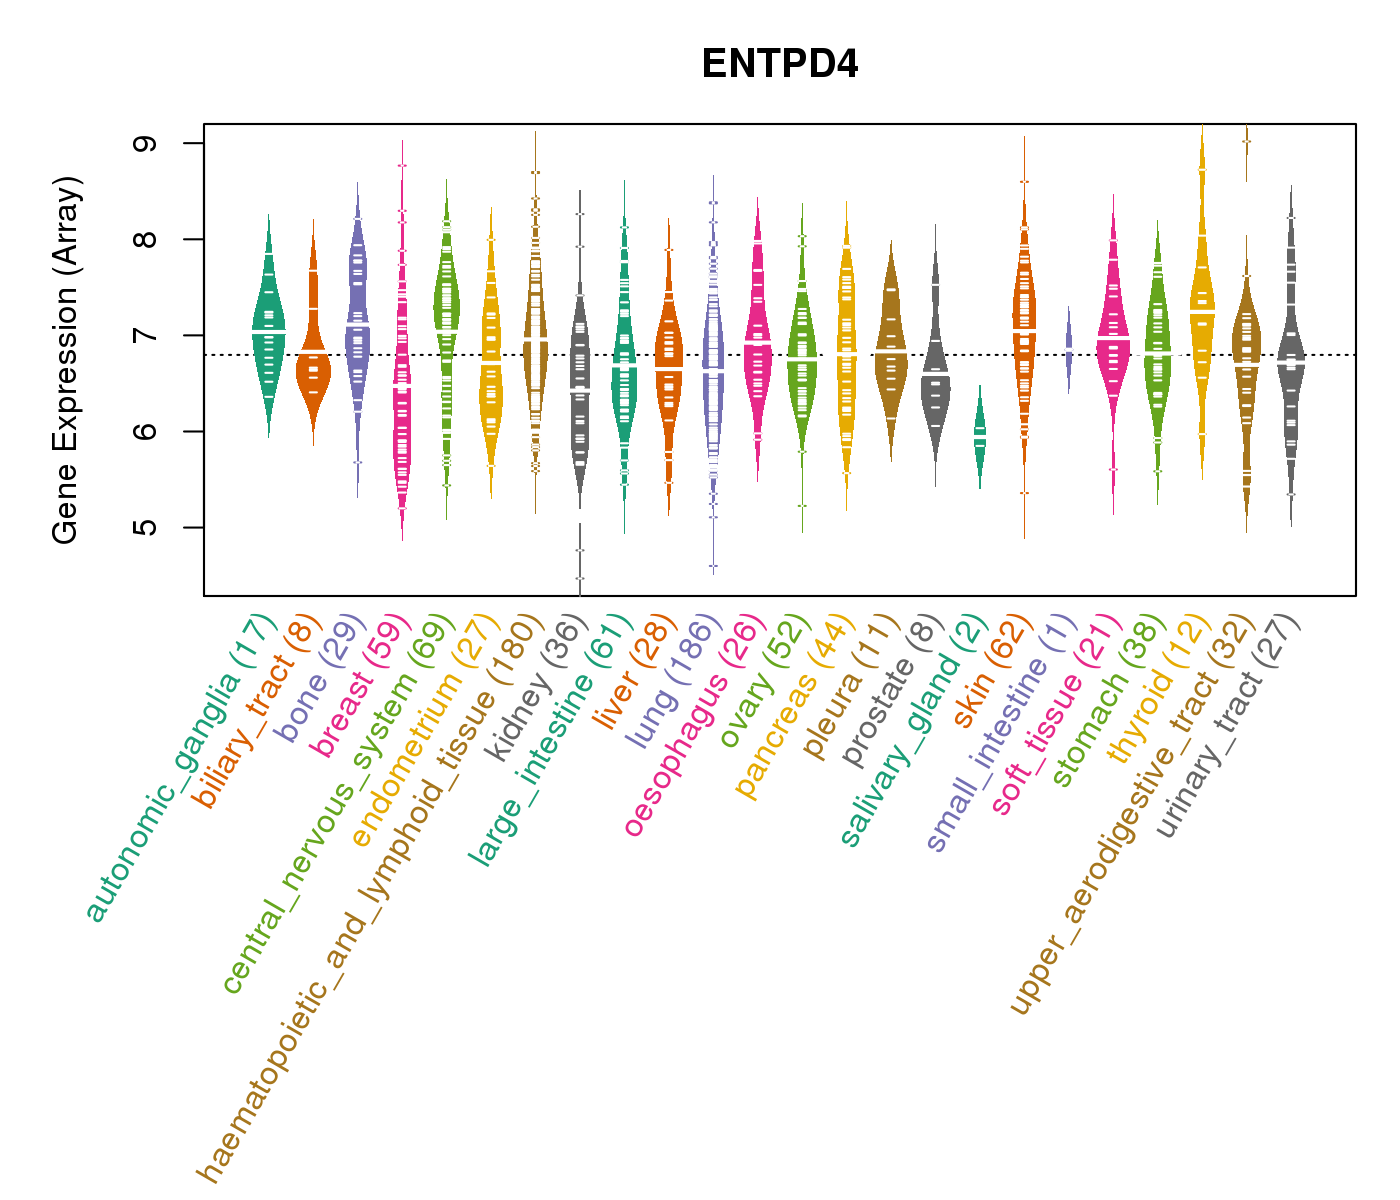
| Gene Expression for ENTPD4 |
| * CCLE gene expression data were extracted from CCLE_Expression_Entrez_2012-10-18.res: Gene-centric RMA-normalized mRNA expression data. |
 |
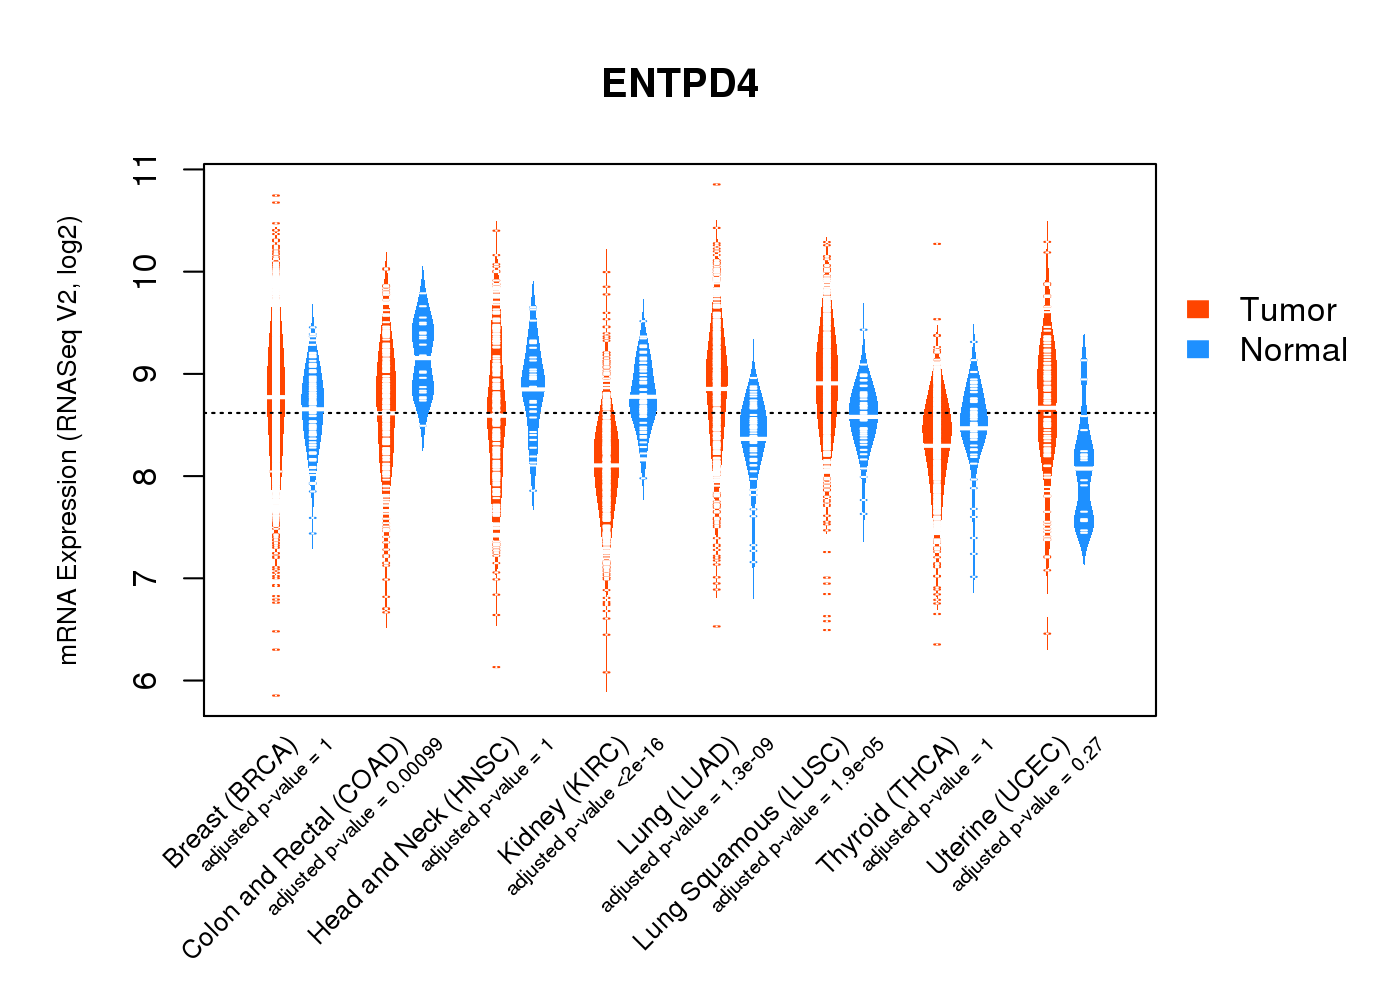
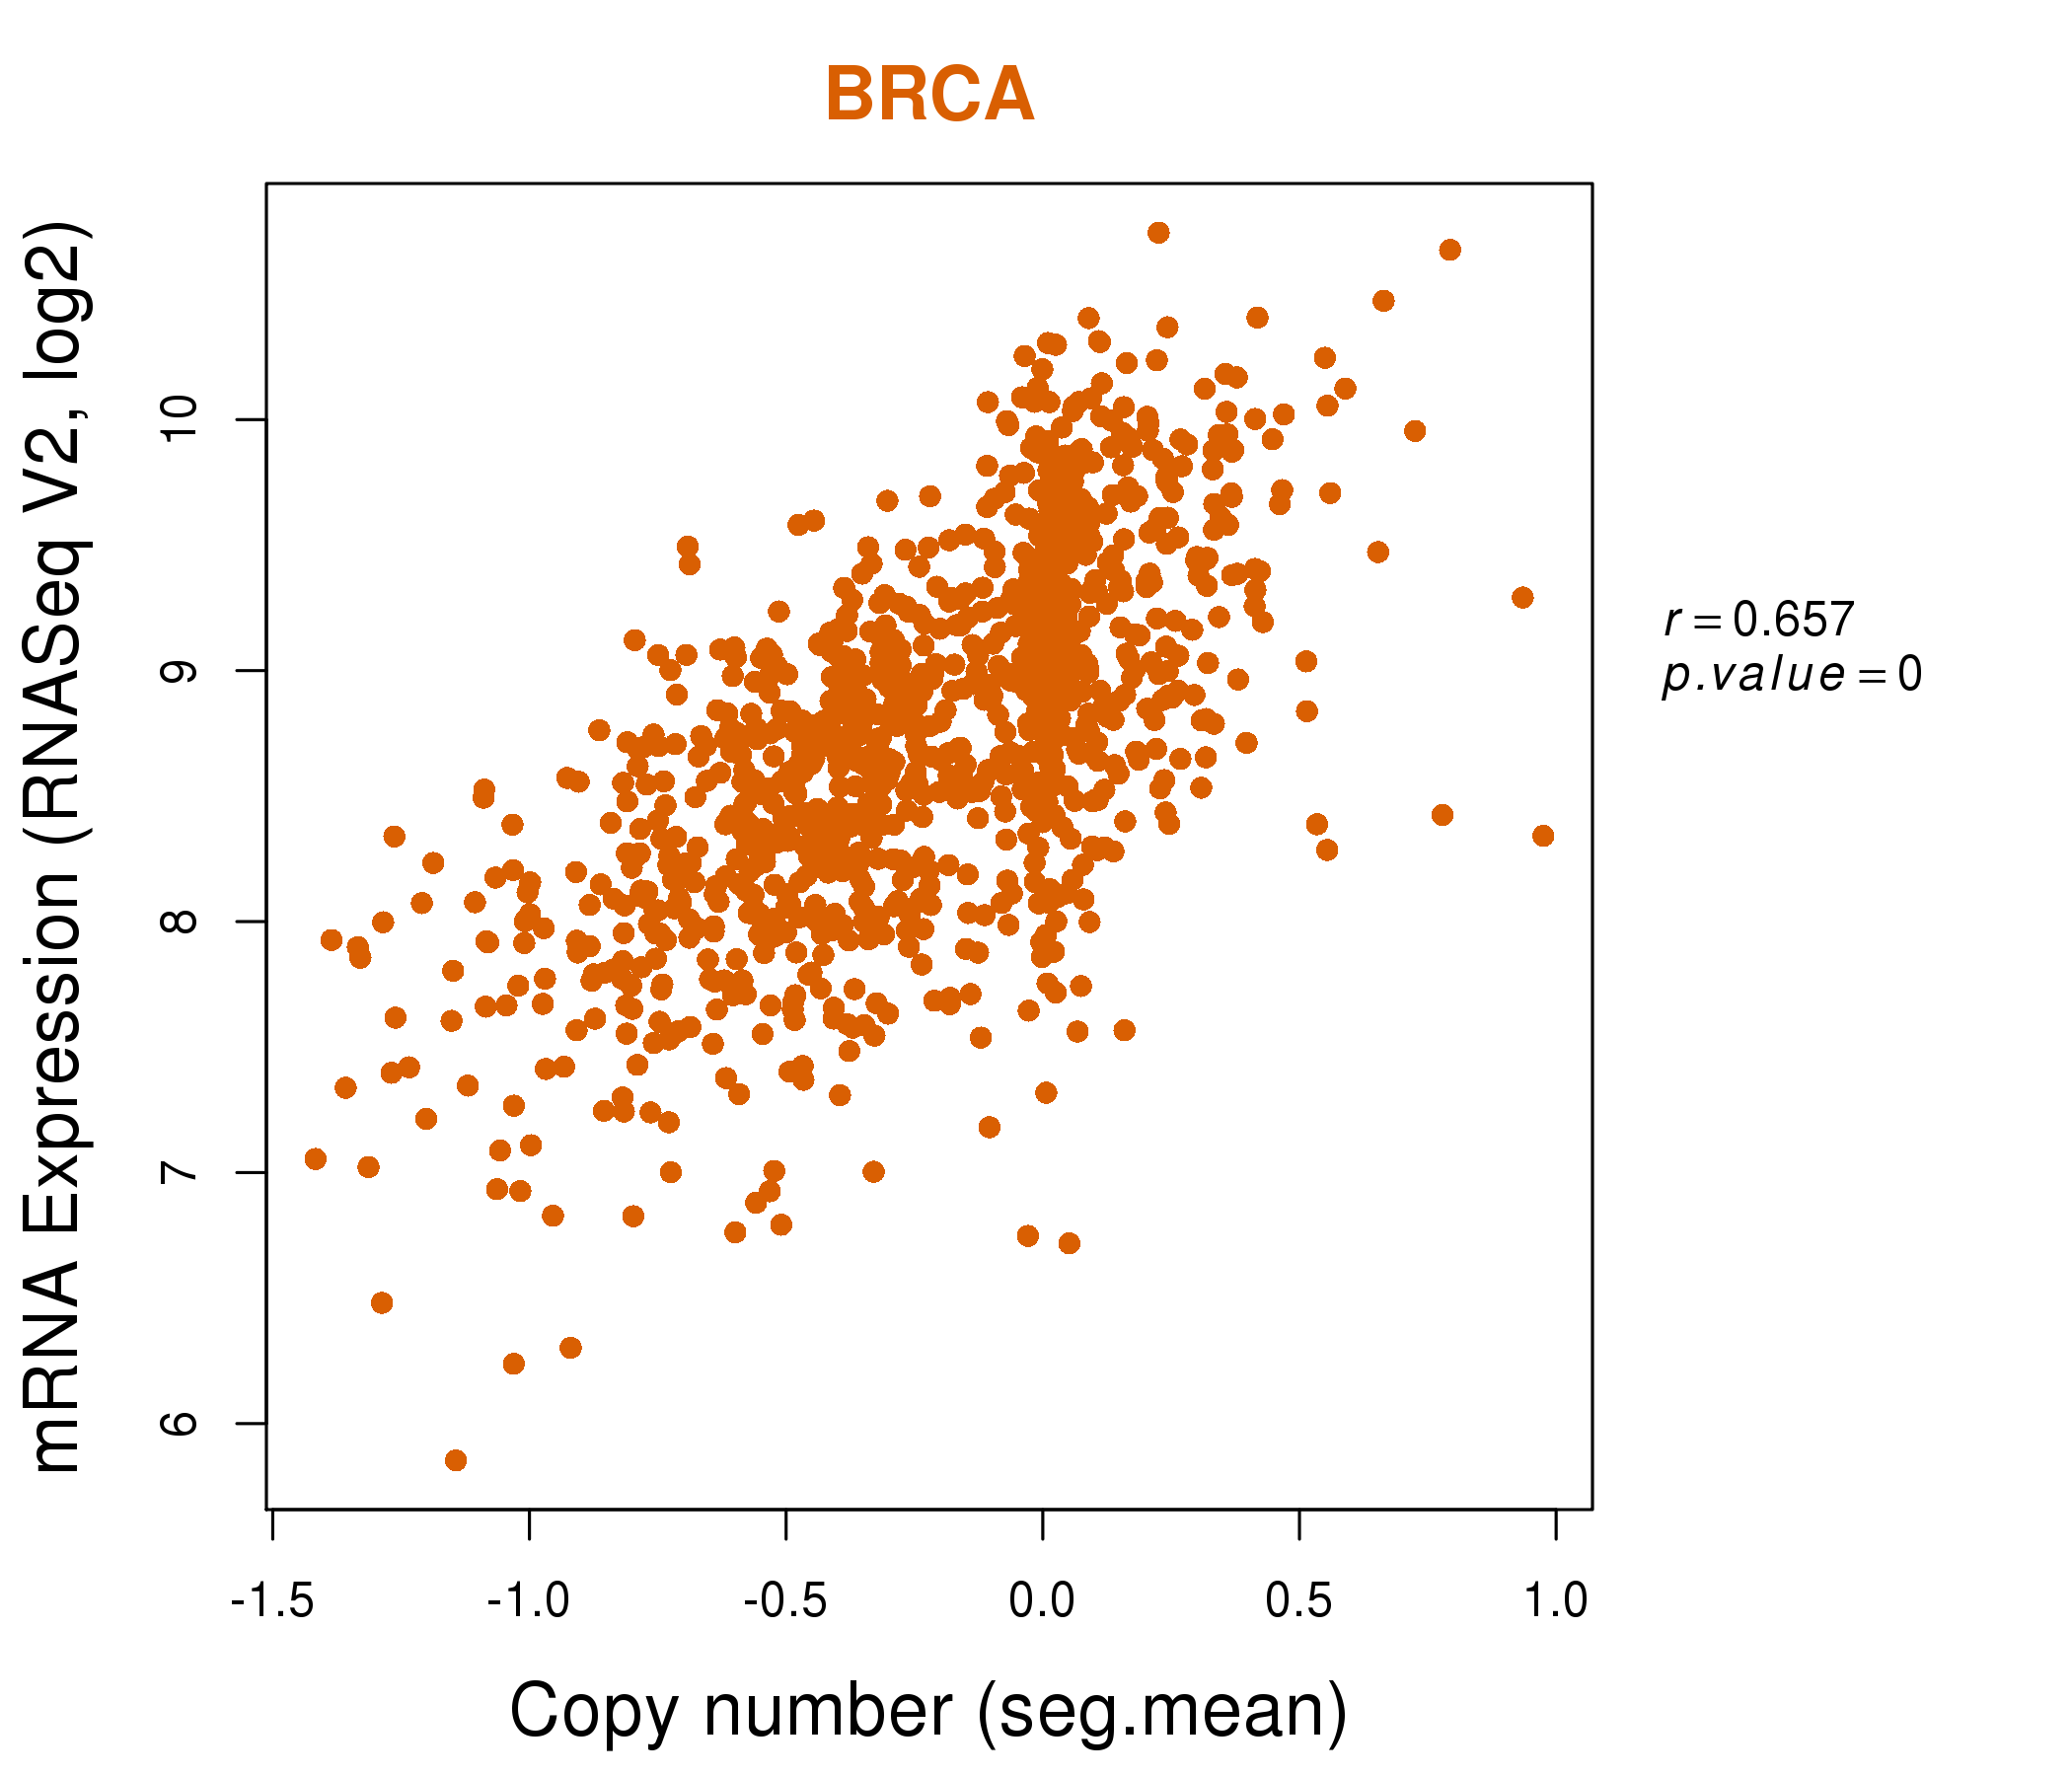
| * Normalized gene expression data of RNASeqV2 was extracted from TCGA using R package TCGA-Assembler. The URLs of all public data files on TCGA DCC data server were gathered at Jan-05-2015. Only eight cancer types have enough normal control samples for differential expression analysis. (t test, adjusted p<0.05 (using Benjamini-Hochberg FDR)) |
 |
| Top |
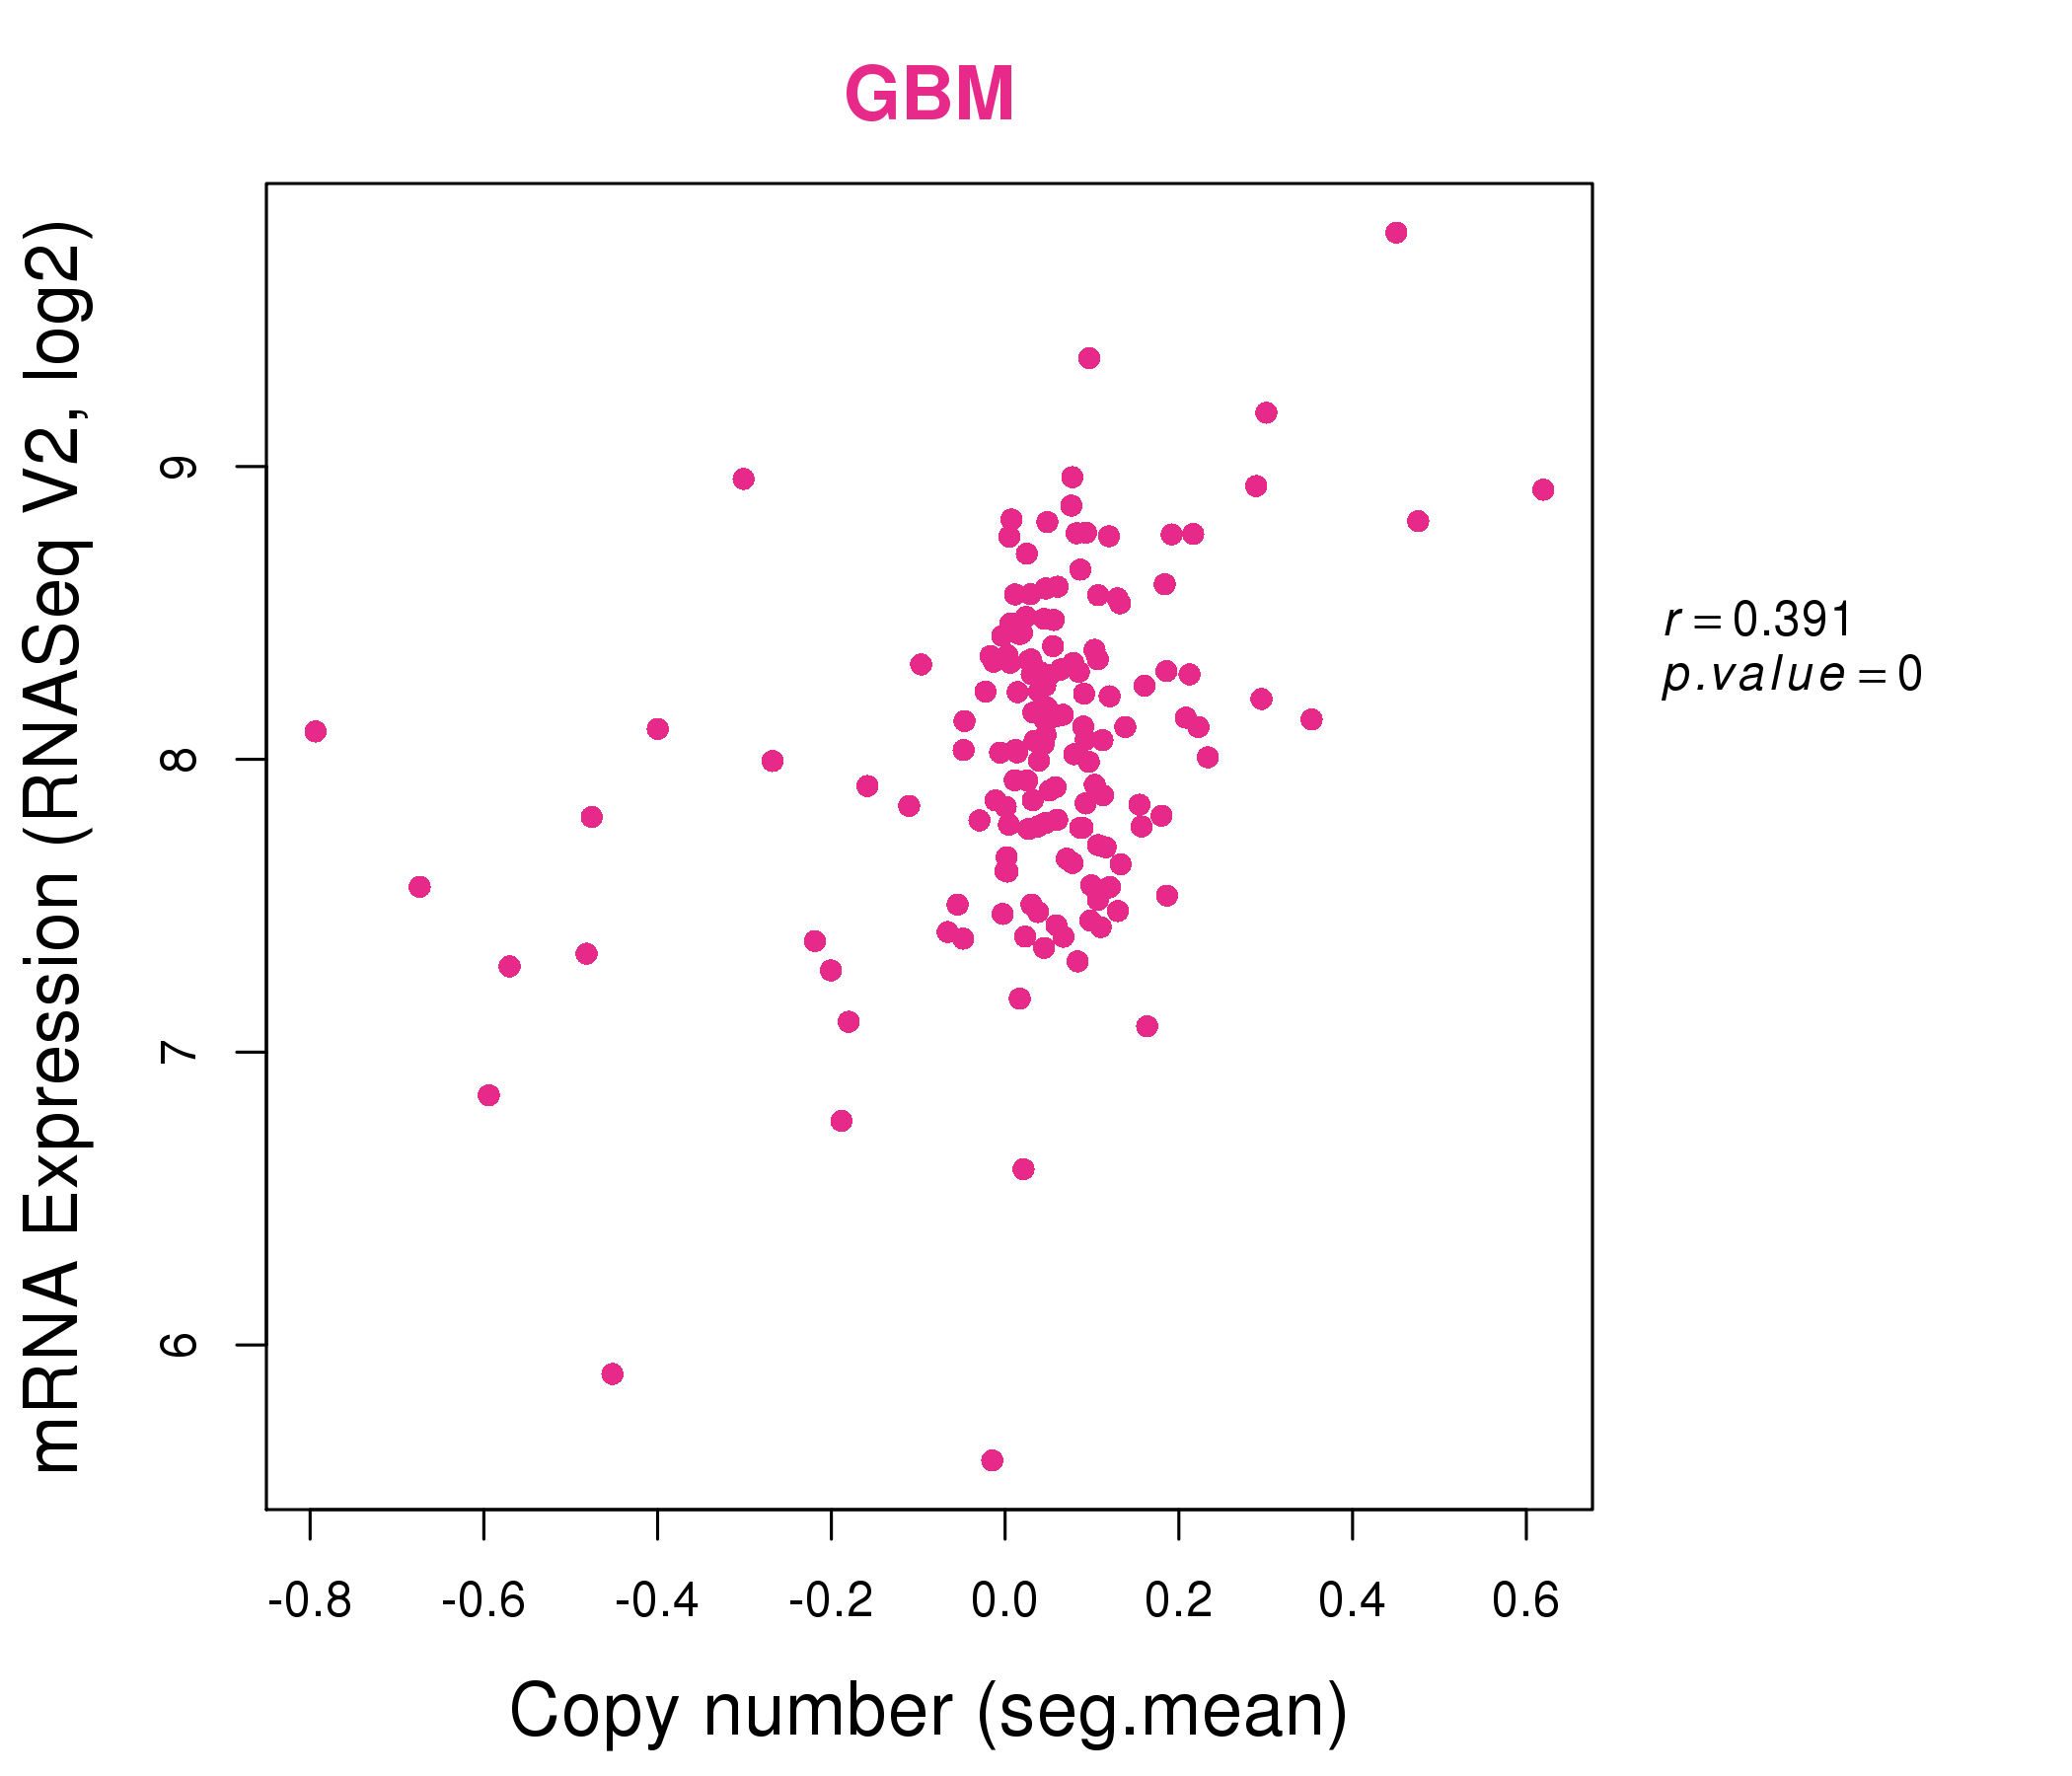
| * This plots show the correlation between CNV and gene expression. |
: Open all plots for all cancer types
 |
|
 |
|
| Top |
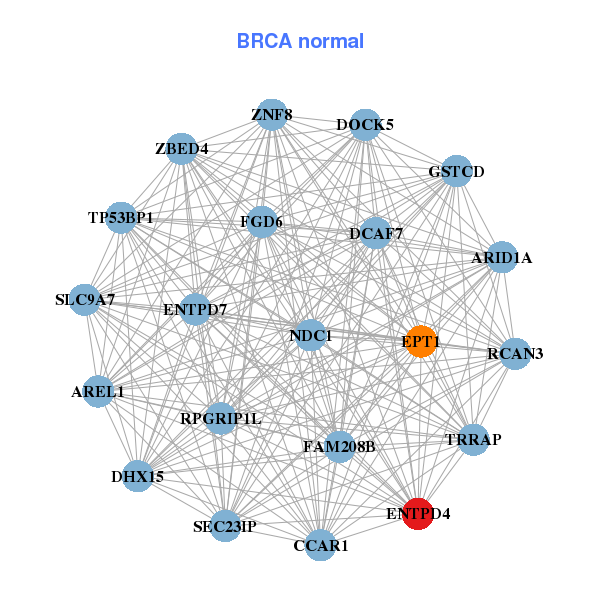
| Gene-Gene Network Information |
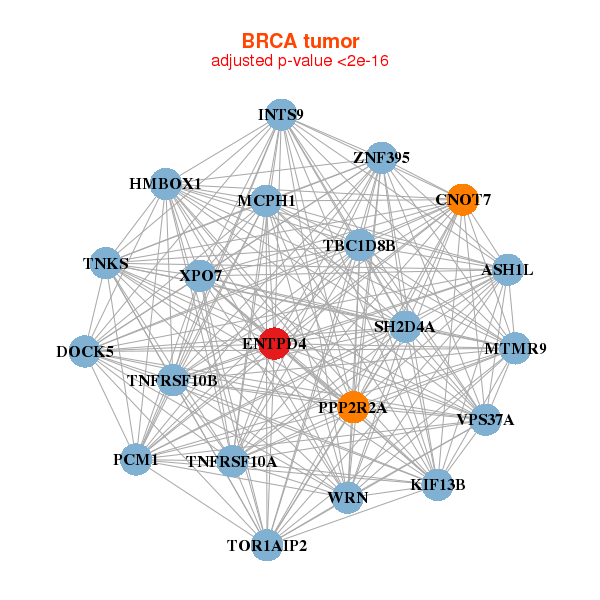
| * Co-Expression network figures were drawn using R package igraph. Only the top 20 genes with the highest correlations were shown. Red circle: input gene, orange circle: cell metabolism gene, sky circle: other gene |
: Open all plots for all cancer types
 |
|
| ASH1L,CNOT7,DOCK5,ENTPD4,HMBOX1,INTS9,KIF13B, MCPH1,MTMR9,PCM1,PPP2R2A,SH2D4A,TBC1D8B,TNFRSF10A, TNFRSF10B,TNKS,TOR1AIP2,VPS37A,WRN,XPO7,ZNF395 | ARID1A,FAM208B,CCAR1,DCAF7,DHX15,DOCK5,ENTPD4, ENTPD7,EPT1,FGD6,GSTCD,AREL1,RCAN3,RPGRIP1L, SEC23IP,SLC9A7,NDC1,TP53BP1,TRRAP,ZBED4,ZNF8 |
 |
|
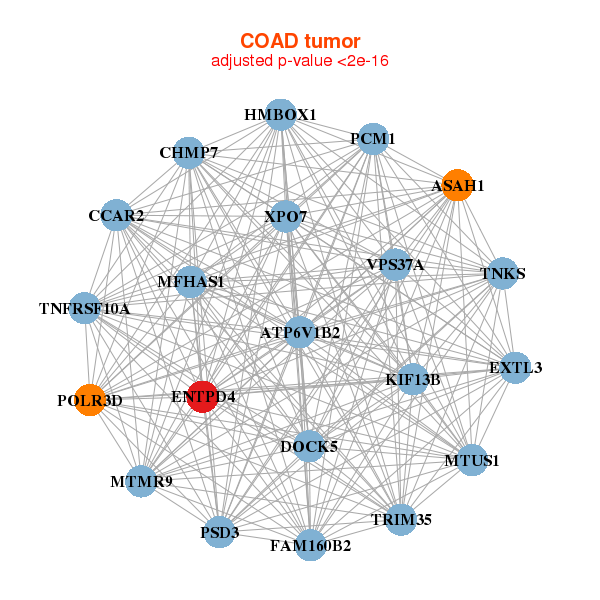
| ASAH1,ATP6V1B2,CHMP7,DOCK5,ENTPD4,EXTL3,FAM160B2, HMBOX1,CCAR2,KIF13B,MFHAS1,MTMR9,MTUS1,PCM1, POLR3D,PSD3,TNFRSF10A,TNKS,TRIM35,VPS37A,XPO7 | APAF1,ATP11B,AVL9,BAZ2A,C10orf12,PRR14L,CSNK1G1, DEPDC5,DIP2B,ENTPD4,FAM160A1,GOLGA3,IQGAP1,MAP3K9, MYO18A,NCOR1,PIK3C2B,PLEKHA6,PPFIA1,RRBP1,ZCCHC6 |
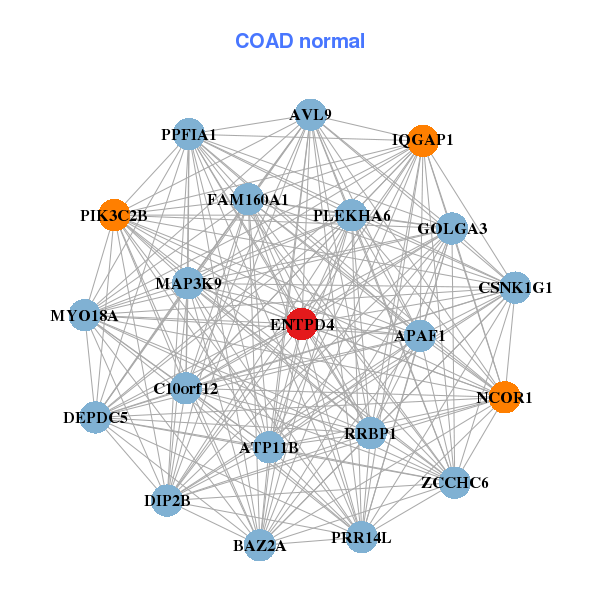
| * Co-Expression network figures were drawn using R package igraph. Only the top 20 genes with the highest correlations were shown. Red circle: input gene, orange circle: cell metabolism gene, sky circle: other gene |
: Open all plots for all cancer types
| Top |
: Open all interacting genes' information including KEGG pathway for all interacting genes from DAVID
| Top |
| Pharmacological Information for ENTPD4 |
| There's no related Drug. |
| Top |
| Cross referenced IDs for ENTPD4 |
| * We obtained these cross-references from Uniprot database. It covers 150 different DBs, 18 categories. http://www.uniprot.org/help/cross_references_section |
: Open all cross reference information
|
Copyright © 2016-Present - The Univsersity of Texas Health Science Center at Houston @ |