|
||||||||||||||||||||||||||||||||||||||||||||||||||||||||||||||||||||||||||||||||||||||||||||||||||||||||||||||||||||||||||||||||||||||||||||||||||||||||||||||||||||||||||||||||||||||||||||||||||||||||||||||||||||||||||||||||||||||||||||||||||||||||||||||||||||||||||||||||||||||||||||||||||||||||||||||||||||||||||
| |
| Phenotypic Information (metabolism pathway, cancer, disease, phenome) |
| |
| |
| Gene-Gene Network Information: Co-Expression Network, Interacting Genes & KEGG |
| |
|


| Gene Summary for NCOR1 |
| Basic gene info. | Gene symbol | NCOR1 |
| Gene name | nuclear receptor corepressor 1 | |
| Synonyms | N-CoR|N-CoR1|PPP1R109|TRAC1|hN-CoR | |
| Cytomap | UCSC genome browser: 17p11.2 | |
| Genomic location | chr17 :15933407-16097953 | |
| Type of gene | protein-coding | |
| RefGenes | NM_001190438.1, NM_001190440.1,NM_006311.3, | |
| Ensembl id | ENSG00000141027 | |
| Description | nuclear receptor co-repressor 1protein phosphatase 1, regulatory subunit 109thyroid hormone- and retinoic acid receptor-associated corepressor 1 | |
| Modification date | 20141207 | |
| dbXrefs | MIM : 600849 | |
| HGNC : HGNC | ||
| Ensembl : ENSG00000141027 | ||
| HPRD : 02911 | ||
| Vega : OTTHUMG00000059309 | ||
| Protein | UniProt: O75376 go to UniProt's Cross Reference DB Table | |
| Expression | CleanEX: HS_NCOR1 | |
| BioGPS: 9611 | ||
| Gene Expression Atlas: ENSG00000141027 | ||
| The Human Protein Atlas: ENSG00000141027 | ||
| Pathway | NCI Pathway Interaction Database: NCOR1 | |
| KEGG: NCOR1 | ||
| REACTOME: NCOR1 | ||
| ConsensusPathDB | ||
| Pathway Commons: NCOR1 | ||
| Metabolism | MetaCyc: NCOR1 | |
| HUMANCyc: NCOR1 | ||
| Regulation | Ensembl's Regulation: ENSG00000141027 | |
| miRBase: chr17 :15,933,407-16,097,953 | ||
| TargetScan: NM_001190438 | ||
| cisRED: ENSG00000141027 | ||
| Context | iHOP: NCOR1 | |
| cancer metabolism search in PubMed: NCOR1 | ||
| UCL Cancer Institute: NCOR1 | ||
| Assigned class in ccmGDB | A - This gene has a literature evidence and it belongs to cancer gene. | |
| References showing role of NCOR1 in cancer cell metabolism | 1. Fan W, Evans R (2015) PPARs and ERRs: molecular mediators of mitochondrial metabolism. Current opinion in cell biology 33: 49-54. go to article | |
| Top |
| Phenotypic Information for NCOR1(metabolism pathway, cancer, disease, phenome) |
| Cancer | CGAP: NCOR1 |
| Familial Cancer Database: NCOR1 | |
| * This gene is included in those cancer gene databases. |
|
|
|
|
|
| . | ||||||||||||||||||||||||||||||||||||||||||||||||||||||||||||||||||||||||||||||||||||||||||||||||||||||||||||||||||||||||||||||||||||||||||||||||||||||||||||||||||||||||||||||||||||||||||||||||||||||||||||||||||||||||||||||||||||||||||||||||||||||||||||||||||||||||||||||||||||||||||||||||||||||||||||||||||||
Oncogene 1 | Significant driver gene in BRCA 6, | |||||||||||||||||||||||||||||||||||||||||||||||||||||||||||||||||||||||||||||||||||||||||||||||||||||||||||||||||||||||||||||||||||||||||||||||||||||||||||||||||||||||||||||||||||||||||||||||||||||||||||||||||||||||||||||||||||||||||||||||||||||||||||||||||||||||||||||||||||||||||||||||||||||||||||||||||||||||||
| cf) number; DB name 1 Oncogene; http://nar.oxfordjournals.org/content/35/suppl_1/D721.long, 2 Tumor Suppressor gene; https://bioinfo.uth.edu/TSGene/, 3 Cancer Gene Census; http://www.nature.com/nrc/journal/v4/n3/abs/nrc1299.html, 4 CancerGenes; http://nar.oxfordjournals.org/content/35/suppl_1/D721.long, 5 Network of Cancer Gene; http://ncg.kcl.ac.uk/index.php, 6 http://www.nature.com/nature/journal/v490/n7418/full/nature11412.html, 7Therapeutic Vulnerabilities in Cancer; http://cbio.mskcc.org/cancergenomics/statius/ |
| REACTOME_METABOLISM_OF_LIPIDS_AND_LIPOPROTEINS | |
| OMIM | 600849; gene. |
| Orphanet | |
| Disease | KEGG Disease: NCOR1 |
| MedGen: NCOR1 (Human Medical Genetics with Condition) | |
| ClinVar: NCOR1 | |
| Phenotype | MGI: NCOR1 (International Mouse Phenotyping Consortium) |
| PhenomicDB: NCOR1 | |
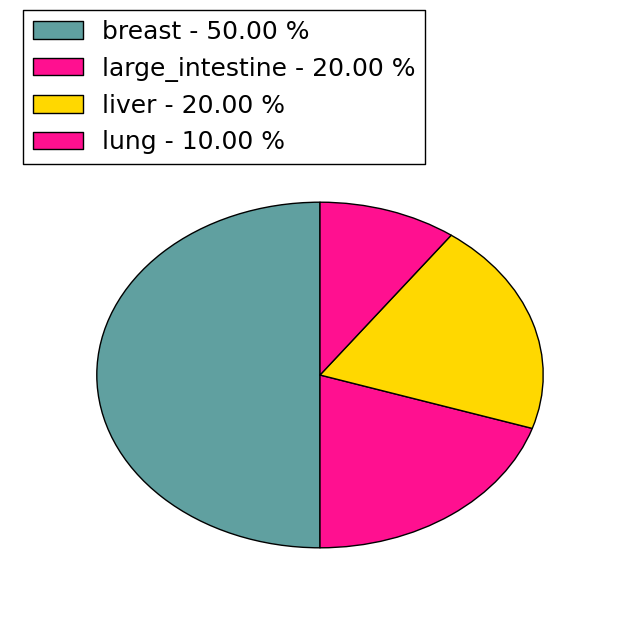
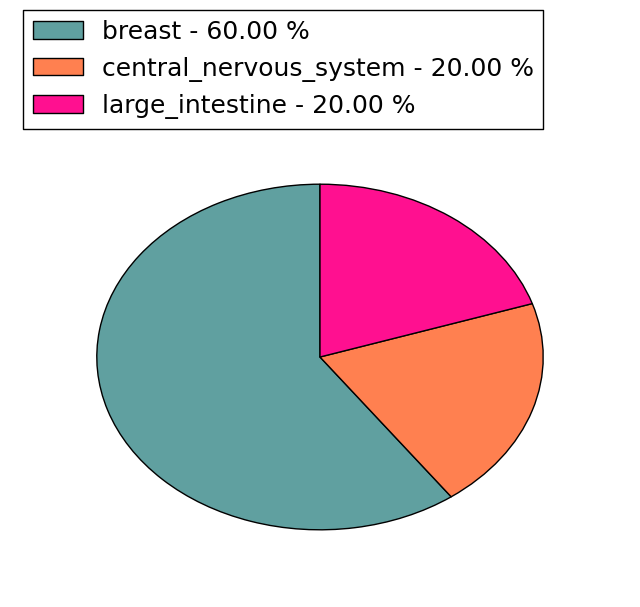
| Mutations for NCOR1 |
| * Under tables are showing count per each tissue to give us broad intuition about tissue specific mutation patterns.You can go to the detailed page for each mutation database's web site. |
| - Statistics for Tissue and Mutation type | Top |
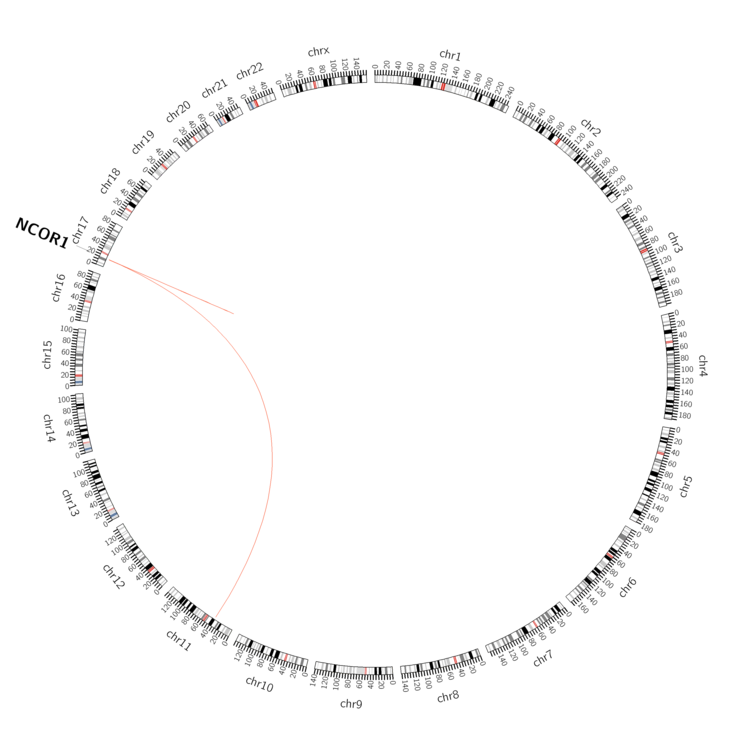 |
| - For Inter-chromosomal Variations |
| * Inter-chromosomal variantions includes 'interchromosomal amplicon to amplicon', 'interchromosomal amplicon to non-amplified dna', 'interchromosomal insertion', 'Interchromosomal unknown type'. |
 |
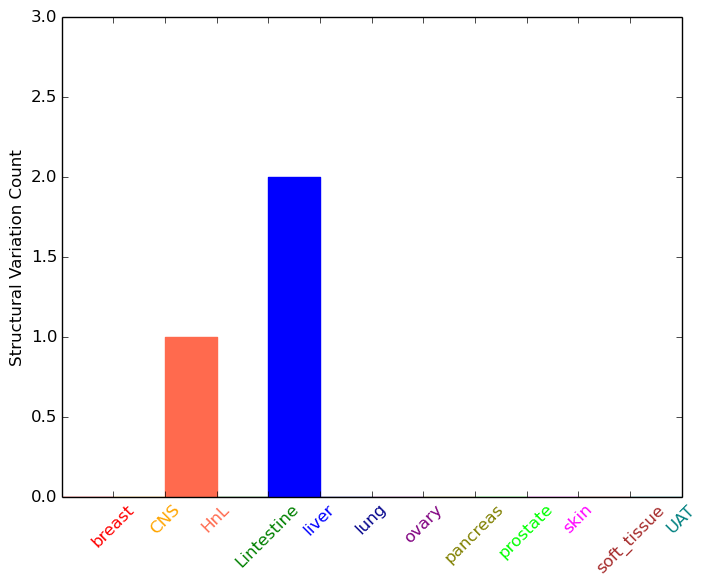
| - For Intra-chromosomal Variations |
| * Intra-chromosomal variantions includes 'intrachromosomal amplicon to amplicon', 'intrachromosomal amplicon to non-amplified dna', 'intrachromosomal deletion', 'intrachromosomal fold-back inversion', 'intrachromosomal inversion', 'intrachromosomal tandem duplication', 'Intrachromosomal unknown type', 'intrachromosomal with inverted orientation', 'intrachromosomal with non-inverted orientation'. |
 |
| Sample | Symbol_a | Chr_a | Start_a | End_a | Symbol_b | Chr_b | Start_b | End_b |
| haematopoietic_and_lymphoid_tissue | NCOR1 | chr17 | 16013690 | 16013690 | NCOR1 | chr17 | 16013690 | 16013690 |
| liver | NCOR1 | chr17 | 15961715 | 15961715 | NCOR1 | chr17 | 16115434 | 16115434 |
| liver | NCOR1 | chr17 | 15961720 | 15961720 | NCOR1 | chr17 | 16115480 | 16115480 |
| cf) Tissue number; Tissue name (1;Breast, 2;Central_nervous_system, 3;Haematopoietic_and_lymphoid_tissue, 4;Large_intestine, 5;Liver, 6;Lung, 7;Ovary, 8;Pancreas, 9;Prostate, 10;Skin, 11;Soft_tissue, 12;Upper_aerodigestive_tract) |
| * From mRNA Sanger sequences, Chitars2.0 arranged chimeric transcripts. This table shows NCOR1 related fusion information. |
| ID | Head Gene | Tail Gene | Accession | Gene_a | qStart_a | qEnd_a | Chromosome_a | tStart_a | tEnd_a | Gene_a | qStart_a | qEnd_a | Chromosome_a | tStart_a | tEnd_a |
| BM836125 | NCOR1 | 10 | 273 | 17 | 16029416 | 16041526 | SF3B1 | 266 | 360 | 2 | 198264798 | 198264892 | |
| BF961392 | PHF21B | 31 | 378 | 22 | 45280646 | 45280992 | NCOR1 | 369 | 482 | 17 | 15945890 | 15946003 | |
| BU192483 | TTC19 | 1 | 297 | 17 | 15928353 | 15930017 | NCOR1 | 295 | 883 | 17 | 15935395 | 15938260 | |
| AW373603 | NCOR1 | 16 | 274 | 17 | 16049710 | 16055297 | RDX | 269 | 550 | 11 | 110101812 | 110102093 | |
| Top |
| Mutation type/ Tissue ID | brca | cns | cerv | endome | haematopo | kidn | Lintest | liver | lung | ns | ovary | pancre | prost | skin | stoma | thyro | urina | |||
| Total # sample | 2 | 5 | 1 | 2 | 1 | |||||||||||||||
| GAIN (# sample) | ||||||||||||||||||||
| LOSS (# sample) | 2 | 5 | 1 | 2 | 1 |
| cf) Tissue ID; Tissue type (1; Breast, 2; Central_nervous_system, 3; Cervix, 4; Endometrium, 5; Haematopoietic_and_lymphoid_tissue, 6; Kidney, 7; Large_intestine, 8; Liver, 9; Lung, 10; NS, 11; Ovary, 12; Pancreas, 13; Prostate, 14; Skin, 15; Stomach, 16; Thyroid, 17; Urinary_tract) |
| Top |
|
 |
| Top |
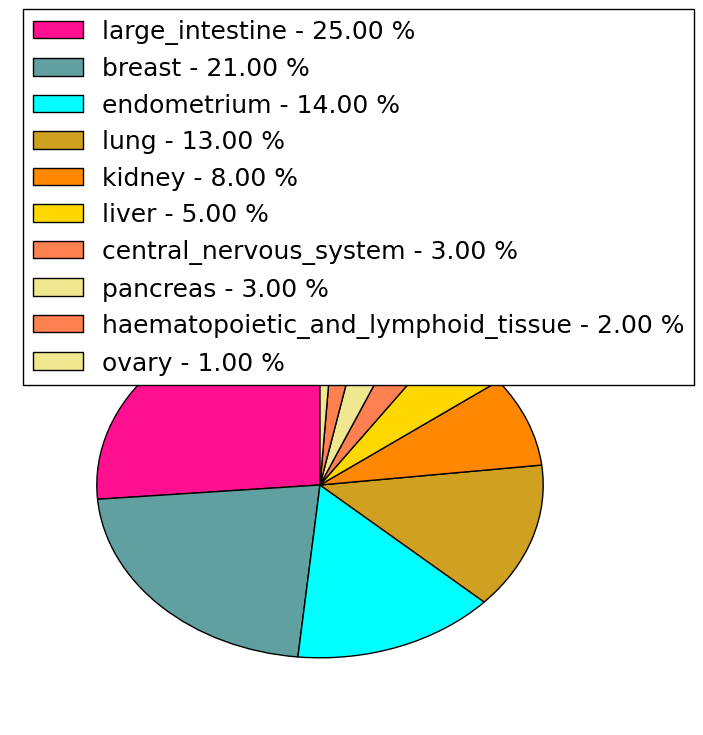
| Stat. for Non-Synonymous SNVs (# total SNVs=190) | (# total SNVs=44) |
 | 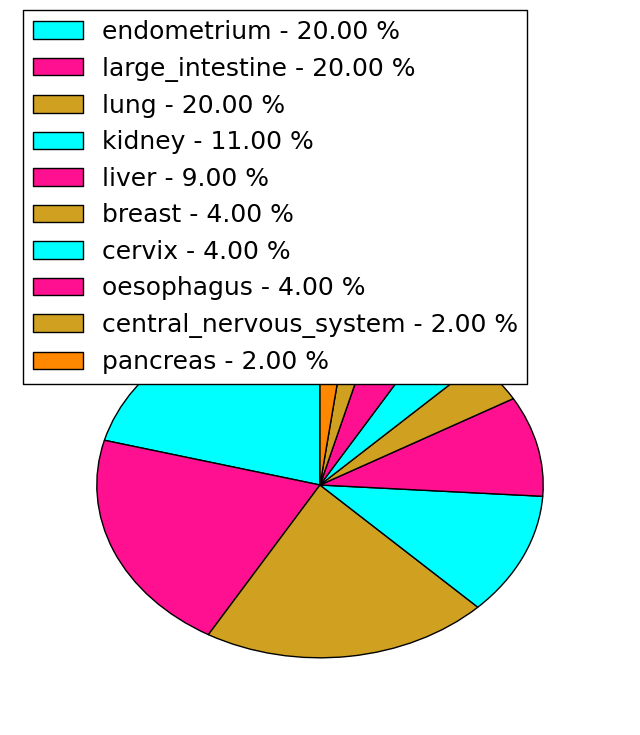 |
(# total SNVs=10) | (# total SNVs=5) |
 |  |
| Top |
| * When you move the cursor on each content, you can see more deailed mutation information on the Tooltip. Those are primary_site,primary_histology,mutation(aa),pubmedID. |
| GRCh37 position | Mutation(aa) | Unique sampleID count |
| chr17:16068463-16068463 | p.G150R | 6 |
| chr17:16097825-16097825 | p.Y20S | 5 |
| chr17:16068396-16068396 | p.S172L | 5 |
| chr17:16089913-16089913 | p.R66Q | 5 |
| chr17:15995292-15995292 | p.M967I | 4 |
| chr17:16005005-16005005 | p.A750V | 3 |
| chr17:16024504-16024504 | p.R572* | 3 |
| chr17:15973643-15973643 | p.S1450L | 3 |
| chr17:15995176-15995176 | p.? | 3 |
| chr17:16068444-16068444 | p.P156L | 3 |
| Top |
|
 |
| Point Mutation/ Tissue ID | 1 | 2 | 3 | 4 | 5 | 6 | 7 | 8 | 9 | 10 | 11 | 12 | 13 | 14 | 15 | 16 | 17 | 18 | 19 | 20 |
| # sample | 9 | 11 | 2 | 33 | 2 | 10 | 11 | 3 | 15 | 8 | 1 | 1 | 4 | 18 | 21 | 2 | 21 | |||
| # mutation | 10 | 11 | 2 | 36 | 2 | 10 | 11 | 3 | 18 | 8 | 1 | 1 | 4 | 20 | 29 | 2 | 32 | |||
| nonsynonymous SNV | 9 | 9 | 28 | 2 | 9 | 7 | 2 | 15 | 5 | 1 | 1 | 3 | 18 | 20 | 23 | |||||
| synonymous SNV | 1 | 2 | 2 | 8 | 1 | 4 | 1 | 3 | 3 | 1 | 2 | 9 | 2 | 9 |
| cf) Tissue ID; Tissue type (1; BLCA[Bladder Urothelial Carcinoma], 2; BRCA[Breast invasive carcinoma], 3; CESC[Cervical squamous cell carcinoma and endocervical adenocarcinoma], 4; COAD[Colon adenocarcinoma], 5; GBM[Glioblastoma multiforme], 6; Glioma Low Grade, 7; HNSC[Head and Neck squamous cell carcinoma], 8; KICH[Kidney Chromophobe], 9; KIRC[Kidney renal clear cell carcinoma], 10; KIRP[Kidney renal papillary cell carcinoma], 11; LAML[Acute Myeloid Leukemia], 12; LUAD[Lung adenocarcinoma], 13; LUSC[Lung squamous cell carcinoma], 14; OV[Ovarian serous cystadenocarcinoma ], 15; PAAD[Pancreatic adenocarcinoma], 16; PRAD[Prostate adenocarcinoma], 17; SKCM[Skin Cutaneous Melanoma], 18:STAD[Stomach adenocarcinoma], 19:THCA[Thyroid carcinoma], 20:UCEC[Uterine Corpus Endometrial Carcinoma]) |
| Top |
| * We represented just top 10 SNVs. When you move the cursor on each content, you can see more deailed mutation information on the Tooltip. Those are primary_site, primary_histology, mutation(aa), pubmedID. |
| Genomic Position | Mutation(aa) | Unique sampleID count |
| chr17:15995292 | p.M874I,NCOR1 | 4 |
| chr17:15971267 | p.E584D,NCOR1 | 2 |
| chr17:15983977 | p.M874V,NCOR1 | 2 |
| chr17:15943783 | p.G1685G,NCOR1 | 2 |
| chr17:15995294 | p.D37Y,NCOR1 | 2 |
| chr17:15989674 | p.I2132M,NCOR1 | 2 |
| chr17:15973548 | p.P1097Q,NCOR1 | 2 |
| chr17:15968278 | p.R1498W,NCOR1 | 2 |
| chr17:15978996 | p.P1049P,NCOR1 | 2 |
| chr17:16012203 | p.Q60E,NCOR1 | 2 |
| * Copy number data were extracted from TCGA using R package TCGA-Assembler. The URLs of all public data files on TCGA DCC data server were gathered on Jan-05-2015. Function ProcessCNAData in TCGA-Assembler package was used to obtain gene-level copy number value which is calculated as the average copy number of the genomic region of a gene. |
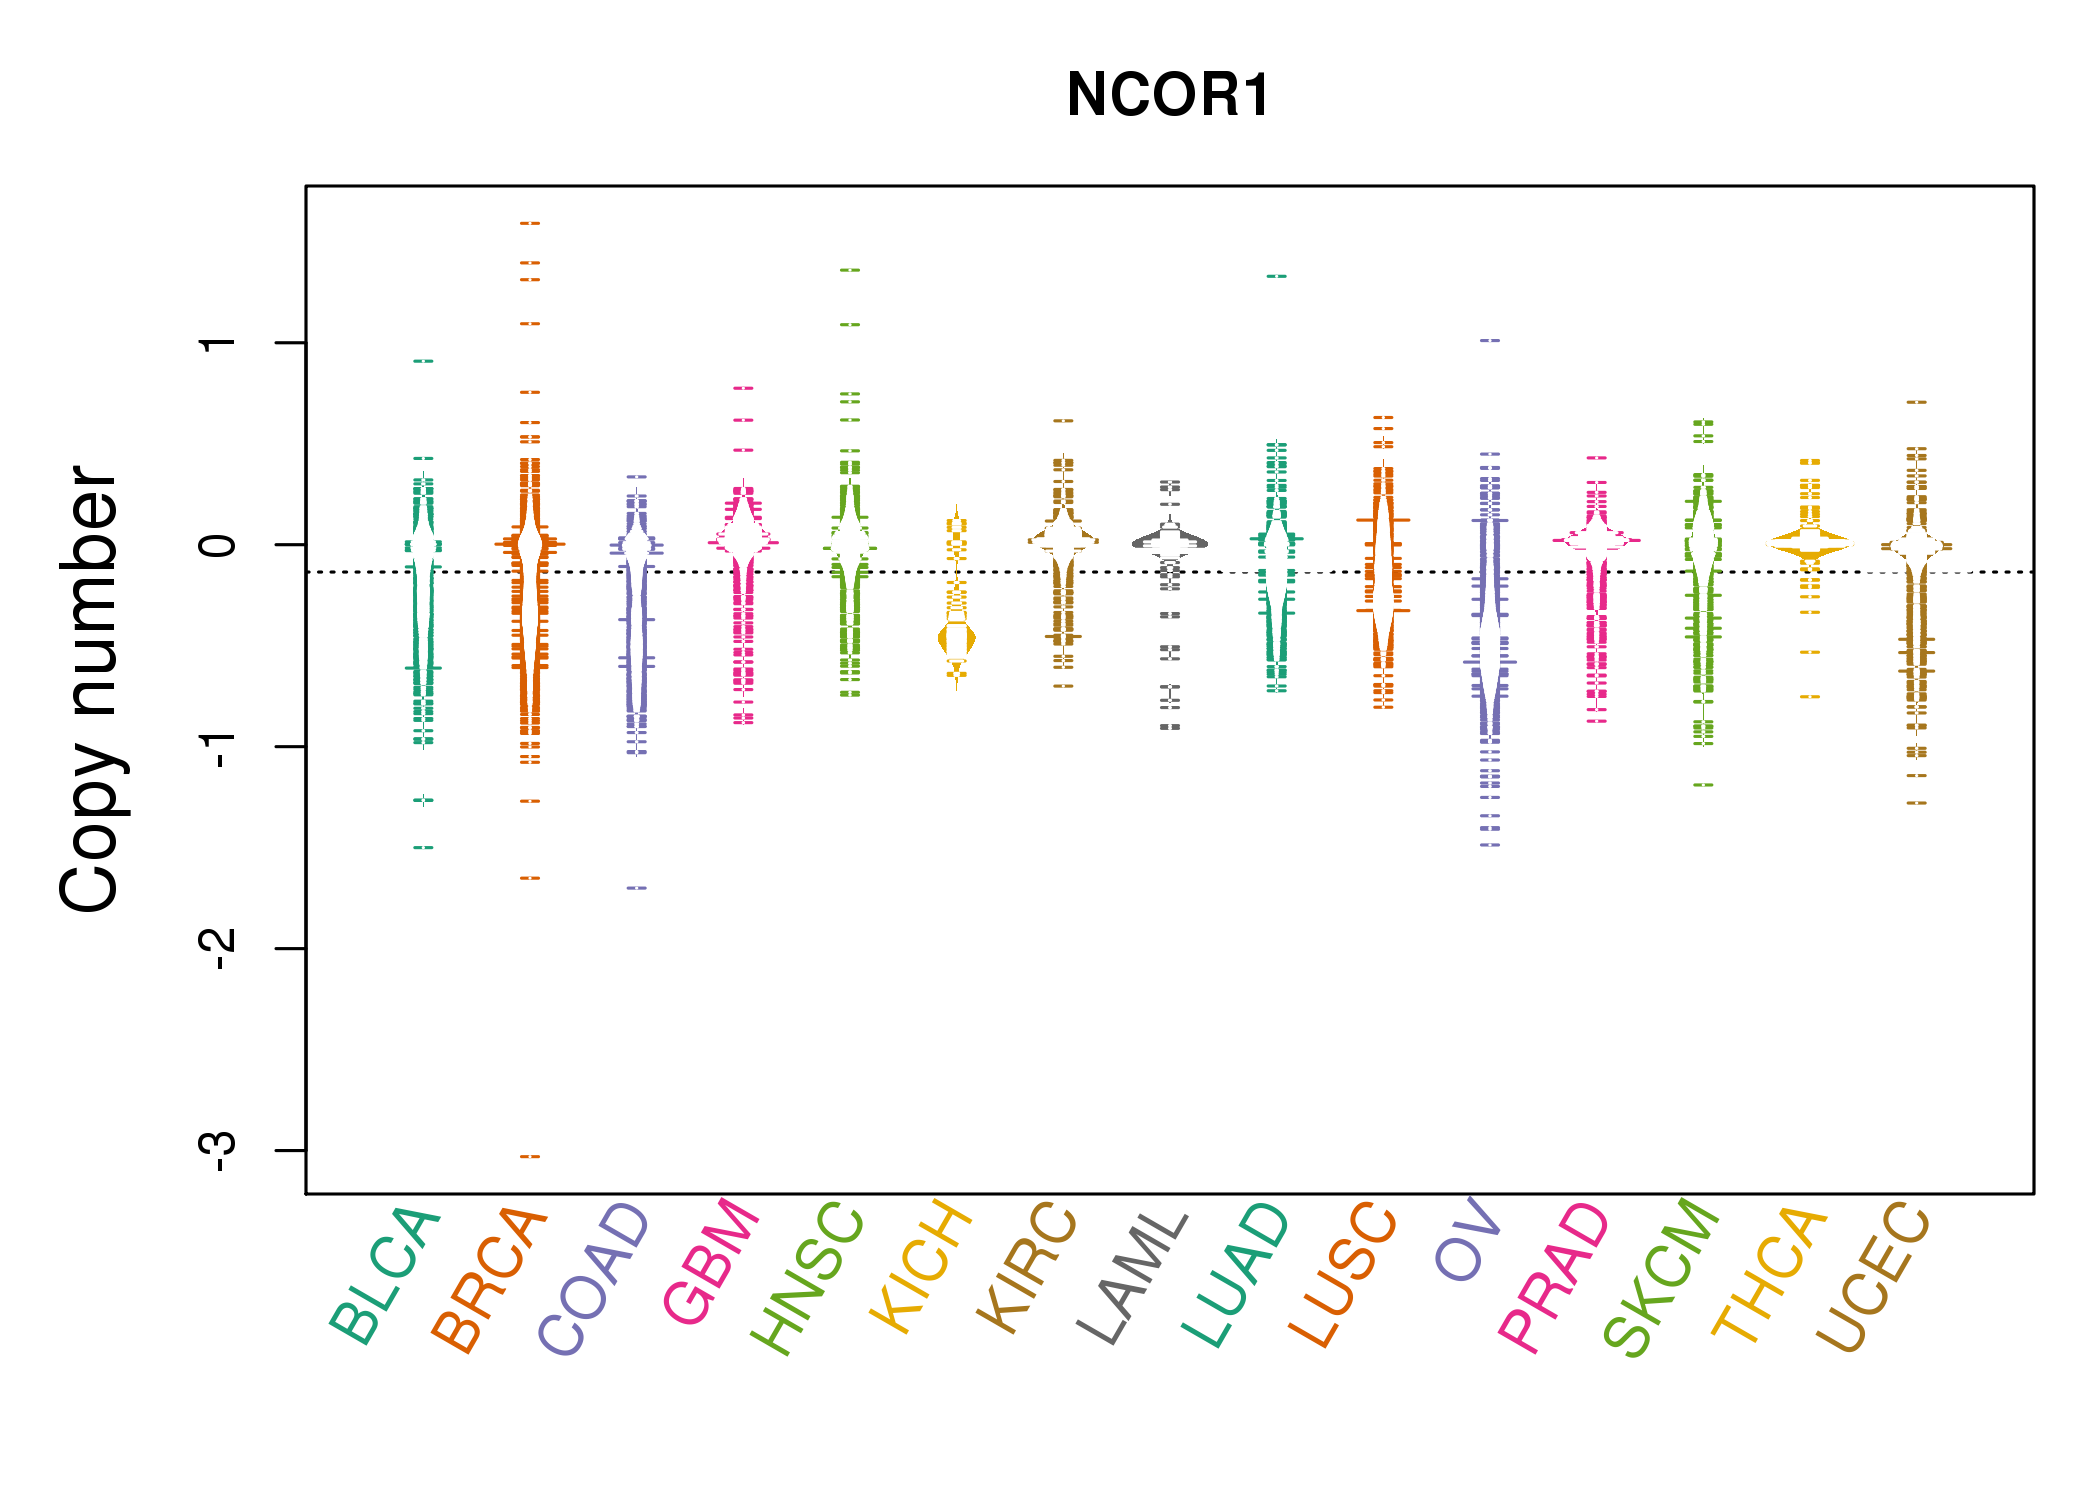 |
| cf) Tissue ID[Tissue type]: BLCA[Bladder Urothelial Carcinoma], BRCA[Breast invasive carcinoma], CESC[Cervical squamous cell carcinoma and endocervical adenocarcinoma], COAD[Colon adenocarcinoma], GBM[Glioblastoma multiforme], Glioma Low Grade, HNSC[Head and Neck squamous cell carcinoma], KICH[Kidney Chromophobe], KIRC[Kidney renal clear cell carcinoma], KIRP[Kidney renal papillary cell carcinoma], LAML[Acute Myeloid Leukemia], LUAD[Lung adenocarcinoma], LUSC[Lung squamous cell carcinoma], OV[Ovarian serous cystadenocarcinoma ], PAAD[Pancreatic adenocarcinoma], PRAD[Prostate adenocarcinoma], SKCM[Skin Cutaneous Melanoma], STAD[Stomach adenocarcinoma], THCA[Thyroid carcinoma], UCEC[Uterine Corpus Endometrial Carcinoma] |
| Top |
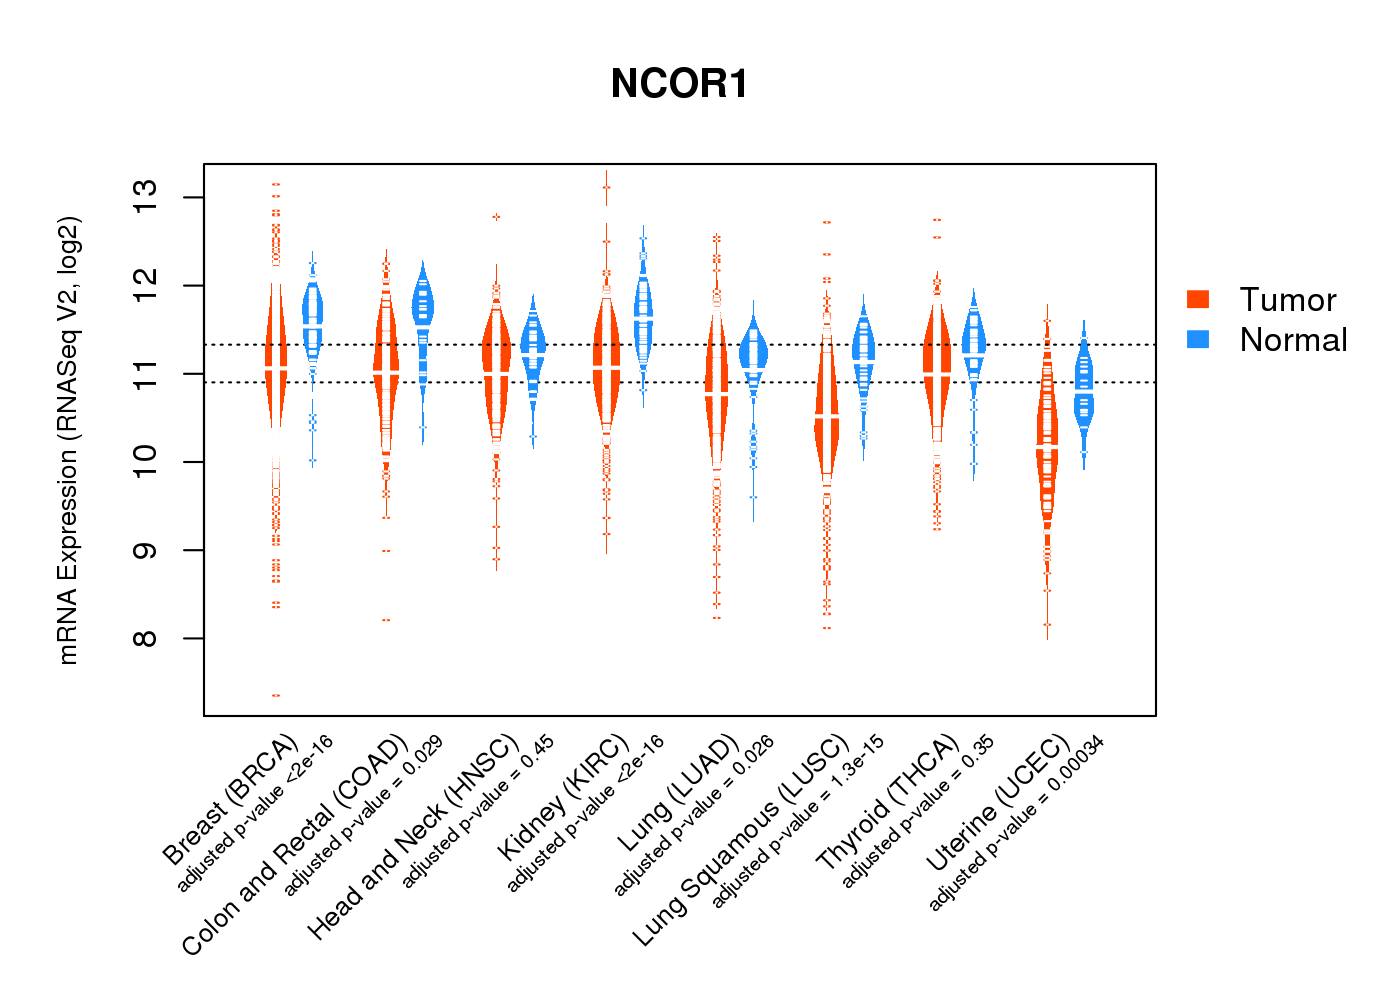
| Gene Expression for NCOR1 |
| * CCLE gene expression data were extracted from CCLE_Expression_Entrez_2012-10-18.res: Gene-centric RMA-normalized mRNA expression data. |
 |
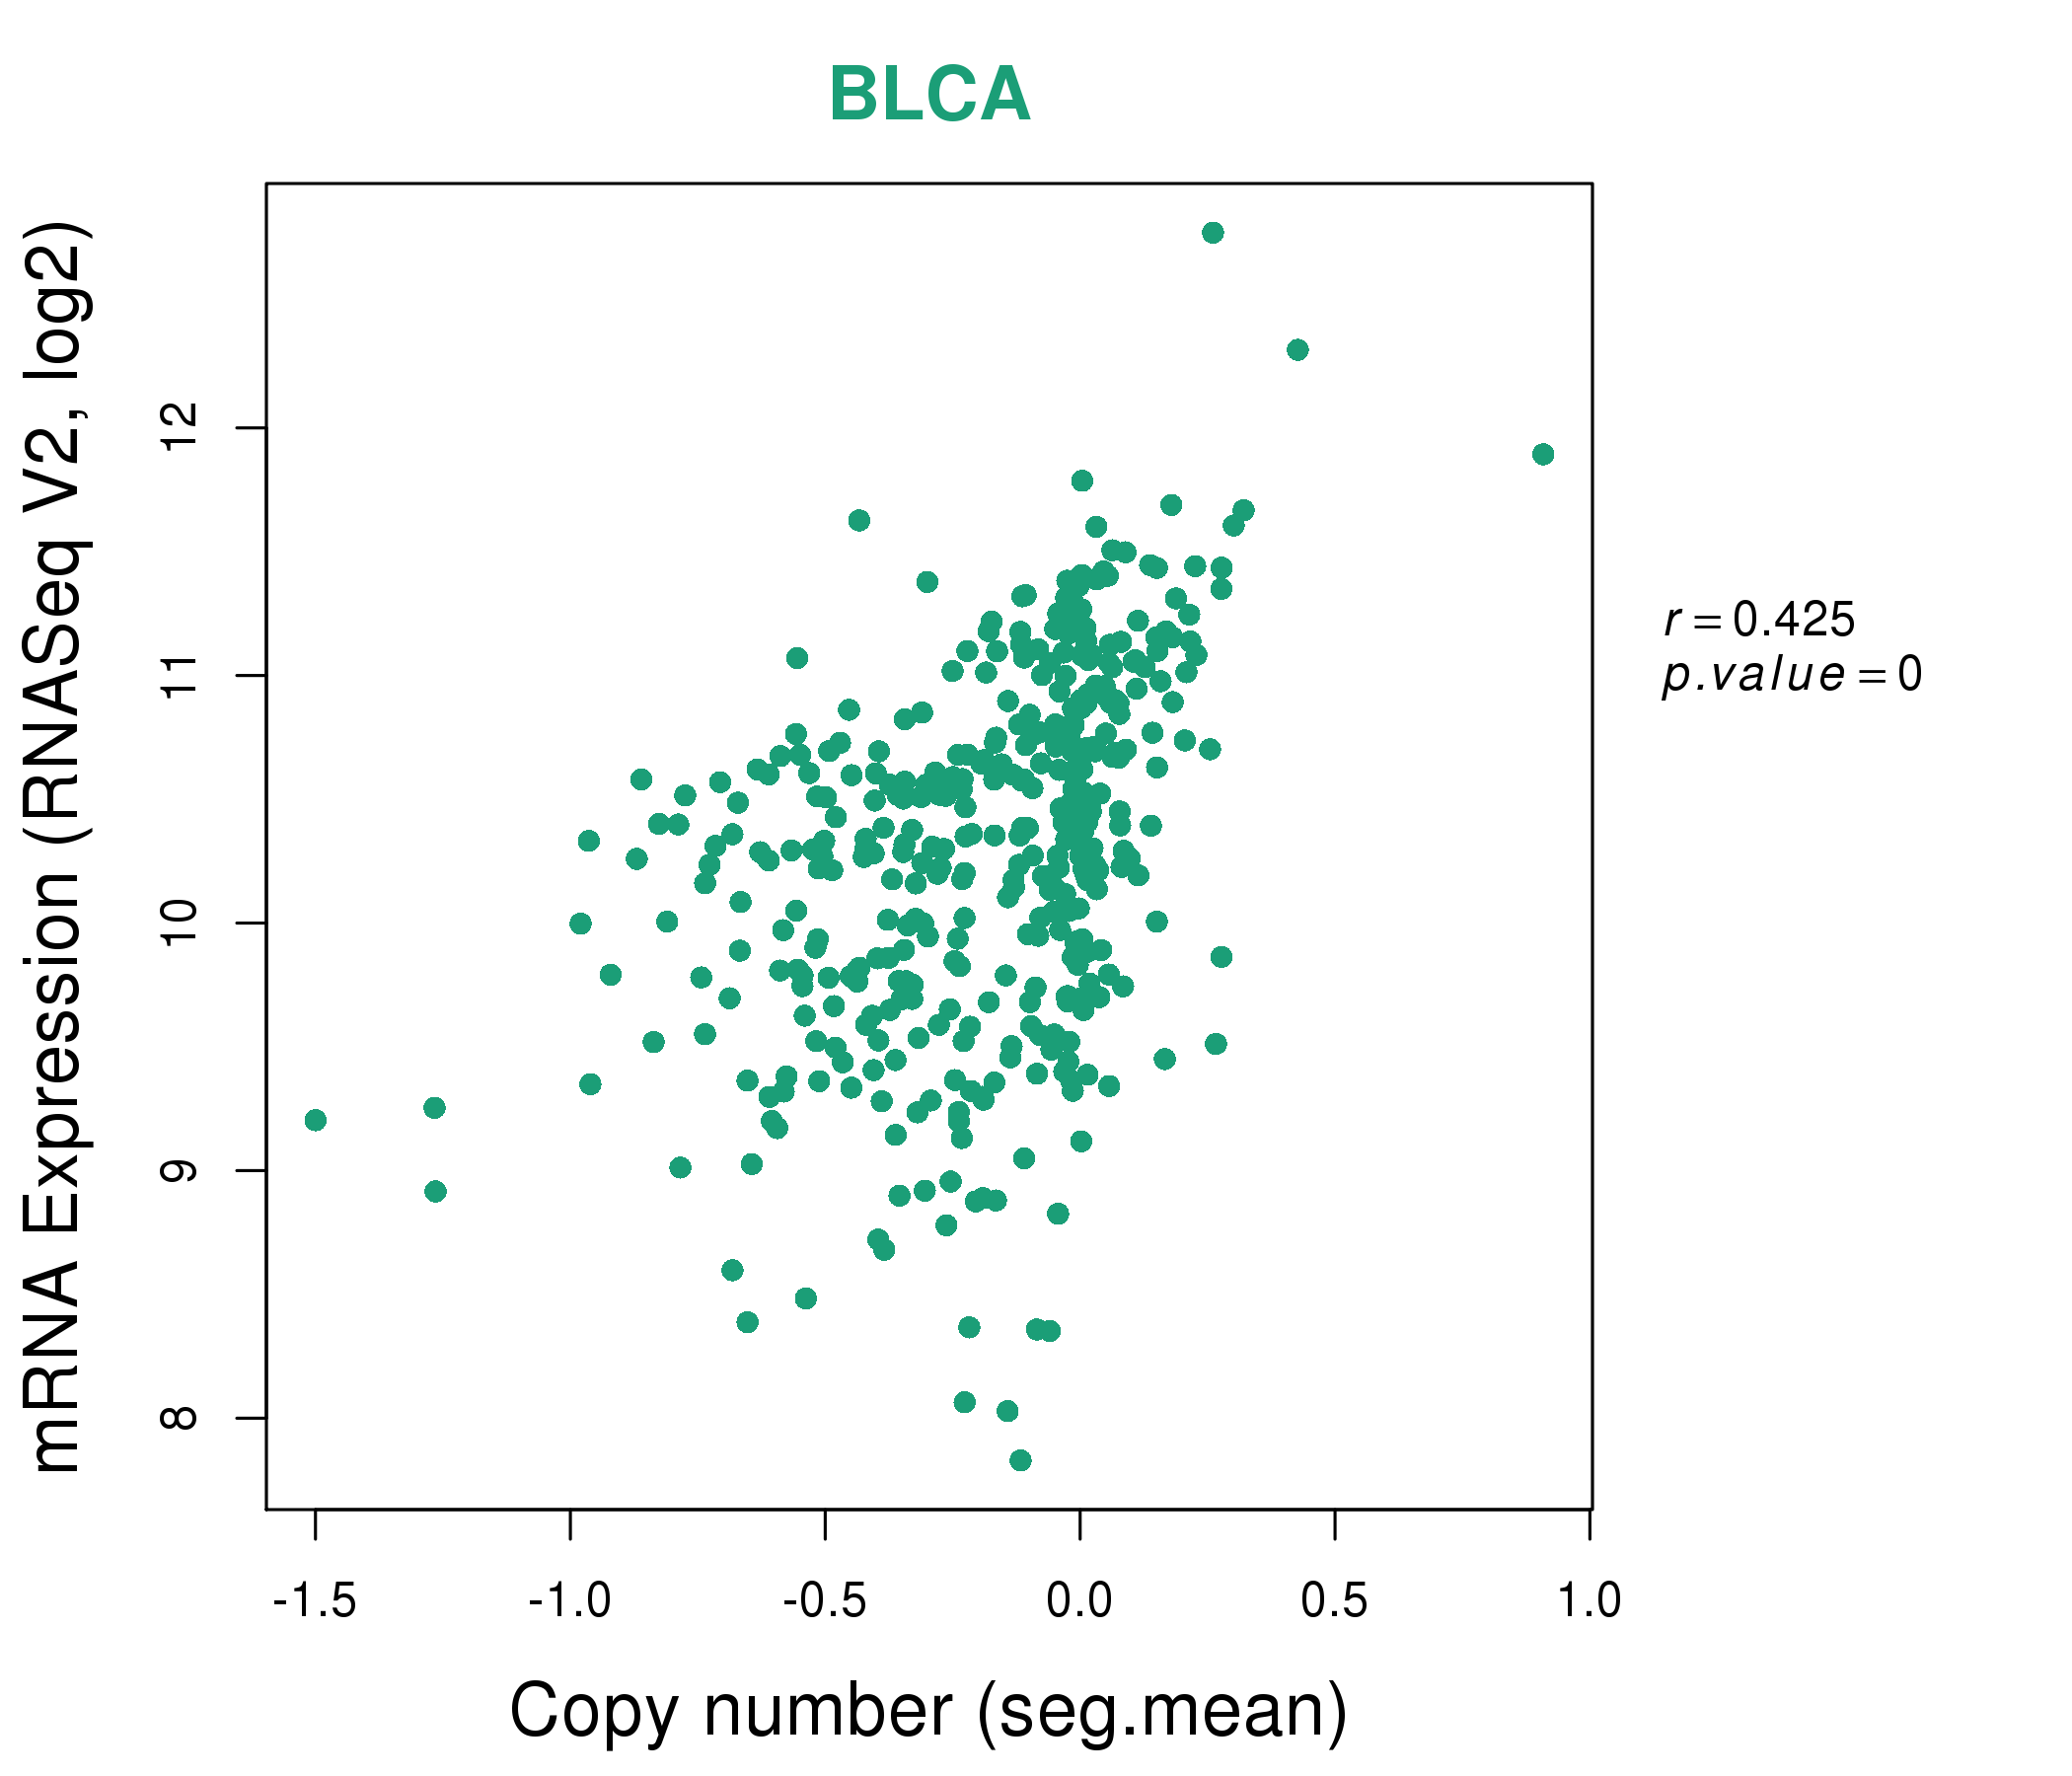
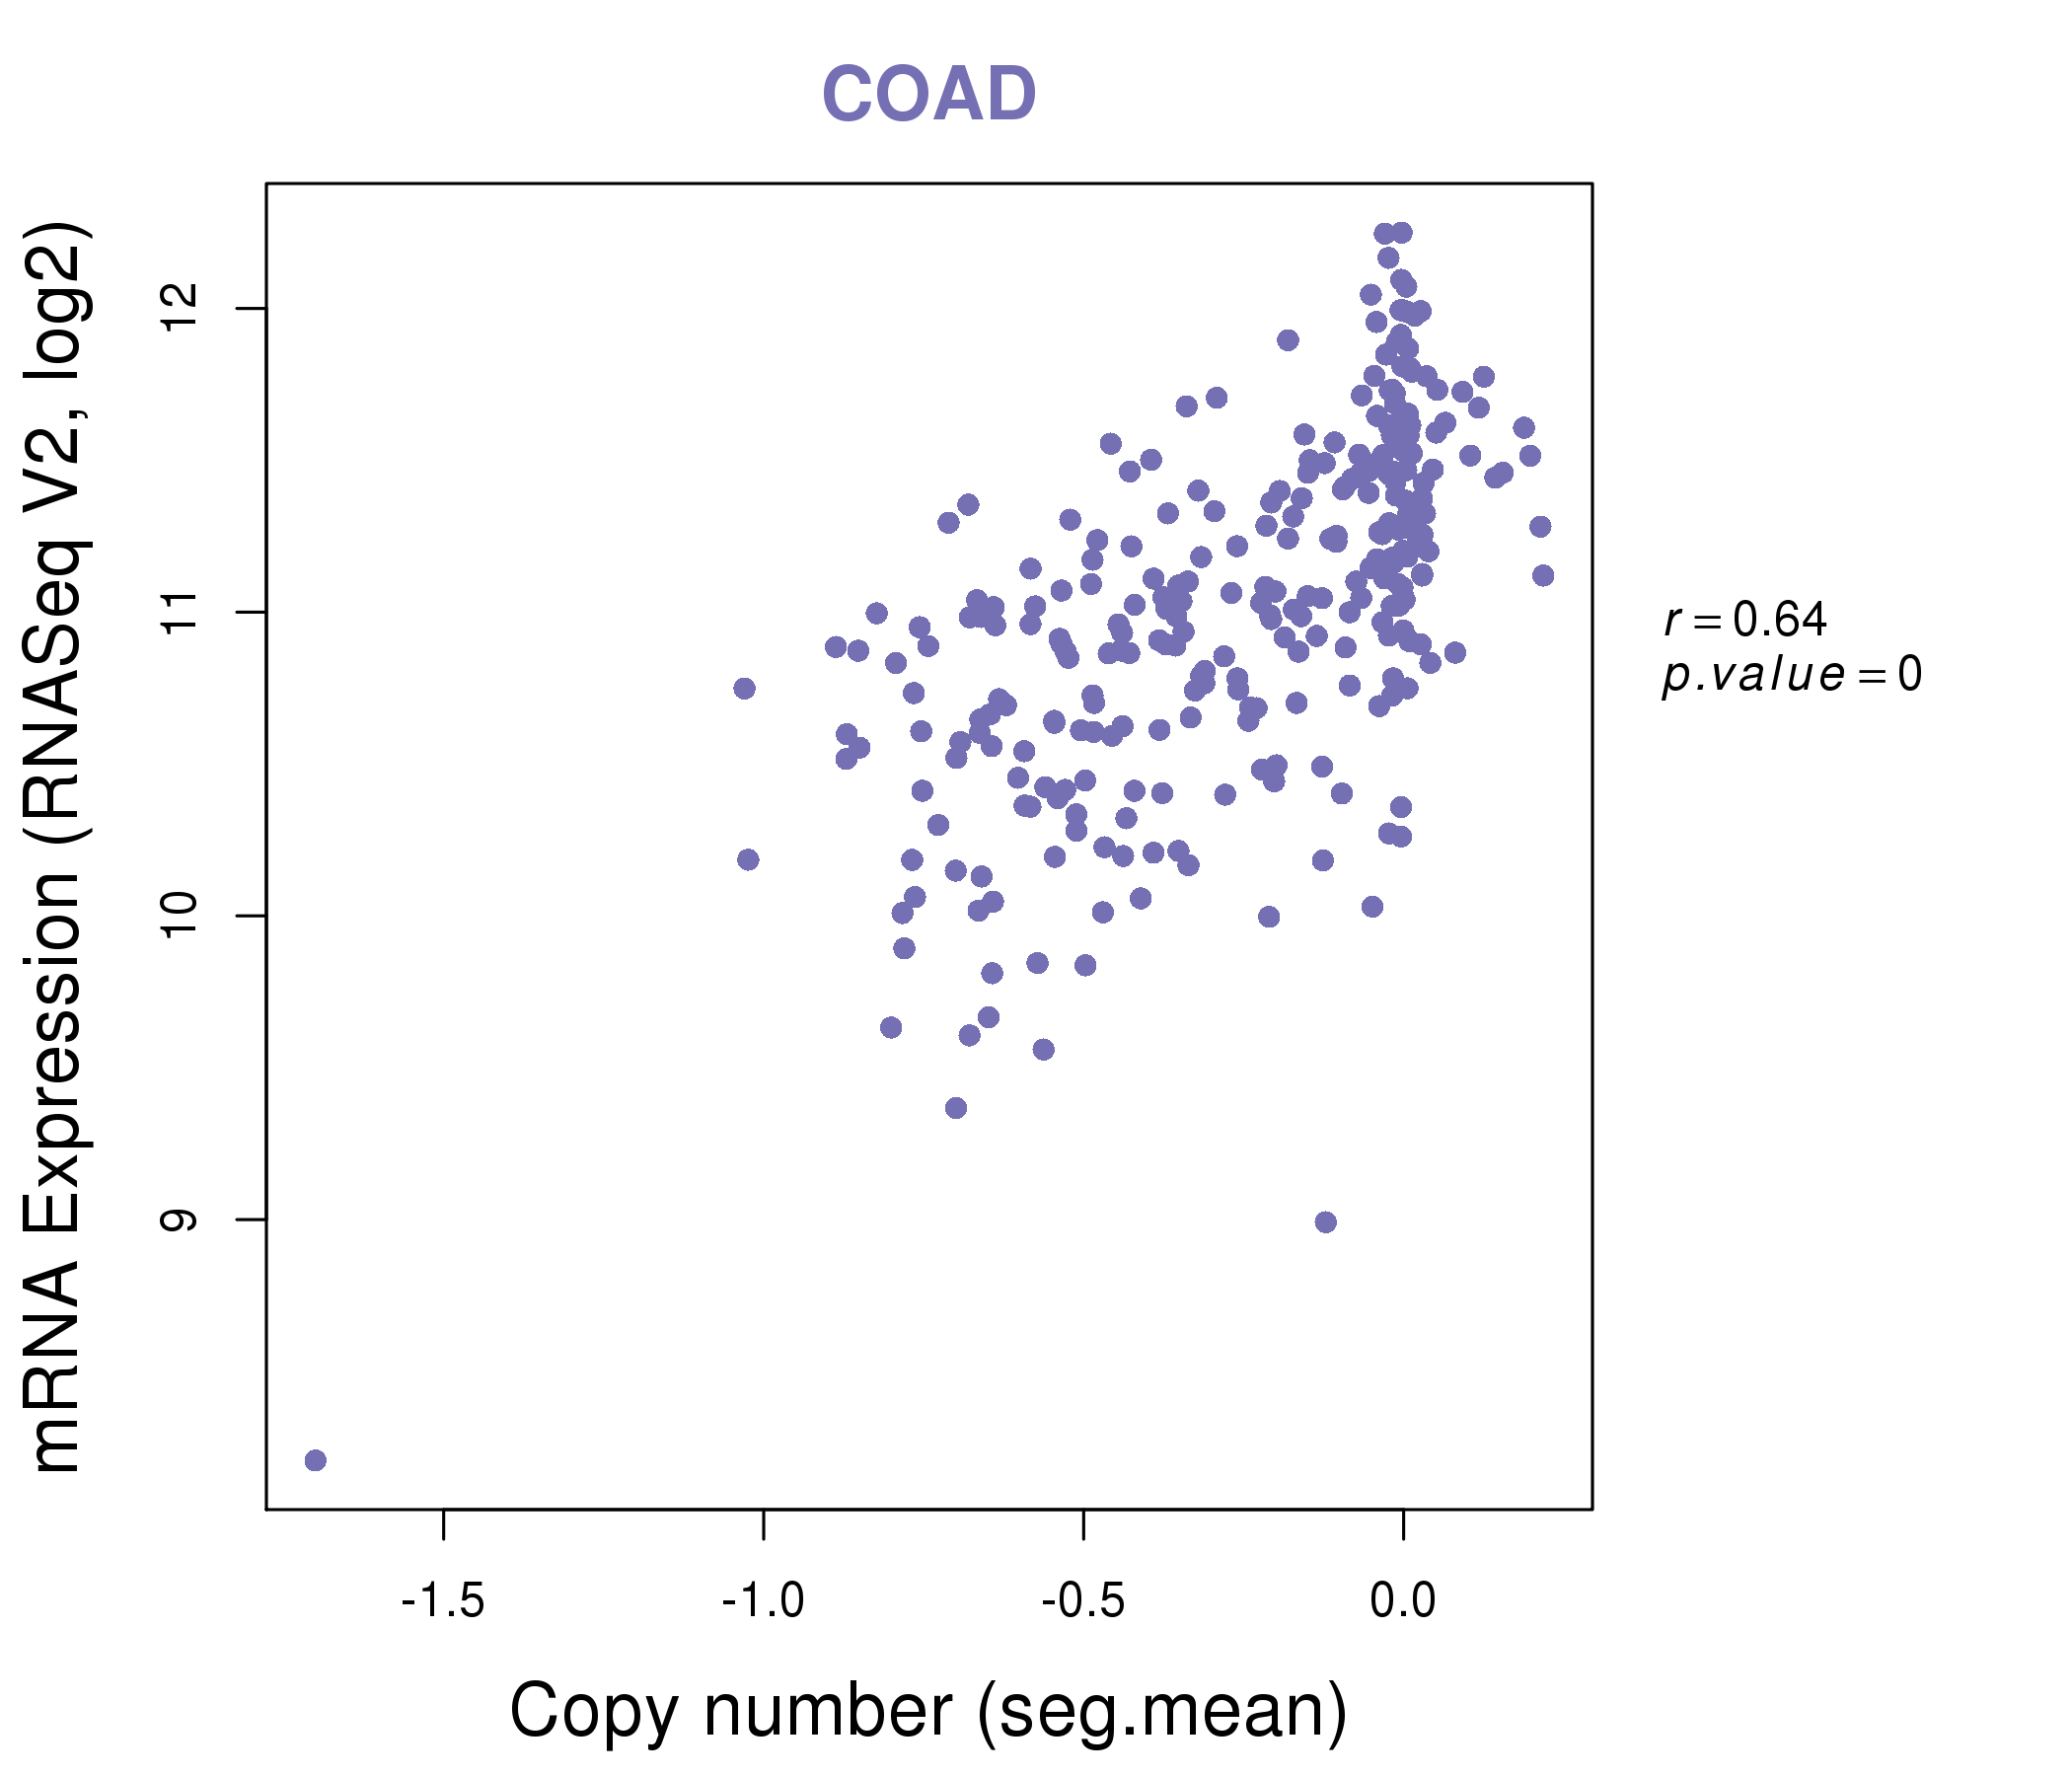
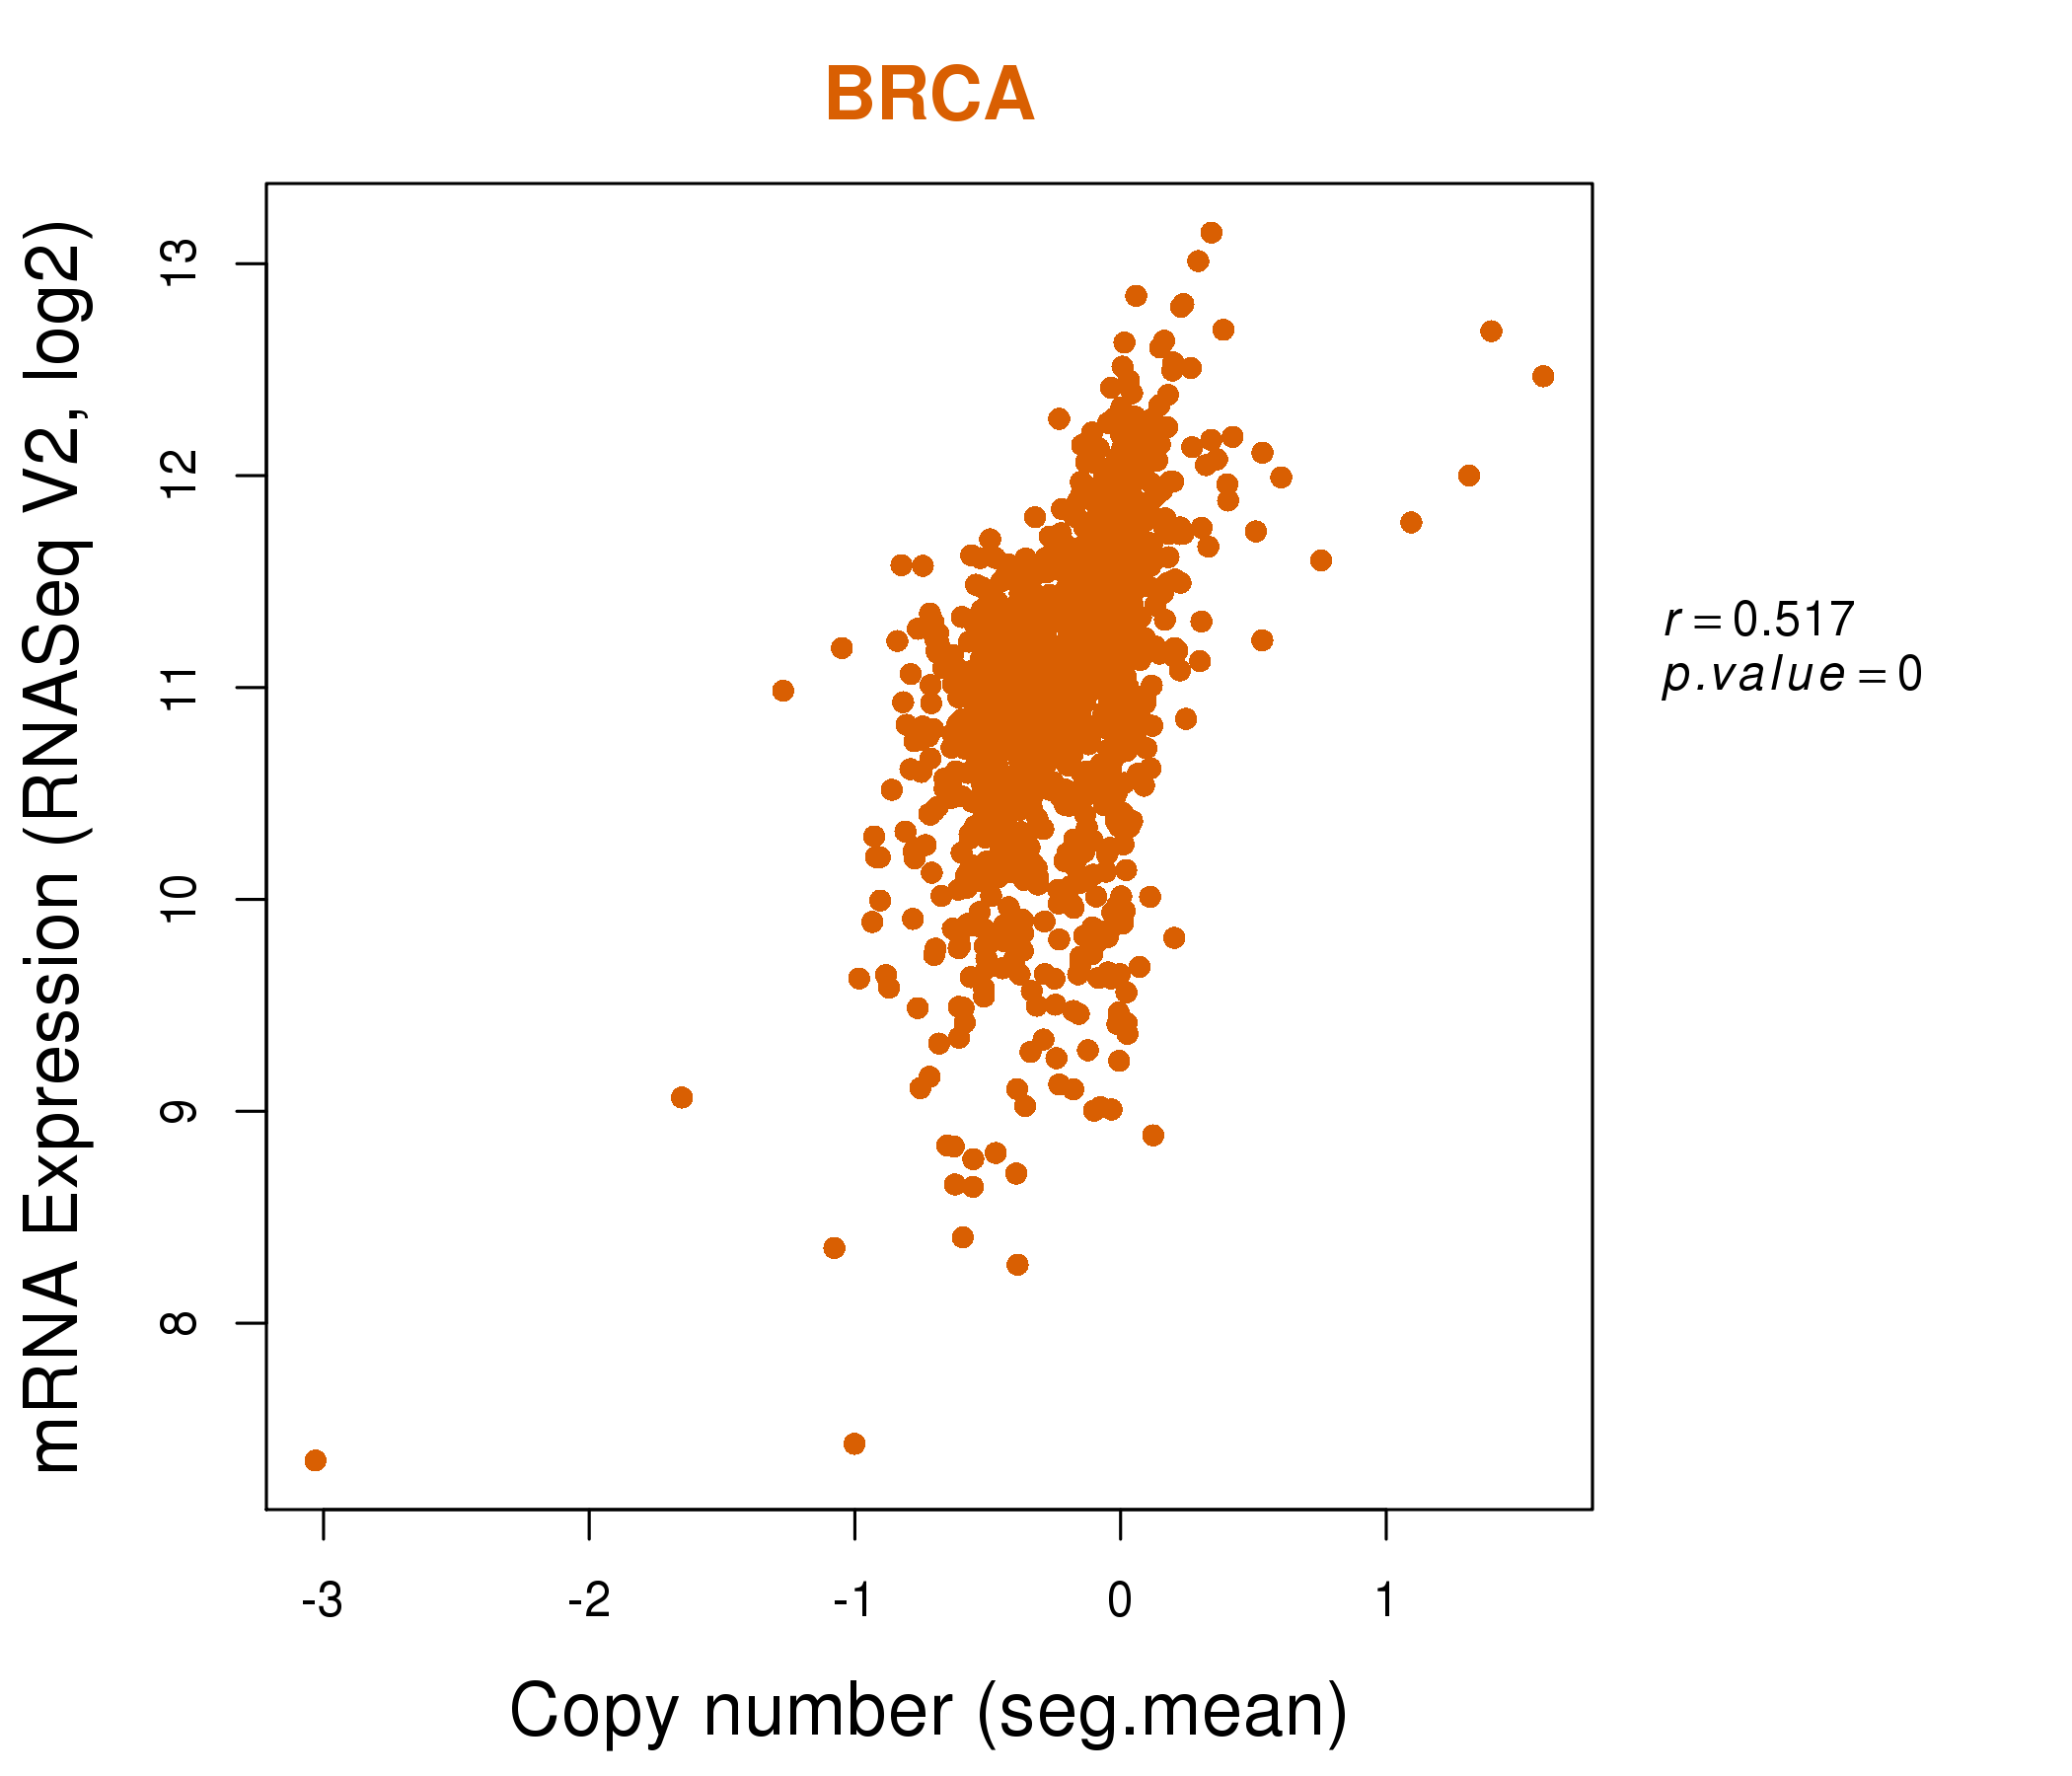
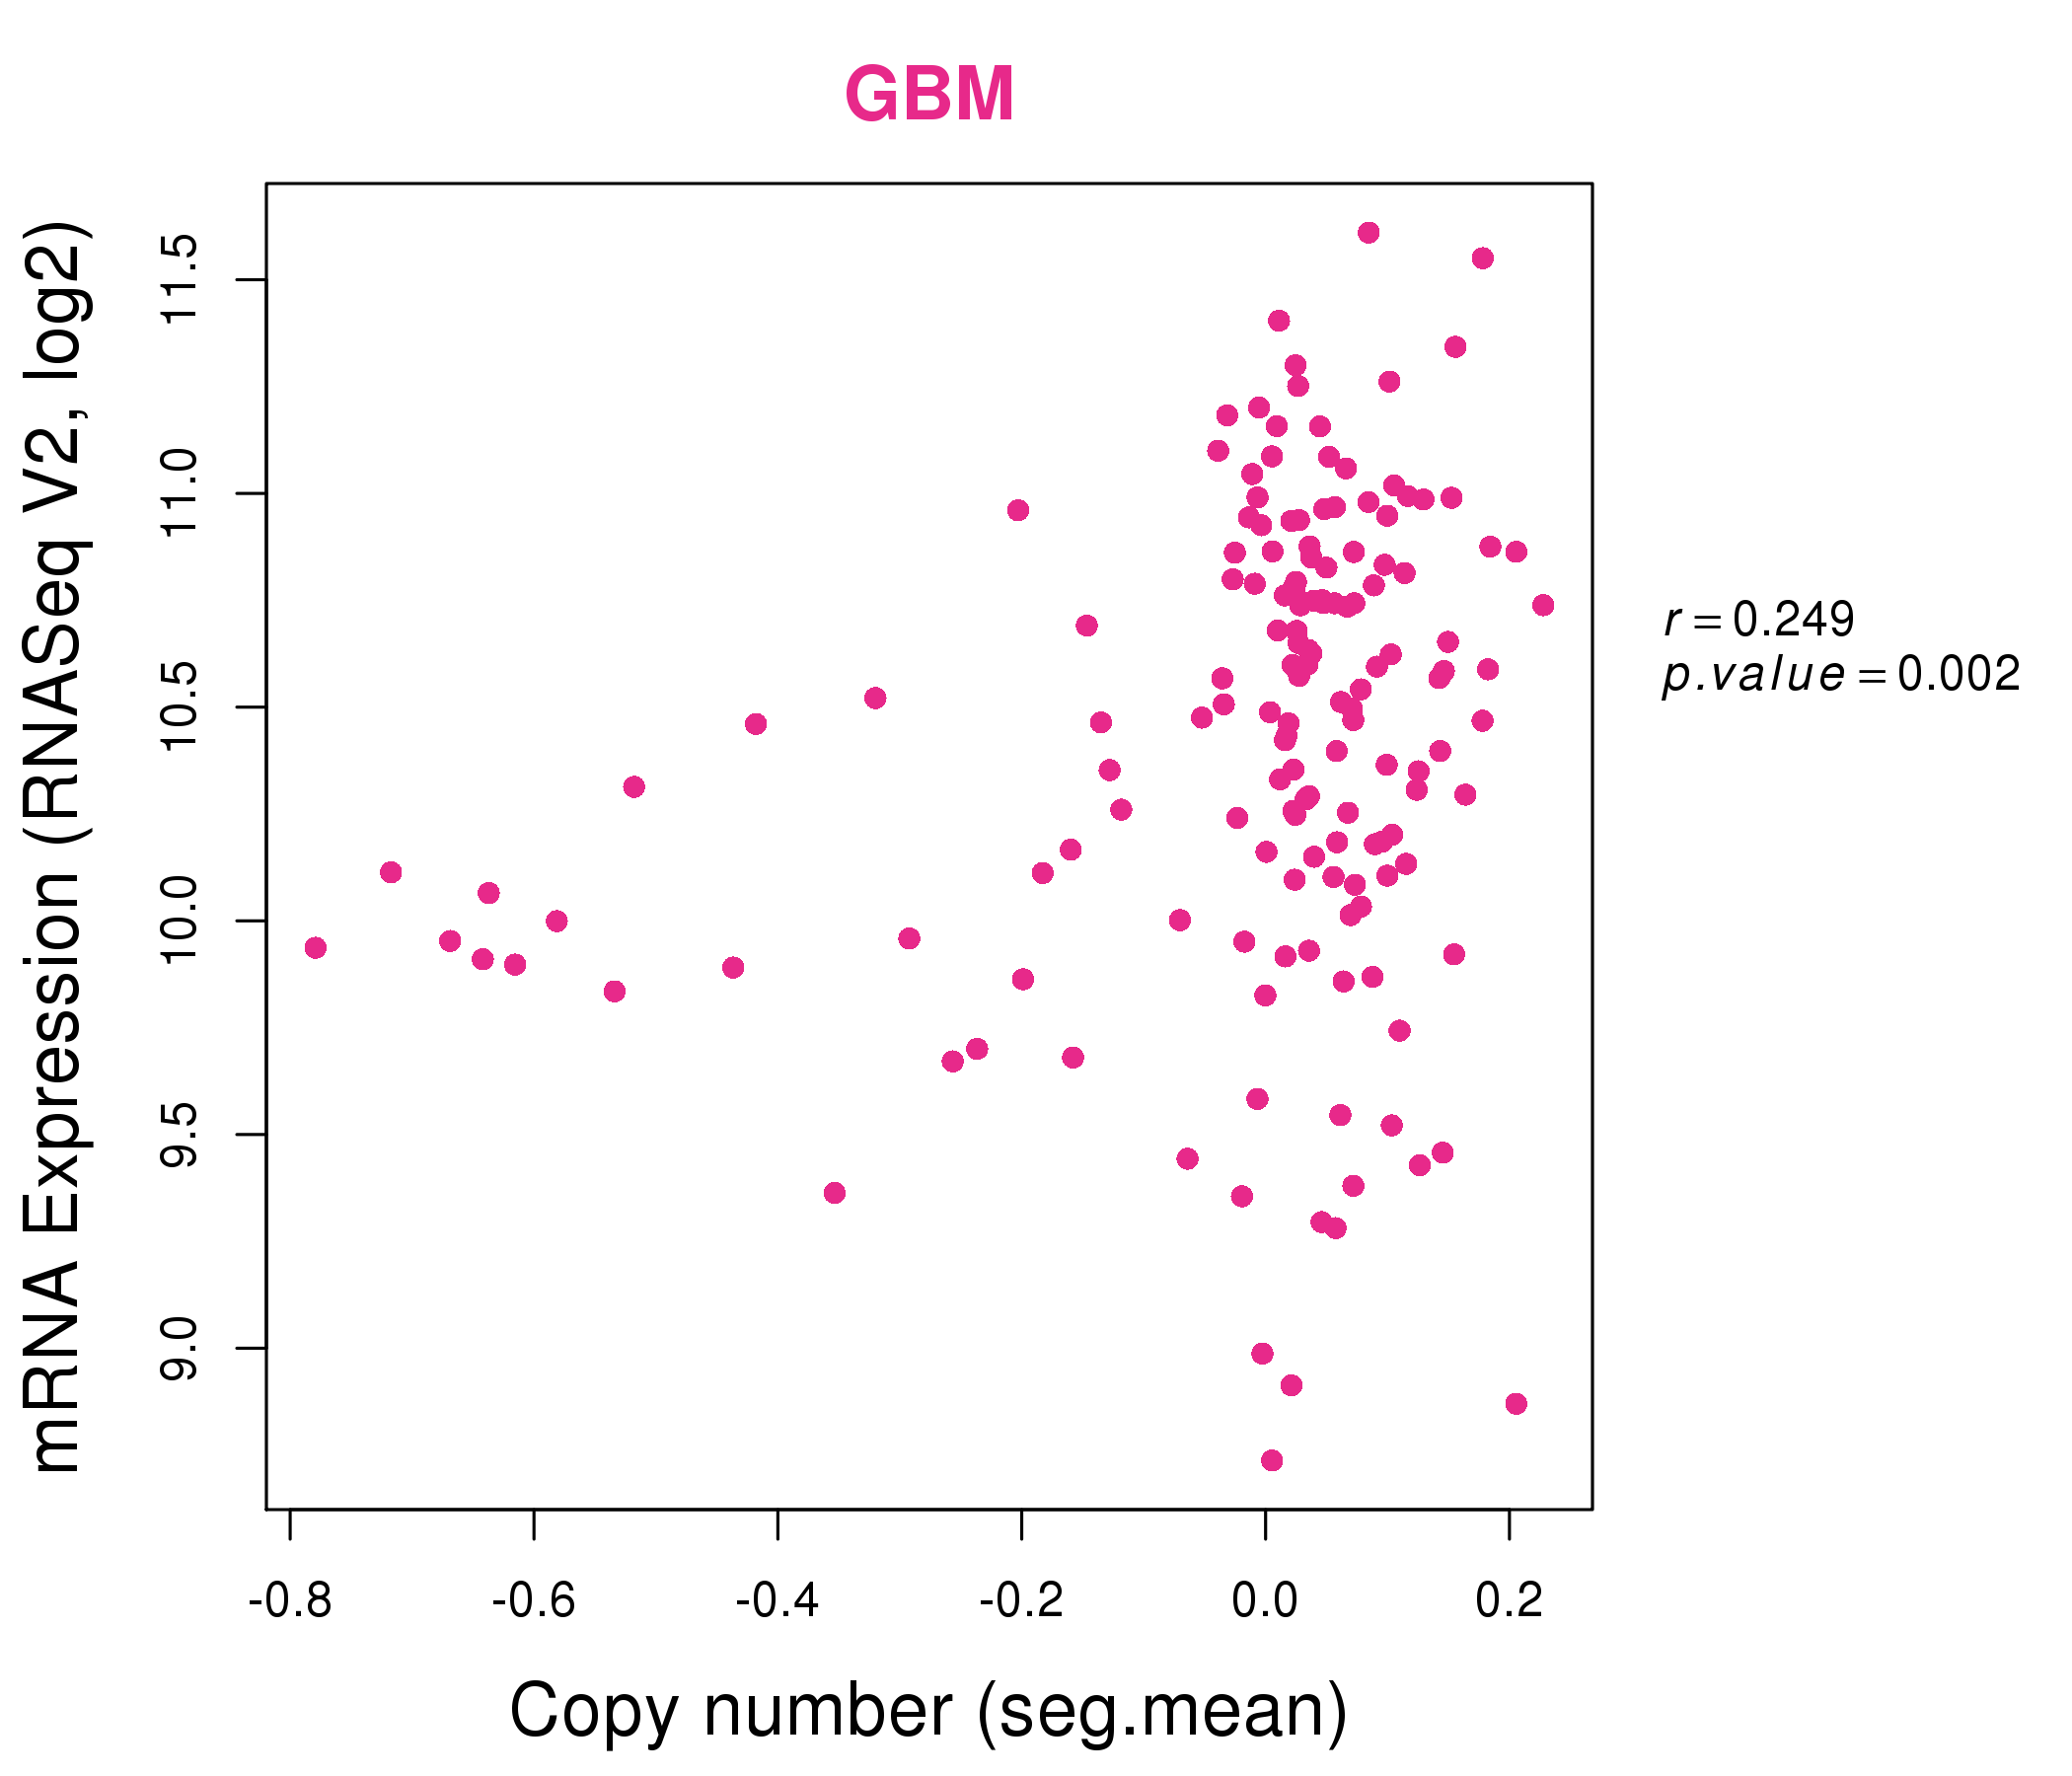
| * Normalized gene expression data of RNASeqV2 was extracted from TCGA using R package TCGA-Assembler. The URLs of all public data files on TCGA DCC data server were gathered at Jan-05-2015. Only eight cancer types have enough normal control samples for differential expression analysis. (t test, adjusted p<0.05 (using Benjamini-Hochberg FDR)) |
 |
| Top |
| * This plots show the correlation between CNV and gene expression. |
: Open all plots for all cancer types
 |
|
 |
|
| Top |
| Gene-Gene Network Information |
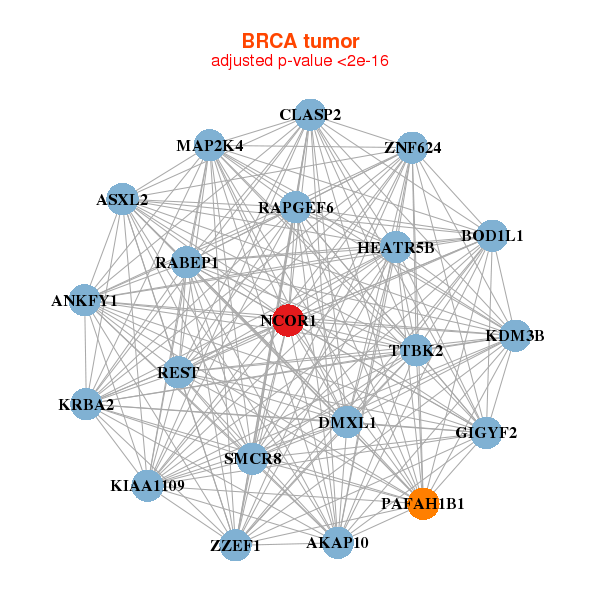
| * Co-Expression network figures were drawn using R package igraph. Only the top 20 genes with the highest correlations were shown. Red circle: input gene, orange circle: cell metabolism gene, sky circle: other gene |
: Open all plots for all cancer types
 |
|
| AKAP10,ANKFY1,ASXL2,BOD1L1,CLASP2,DMXL1,GIGYF2, HEATR5B,KDM3B,KIAA1109,KRBA2,MAP2K4,NCOR1,PAFAH1B1, RABEP1,RAPGEF6,REST,SMCR8,TTBK2,ZNF624,ZZEF1 | AKAP9,HECTD4,CHD6,EP300,GIGYF2,HUWE1,LMTK2, MDN1,KAT6B,NCOA2,NCOR1,NSD1,PDPK1,REST, RSF1,SMCR8,TRRAP,ZKSCAN1,ZKSCAN8,ZNF445,ZNF827 |
 |
|
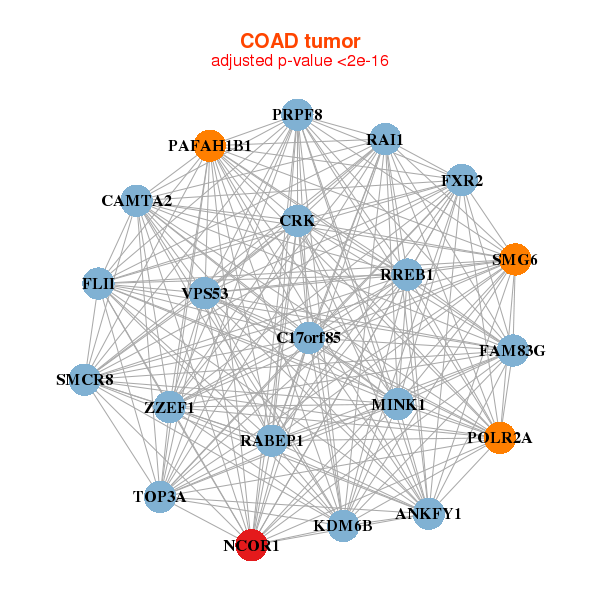
| ANKFY1,C17orf85,CAMTA2,CRK,FAM83G,FLII,FXR2, KDM6B,MINK1,NCOR1,PAFAH1B1,POLR2A,PRPF8,RABEP1, RAI1,RREB1,SMCR8,SMG6,TOP3A,VPS53,ZZEF1 | ANKRD52,BAZ2A,BIRC6,PRR14L,CLTC,CNOT1,CSNK1G1, GBF1,GOLGB1,HIVEP1,IGF2R,MYO18A,NCOA6,NCOR1, PIK3C2B,RRBP1,RREB1,SAP130,TCF20,TRIM56,ZMIZ1 |
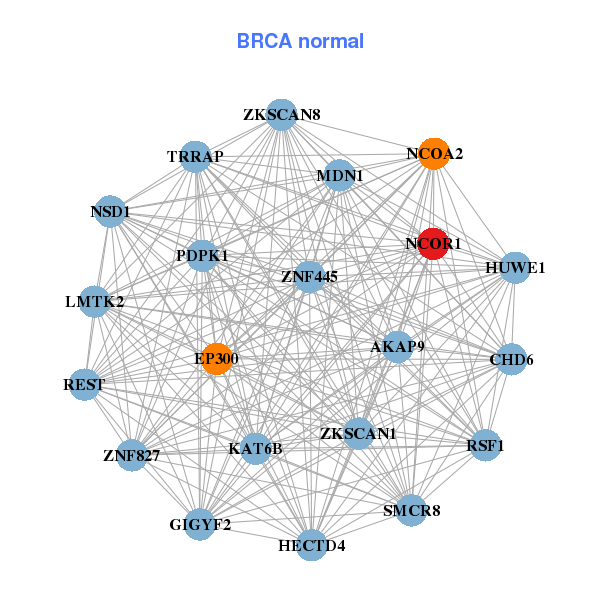
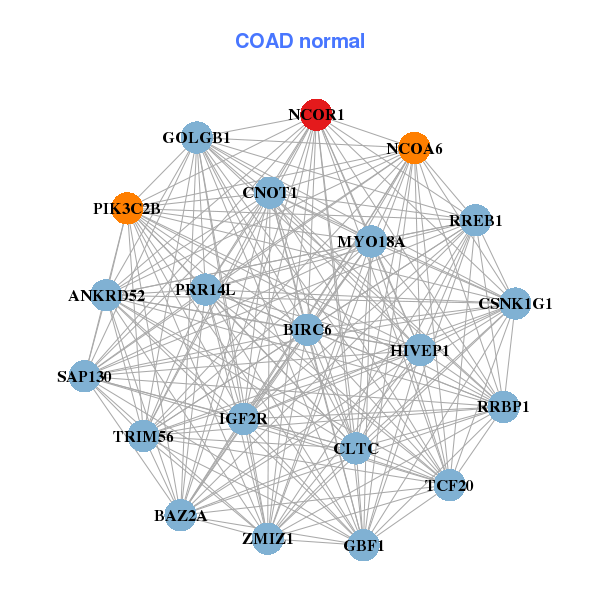
| * Co-Expression network figures were drawn using R package igraph. Only the top 20 genes with the highest correlations were shown. Red circle: input gene, orange circle: cell metabolism gene, sky circle: other gene |
: Open all plots for all cancer types
| Top |
: Open all interacting genes' information including KEGG pathway for all interacting genes from DAVID
| Top |
| Pharmacological Information for NCOR1 |
| There's no related Drug. |
| Top |
| Cross referenced IDs for NCOR1 |
| * We obtained these cross-references from Uniprot database. It covers 150 different DBs, 18 categories. http://www.uniprot.org/help/cross_references_section |
: Open all cross reference information
|
Copyright © 2016-Present - The Univsersity of Texas Health Science Center at Houston @ |