|
|||||||||||||||||||||||||||||||||||||||||||||||||||||||||||||||||||||||||||||||||||||||||||||||||||||||||||||||||||||||||||||||||||||||||||||||||||||||||||||||||||||||||||||||||||||||||||||||||||||||||||||||||||||||||||||||||||||||||||||||||||||||||||||||||||||||||||||||||||||||||||||||||||||||||||||||||||||||||||||||||||||||||||||||||||||||||||||||
| |
| Phenotypic Information (metabolism pathway, cancer, disease, phenome) |
| |
| |
| Gene-Gene Network Information: Co-Expression Network, Interacting Genes & KEGG |
| |
|


| Gene Summary for NCOR2 |
| Basic gene info. | Gene symbol | NCOR2 |
| Gene name | nuclear receptor corepressor 2 | |
| Synonyms | CTG26|N-CoR2|SMAP270|SMRT|SMRTE|SMRTE-tau|TNRC14|TRAC|TRAC-1|TRAC1 | |
| Cytomap | UCSC genome browser: 12q24 | |
| Genomic location | chr12 :124808956-125052010 | |
| Type of gene | protein-coding | |
| RefGenes | NM_001077261.3, NM_001206654.1,NM_006312.5, | |
| Ensembl id | ENSG00000196498 | |
| Description | CTG repeat protein 26T3 receptor-associating factorsilencing mediator for retinoid and thyroid hormone receptorsthyroid-, retinoic-acid-receptor-associated corepressor | |
| Modification date | 20141207 | |
| dbXrefs | MIM : 600848 | |
| HGNC : HGNC | ||
| Ensembl : ENSG00000196498 | ||
| HPRD : 02910 | ||
| Vega : OTTHUMG00000150455 | ||
| Protein | UniProt: Q9Y618 go to UniProt's Cross Reference DB Table | |
| Expression | CleanEX: HS_NCOR2 | |
| BioGPS: 9612 | ||
| Gene Expression Atlas: ENSG00000196498 | ||
| The Human Protein Atlas: ENSG00000196498 | ||
| Pathway | NCI Pathway Interaction Database: NCOR2 | |
| KEGG: NCOR2 | ||
| REACTOME: NCOR2 | ||
| ConsensusPathDB | ||
| Pathway Commons: NCOR2 | ||
| Metabolism | MetaCyc: NCOR2 | |
| HUMANCyc: NCOR2 | ||
| Regulation | Ensembl's Regulation: ENSG00000196498 | |
| miRBase: chr12 :124,808,956-125,052,010 | ||
| TargetScan: NM_001077261 | ||
| cisRED: ENSG00000196498 | ||
| Context | iHOP: NCOR2 | |
| cancer metabolism search in PubMed: NCOR2 | ||
| UCL Cancer Institute: NCOR2 | ||
| Assigned class in ccmGDB | B - This gene belongs to cancer gene. | |
| Top |
| Phenotypic Information for NCOR2(metabolism pathway, cancer, disease, phenome) |
| Cancer | CGAP: NCOR2 |
| Familial Cancer Database: NCOR2 | |
| * This gene is included in those cancer gene databases. |
|
|
|
|
|
| . | |||||||||||||||||||||||||||||||||||||||||||||||||||||||||||||||||||||||||||||||||||||||||||||||||||||||||||||||||||||||||||||||||||||||||||||||||||||||||||||||||||||||||||||||||||||||||||||||||||||||||||||||||||||||||||||||||||||||||||||||||||||||||||||||||||||||||||||||||||||||||||||||||||||||||||||||||||||||||||||||||||||||||||||||||||||||||
Oncogene 1 | Significant driver gene in | ||||||||||||||||||||||||||||||||||||||||||||||||||||||||||||||||||||||||||||||||||||||||||||||||||||||||||||||||||||||||||||||||||||||||||||||||||||||||||||||||||||||||||||||||||||||||||||||||||||||||||||||||||||||||||||||||||||||||||||||||||||||||||||||||||||||||||||||||||||||||||||||||||||||||||||||||||||||||||||||||||||||||||||||||||||||||||||||
| cf) number; DB name 1 Oncogene; http://nar.oxfordjournals.org/content/35/suppl_1/D721.long, 2 Tumor Suppressor gene; https://bioinfo.uth.edu/TSGene/, 3 Cancer Gene Census; http://www.nature.com/nrc/journal/v4/n3/abs/nrc1299.html, 4 CancerGenes; http://nar.oxfordjournals.org/content/35/suppl_1/D721.long, 5 Network of Cancer Gene; http://ncg.kcl.ac.uk/index.php, 1Therapeutic Vulnerabilities in Cancer; http://cbio.mskcc.org/cancergenomics/statius/ |
| REACTOME_METABOLISM_OF_LIPIDS_AND_LIPOPROTEINS | |
| OMIM | 600848; gene. |
| Orphanet | |
| Disease | KEGG Disease: NCOR2 |
| MedGen: NCOR2 (Human Medical Genetics with Condition) | |
| ClinVar: NCOR2 | |
| Phenotype | MGI: NCOR2 (International Mouse Phenotyping Consortium) |
| PhenomicDB: NCOR2 | |
| Mutations for NCOR2 |
| * Under tables are showing count per each tissue to give us broad intuition about tissue specific mutation patterns.You can go to the detailed page for each mutation database's web site. |
| - Statistics for Tissue and Mutation type | Top |
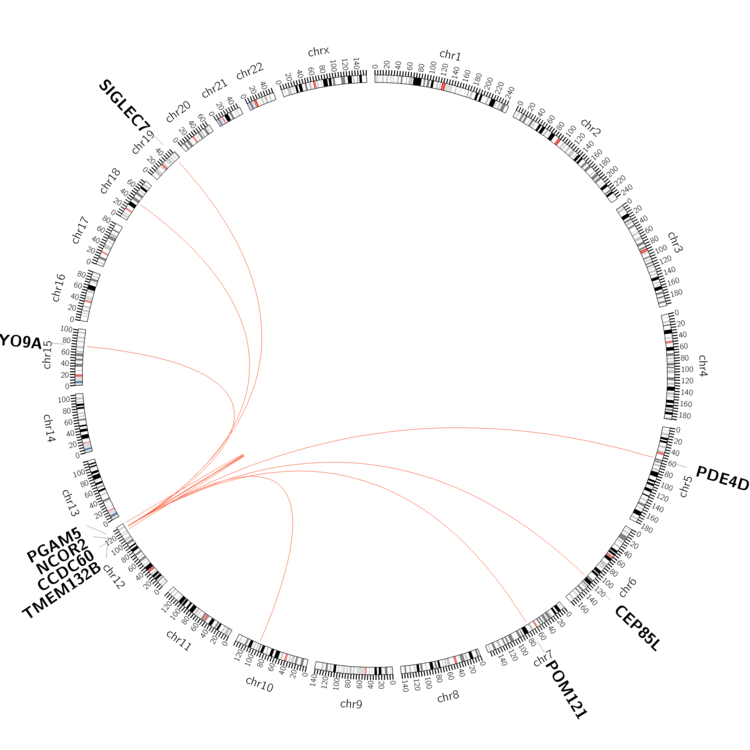 |
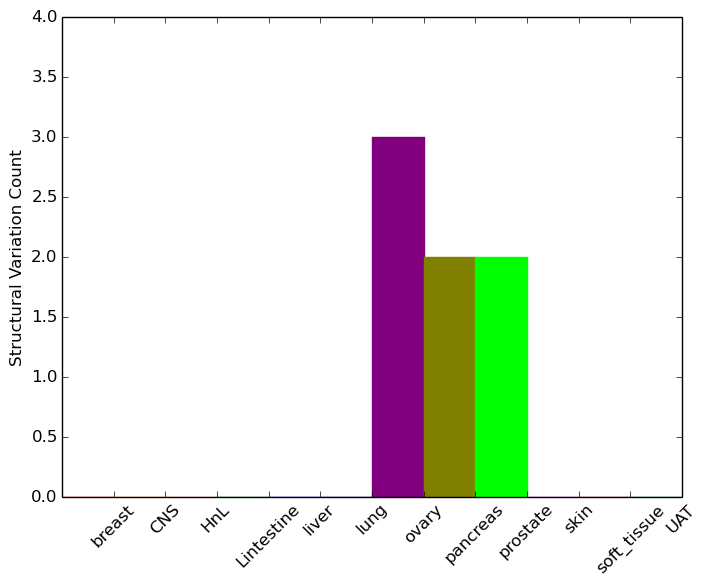
| - For Inter-chromosomal Variations |
| * Inter-chromosomal variantions includes 'interchromosomal amplicon to amplicon', 'interchromosomal amplicon to non-amplified dna', 'interchromosomal insertion', 'Interchromosomal unknown type'. |
 |
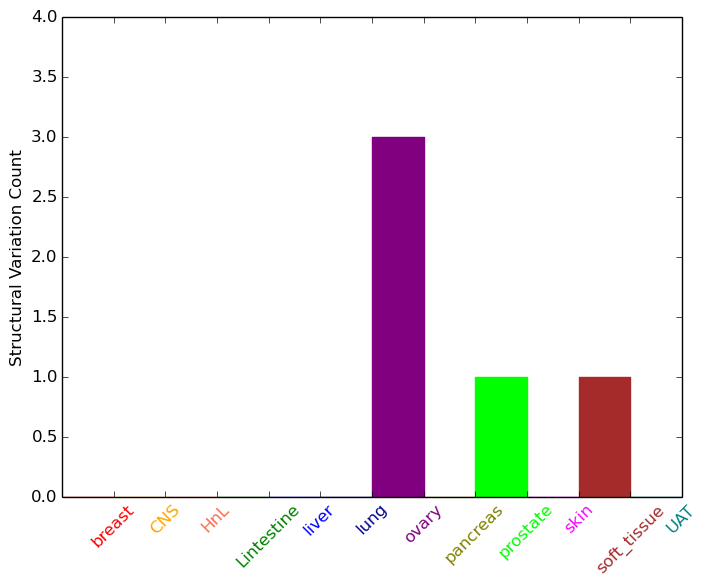
| - For Intra-chromosomal Variations |
| * Intra-chromosomal variantions includes 'intrachromosomal amplicon to amplicon', 'intrachromosomal amplicon to non-amplified dna', 'intrachromosomal deletion', 'intrachromosomal fold-back inversion', 'intrachromosomal inversion', 'intrachromosomal tandem duplication', 'Intrachromosomal unknown type', 'intrachromosomal with inverted orientation', 'intrachromosomal with non-inverted orientation'. |
 |
| Sample | Symbol_a | Chr_a | Start_a | End_a | Symbol_b | Chr_b | Start_b | End_b |
| ovary | NCOR2 | chr12 | 124837932 | 124837952 | CCDC60 | chr12 | 119851154 | 119851174 |
| ovary | NCOR2 | chr12 | 124940352 | 124940372 | TMEM132B | chr12 | 125920636 | 125920656 |
| ovary | NCOR2 | chr12 | 124970841 | 124970861 | SIGLEC7 | chr19 | 51646698 | 51646718 |
| ovary | NCOR2 | chr12 | 125040852 | 125040872 | chr12 | 125052039 | 125052059 | |
| prostate | NCOR2 | chr12 | 124835961 | 124837961 | chr18 | 38104992 | 38106992 | |
| prostate | NCOR2 | chr12 | 124857801 | 124857801 | NCOR2 | chr12 | 124857936 | 124857936 |
| soft_tissue | NCOR2 | chr12 | 124901263 | 124901263 | PGAM5 | chr12 | 133293628 | 133293628 |
| cf) Tissue number; Tissue name (1;Breast, 2;Central_nervous_system, 3;Haematopoietic_and_lymphoid_tissue, 4;Large_intestine, 5;Liver, 6;Lung, 7;Ovary, 8;Pancreas, 9;Prostate, 10;Skin, 11;Soft_tissue, 12;Upper_aerodigestive_tract) |
| * From mRNA Sanger sequences, Chitars2.0 arranged chimeric transcripts. This table shows NCOR2 related fusion information. |
| ID | Head Gene | Tail Gene | Accession | Gene_a | qStart_a | qEnd_a | Chromosome_a | tStart_a | tEnd_a | Gene_a | qStart_a | qEnd_a | Chromosome_a | tStart_a | tEnd_a |
| BF528779 | SLC4A5 | 1 | 64 | 2 | 74590152 | 74590215 | NCOR2 | 60 | 642 | 12 | 124824634 | 124826533 | |
| BF803065 | NCOR2 | 17 | 235 | 12 | 124885053 | 124887000 | OTUD5 | 227 | 376 | X | 48801477 | 48814320 | |
| BC020427 | SLC4A5 | 1 | 65 | 2 | 74590152 | 74590216 | NCOR2 | 61 | 1362 | 12 | 124819776 | 124826533 | |
| AA580941 | NCOR2 | 8 | 63 | 12 | 124868037 | 124868092 | FBXO33 | 62 | 325 | 14 | 39896063 | 39896326 | |
| BF093171 | TLN1 | 1 | 353 | 9 | 35697622 | 35698100 | NCOR2 | 339 | 510 | 12 | 124943923 | 124944094 | |
| BC051312 | NCOR2 | 1 | 1589 | 12 | 124904505 | 124979906 | RPL14 | 1589 | 1817 | 3 | 40503539 | 40503767 | |
| BC033087 | NCOR2 | 1 | 1752 | 12 | 124904505 | 125002840 | RPL14 | 1752 | 1975 | 3 | 40503542 | 40503765 | |
| BF924756 | CHN1 | 61 | 173 | 2 | 175673268 | 175673586 | NCOR2 | 169 | 380 | 12 | 124956726 | 124956937 | |
| U37146 | HNRNPK | 1 | 530 | 9 | 86585117 | 86586958 | NCOR2 | 529 | 5971 | 12 | 124808961 | 124841329 | |
| BF846253 | MALAT1 | 1 | 63 | 11 | 65268026 | 65268091 | NCOR2 | 46 | 259 | 12 | 124887007 | 124904603 | |
| Top |
| Mutation type/ Tissue ID | brca | cns | cerv | endome | haematopo | kidn | Lintest | liver | lung | ns | ovary | pancre | prost | skin | stoma | thyro | urina | |||
| Total # sample | 1 | |||||||||||||||||||
| GAIN (# sample) | ||||||||||||||||||||
| LOSS (# sample) | 1 |
| cf) Tissue ID; Tissue type (1; Breast, 2; Central_nervous_system, 3; Cervix, 4; Endometrium, 5; Haematopoietic_and_lymphoid_tissue, 6; Kidney, 7; Large_intestine, 8; Liver, 9; Lung, 10; NS, 11; Ovary, 12; Pancreas, 13; Prostate, 14; Skin, 15; Stomach, 16; Thyroid, 17; Urinary_tract) |
| Top |
|
 |
| Top |
| Stat. for Non-Synonymous SNVs (# total SNVs=119) | (# total SNVs=87) |
 |  |
(# total SNVs=15) | (# total SNVs=43) |
 |  |
| Top |
| * When you move the cursor on each content, you can see more deailed mutation information on the Tooltip. Those are primary_site,primary_histology,mutation(aa),pubmedID. |
| GRCh37 position | Mutation(aa) | Unique sampleID count |
| chr12:124824721-124824722 | p.G1849_G1850insSSG | 16 |
| chr12:124887058-124887059 | p.Q510_P511insQ | 13 |
| chr12:124887093-124887093 | p.Q499Q | 13 |
| chr12:124829255-124829255 | p.G1541G | 8 |
| chr12:124824739-124824740 | p.S1841fs*197 | 7 |
| chr12:124848228-124848228 | p.I976fs*94 | 6 |
| chr12:124887099-124887099 | p.Q497Q | 4 |
| chr12:124829234-124829234 | p.L1548L | 3 |
| chr12:124826574-124826574 | p.Y1668* | 2 |
| chr12:124887004-124887004 | p.A529E | 2 |
| Top |
|
 |
| Point Mutation/ Tissue ID | 1 | 2 | 3 | 4 | 5 | 6 | 7 | 8 | 9 | 10 | 11 | 12 | 13 | 14 | 15 | 16 | 17 | 18 | 19 | 20 |
| # sample | 6 | 4 | 30 | 1 | 11 | 8 | 2 | 24 | 11 | 2 | 2 | 29 | 24 | 2 | 21 | |||||
| # mutation | 6 | 4 | 33 | 1 | 12 | 7 | 2 | 27 | 12 | 2 | 1 | 37 | 30 | 1 | 37 | |||||
| nonsynonymous SNV | 6 | 3 | 19 | 1 | 9 | 4 | 18 | 7 | 1 | 23 | 22 | 23 | ||||||||
| synonymous SNV | 1 | 14 | 3 | 3 | 2 | 9 | 5 | 1 | 1 | 14 | 8 | 1 | 14 |
| cf) Tissue ID; Tissue type (1; BLCA[Bladder Urothelial Carcinoma], 2; BRCA[Breast invasive carcinoma], 3; CESC[Cervical squamous cell carcinoma and endocervical adenocarcinoma], 4; COAD[Colon adenocarcinoma], 5; GBM[Glioblastoma multiforme], 6; Glioma Low Grade, 7; HNSC[Head and Neck squamous cell carcinoma], 8; KICH[Kidney Chromophobe], 9; KIRC[Kidney renal clear cell carcinoma], 10; KIRP[Kidney renal papillary cell carcinoma], 11; LAML[Acute Myeloid Leukemia], 12; LUAD[Lung adenocarcinoma], 13; LUSC[Lung squamous cell carcinoma], 14; OV[Ovarian serous cystadenocarcinoma ], 15; PAAD[Pancreatic adenocarcinoma], 16; PRAD[Prostate adenocarcinoma], 17; SKCM[Skin Cutaneous Melanoma], 18:STAD[Stomach adenocarcinoma], 19:THCA[Thyroid carcinoma], 20:UCEC[Uterine Corpus Endometrial Carcinoma]) |
| Top |
| * We represented just top 10 SNVs. When you move the cursor on each content, you can see more deailed mutation information on the Tooltip. Those are primary_site, primary_histology, mutation(aa), pubmedID. |
| Genomic Position | Mutation(aa) | Unique sampleID count |
| chr12:124887093 | p.Q498Q,NCOR2 | 17 |
| chr12:124840068 | p.Q496Q,NCOR2 | 2 |
| chr12:124915272 | p.R487Q,NCOR2 | 2 |
| chr12:124821373 | p.R224H,NCOR2 | 2 |
| chr12:124887004 | p.S2004L,NCOR2 | 2 |
| chr12:124950753 | p.A528E,NCOR2 | 2 |
| chr12:124887099 | p.R315H,NCOR2 | 2 |
| chr12:124904522 | p.P1087P,NCOR2 | 2 |
| chr12:124848315 | p.G1265G,NCOR2 | 1 |
| chr12:124820029 | p.R301H,NCOR2 | 1 |
| * Copy number data were extracted from TCGA using R package TCGA-Assembler. The URLs of all public data files on TCGA DCC data server were gathered on Jan-05-2015. Function ProcessCNAData in TCGA-Assembler package was used to obtain gene-level copy number value which is calculated as the average copy number of the genomic region of a gene. |
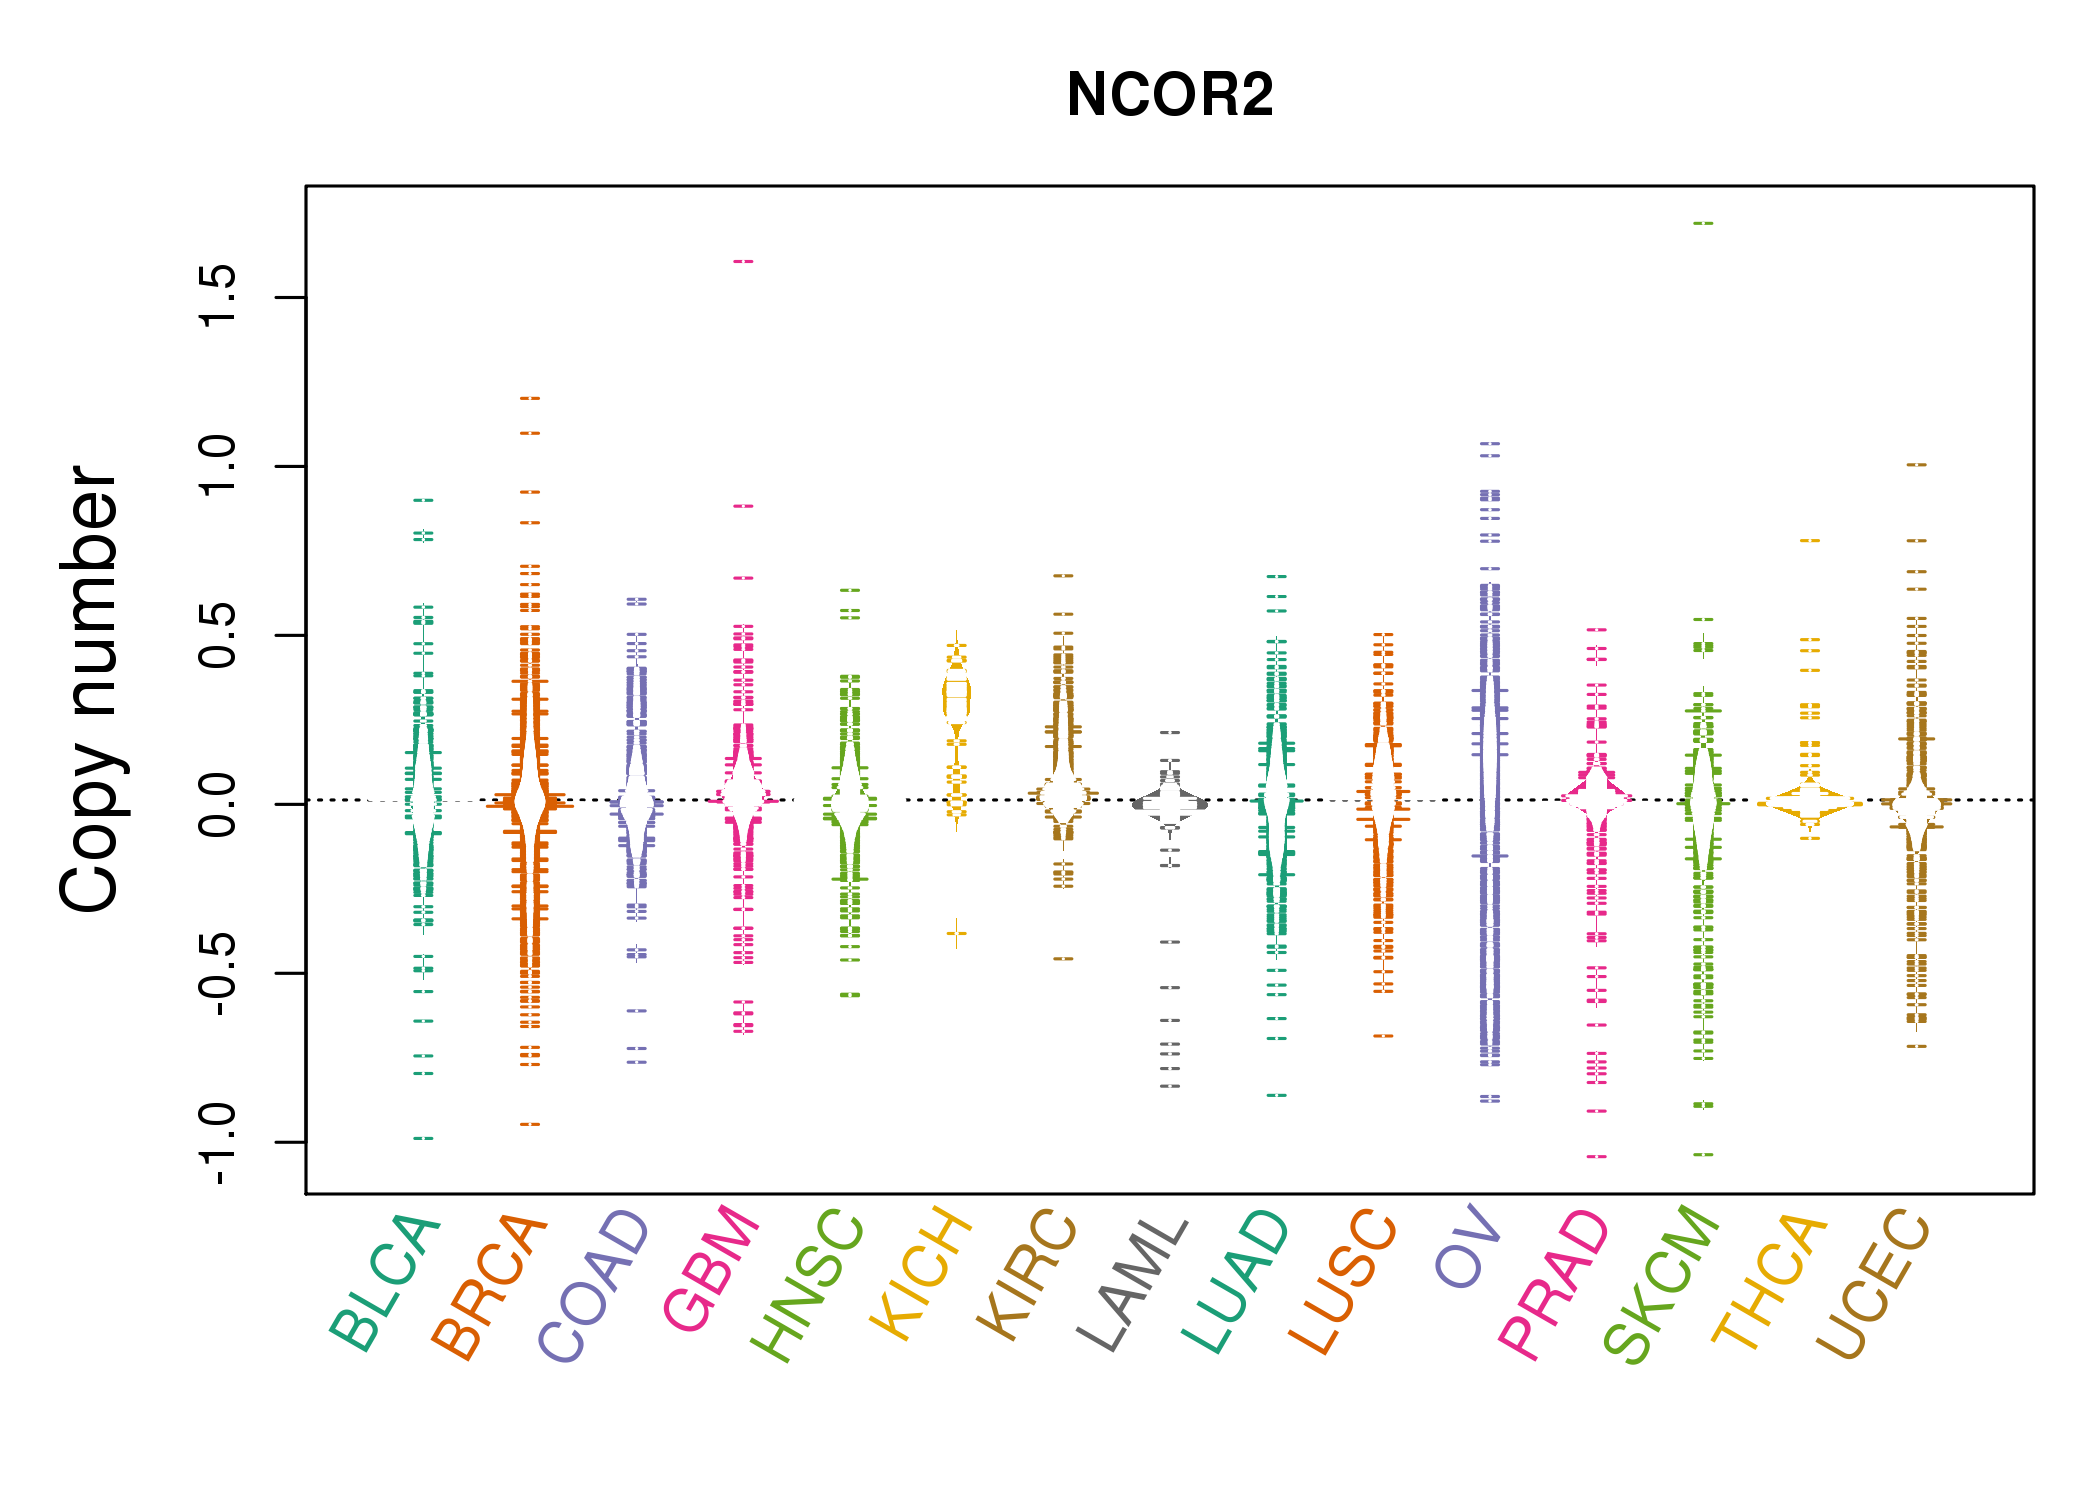 |
| cf) Tissue ID[Tissue type]: BLCA[Bladder Urothelial Carcinoma], BRCA[Breast invasive carcinoma], CESC[Cervical squamous cell carcinoma and endocervical adenocarcinoma], COAD[Colon adenocarcinoma], GBM[Glioblastoma multiforme], Glioma Low Grade, HNSC[Head and Neck squamous cell carcinoma], KICH[Kidney Chromophobe], KIRC[Kidney renal clear cell carcinoma], KIRP[Kidney renal papillary cell carcinoma], LAML[Acute Myeloid Leukemia], LUAD[Lung adenocarcinoma], LUSC[Lung squamous cell carcinoma], OV[Ovarian serous cystadenocarcinoma ], PAAD[Pancreatic adenocarcinoma], PRAD[Prostate adenocarcinoma], SKCM[Skin Cutaneous Melanoma], STAD[Stomach adenocarcinoma], THCA[Thyroid carcinoma], UCEC[Uterine Corpus Endometrial Carcinoma] |
| Top |
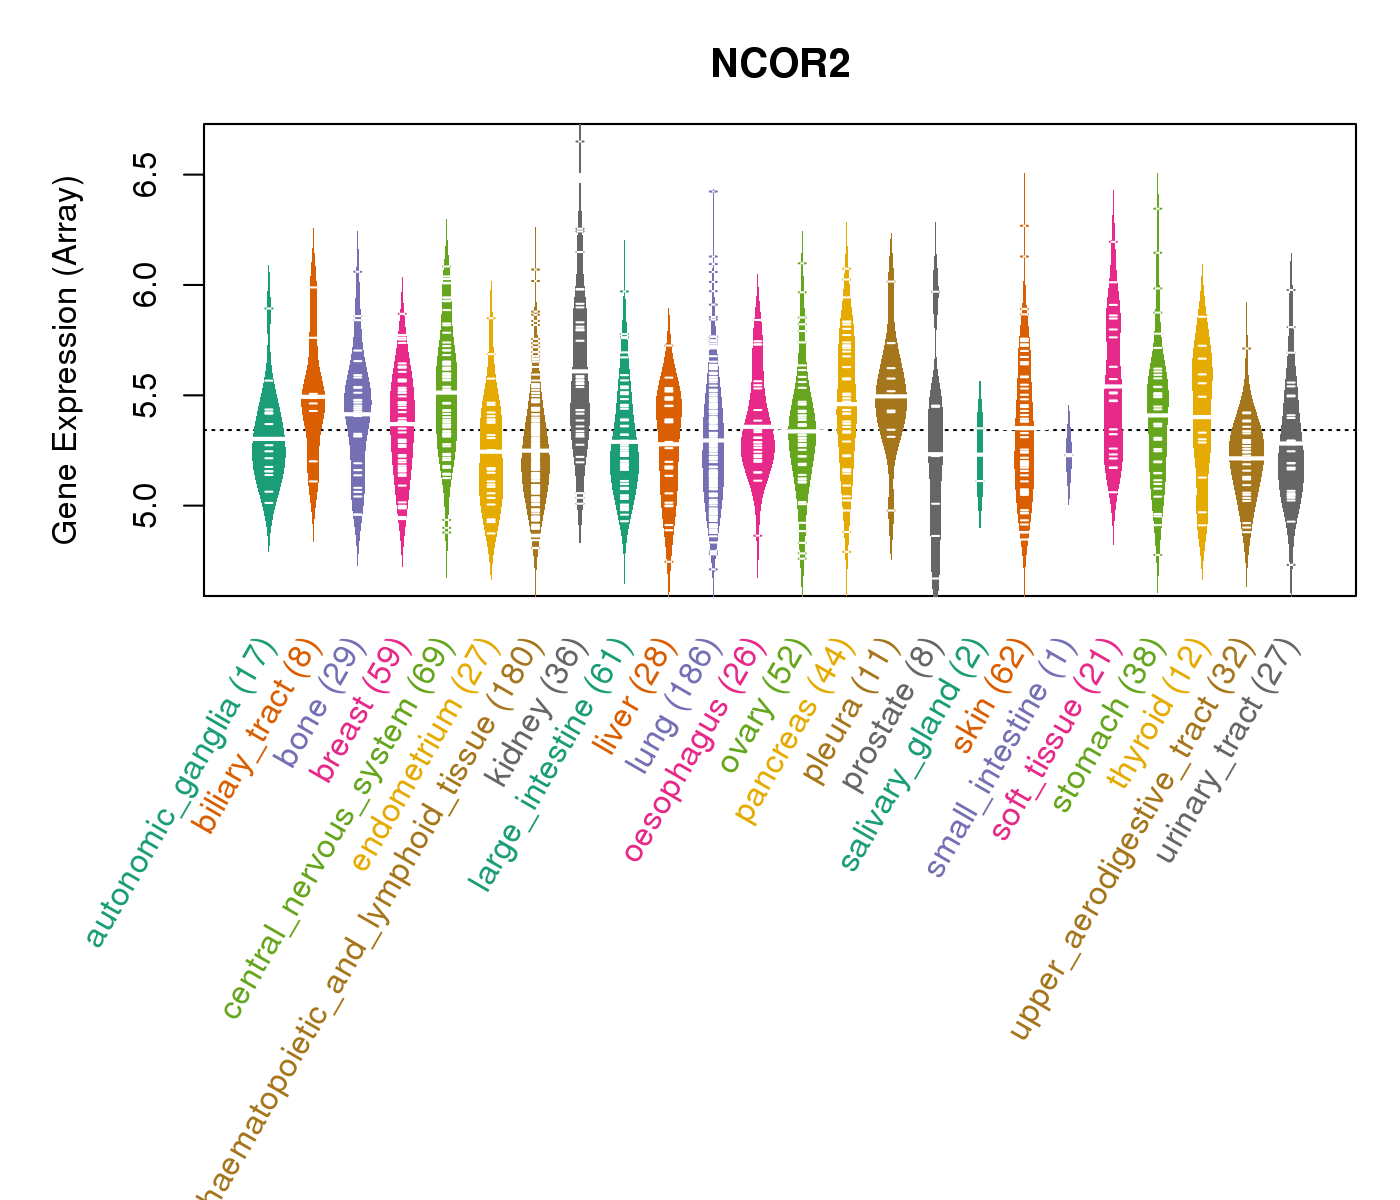
| Gene Expression for NCOR2 |
| * CCLE gene expression data were extracted from CCLE_Expression_Entrez_2012-10-18.res: Gene-centric RMA-normalized mRNA expression data. |
 |
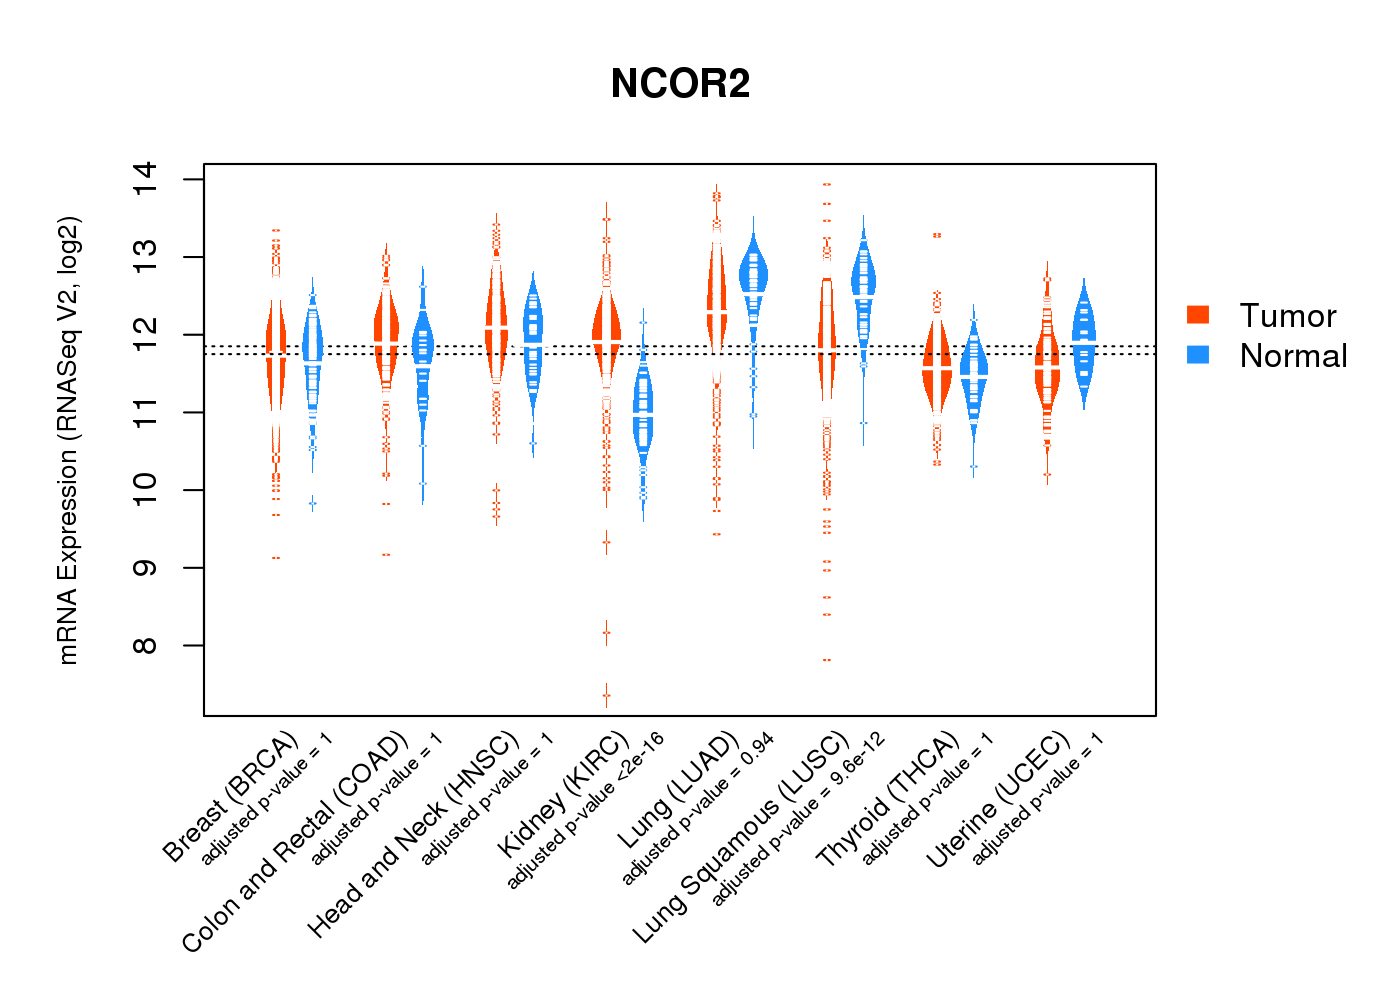
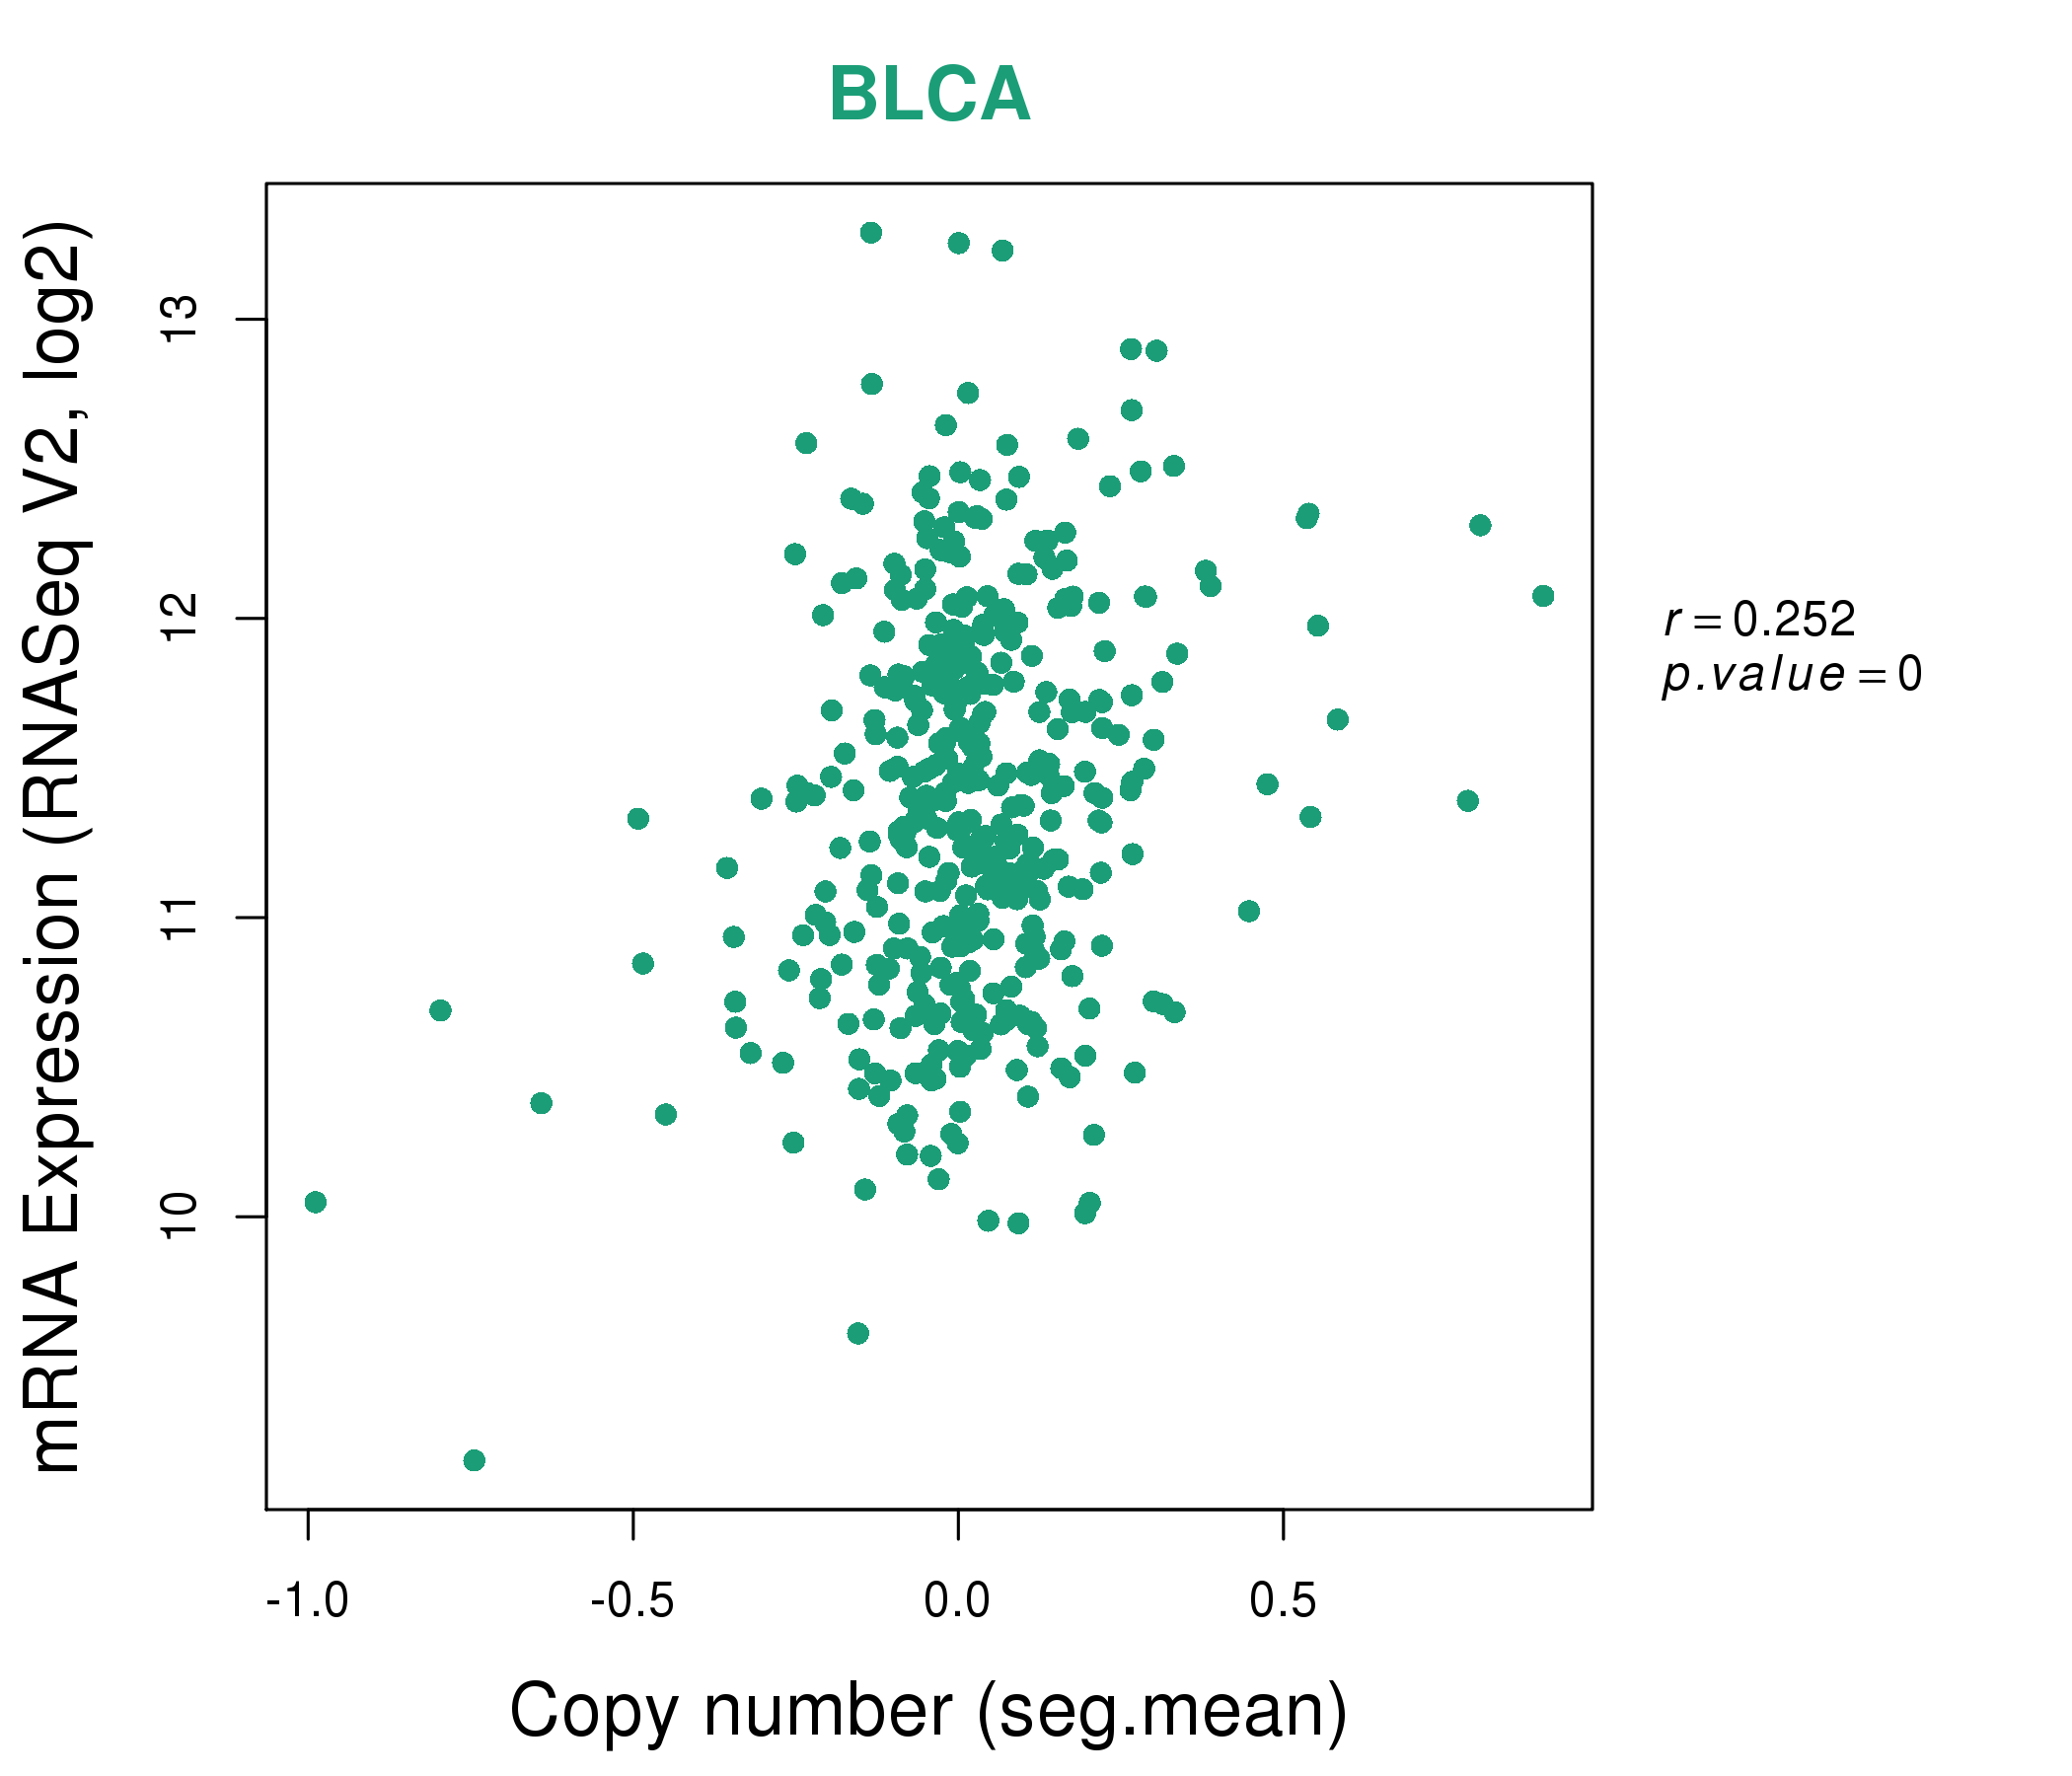
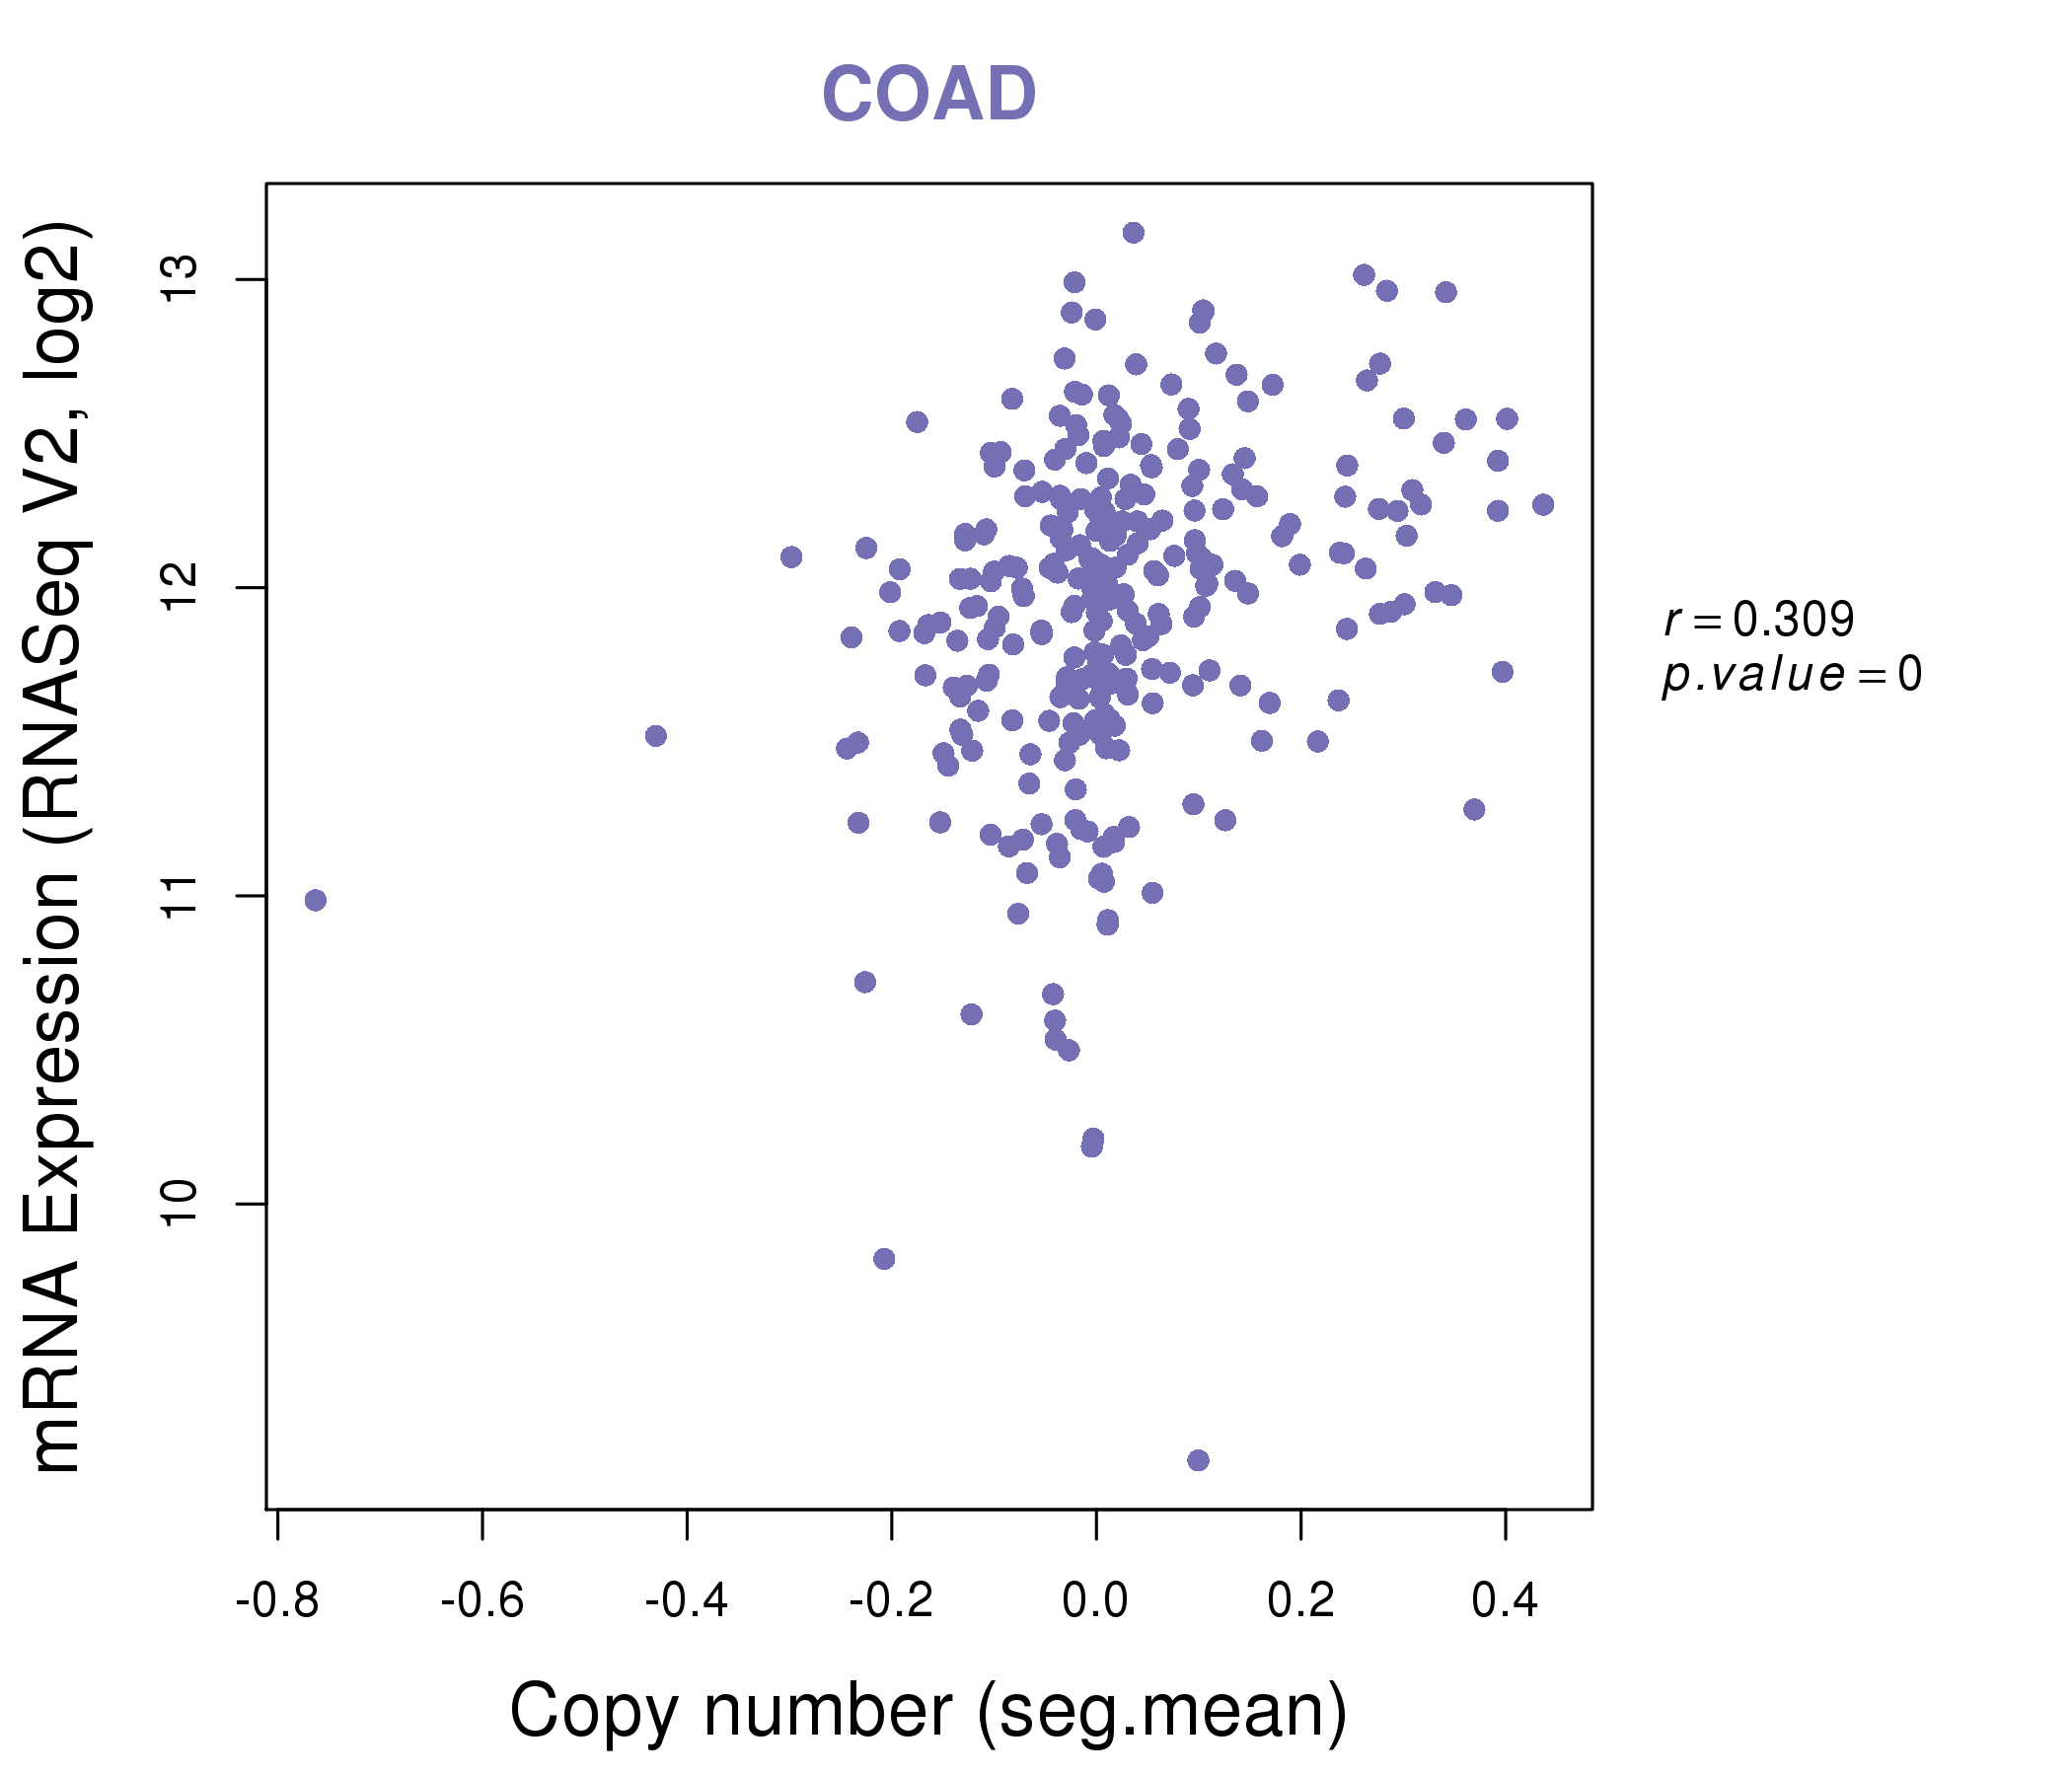
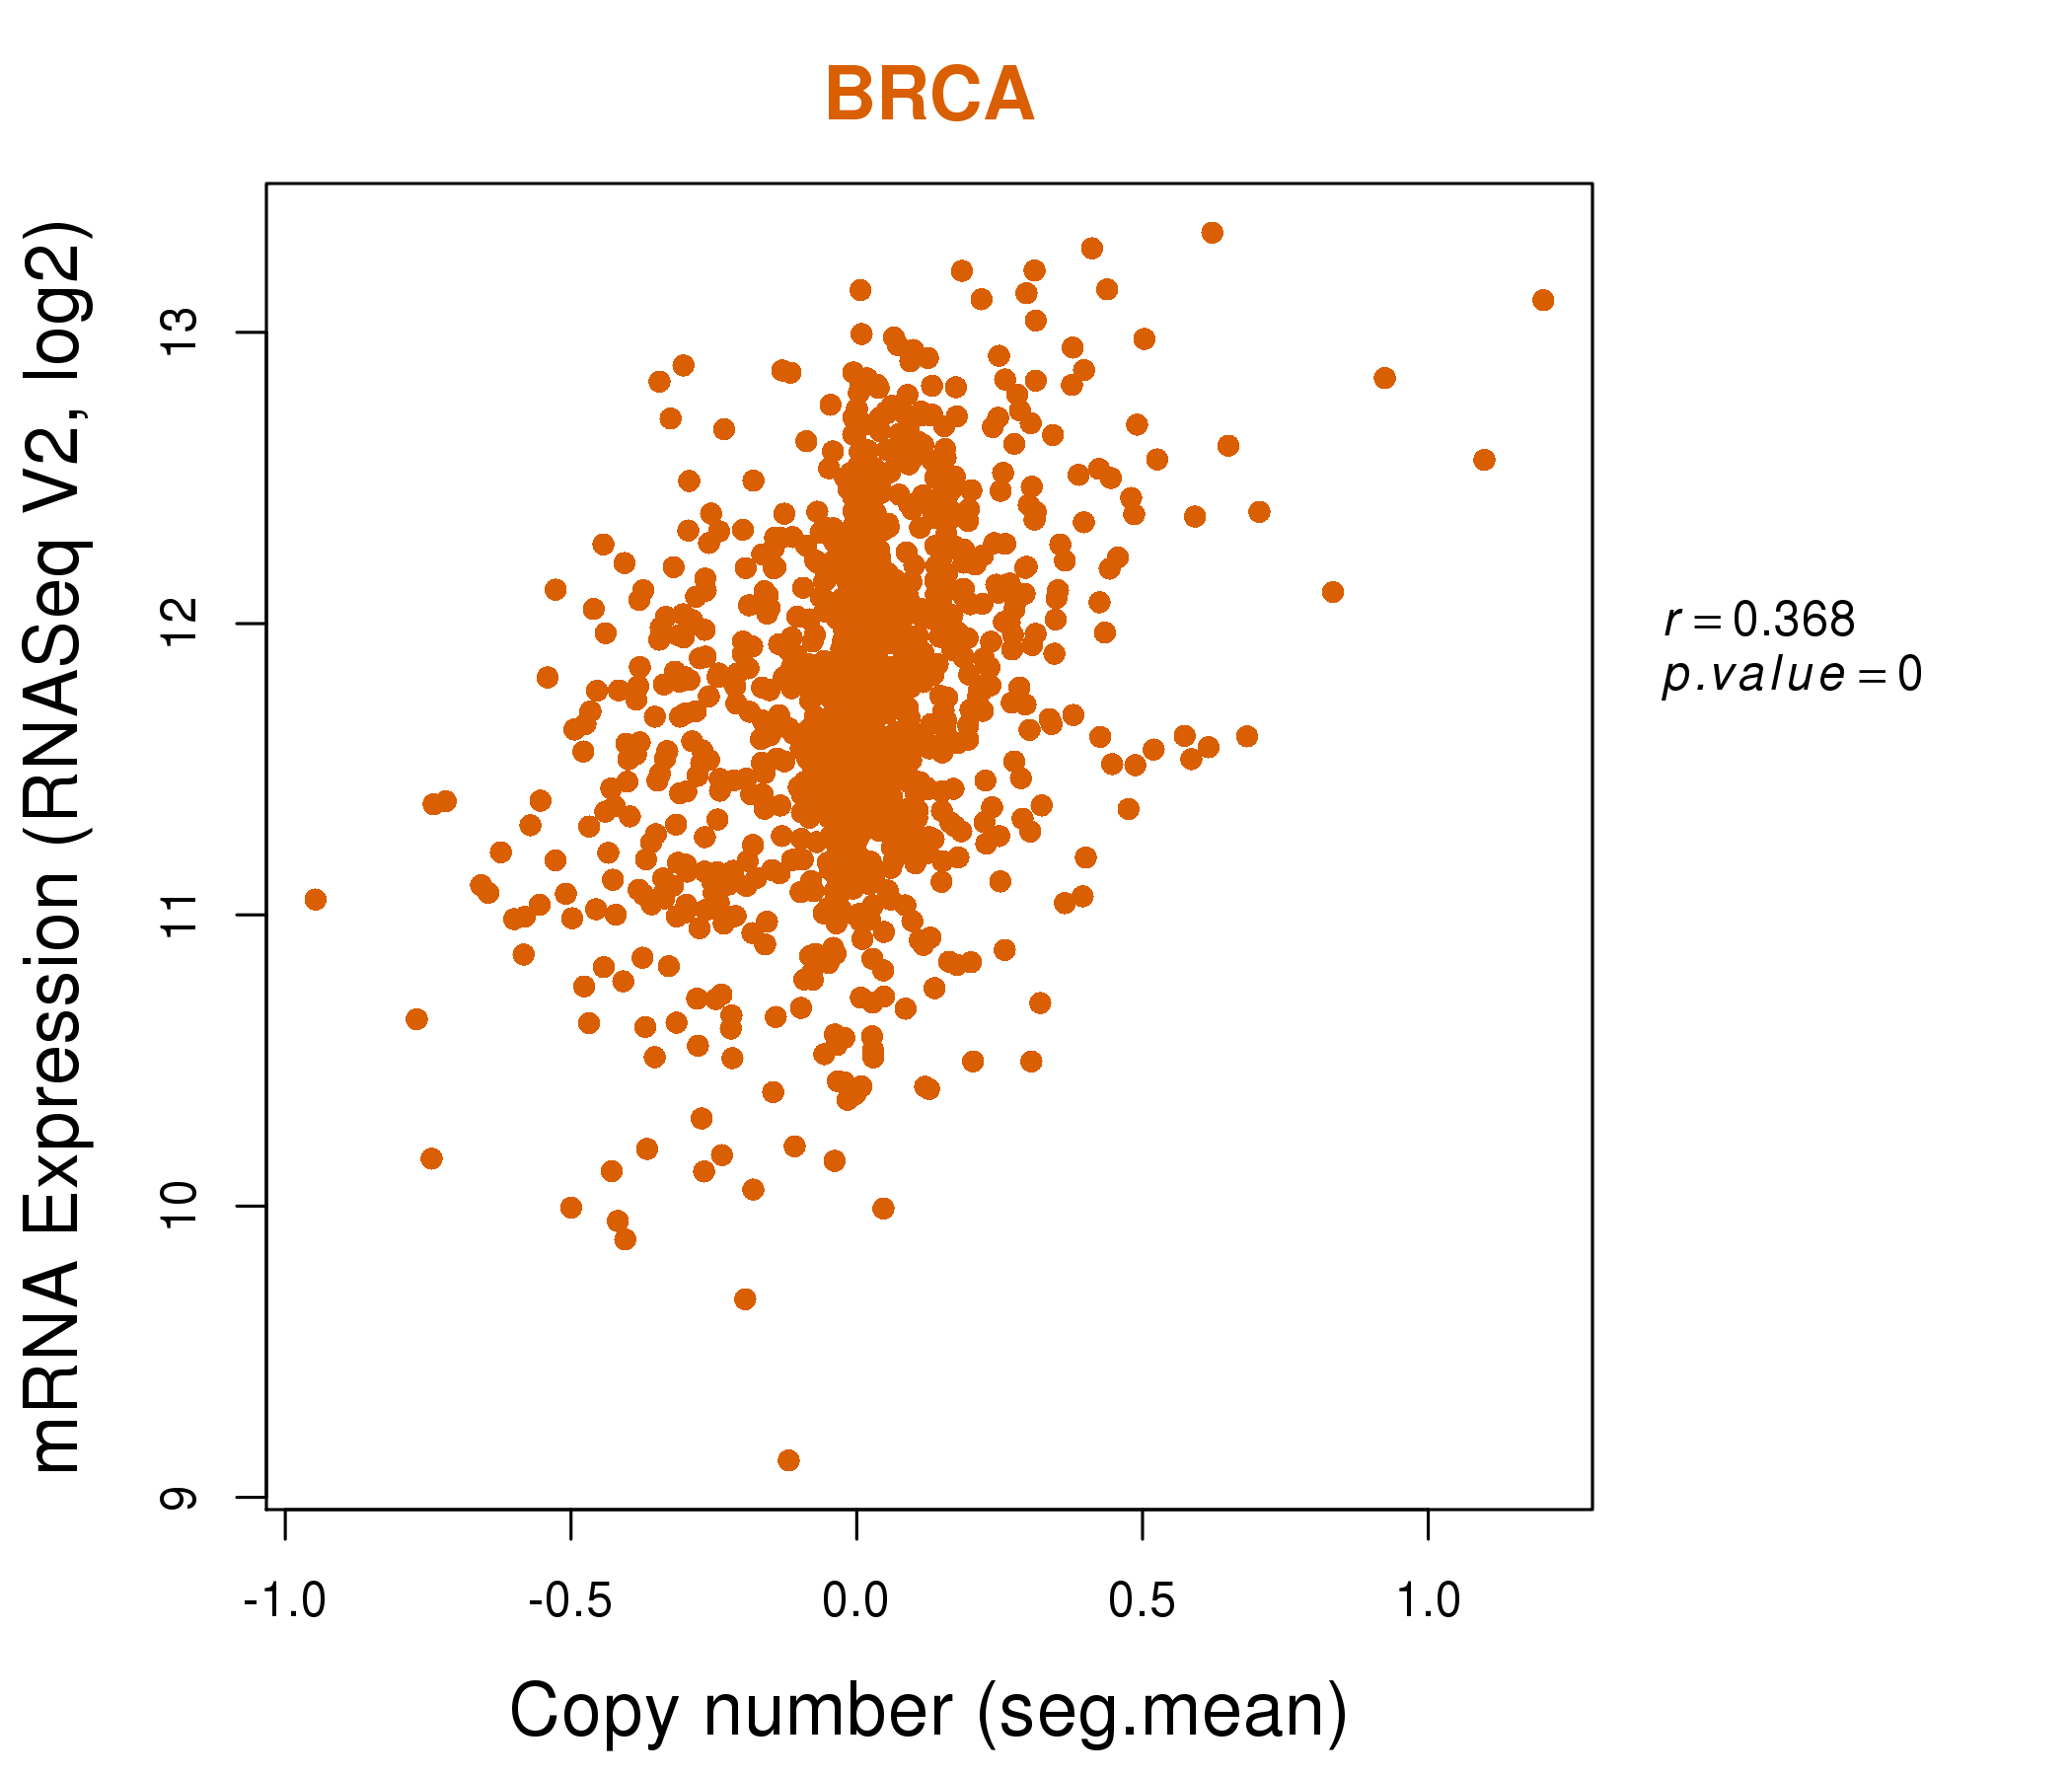
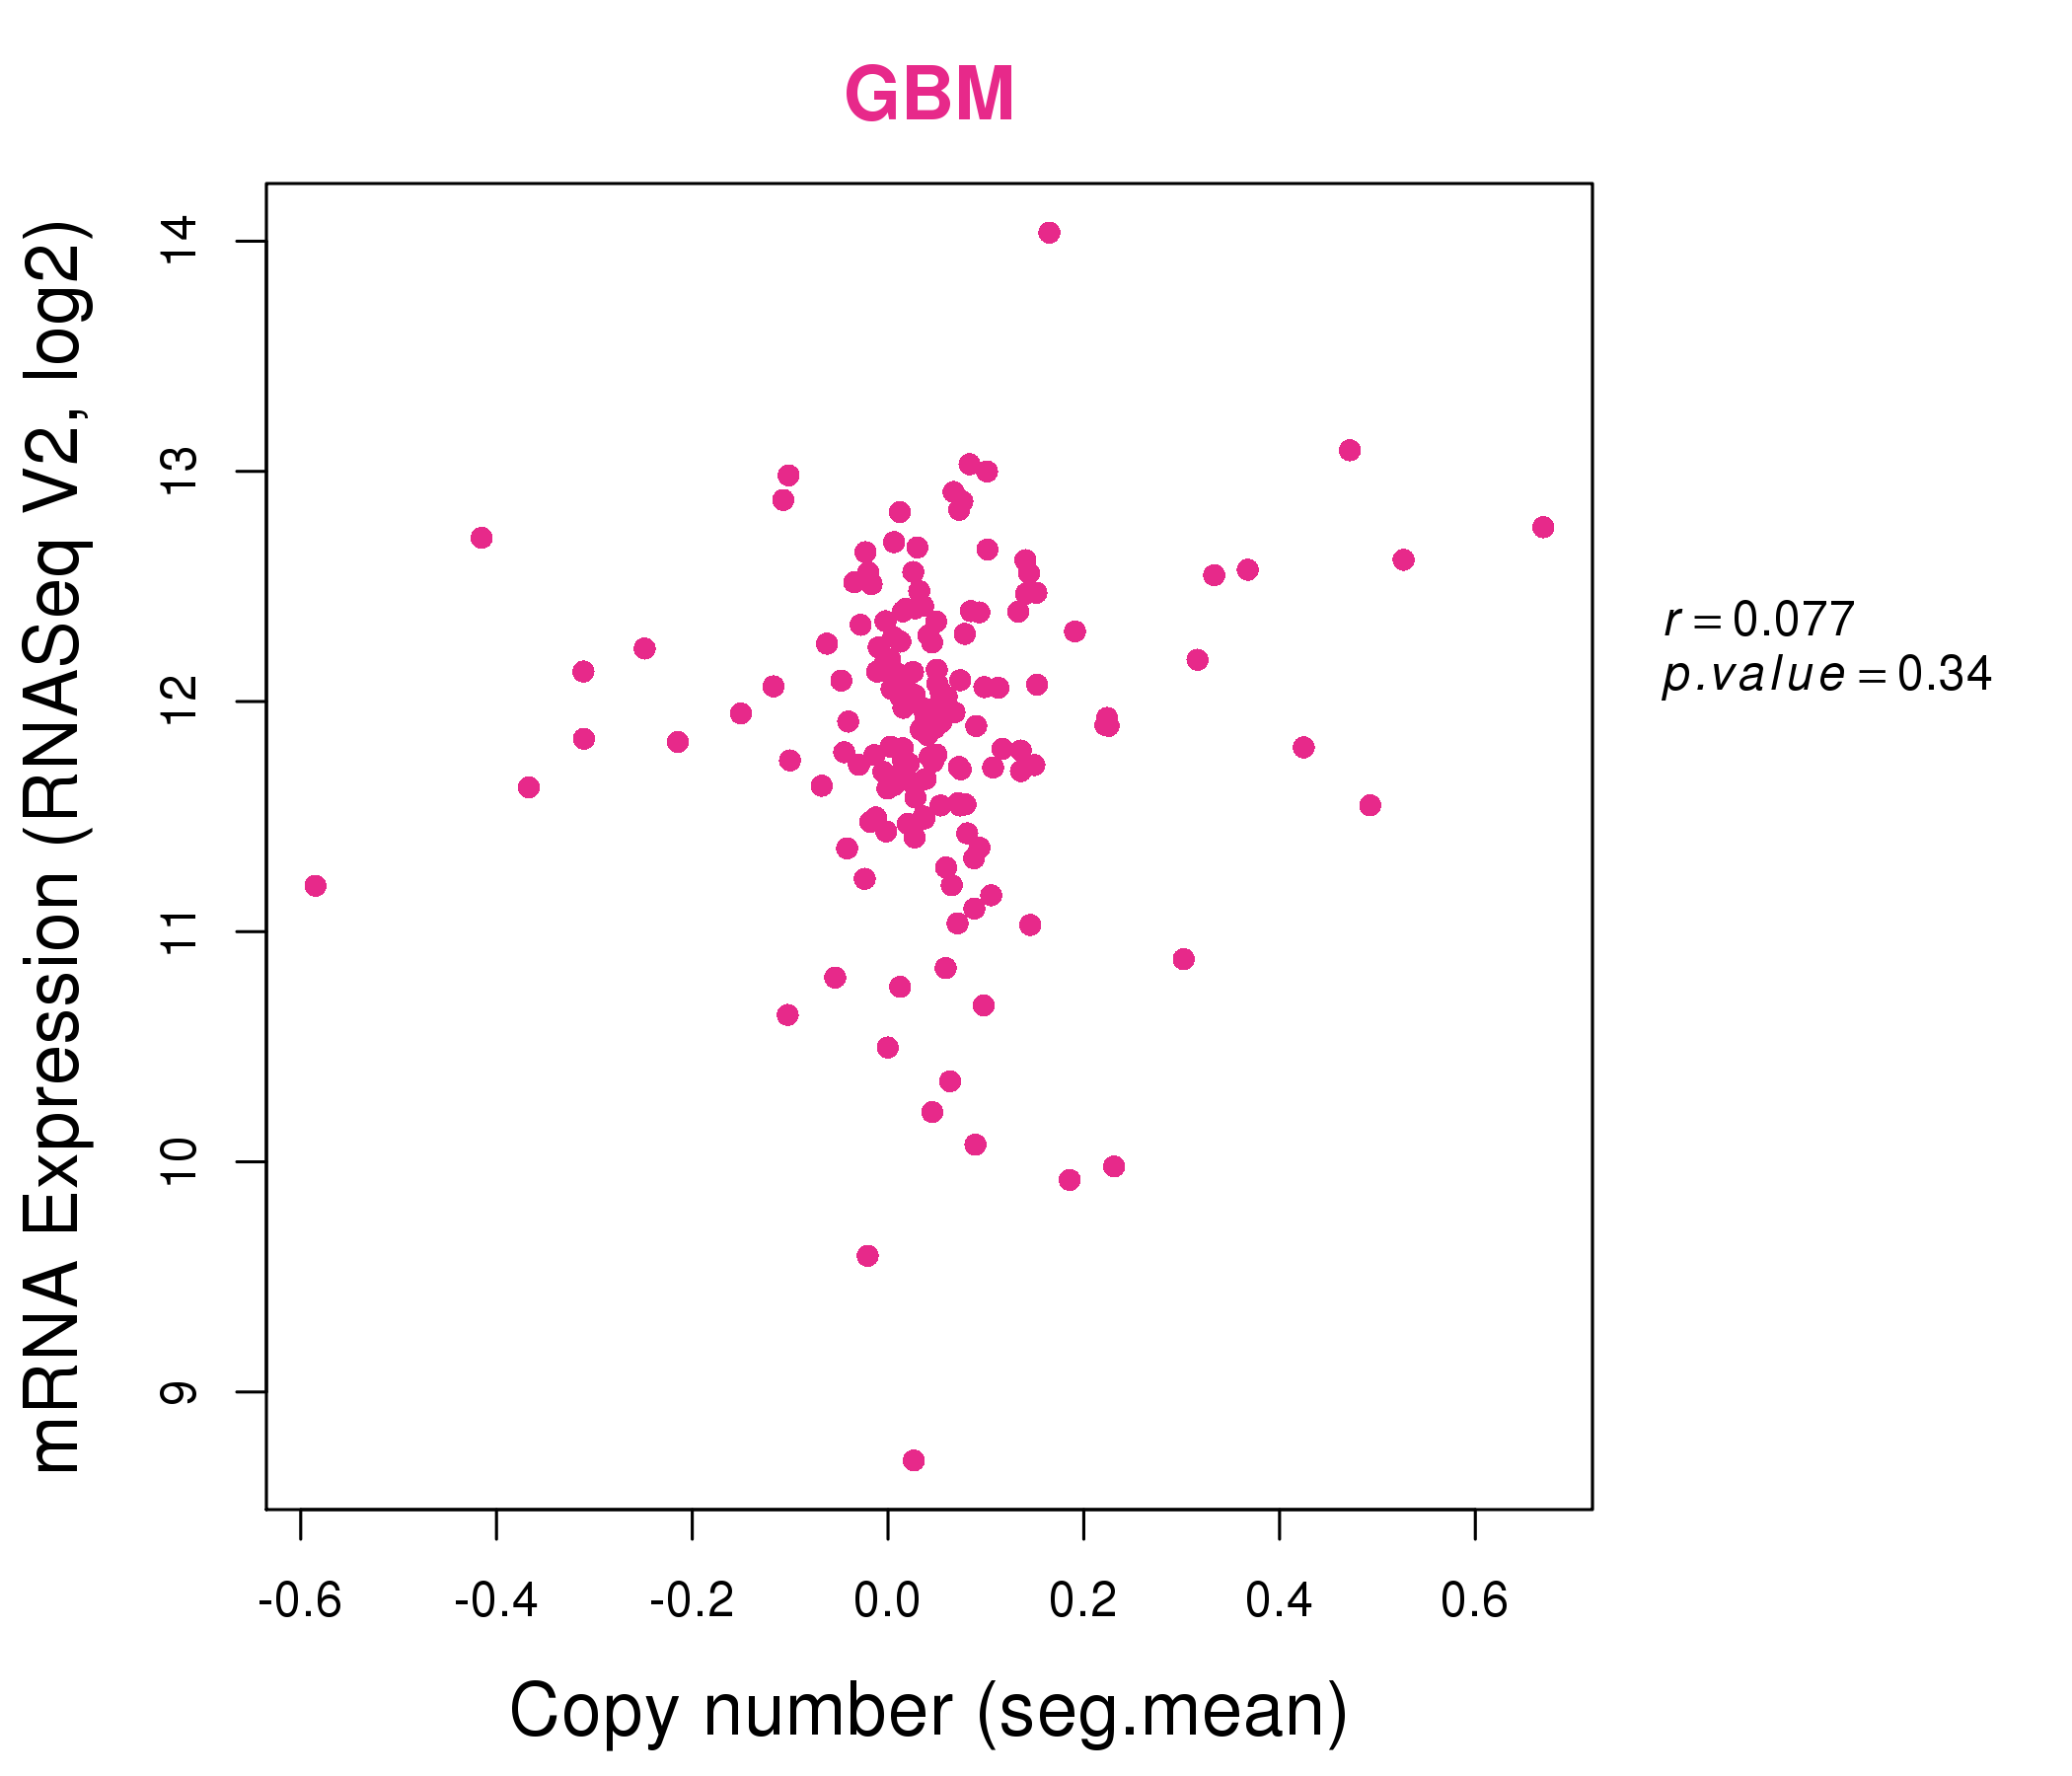
| * Normalized gene expression data of RNASeqV2 was extracted from TCGA using R package TCGA-Assembler. The URLs of all public data files on TCGA DCC data server were gathered at Jan-05-2015. Only eight cancer types have enough normal control samples for differential expression analysis. (t test, adjusted p<0.05 (using Benjamini-Hochberg FDR)) |
 |
| Top |
| * This plots show the correlation between CNV and gene expression. |
: Open all plots for all cancer types
 |
|
 |
|
| Top |
| Gene-Gene Network Information |
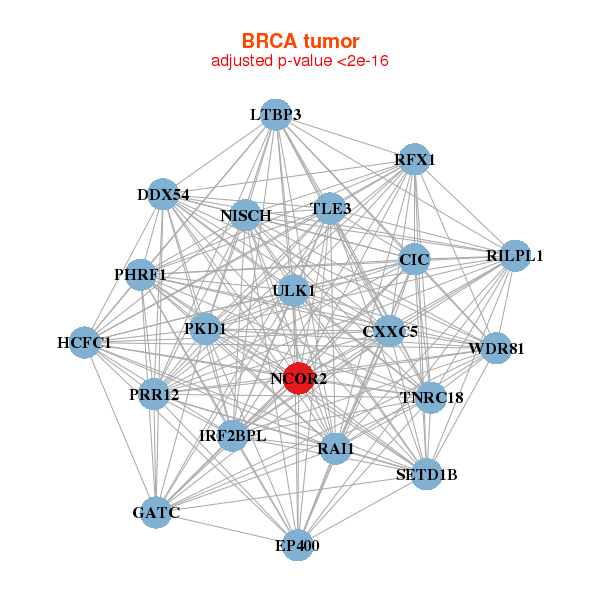
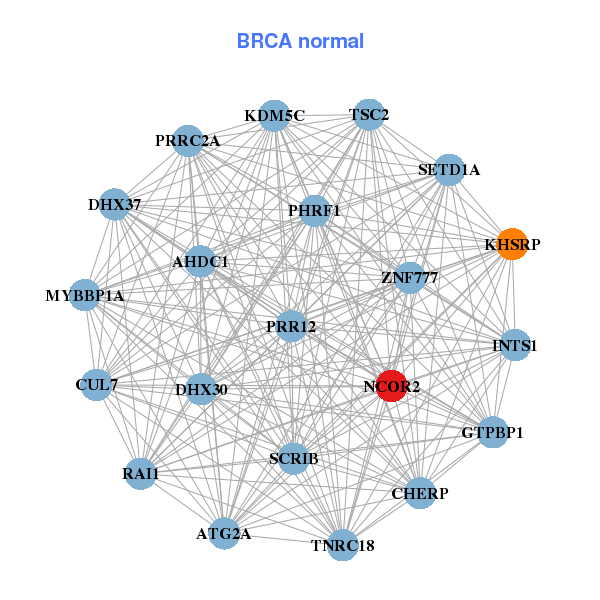
| * Co-Expression network figures were drawn using R package igraph. Only the top 20 genes with the highest correlations were shown. Red circle: input gene, orange circle: cell metabolism gene, sky circle: other gene |
: Open all plots for all cancer types
 |
| ||||
| IRF2BPL,CIC,CXXC5,DDX54,EP400,GATC,HCFC1, LTBP3,NCOR2,NISCH,PHRF1,PKD1,PRR12,RAI1, RFX1,RILPL1,SETD1B,TLE3,TNRC18,ULK1,WDR81 | AHDC1,ATG2A,PRRC2A,CHERP,CUL7,DHX30,DHX37, GTPBP1,INTS1,KDM5C,KHSRP,MYBBP1A,NCOR2,PHRF1, PRR12,RAI1,SCRIB,SETD1A,TNRC18,TSC2,ZNF777 | ||||
 |
| ||||
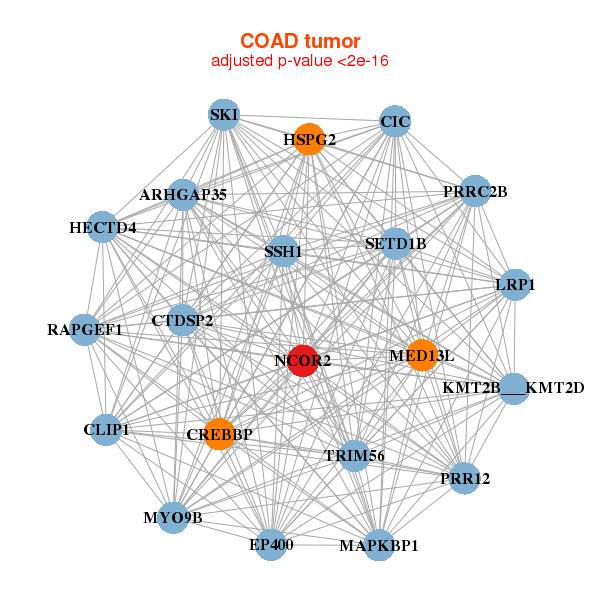
| PRRC2B,HECTD4,CIC,CLIP1,CREBBP,CTDSP2,EP400, ARHGAP35,HSPG2,LRP1,MAPKBP1,MED13L,KMT2B___KMT2D,MYO9B, NCOR2,PRR12,RAPGEF1,SETD1B,SKI,SSH1,TRIM56 | HECTD4,CIC,CREBBP,DIDO1,DYNC1H1,EP300,FAM193A, STRIP1,FLII,HERC2,MYO1C,NCOR2,PI4KA,PRR12, RERE,SCAF1,SETD1A,SMG6,TNRC18,TNRC6C,UBTF |
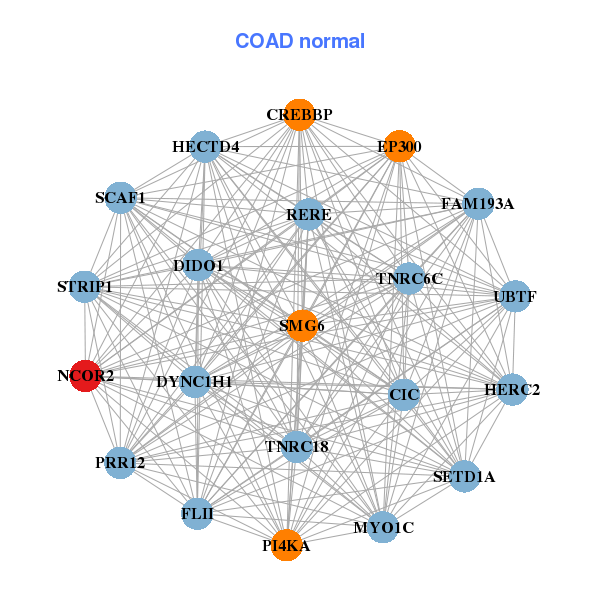
| * Co-Expression network figures were drawn using R package igraph. Only the top 20 genes with the highest correlations were shown. Red circle: input gene, orange circle: cell metabolism gene, sky circle: other gene |
: Open all plots for all cancer types
| Top |
: Open all interacting genes' information including KEGG pathway for all interacting genes from DAVID
| Top |
| Pharmacological Information for NCOR2 |
| DB Category | DB Name | DB's ID and Url link |
| Chemistry | BindingDB | Q9Y618; -. |
| Chemistry | ChEMBL | CHEMBL2096976; -. |
| Organism-specific databases | PharmGKB | PA31478; -. |
| Organism-specific databases | CTD | 9612; -. |
| * Gene Centered Interaction Network. |
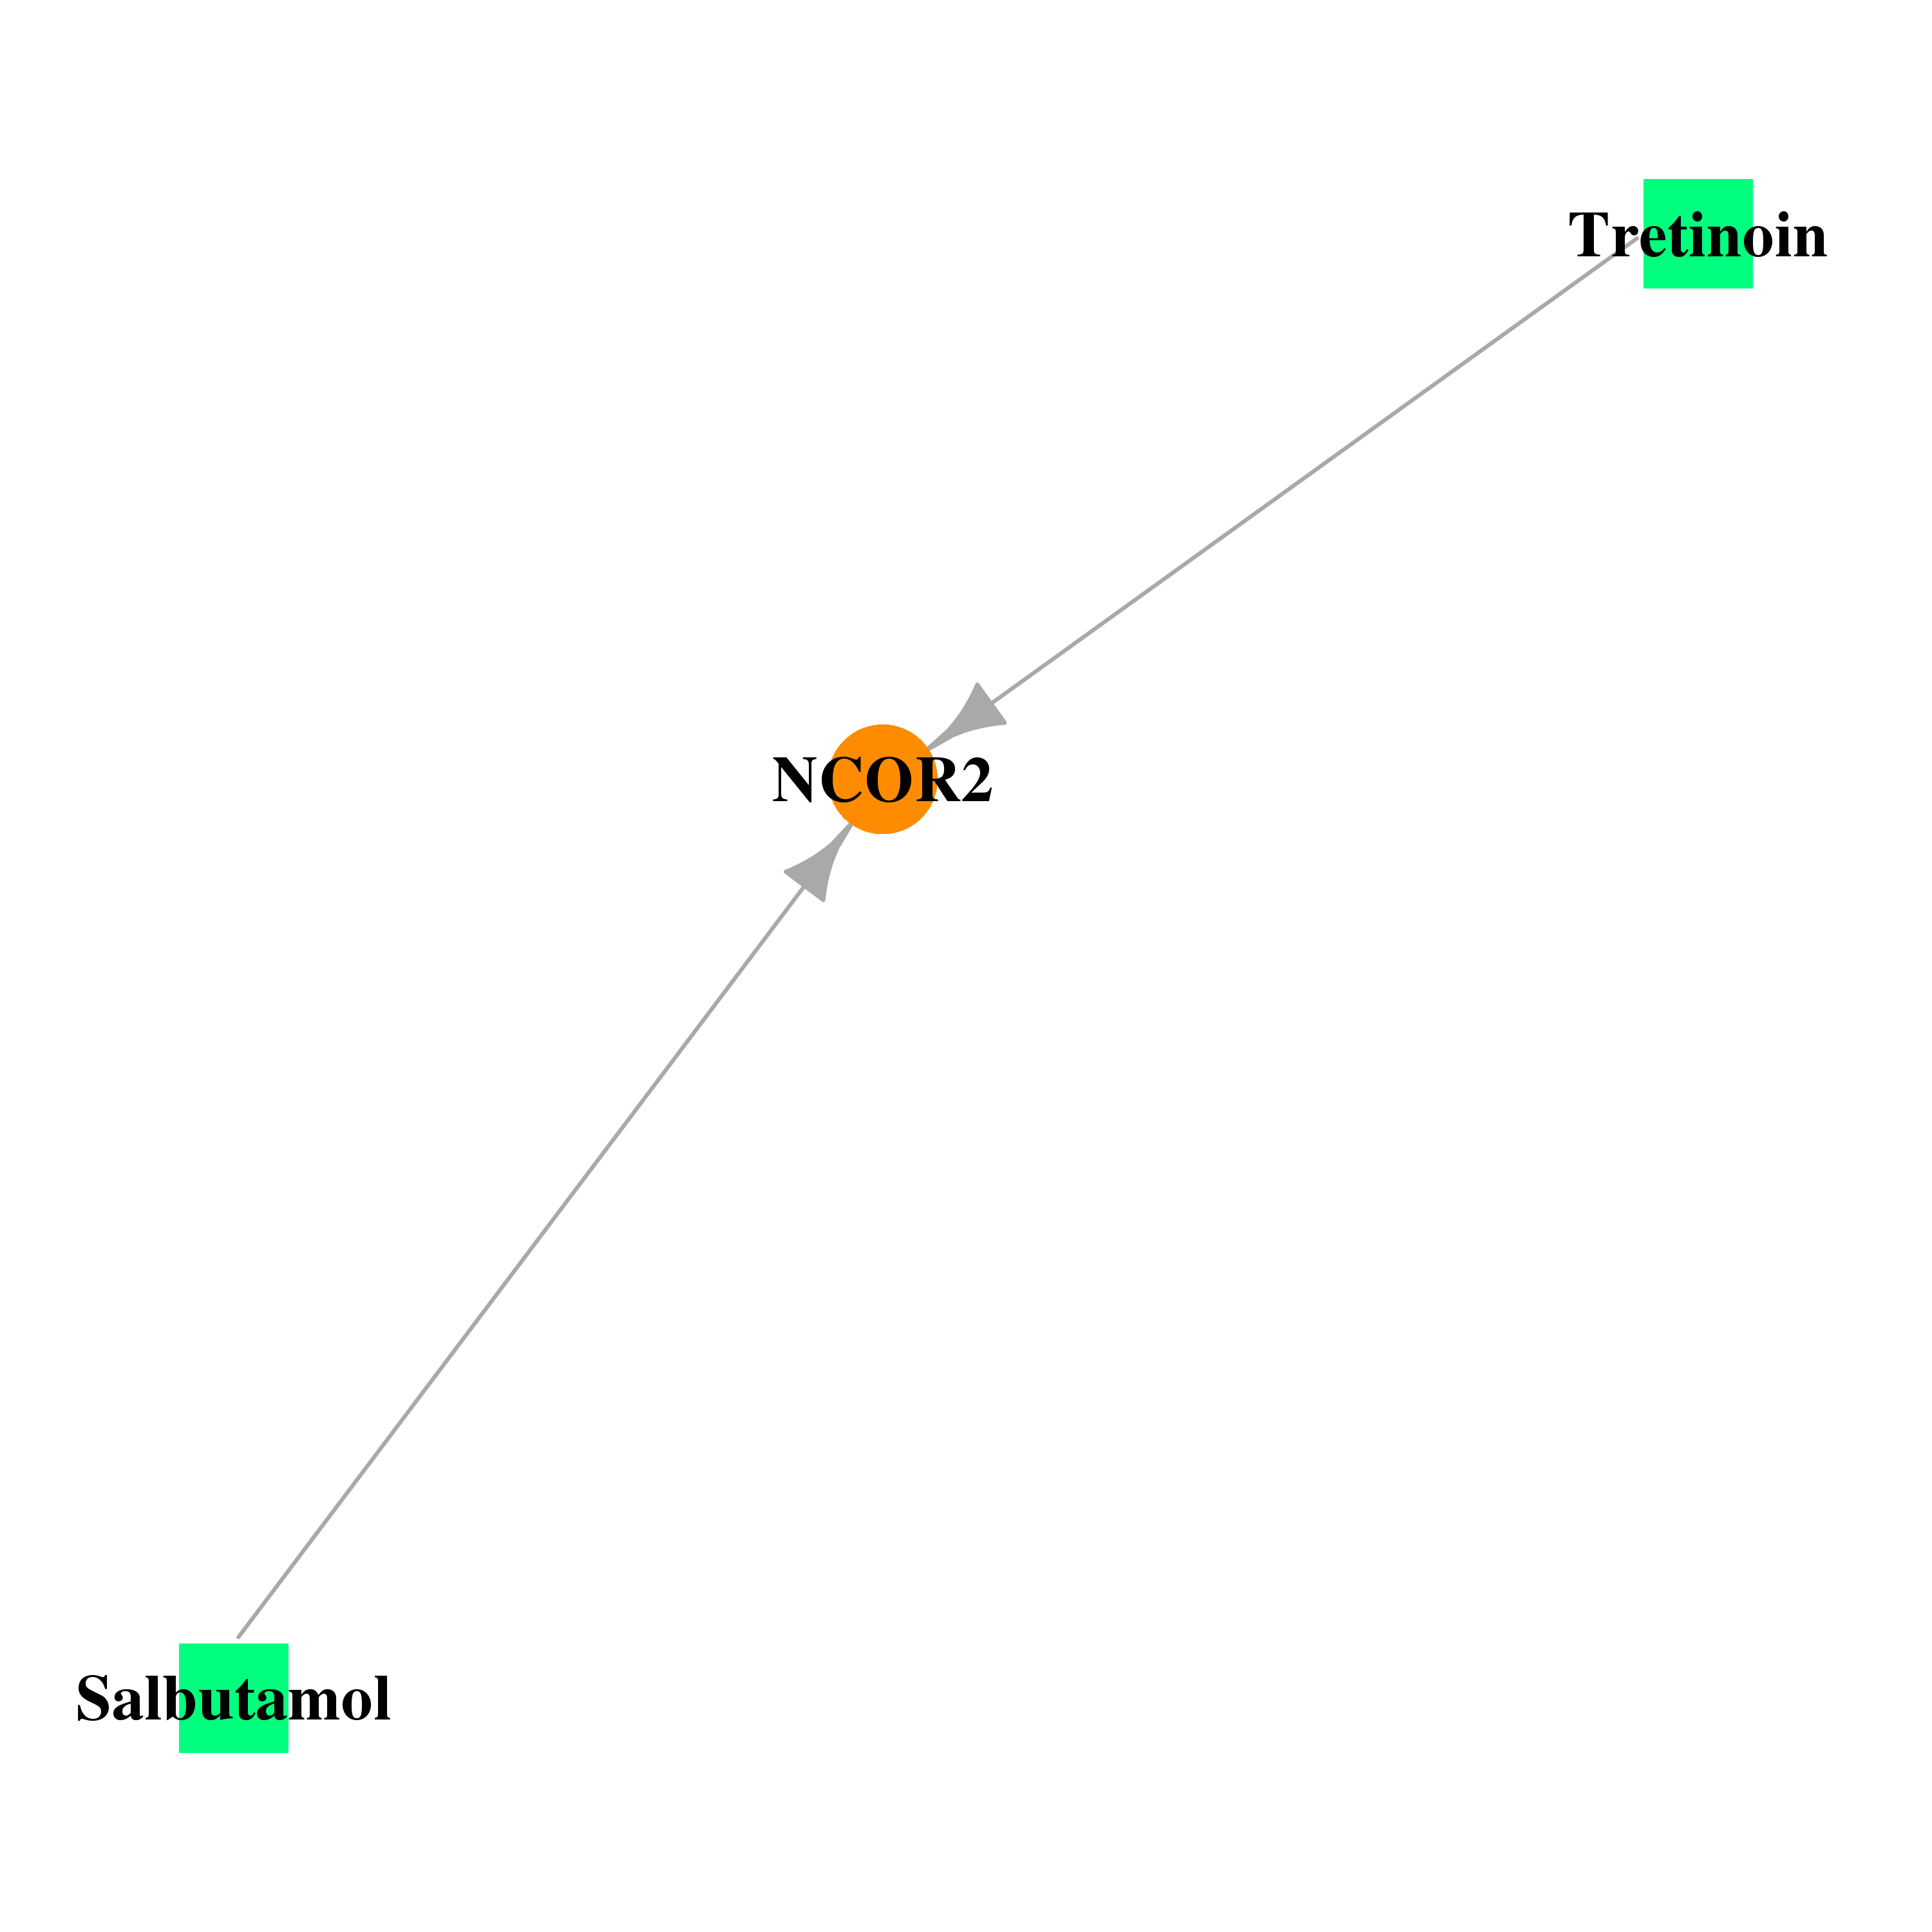 |
| * Drug Centered Interaction Network. |
| DrugBank ID | Target Name | Drug Groups | Generic Name | Drug Centered Network | Drug Structure |
| DB00755 | nuclear receptor corepressor 2 | approved; nutraceutical; investigational | Tretinoin | 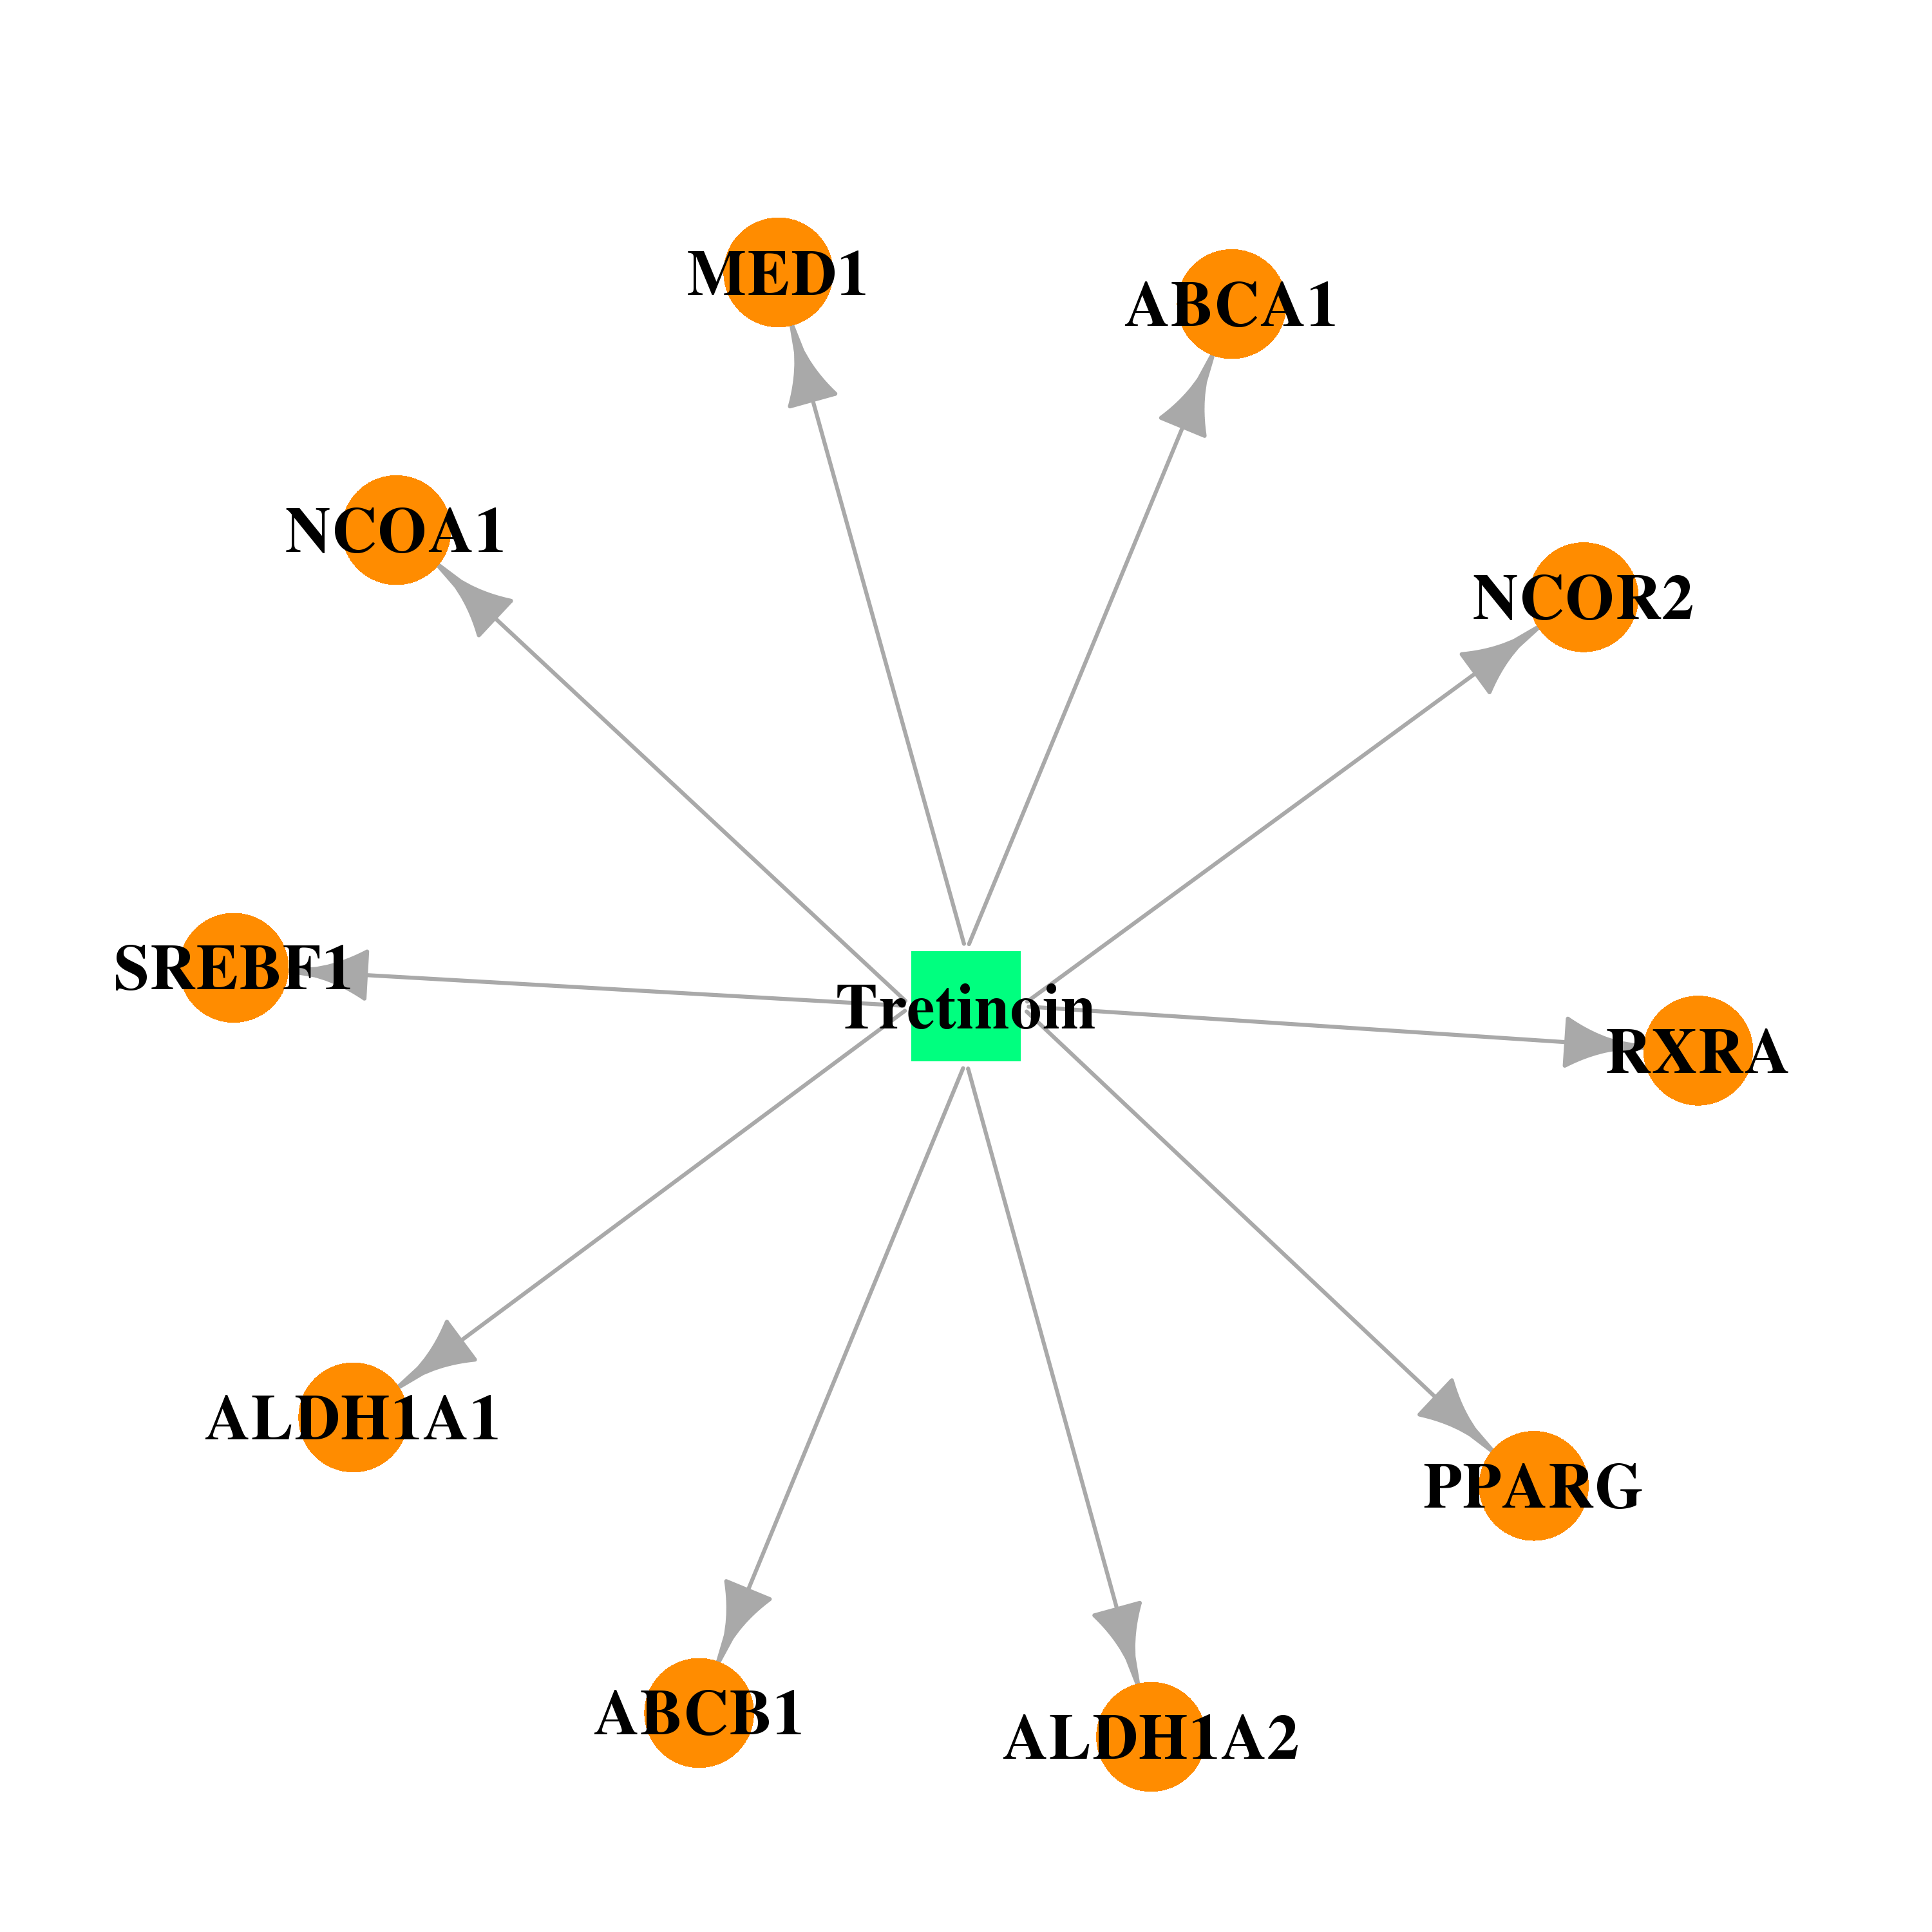 | 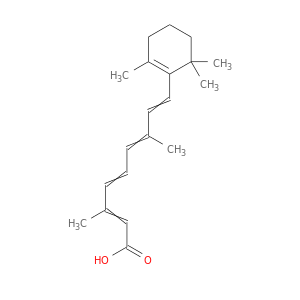 |
| DB01001 | nuclear receptor corepressor 2 | approved | Salbutamol |  | 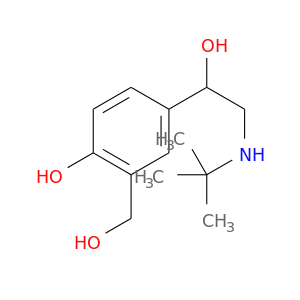 |
| Top |
| Cross referenced IDs for NCOR2 |
| * We obtained these cross-references from Uniprot database. It covers 150 different DBs, 18 categories. http://www.uniprot.org/help/cross_references_section |
: Open all cross reference information
|
Copyright © 2016-Present - The Univsersity of Texas Health Science Center at Houston @ |