|
||||||||||||||||||||
| |
| Phenotypic Information (metabolism pathway, cancer, disease, phenome) |
| |
| |
| Gene-Gene Network Information: Co-Expression Network, Interacting Genes & KEGG |
| |
|


| Gene Summary for GDA |
| Top |
| Phenotypic Information for GDA(metabolism pathway, cancer, disease, phenome) |
| Cancer | CGAP: GDA |
| Familial Cancer Database: GDA | |
| * This gene is included in those cancer gene databases. |
|
|
|
|
|
| . | ||||||||||||||
Oncogene 1 | Significant driver gene in | |||||||||||||||||||
| cf) number; DB name 1 Oncogene; http://nar.oxfordjournals.org/content/35/suppl_1/D721.long, 2 Tumor Suppressor gene; https://bioinfo.uth.edu/TSGene/, 3 Cancer Gene Census; http://www.nature.com/nrc/journal/v4/n3/abs/nrc1299.html, 4 CancerGenes; http://nar.oxfordjournals.org/content/35/suppl_1/D721.long, 5 Network of Cancer Gene; http://ncg.kcl.ac.uk/index.php, 1Therapeutic Vulnerabilities in Cancer; http://cbio.mskcc.org/cancergenomics/statius/ |
| KEGG_PURINE_METABOLISM REACTOME_METABOLISM_OF_NUCLEOTIDES REACTOME_PURINE_METABOLISM | |
| OMIM | |
| Orphanet | |
| Disease | KEGG Disease: GDA |
| MedGen: GDA (Human Medical Genetics with Condition) | |
| ClinVar: GDA | |
| Phenotype | MGI: GDA (International Mouse Phenotyping Consortium) |
| PhenomicDB: GDA | |
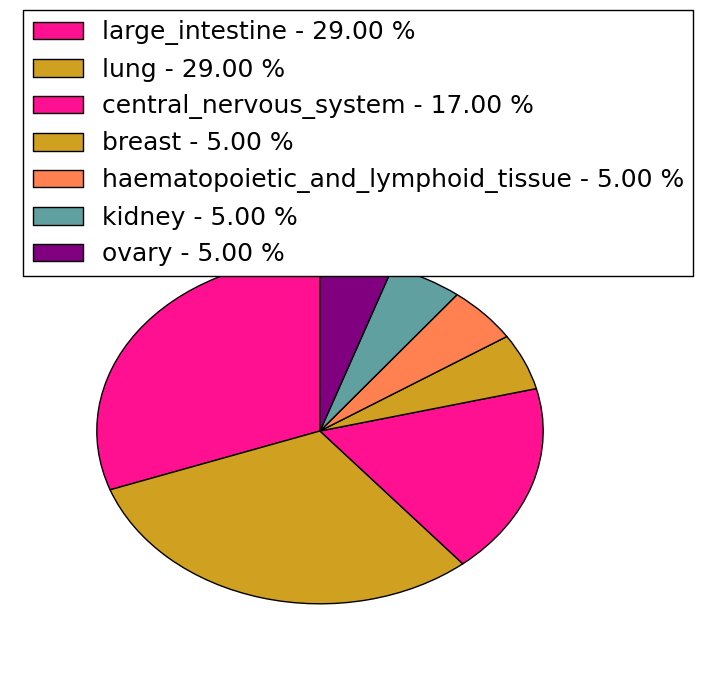
| Mutations for GDA |
| * Under tables are showing count per each tissue to give us broad intuition about tissue specific mutation patterns.You can go to the detailed page for each mutation database's web site. |
| There's no structural variation information in COSMIC data for this gene. |
| * From mRNA Sanger sequences, Chitars2.0 arranged chimeric transcripts. This table shows GDA related fusion information. |
| ID | Head Gene | Tail Gene | Accession | Gene_a | qStart_a | qEnd_a | Chromosome_a | tStart_a | tEnd_a | Gene_a | qStart_a | qEnd_a | Chromosome_a | tStart_a | tEnd_a |
| BM968596 | GDA | 18 | 348 | 9 | 74866810 | 74867140 | GDA | 344 | 484 | 9 | 74860152 | 74865735 | |
| AW818534 | GDA | 2 | 103 | 9 | 74822564 | 74822665 | DGKH | 93 | 167 | 13 | 42774590 | 42774664 | |
| BF802793 | MKRN1 | 13 | 77 | 7 | 140156320 | 140156384 | GDA | 72 | 438 | 9 | 74863556 | 74863922 | |
| Top |
| There's no copy number variation information in COSMIC data for this gene. |
| Top |
|
 |
| Top |
| Stat. for Non-Synonymous SNVs (# total SNVs=42) | (# total SNVs=17) |
 |  |
(# total SNVs=0) | (# total SNVs=0) |
| Top |
| * When you move the cursor on each content, you can see more deailed mutation information on the Tooltip. Those are primary_site,primary_histology,mutation(aa),pubmedID. |
| GRCh37 position | Mutation(aa) | Unique sampleID count |
| chr9:74860096-74860096 | p.E390* | 2 |
| chr9:74863239-74863239 | p.P449L | 2 |
| chr9:74863245-74863245 | p.S451F | 2 |
| chr9:74860098-74860098 | p.E390E | 2 |
| chr9:74860108-74860108 | p.E394K | 2 |
| chr9:74840693-74840693 | p.T272R | 2 |
| chr9:74863209-74863209 | p.E439G | 2 |
| chr9:74834408-74834408 | p.M198V | 2 |
| chr9:74764526-74764526 | p.F17F | 2 |
| chr9:74842916-74842916 | p.R294* | 2 |
| Top |
|
 |
| Point Mutation/ Tissue ID | 1 | 2 | 3 | 4 | 5 | 6 | 7 | 8 | 9 | 10 | 11 | 12 | 13 | 14 | 15 | 16 | 17 | 18 | 19 | 20 |
| # sample | 4 | 2 | 10 | 1 | 4 | 1 | 13 | 7 | 3 | 11 | 2 | 4 | ||||||||
| # mutation | 4 | 2 | 8 | 1 | 4 | 1 | 14 | 7 | 3 | 14 | 2 | 4 | ||||||||
| nonsynonymous SNV | 3 | 1 | 4 | 1 | 4 | 1 | 10 | 5 | 2 | 12 | 1 | 4 | ||||||||
| synonymous SNV | 1 | 1 | 4 | 4 | 2 | 1 | 2 | 1 |
| cf) Tissue ID; Tissue type (1; BLCA[Bladder Urothelial Carcinoma], 2; BRCA[Breast invasive carcinoma], 3; CESC[Cervical squamous cell carcinoma and endocervical adenocarcinoma], 4; COAD[Colon adenocarcinoma], 5; GBM[Glioblastoma multiforme], 6; Glioma Low Grade, 7; HNSC[Head and Neck squamous cell carcinoma], 8; KICH[Kidney Chromophobe], 9; KIRC[Kidney renal clear cell carcinoma], 10; KIRP[Kidney renal papillary cell carcinoma], 11; LAML[Acute Myeloid Leukemia], 12; LUAD[Lung adenocarcinoma], 13; LUSC[Lung squamous cell carcinoma], 14; OV[Ovarian serous cystadenocarcinoma ], 15; PAAD[Pancreatic adenocarcinoma], 16; PRAD[Prostate adenocarcinoma], 17; SKCM[Skin Cutaneous Melanoma], 18:STAD[Stomach adenocarcinoma], 19:THCA[Thyroid carcinoma], 20:UCEC[Uterine Corpus Endometrial Carcinoma]) |
| Top |
| * We represented just top 10 SNVs. When you move the cursor on each content, you can see more deailed mutation information on the Tooltip. Those are primary_site, primary_histology, mutation(aa), pubmedID. |
| Genomic Position | Mutation(aa) | Unique sampleID count |
| chr9:74863209 | p.E390E,GDA | 2 |
| chr9:74863239 | p.E439G,GDA | 2 |
| chr9:74860098 | p.P449L,GDA | 2 |
| chr9:74764526 | p.F17F,GDA | 2 |
| chr9:74764549 | p.P62Q,GDA | 1 |
| chr9:74838121 | p.E182K,GDA | 1 |
| chr9:74817626 | p.D246E,GDA | 1 |
| chr9:74856157 | p.P62P,GDA | 1 |
| chr9:74828907 | p.E186K,GDA | 1 |
| chr9:74863197 | p.Y258Y,GDA | 1 |
| * Copy number data were extracted from TCGA using R package TCGA-Assembler. The URLs of all public data files on TCGA DCC data server were gathered on Jan-05-2015. Function ProcessCNAData in TCGA-Assembler package was used to obtain gene-level copy number value which is calculated as the average copy number of the genomic region of a gene. |
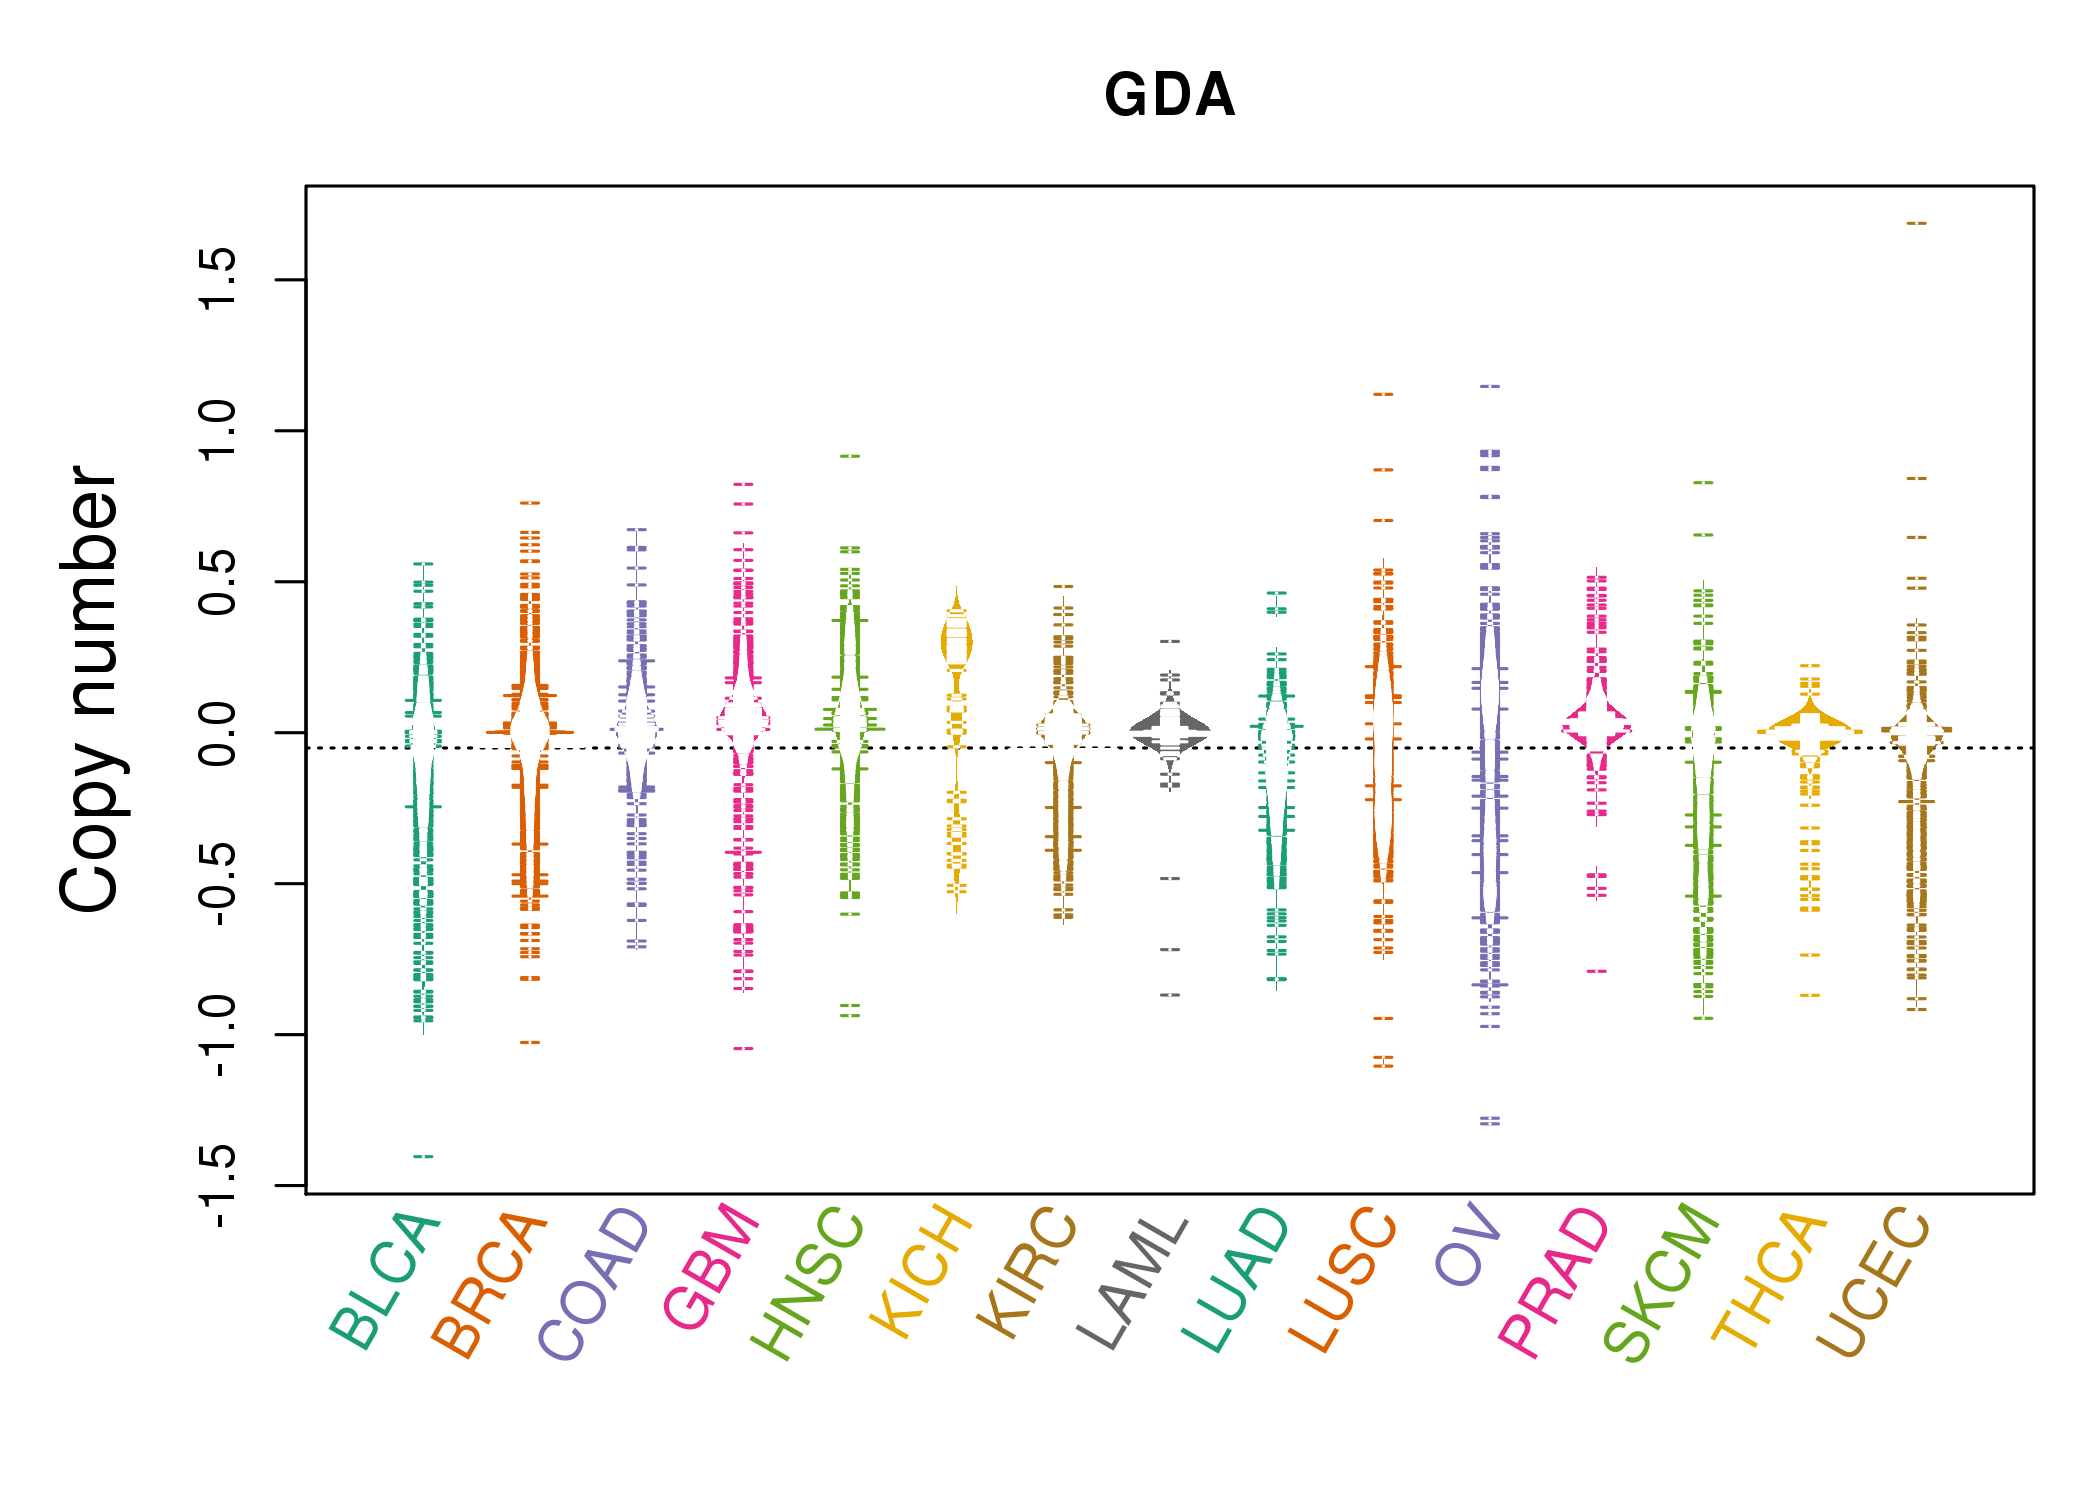 |
| cf) Tissue ID[Tissue type]: BLCA[Bladder Urothelial Carcinoma], BRCA[Breast invasive carcinoma], CESC[Cervical squamous cell carcinoma and endocervical adenocarcinoma], COAD[Colon adenocarcinoma], GBM[Glioblastoma multiforme], Glioma Low Grade, HNSC[Head and Neck squamous cell carcinoma], KICH[Kidney Chromophobe], KIRC[Kidney renal clear cell carcinoma], KIRP[Kidney renal papillary cell carcinoma], LAML[Acute Myeloid Leukemia], LUAD[Lung adenocarcinoma], LUSC[Lung squamous cell carcinoma], OV[Ovarian serous cystadenocarcinoma ], PAAD[Pancreatic adenocarcinoma], PRAD[Prostate adenocarcinoma], SKCM[Skin Cutaneous Melanoma], STAD[Stomach adenocarcinoma], THCA[Thyroid carcinoma], UCEC[Uterine Corpus Endometrial Carcinoma] |
| Top |
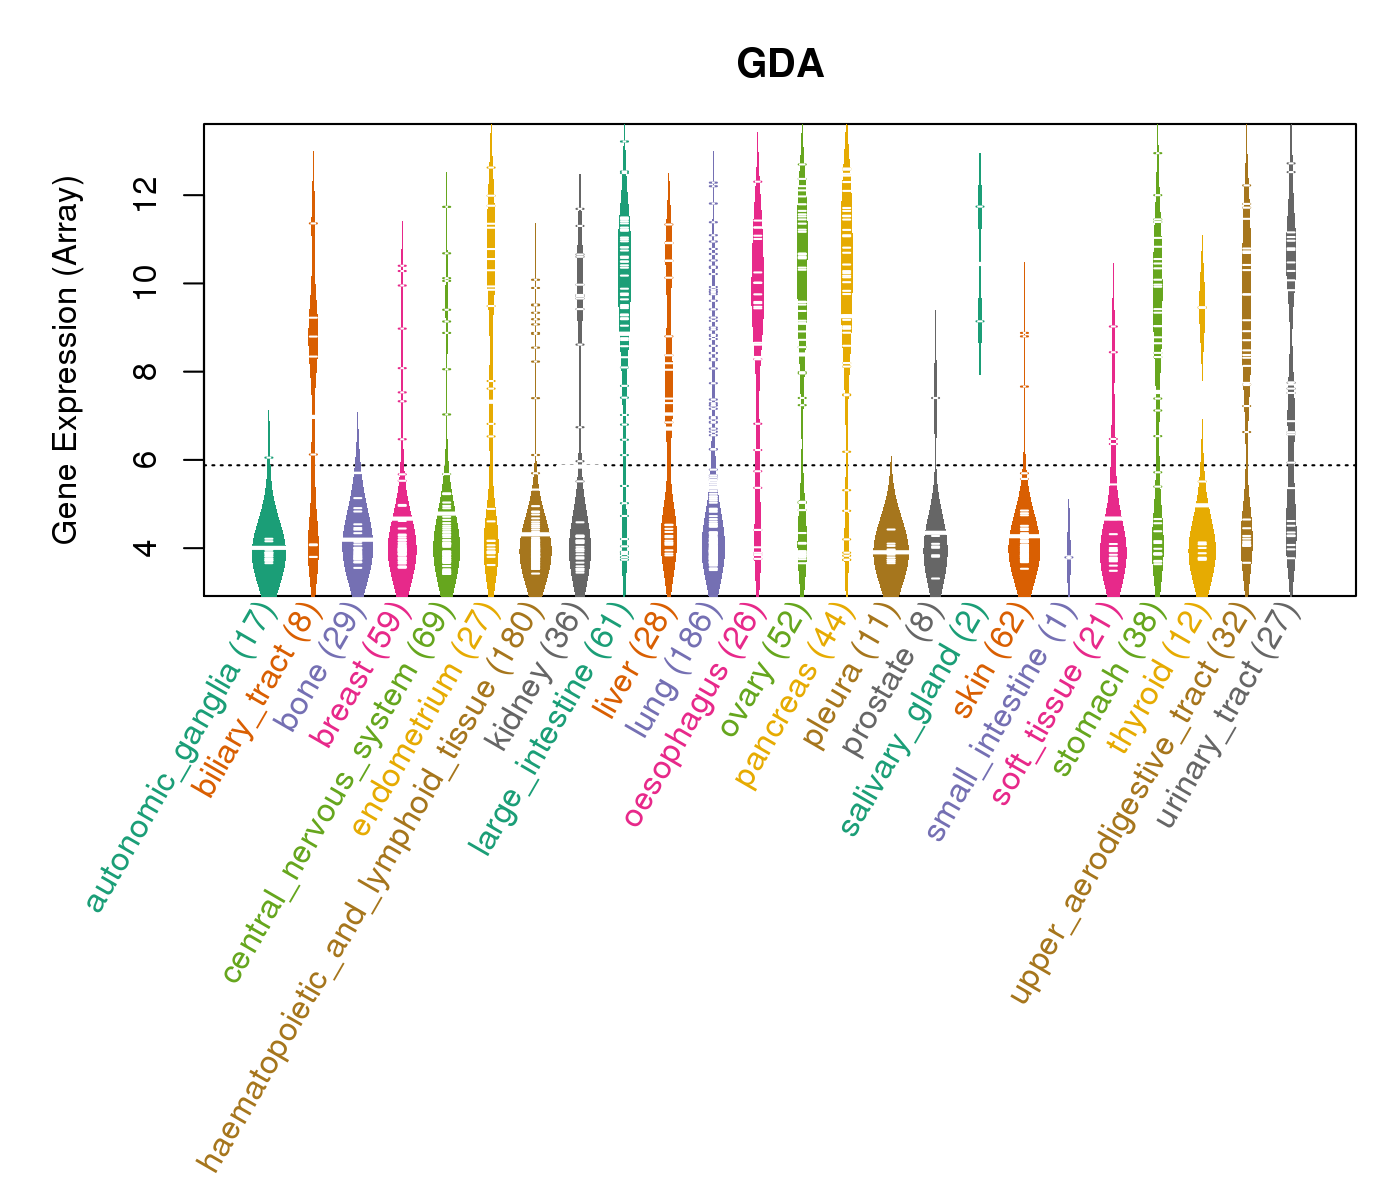
| Gene Expression for GDA |
| * CCLE gene expression data were extracted from CCLE_Expression_Entrez_2012-10-18.res: Gene-centric RMA-normalized mRNA expression data. |
 |
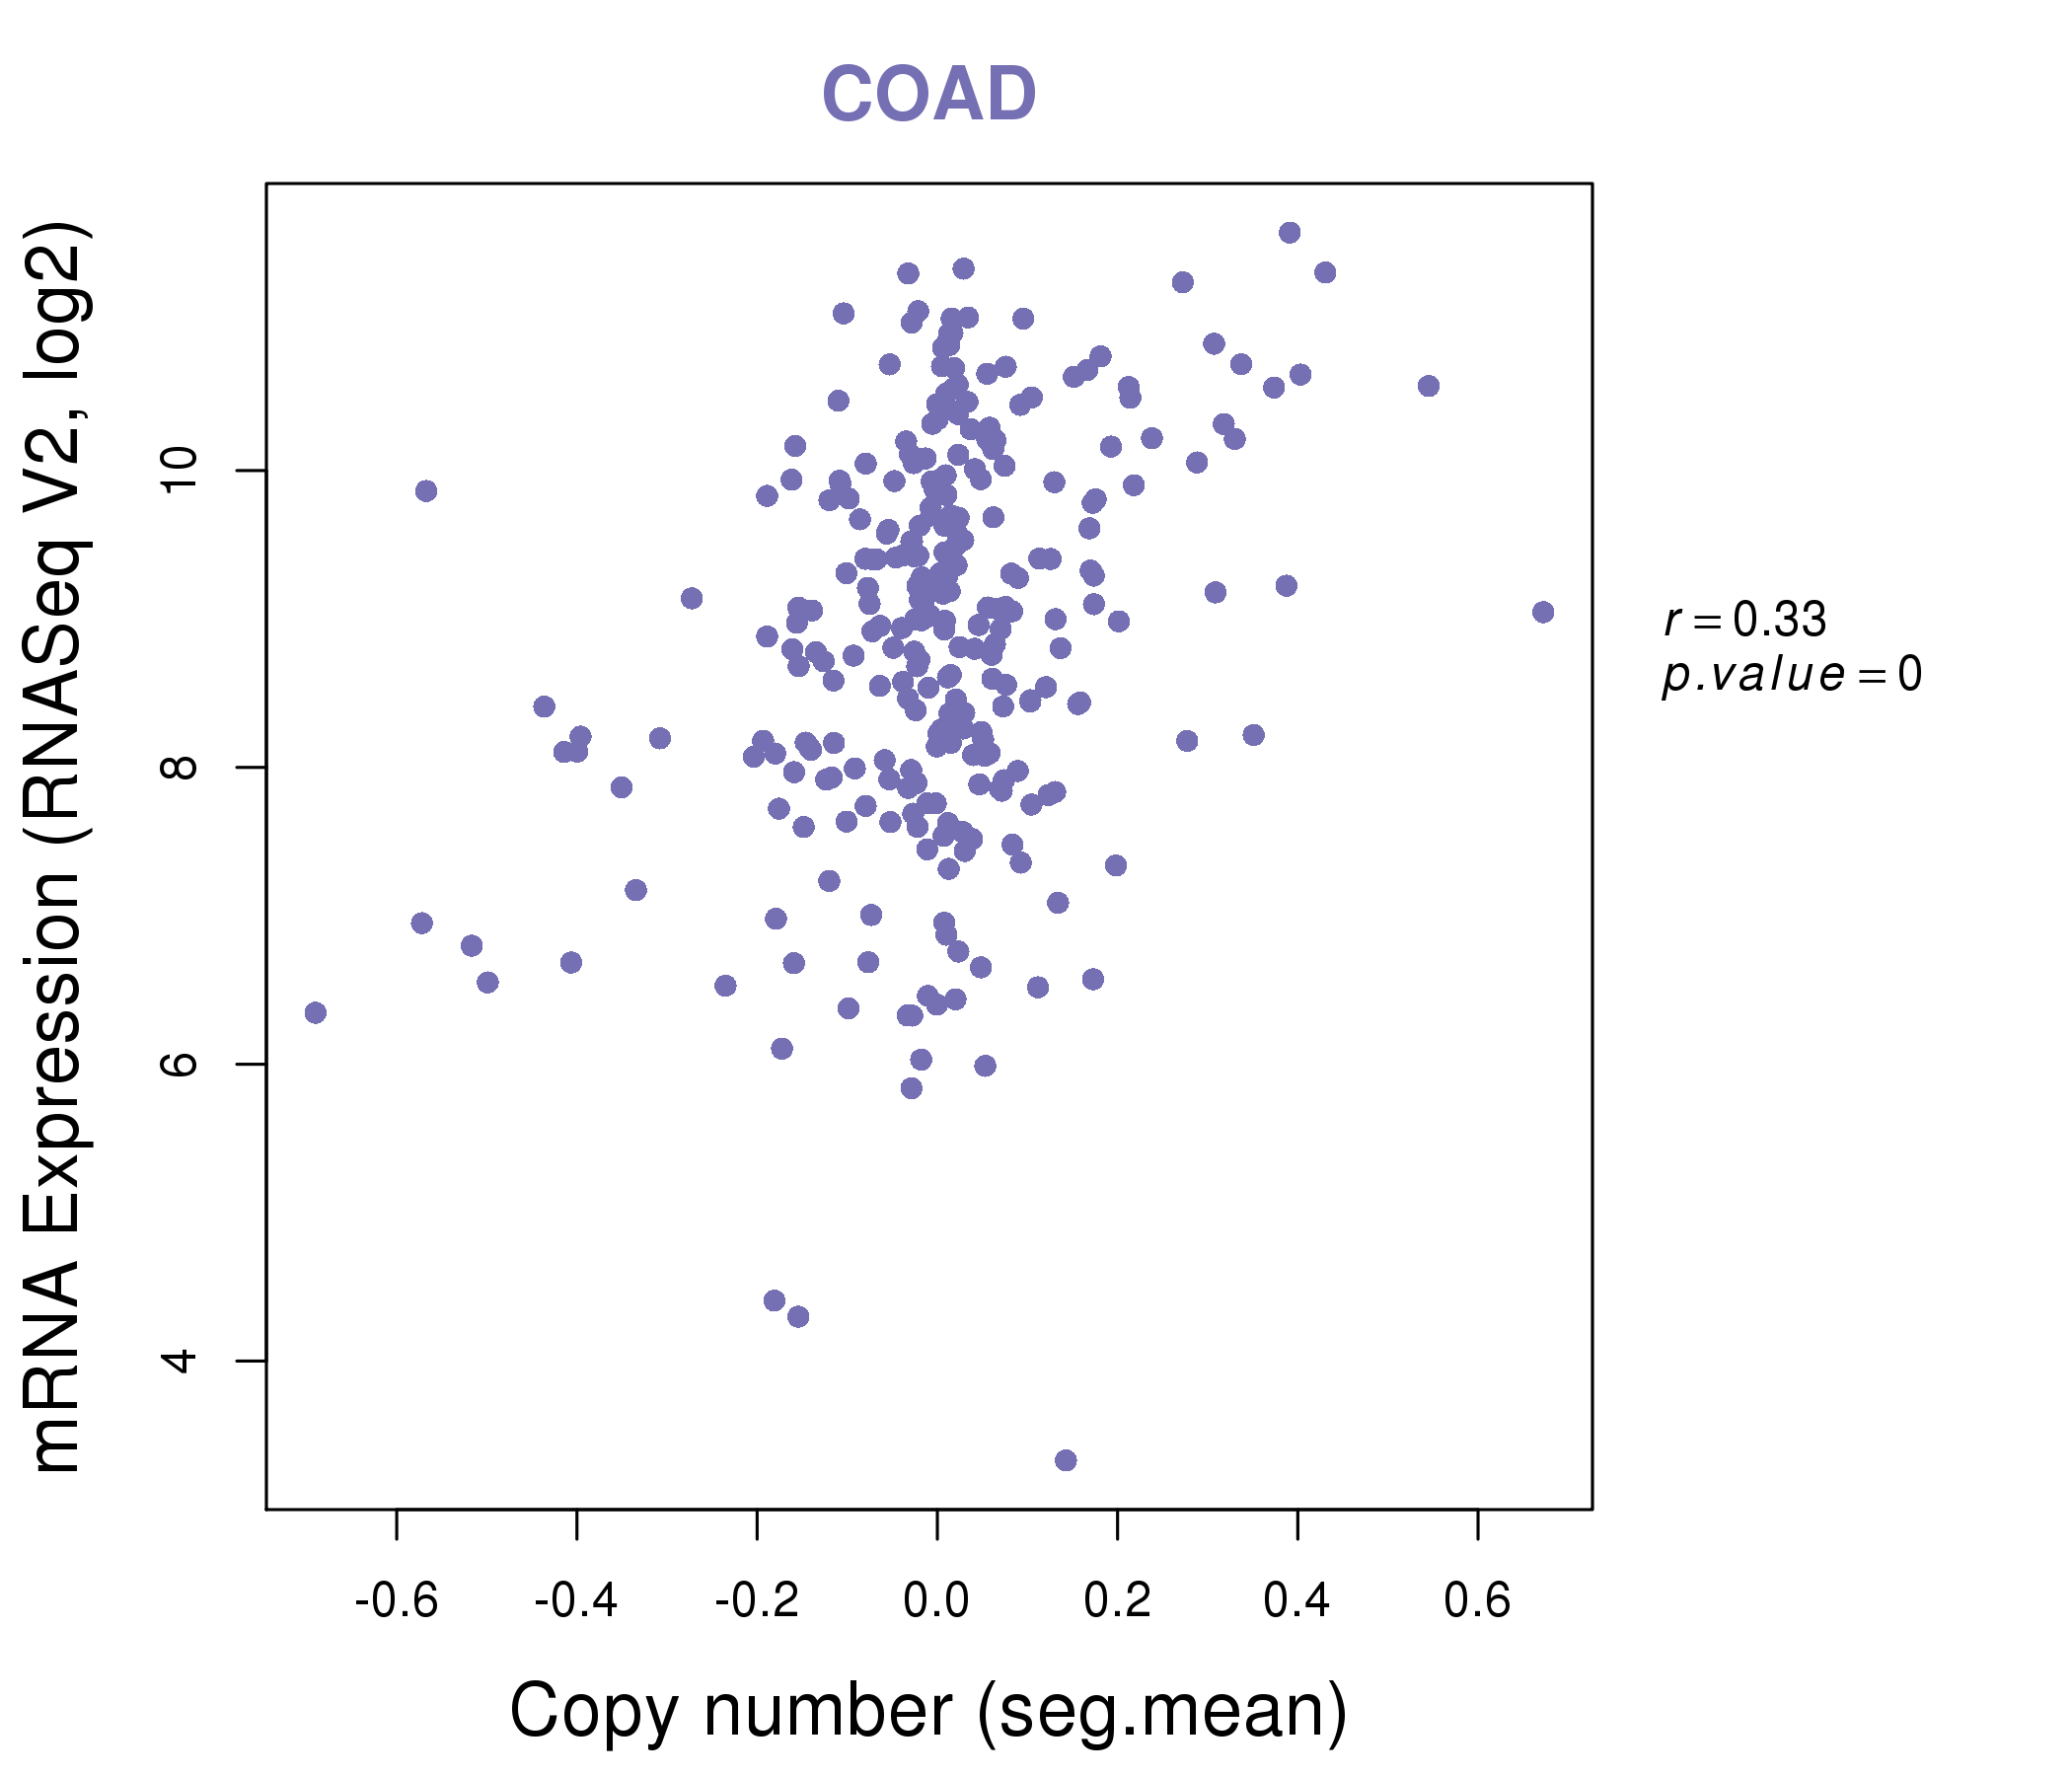
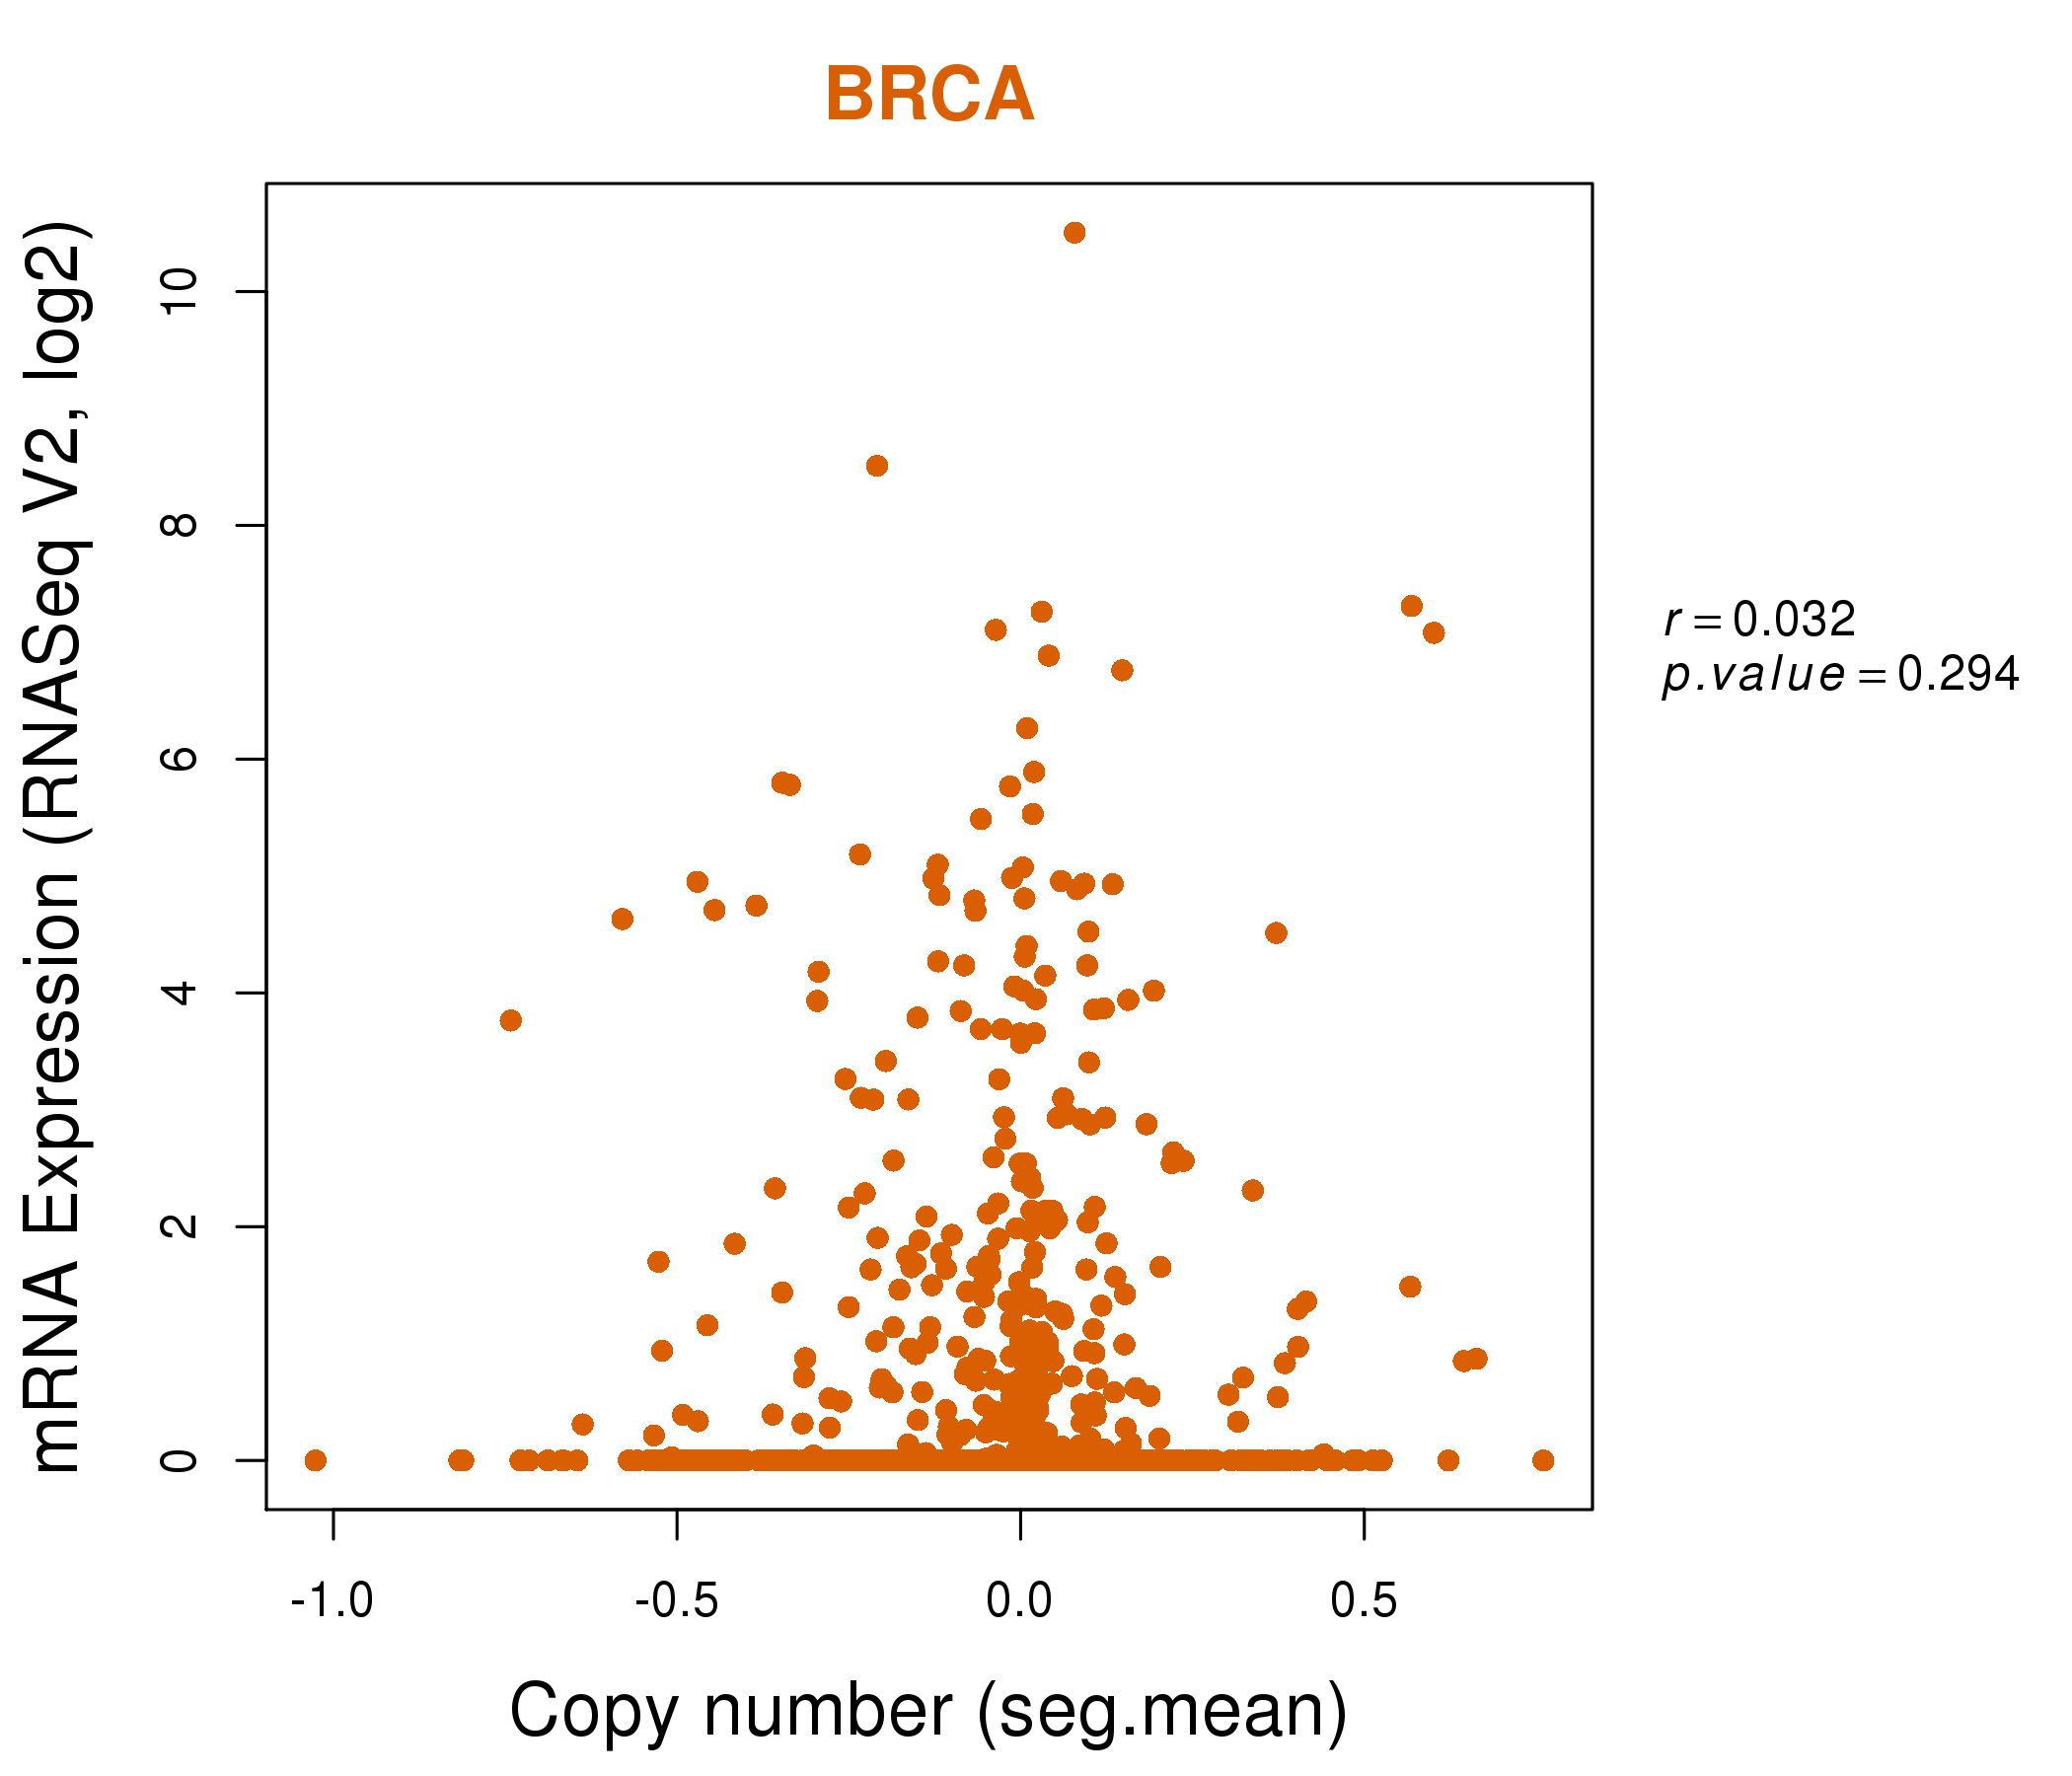
| * Normalized gene expression data of RNASeqV2 was extracted from TCGA using R package TCGA-Assembler. The URLs of all public data files on TCGA DCC data server were gathered at Jan-05-2015. Only eight cancer types have enough normal control samples for differential expression analysis. (t test, adjusted p<0.05 (using Benjamini-Hochberg FDR)) |
 |
| Top |
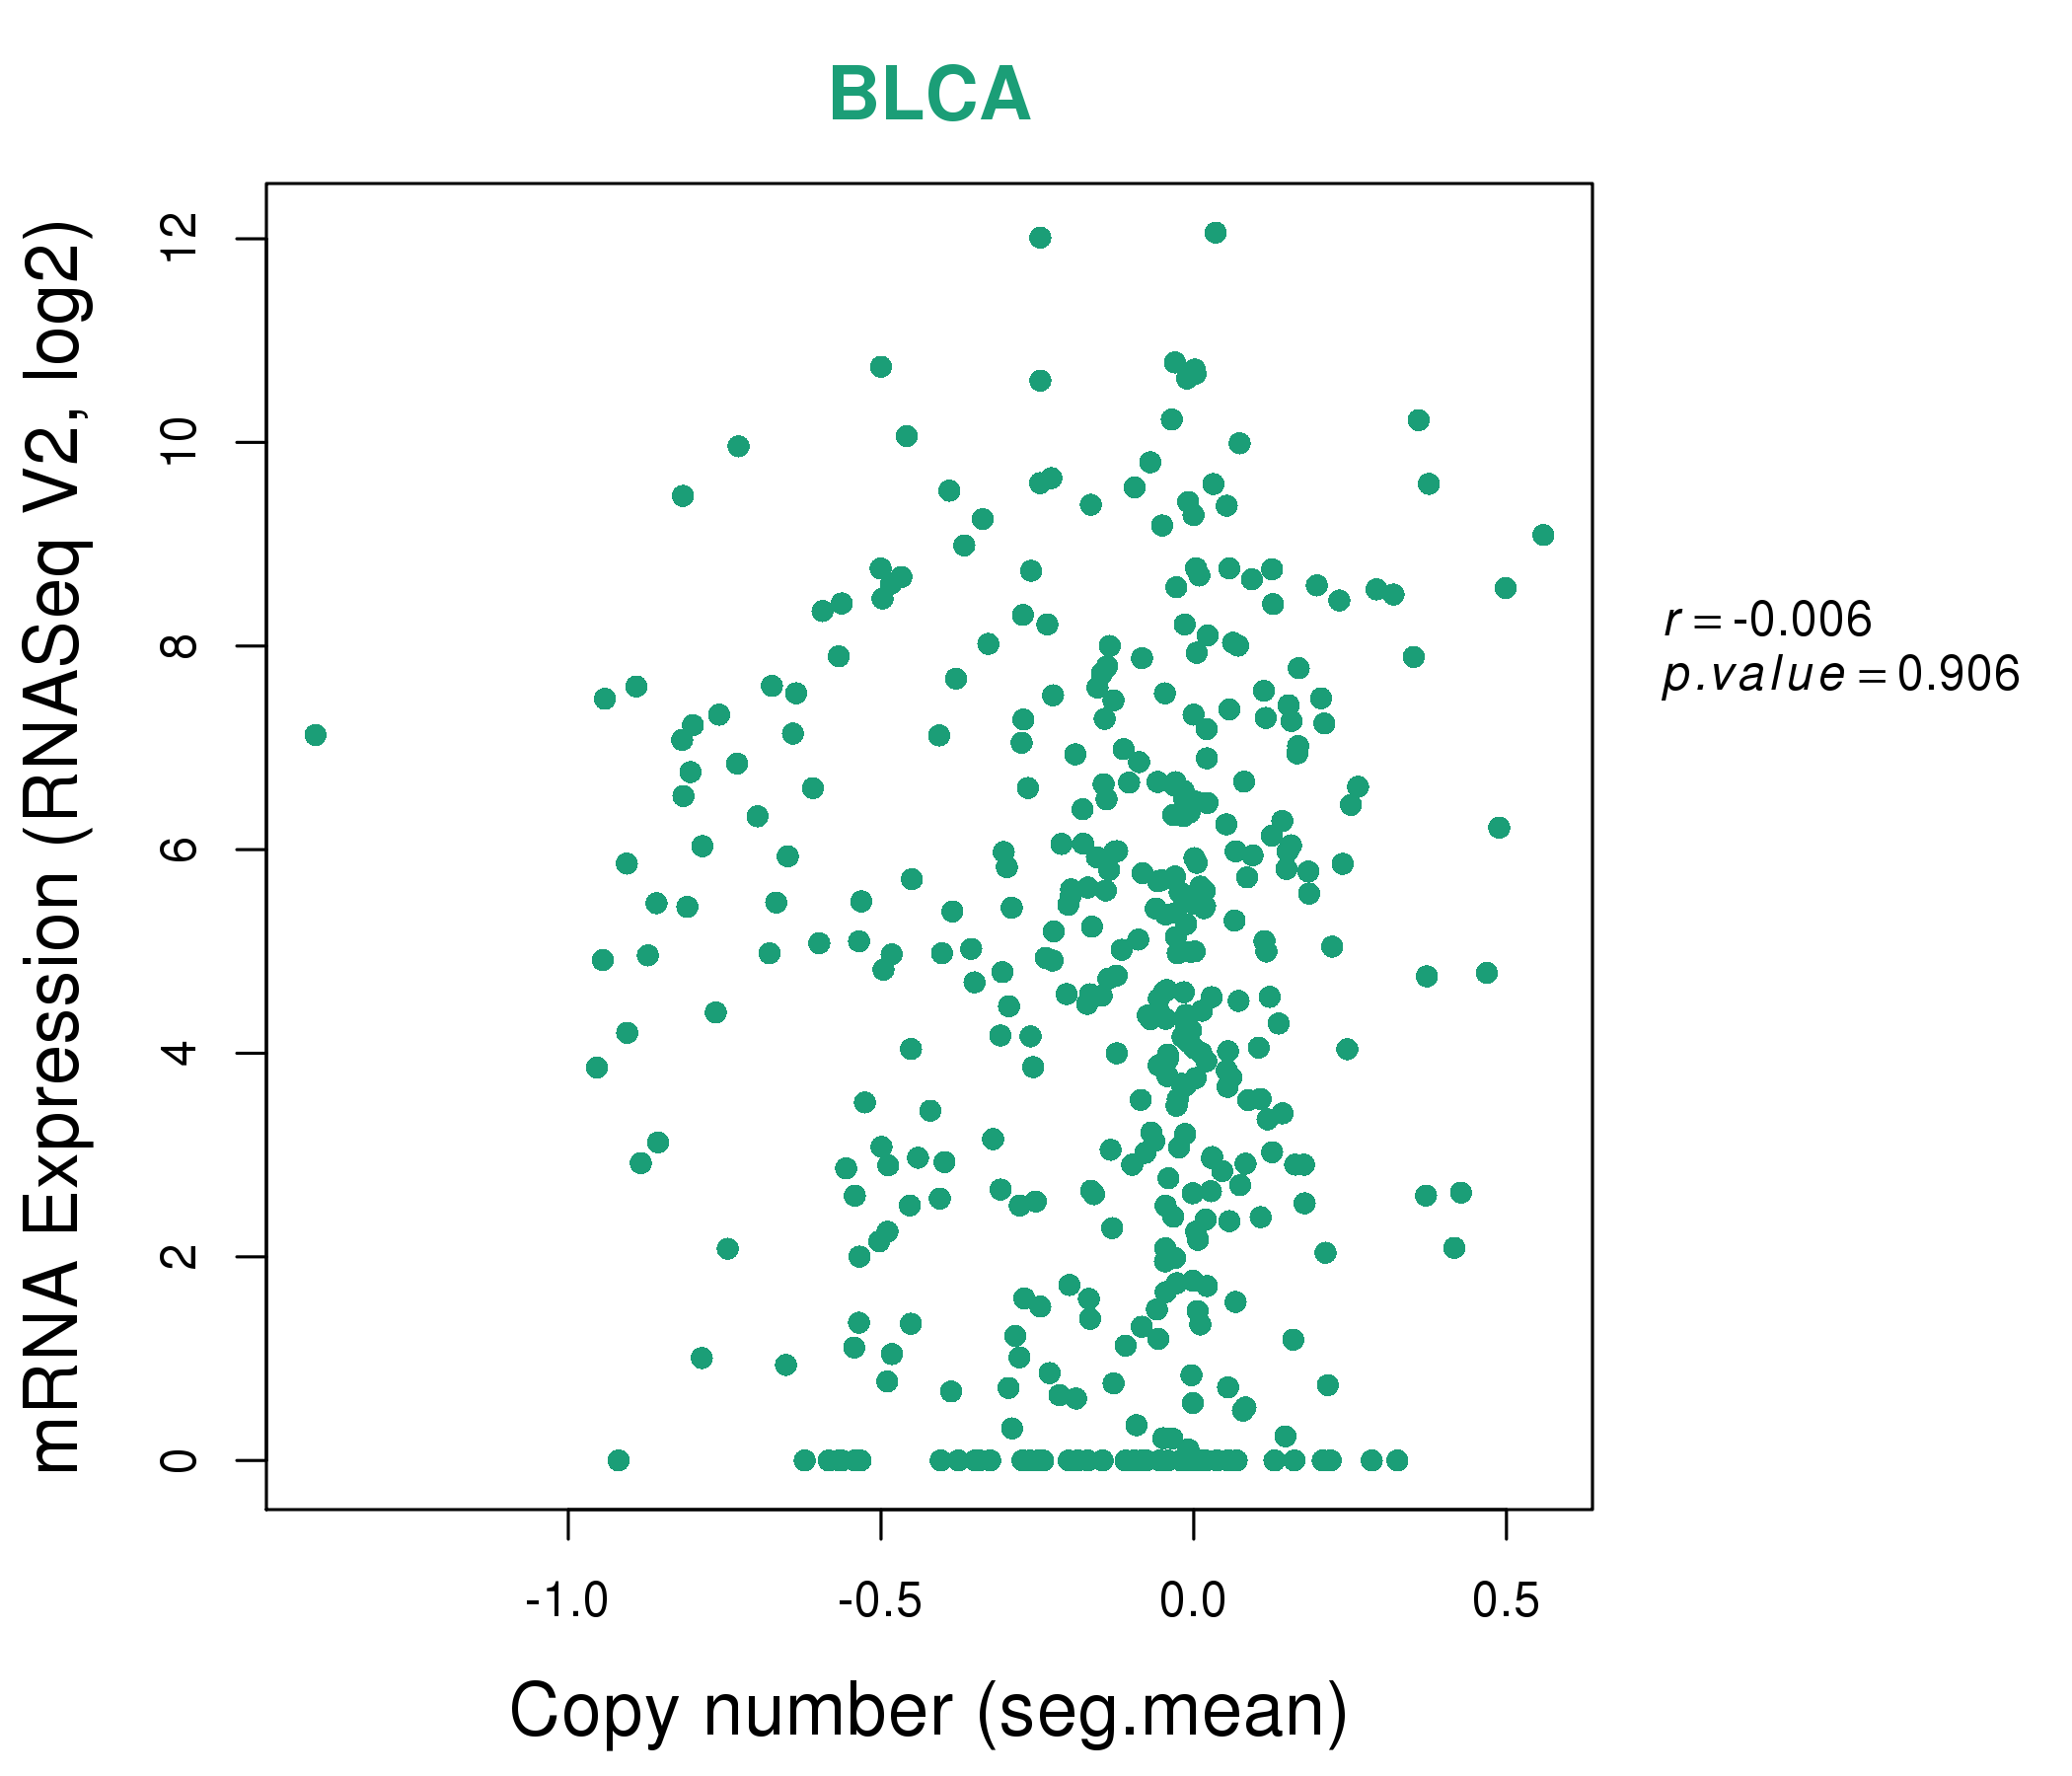
| * This plots show the correlation between CNV and gene expression. |
: Open all plots for all cancer types
 |
|
 |
|

| Top |
| Gene-Gene Network Information |
| * Co-Expression network figures were drawn using R package igraph. Only the top 20 genes with the highest correlations were shown. Red circle: input gene, orange circle: cell metabolism gene, sky circle: other gene |
: Open all plots for all cancer types
 |
|
| ALPP,ALPPL2,C1orf87,DEFB104A,DNAJB13,FAM181A,GDA, IHH,LIMS3,LIMS3-LOC440895,LOC647309,MOS,NKX6-2,ONECUT3, PKHD1L1,SCGB1A1,SERPINA4,SFTA2,SOX17,TDGF1,TRIM31 | AGL,ANO5,ARPP21,BOLL,CKMT2,CLIC5,CLTCL1, CTNNA3,DCAF6,ENAM,FNDC5,GDA,LMO1,MYH1, MYOM1,PDE4DIP,POPDC3,SYPL2,TMEM182,TRDN,TRIM7 |
 |
|
| AGR3,ASS1,BARX2,MYRF,C2orf72,CYSTM1,FAM47E, GDA,LIMA1,PDZK1IP1,PLLP,PSMD5,RSPH1,SGPP2, SLC37A1,SLC41A2,SLC6A20,TMC5,TMEM92,TTC7A,VAPA | SOWAHA,ANPEP,BTNL8,C1orf115,CDHR2,CDHR5,ENPP3, FLVCR1,GDA,GDPD2,HNF4G,INPP5J,MEP1A,MYO1A, PCK2,PDXP,PLA2G12B,PRAP1,SLC23A3,SLC3A1,SLC46A3 |
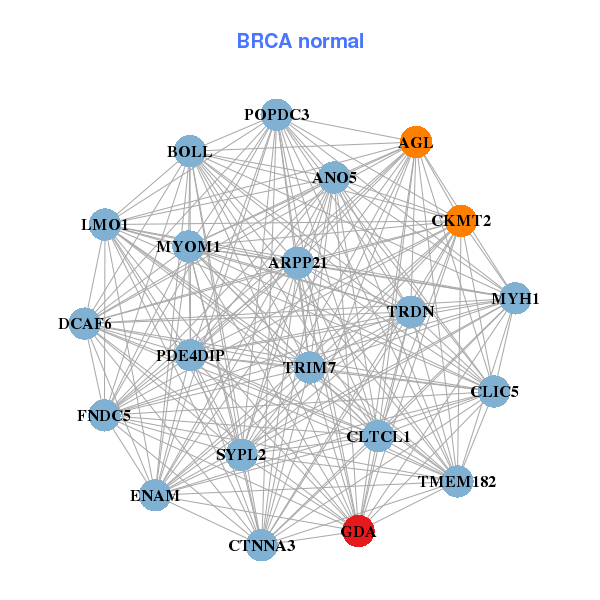

| * Co-Expression network figures were drawn using R package igraph. Only the top 20 genes with the highest correlations were shown. Red circle: input gene, orange circle: cell metabolism gene, sky circle: other gene |
: Open all plots for all cancer types
| Top |
: Open all interacting genes' information including KEGG pathway for all interacting genes from DAVID
| Top |
| Pharmacological Information for GDA |
| There's no related Drug. |
| Top |
| Cross referenced IDs for GDA |
| * We obtained these cross-references from Uniprot database. It covers 150 different DBs, 18 categories. http://www.uniprot.org/help/cross_references_section |
: Open all cross reference information
|
Copyright © 2016-Present - The Univsersity of Texas Health Science Center at Houston @ |