|
|||||||||||||||||||||||||||||||||||||||||||||||||||||||||||||||||||||||||||||||||||||||||||||||||||||||||||||||||||||||||||||||||||||||||||||||||||||||||||||||||||||||||||||||||||||||||||||||||||||||||||||||||||||||||||||||||||||||||||||||||||||||||||||||||||||||||||||||||||||||||||||||||||||||||||||||||||||||||||||||||||||||||||||||||||
| |
| Phenotypic Information (metabolism pathway, cancer, disease, phenome) |
| |
| |
| Gene-Gene Network Information: Co-Expression Network, Interacting Genes & KEGG |
| |
|


| Gene Summary for ABCG1 |
| Basic gene info. | Gene symbol | ABCG1 |
| Gene name | ATP-binding cassette, sub-family G (WHITE), member 1 | |
| Synonyms | ABC8|WHITE1 | |
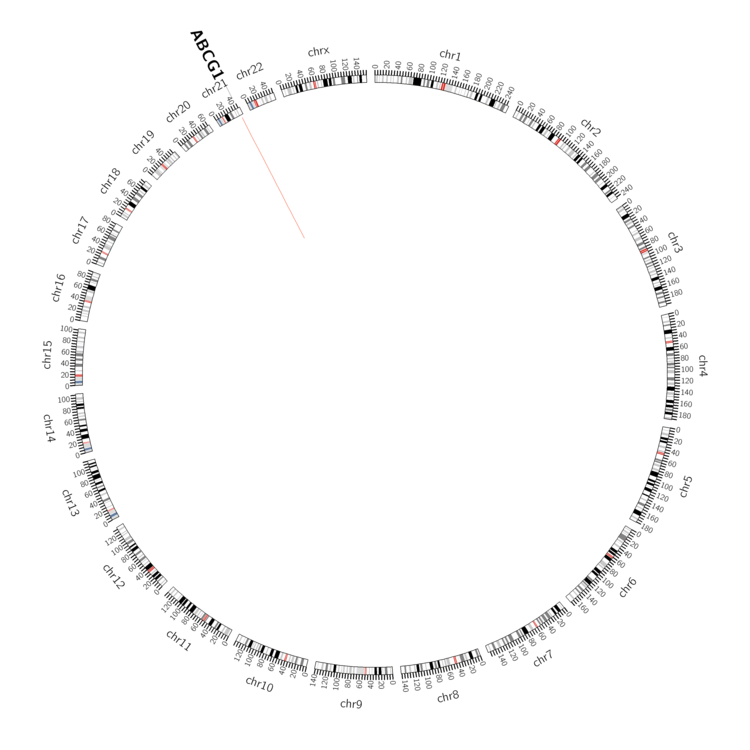
| Cytomap | UCSC genome browser: 21q22.3 | |
| Genomic location | chr21 :43636186-43717354 | |
| Type of gene | protein-coding | |
| RefGenes | NM_004915.3, NM_016818.2,NM_207174.1,NM_207627.1,NM_207628.1, NM_207629.1,NM_207630.1, | |
| Ensembl id | ENSG00000160179 | |
| Description | ABC transporter 8ATP-binding cassette sub-family G member 1ATP-binding cassette transporter 8ATP-binding cassette transporter member 1 of subfamily Ghomolog of Drosophila whitewhite protein homolog (ATP-binding cassette transporter 8) | |
| Modification date | 20141207 | |
| dbXrefs | MIM : 603076 | |
| HGNC : HGNC | ||
| Ensembl : ENSG00000160179 | ||
| HPRD : 04355 | ||
| Vega : OTTHUMG00000086791 | ||
| Protein | UniProt: go to UniProt's Cross Reference DB Table | |
| Expression | CleanEX: HS_ABCG1 | |
| BioGPS: 9619 | ||
| Gene Expression Atlas: ENSG00000160179 | ||
| The Human Protein Atlas: ENSG00000160179 | ||
| Pathway | NCI Pathway Interaction Database: ABCG1 | |
| KEGG: ABCG1 | ||
| REACTOME: ABCG1 | ||
| ConsensusPathDB | ||
| Pathway Commons: ABCG1 | ||
| Metabolism | MetaCyc: ABCG1 | |
| HUMANCyc: ABCG1 | ||
| Regulation | Ensembl's Regulation: ENSG00000160179 | |
| miRBase: chr21 :43,636,186-43,717,354 | ||
| TargetScan: NM_004915 | ||
| cisRED: ENSG00000160179 | ||
| Context | iHOP: ABCG1 | |
| cancer metabolism search in PubMed: ABCG1 | ||
| UCL Cancer Institute: ABCG1 | ||
| Assigned class in ccmGDB | C | |
| Top |
| Phenotypic Information for ABCG1(metabolism pathway, cancer, disease, phenome) |
| Cancer | CGAP: ABCG1 |
| Familial Cancer Database: ABCG1 | |
| * This gene is included in those cancer gene databases. |
|
|
|
|
|
| . | |||||||||||||||||||||||||||||||||||||||||||||||||||||||||||||||||||||||||||||||||||||||||||||||||||||||||||||||||||||||||||||||||||||||||||||||||||||||||||||||||||||||||||||||||||||||||||||||||||||||||||||||||||||||||||||||||||||||||||||||||||||||||||||||||||||||||||||||||||||||||||||||||||||||||||||||||||||||||||||||||||||||||||||
Oncogene 1 | Significant driver gene in | ||||||||||||||||||||||||||||||||||||||||||||||||||||||||||||||||||||||||||||||||||||||||||||||||||||||||||||||||||||||||||||||||||||||||||||||||||||||||||||||||||||||||||||||||||||||||||||||||||||||||||||||||||||||||||||||||||||||||||||||||||||||||||||||||||||||||||||||||||||||||||||||||||||||||||||||||||||||||||||||||||||||||||||||||||
| cf) number; DB name 1 Oncogene; http://nar.oxfordjournals.org/content/35/suppl_1/D721.long, 2 Tumor Suppressor gene; https://bioinfo.uth.edu/TSGene/, 3 Cancer Gene Census; http://www.nature.com/nrc/journal/v4/n3/abs/nrc1299.html, 4 CancerGenes; http://nar.oxfordjournals.org/content/35/suppl_1/D721.long, 5 Network of Cancer Gene; http://ncg.kcl.ac.uk/index.php, 1Therapeutic Vulnerabilities in Cancer; http://cbio.mskcc.org/cancergenomics/statius/ |
| REACTOME_METABOLISM_OF_LIPIDS_AND_LIPOPROTEINS REACTOME_LIPOPROTEIN_METABOLISM | |
| OMIM | |
| Orphanet | |
| Disease | KEGG Disease: ABCG1 |
| MedGen: ABCG1 (Human Medical Genetics with Condition) | |
| ClinVar: ABCG1 | |
| Phenotype | MGI: ABCG1 (International Mouse Phenotyping Consortium) |
| PhenomicDB: ABCG1 | |
| Mutations for ABCG1 |
| * Under tables are showing count per each tissue to give us broad intuition about tissue specific mutation patterns.You can go to the detailed page for each mutation database's web site. |
| - Statistics for Tissue and Mutation type | Top |
 |
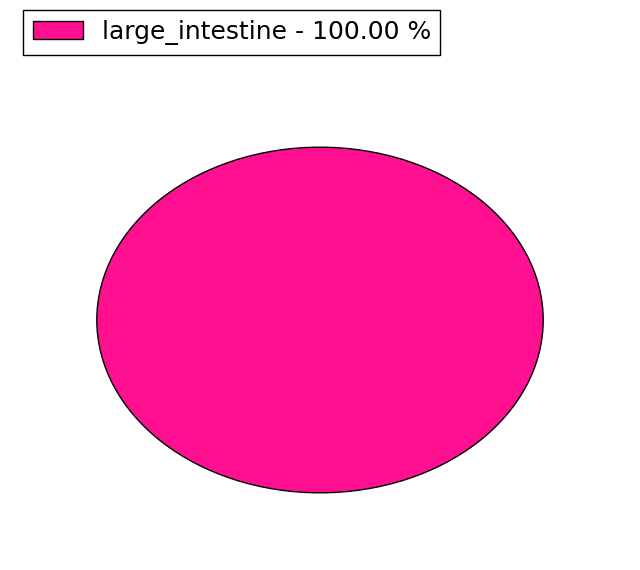
| - For Inter-chromosomal Variations |
| There's no inter-chromosomal structural variation. |
| - For Intra-chromosomal Variations |
| * Intra-chromosomal variantions includes 'intrachromosomal amplicon to amplicon', 'intrachromosomal amplicon to non-amplified dna', 'intrachromosomal deletion', 'intrachromosomal fold-back inversion', 'intrachromosomal inversion', 'intrachromosomal tandem duplication', 'Intrachromosomal unknown type', 'intrachromosomal with inverted orientation', 'intrachromosomal with non-inverted orientation'. |
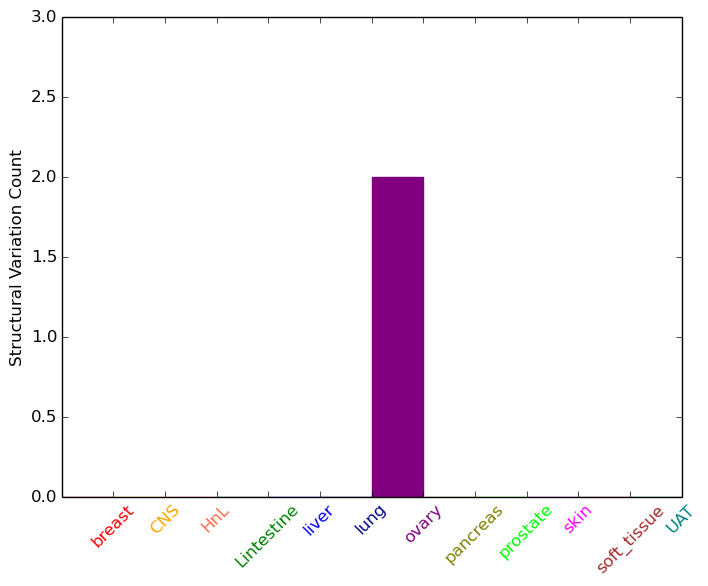 |
| Sample | Symbol_a | Chr_a | Start_a | End_a | Symbol_b | Chr_b | Start_b | End_b |
| ovary | ABCG1 | chr21 | 43696934 | 43696954 | ABCG1 | chr21 | 43692267 | 43692287 |
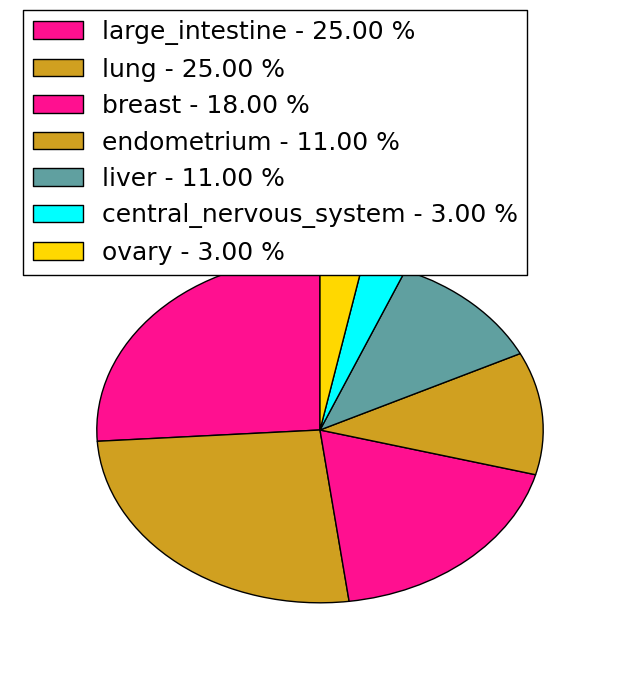
| cf) Tissue number; Tissue name (1;Breast, 2;Central_nervous_system, 3;Haematopoietic_and_lymphoid_tissue, 4;Large_intestine, 5;Liver, 6;Lung, 7;Ovary, 8;Pancreas, 9;Prostate, 10;Skin, 11;Soft_tissue, 12;Upper_aerodigestive_tract) |
| * From mRNA Sanger sequences, Chitars2.0 arranged chimeric transcripts. This table shows ABCG1 related fusion information. |
| ID | Head Gene | Tail Gene | Accession | Gene_a | qStart_a | qEnd_a | Chromosome_a | tStart_a | tEnd_a | Gene_a | qStart_a | qEnd_a | Chromosome_a | tStart_a | tEnd_a |
| U34919 | ACSBG1 | 8 | 354 | 15 | 78521562 | 78521908 | ABCG1 | 354 | 2745 | 21 | 43645835 | 43716951 | |
| Top |
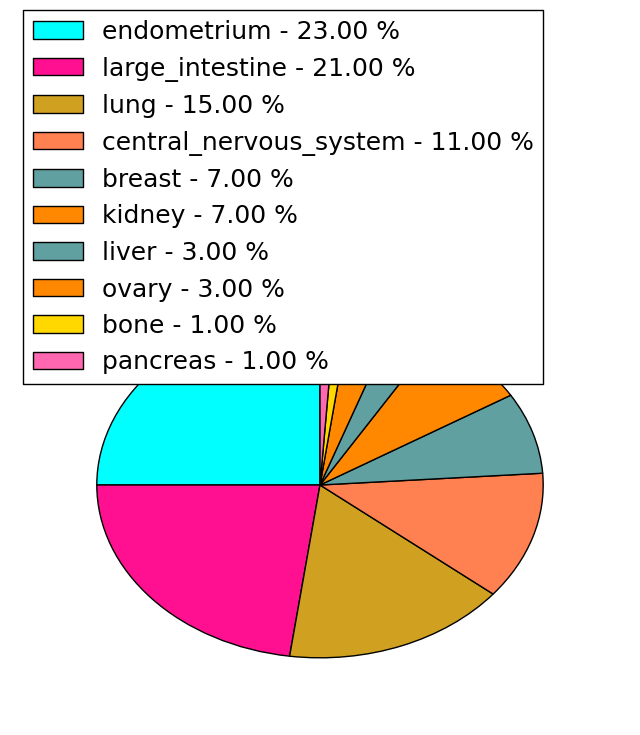
| Mutation type/ Tissue ID | brca | cns | cerv | endome | haematopo | kidn | Lintest | liver | lung | ns | ovary | pancre | prost | skin | stoma | thyro | urina | |||
| Total # sample | 1 | 1 | 1 | 2 | 1 | |||||||||||||||
| GAIN (# sample) | 1 | |||||||||||||||||||
| LOSS (# sample) | 1 | 1 | 2 | 1 |
| cf) Tissue ID; Tissue type (1; Breast, 2; Central_nervous_system, 3; Cervix, 4; Endometrium, 5; Haematopoietic_and_lymphoid_tissue, 6; Kidney, 7; Large_intestine, 8; Liver, 9; Lung, 10; NS, 11; Ovary, 12; Pancreas, 13; Prostate, 14; Skin, 15; Stomach, 16; Thyroid, 17; Urinary_tract) |
| Top |
|
 |
| Top |
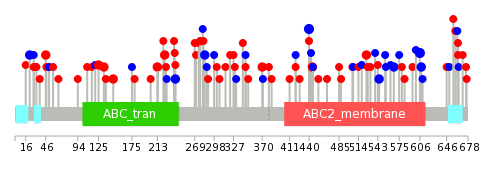
| Stat. for Non-Synonymous SNVs (# total SNVs=51) | (# total SNVs=27) |
 |  |
(# total SNVs=1) | (# total SNVs=0) |
 |
| Top |
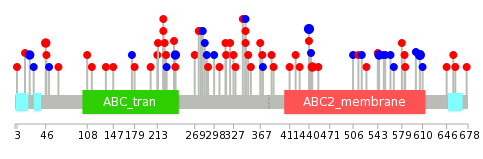
| * When you move the cursor on each content, you can see more deailed mutation information on the Tooltip. Those are primary_site,primary_histology,mutation(aa),pubmedID. |
| GRCh37 position | Mutation(aa) | Unique sampleID count |
| chr21:43716283-43716283 | p.F606F | 3 |
| chr21:43693447-43693447 | p.G147S | 2 |
| chr21:43704787-43704787 | p.F284F | 2 |
| chr21:43711712-43711712 | p.S545S | 2 |
| chr21:43708058-43708058 | p.R345R | 2 |
| chr21:43716289-43716289 | p.G608G | 2 |
| chr21:43645804-43645804 | p.E22E | 2 |
| chr21:43702515-43702515 | p.F240F | 2 |
| chr21:43714663-43714663 | p.F567F | 2 |
| chr21:43702433-43702433 | p.R213Q | 2 |
| Top |
|
 |
| Point Mutation/ Tissue ID | 1 | 2 | 3 | 4 | 5 | 6 | 7 | 8 | 9 | 10 | 11 | 12 | 13 | 14 | 15 | 16 | 17 | 18 | 19 | 20 |
| # sample | 2 | 3 | 12 | 3 | 3 | 3 | 7 | 1 | 3 | 1 | 21 | 8 | 12 | |||||||
| # mutation | 2 | 3 | 12 | 3 | 3 | 3 | 7 | 1 | 3 | 1 | 21 | 9 | 15 | |||||||
| nonsynonymous SNV | 2 | 2 | 7 | 2 | 3 | 3 | 3 | 1 | 2 | 1 | 10 | 8 | 12 | |||||||
| synonymous SNV | 1 | 5 | 1 | 4 | 1 | 11 | 1 | 3 |
| cf) Tissue ID; Tissue type (1; BLCA[Bladder Urothelial Carcinoma], 2; BRCA[Breast invasive carcinoma], 3; CESC[Cervical squamous cell carcinoma and endocervical adenocarcinoma], 4; COAD[Colon adenocarcinoma], 5; GBM[Glioblastoma multiforme], 6; Glioma Low Grade, 7; HNSC[Head and Neck squamous cell carcinoma], 8; KICH[Kidney Chromophobe], 9; KIRC[Kidney renal clear cell carcinoma], 10; KIRP[Kidney renal papillary cell carcinoma], 11; LAML[Acute Myeloid Leukemia], 12; LUAD[Lung adenocarcinoma], 13; LUSC[Lung squamous cell carcinoma], 14; OV[Ovarian serous cystadenocarcinoma ], 15; PAAD[Pancreatic adenocarcinoma], 16; PRAD[Prostate adenocarcinoma], 17; SKCM[Skin Cutaneous Melanoma], 18:STAD[Stomach adenocarcinoma], 19:THCA[Thyroid carcinoma], 20:UCEC[Uterine Corpus Endometrial Carcinoma]) |
| Top |
| * We represented just top 10 SNVs. When you move the cursor on each content, you can see more deailed mutation information on the Tooltip. Those are primary_site, primary_histology, mutation(aa), pubmedID. |
| Genomic Position | Mutation(aa) | Unique sampleID count |
| chr21:43716283 | p.F606F,ABCG1 | 3 |
| chr21:43708058 | p.R345R,ABCG1 | 2 |
| chr21:43711712 | p.G445R,ABCG1 | 2 |
| chr21:43710219 | p.S545S,ABCG1 | 2 |
| chr21:43702515 | p.E22E,ABCG1 | 2 |
| chr21:43645804 | p.T46M,ABCG1 | 2 |
| chr21:43710232 | p.L440L,ABCG1 | 2 |
| chr21:43645875 | p.F240F,ABCG1 | 2 |
| chr21:43704778 | p.F108L,ABCG1 | 1 |
| chr21:43711634 | p.I269V,ABCG1 | 1 |
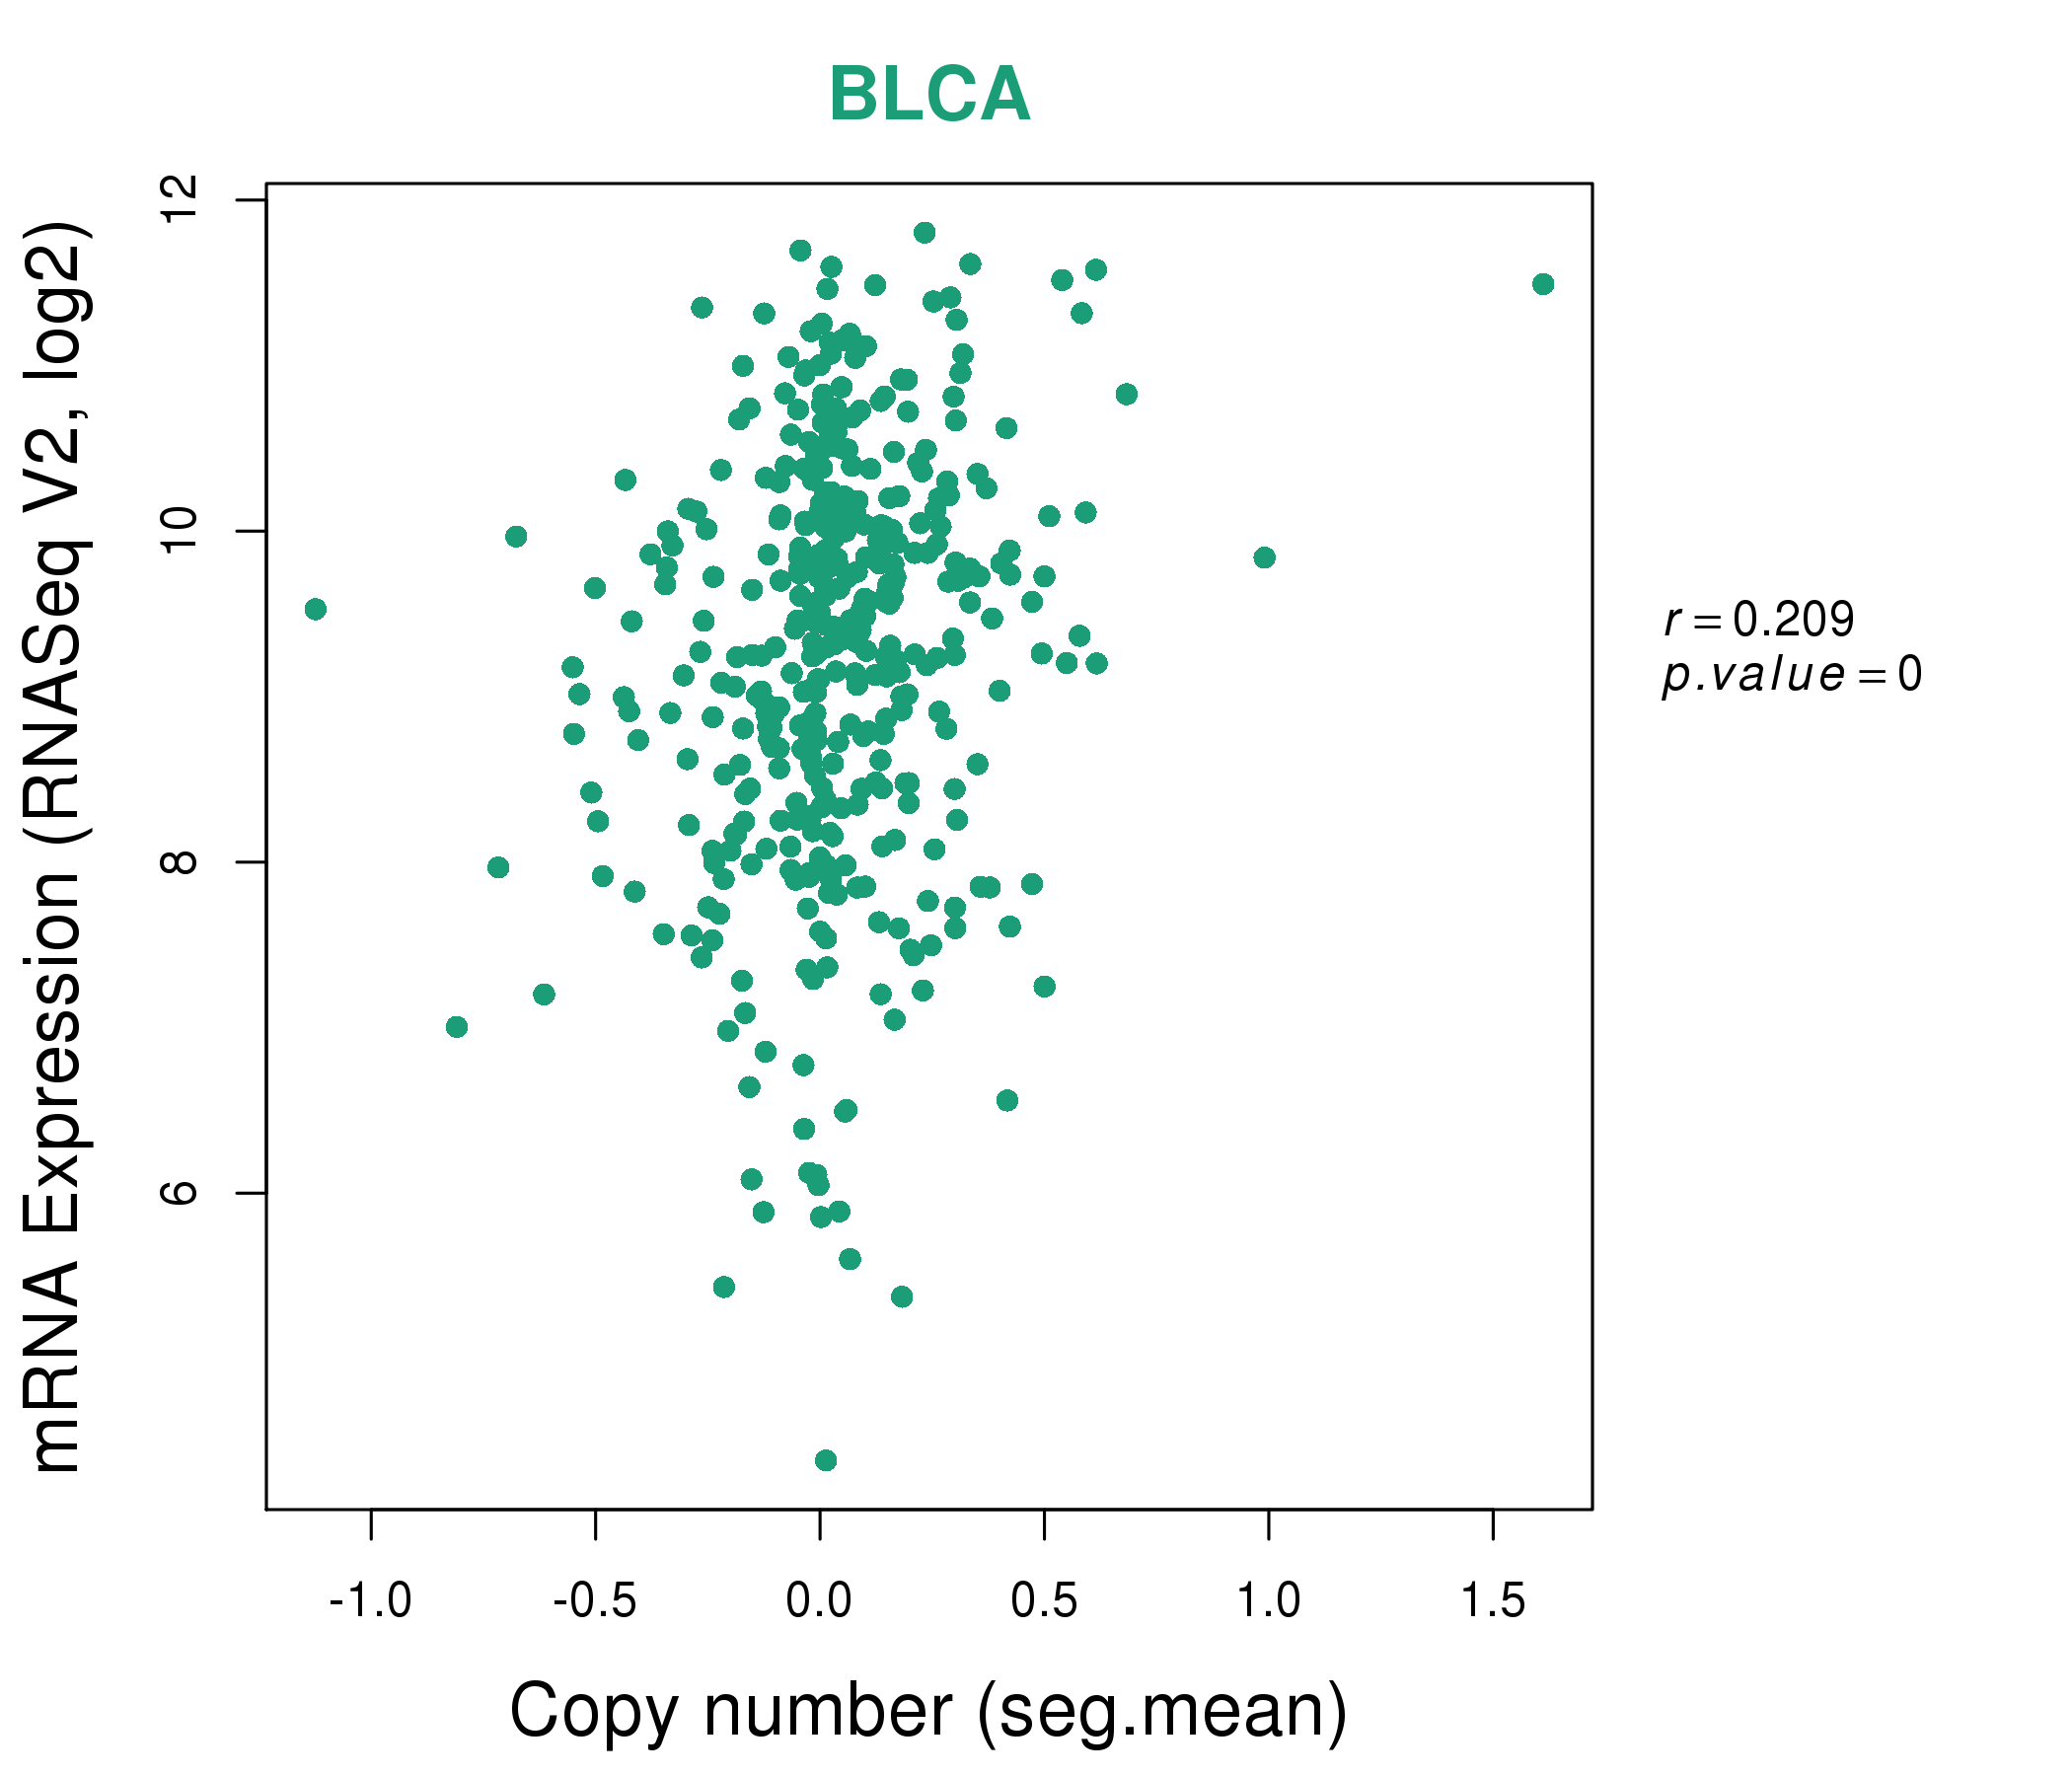
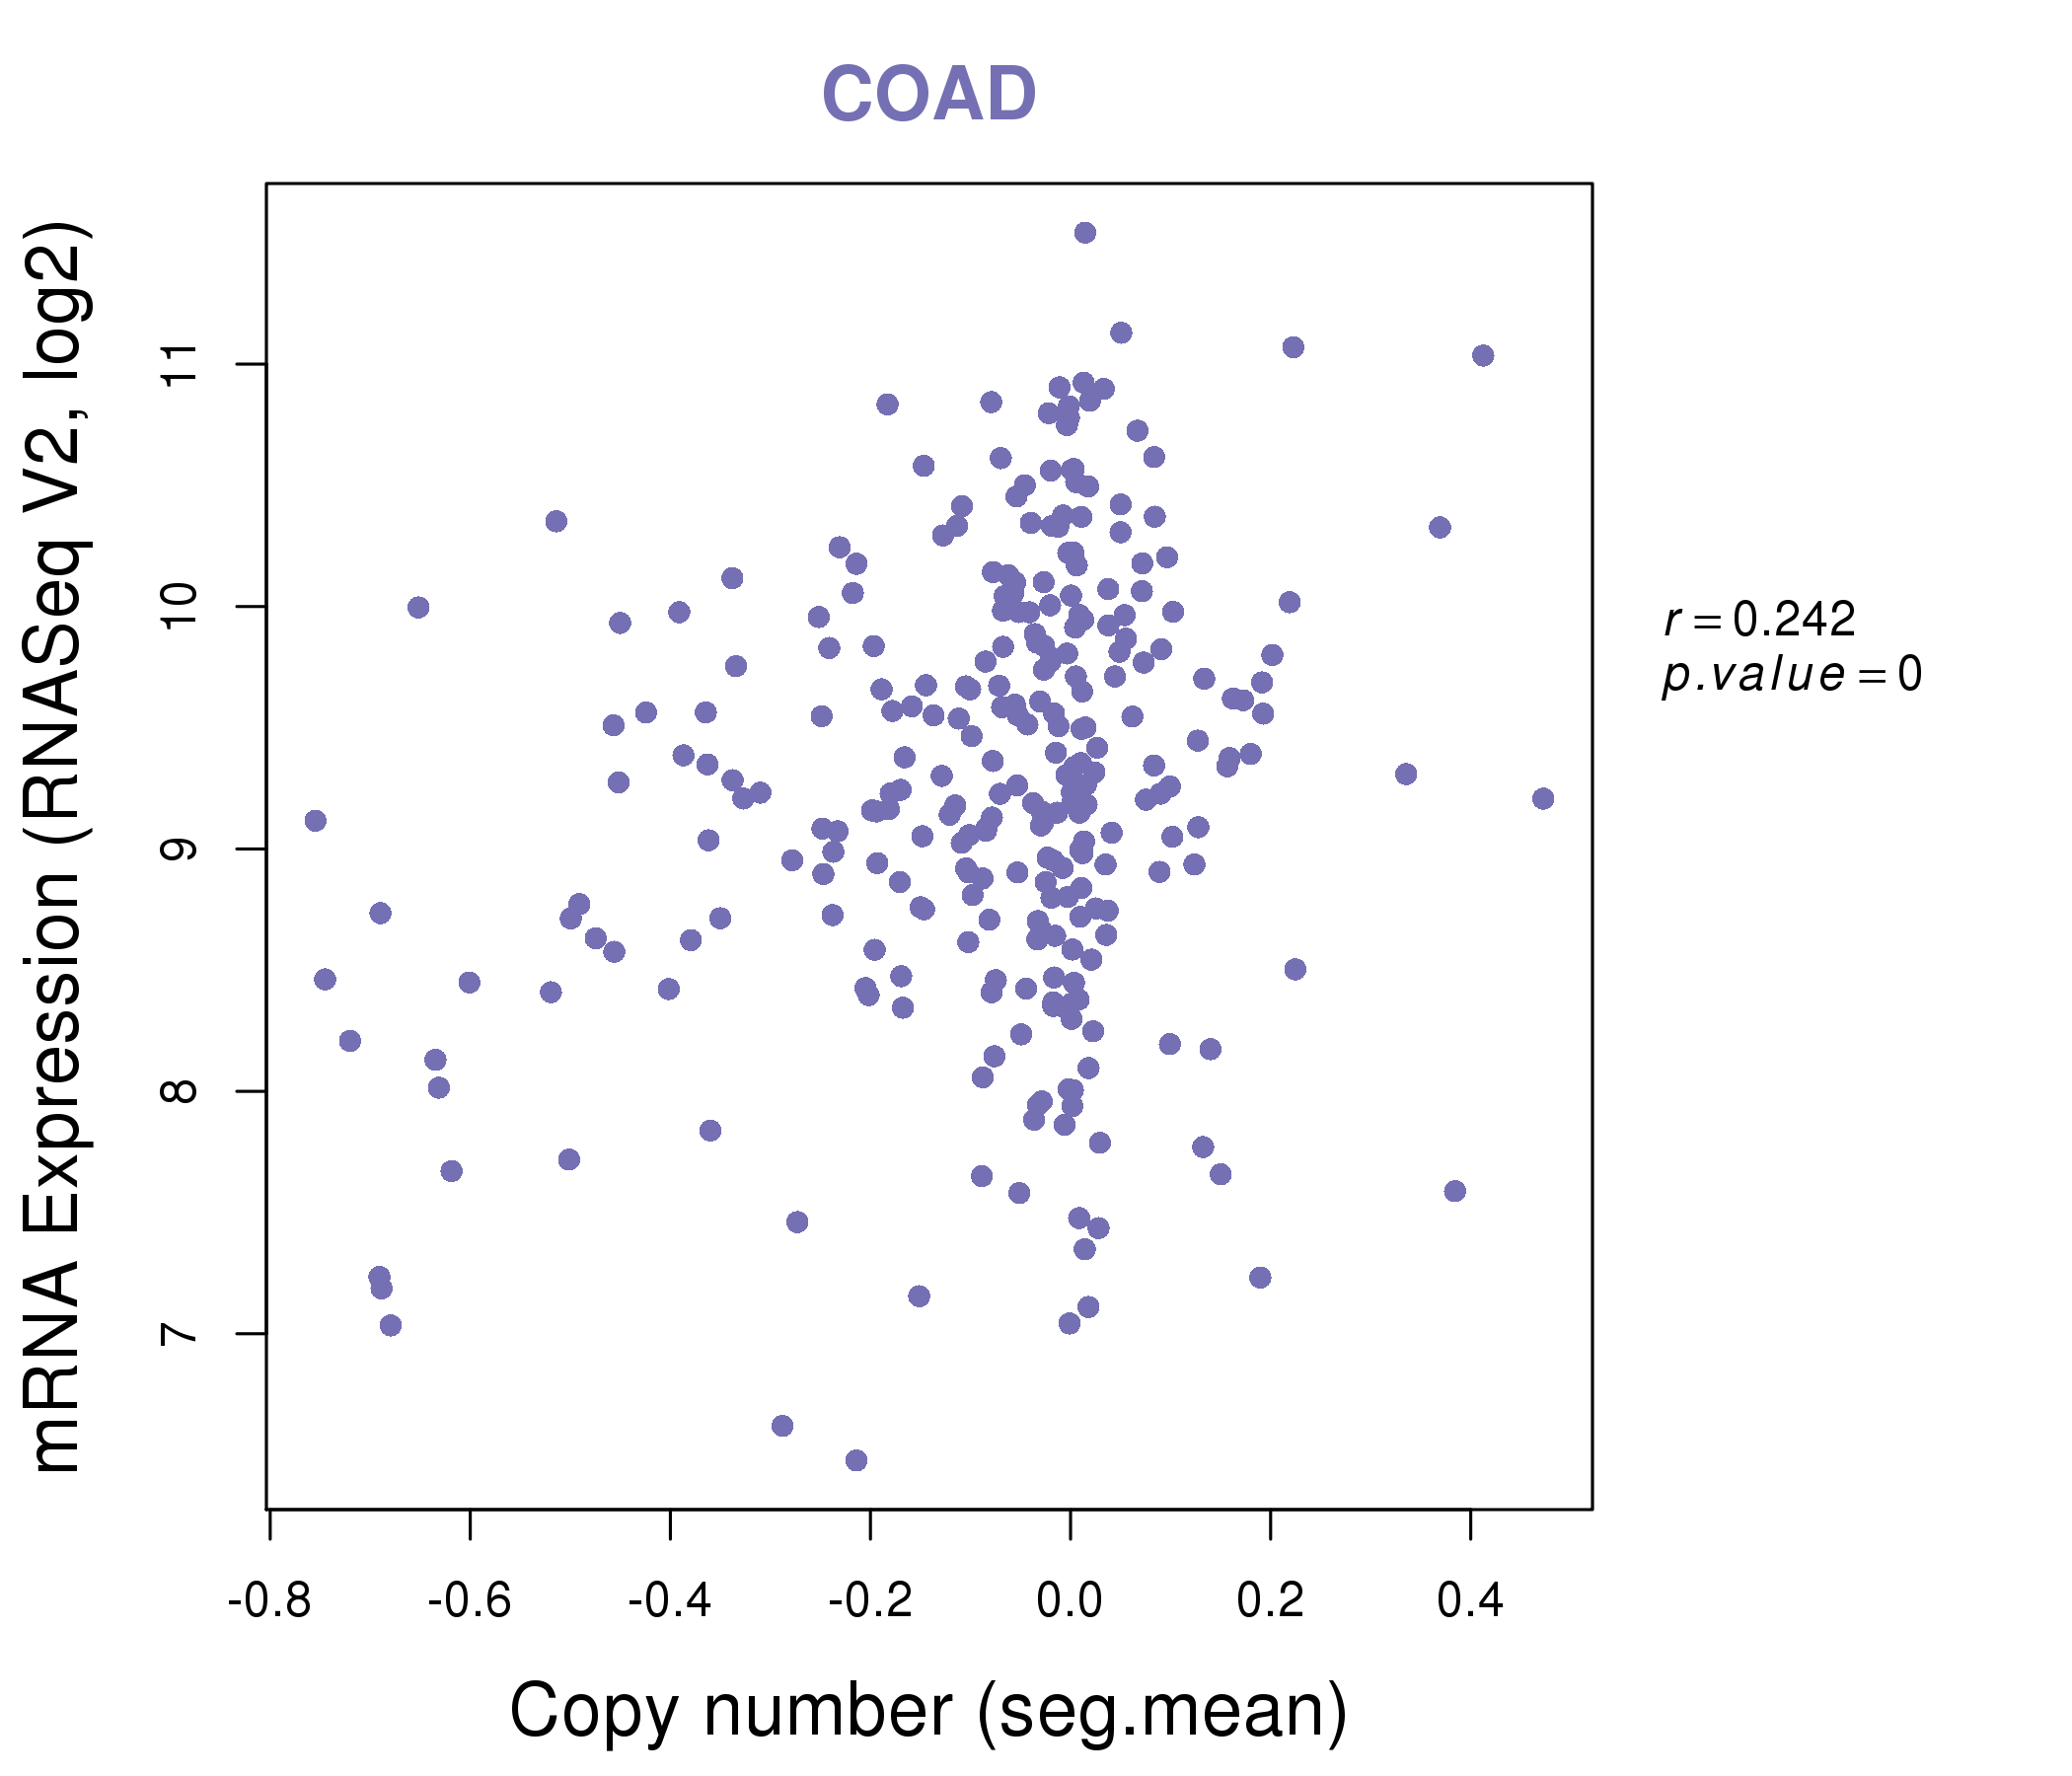
| * Copy number data were extracted from TCGA using R package TCGA-Assembler. The URLs of all public data files on TCGA DCC data server were gathered on Jan-05-2015. Function ProcessCNAData in TCGA-Assembler package was used to obtain gene-level copy number value which is calculated as the average copy number of the genomic region of a gene. |
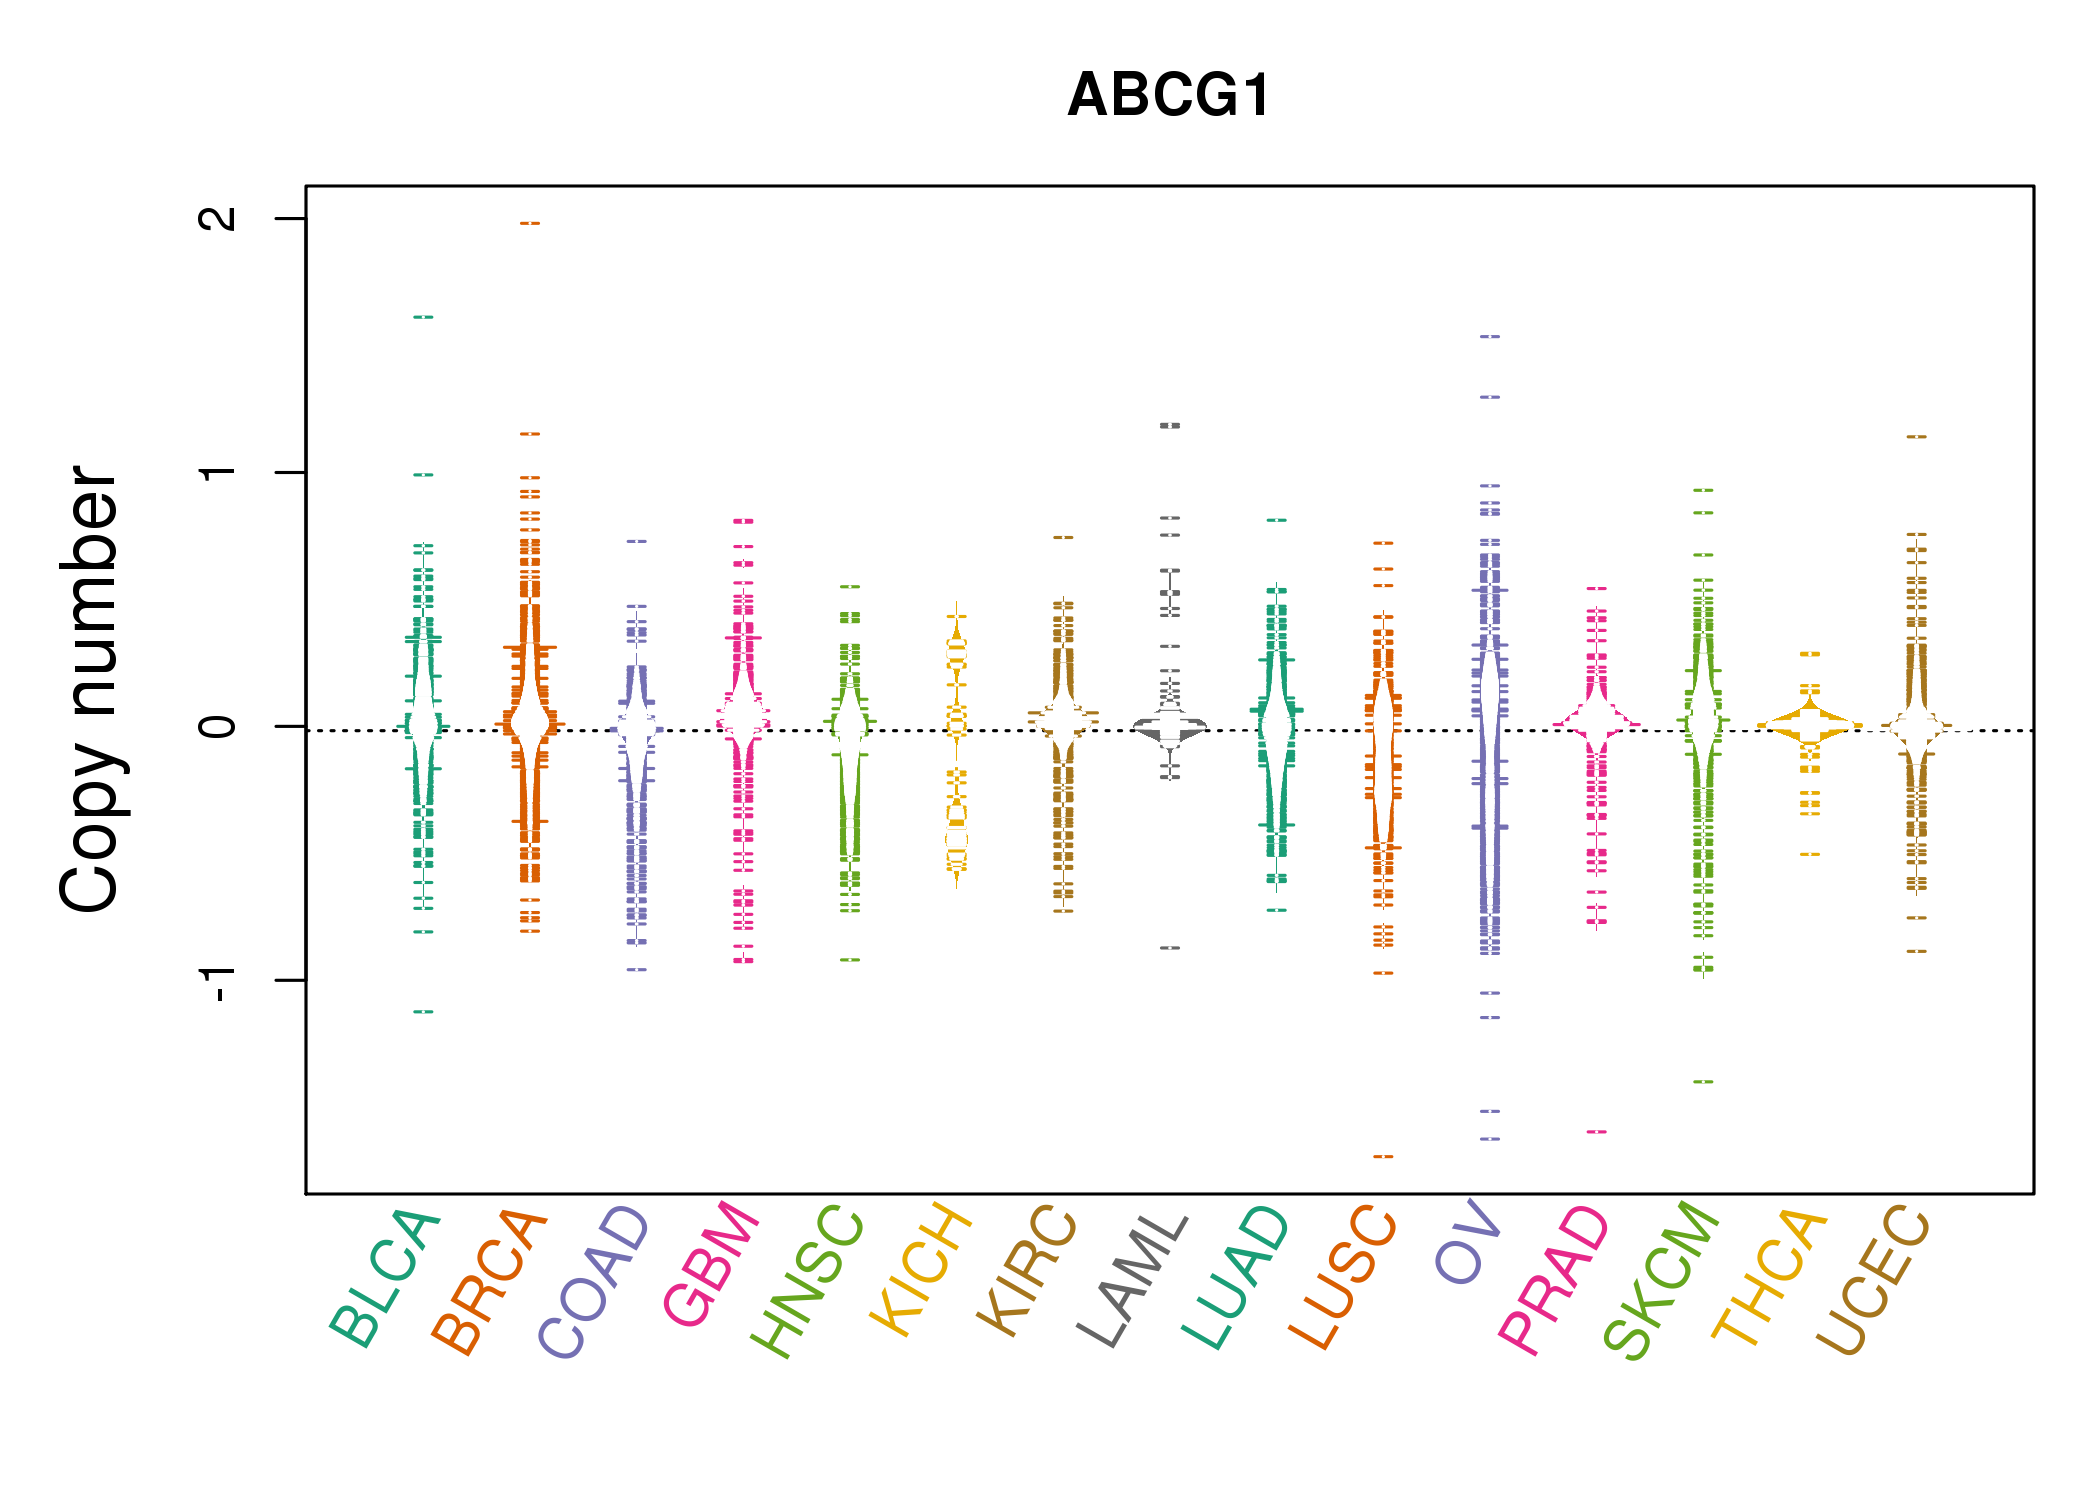 |
| cf) Tissue ID[Tissue type]: BLCA[Bladder Urothelial Carcinoma], BRCA[Breast invasive carcinoma], CESC[Cervical squamous cell carcinoma and endocervical adenocarcinoma], COAD[Colon adenocarcinoma], GBM[Glioblastoma multiforme], Glioma Low Grade, HNSC[Head and Neck squamous cell carcinoma], KICH[Kidney Chromophobe], KIRC[Kidney renal clear cell carcinoma], KIRP[Kidney renal papillary cell carcinoma], LAML[Acute Myeloid Leukemia], LUAD[Lung adenocarcinoma], LUSC[Lung squamous cell carcinoma], OV[Ovarian serous cystadenocarcinoma ], PAAD[Pancreatic adenocarcinoma], PRAD[Prostate adenocarcinoma], SKCM[Skin Cutaneous Melanoma], STAD[Stomach adenocarcinoma], THCA[Thyroid carcinoma], UCEC[Uterine Corpus Endometrial Carcinoma] |
| Top |
| Gene Expression for ABCG1 |
| * CCLE gene expression data were extracted from CCLE_Expression_Entrez_2012-10-18.res: Gene-centric RMA-normalized mRNA expression data. |
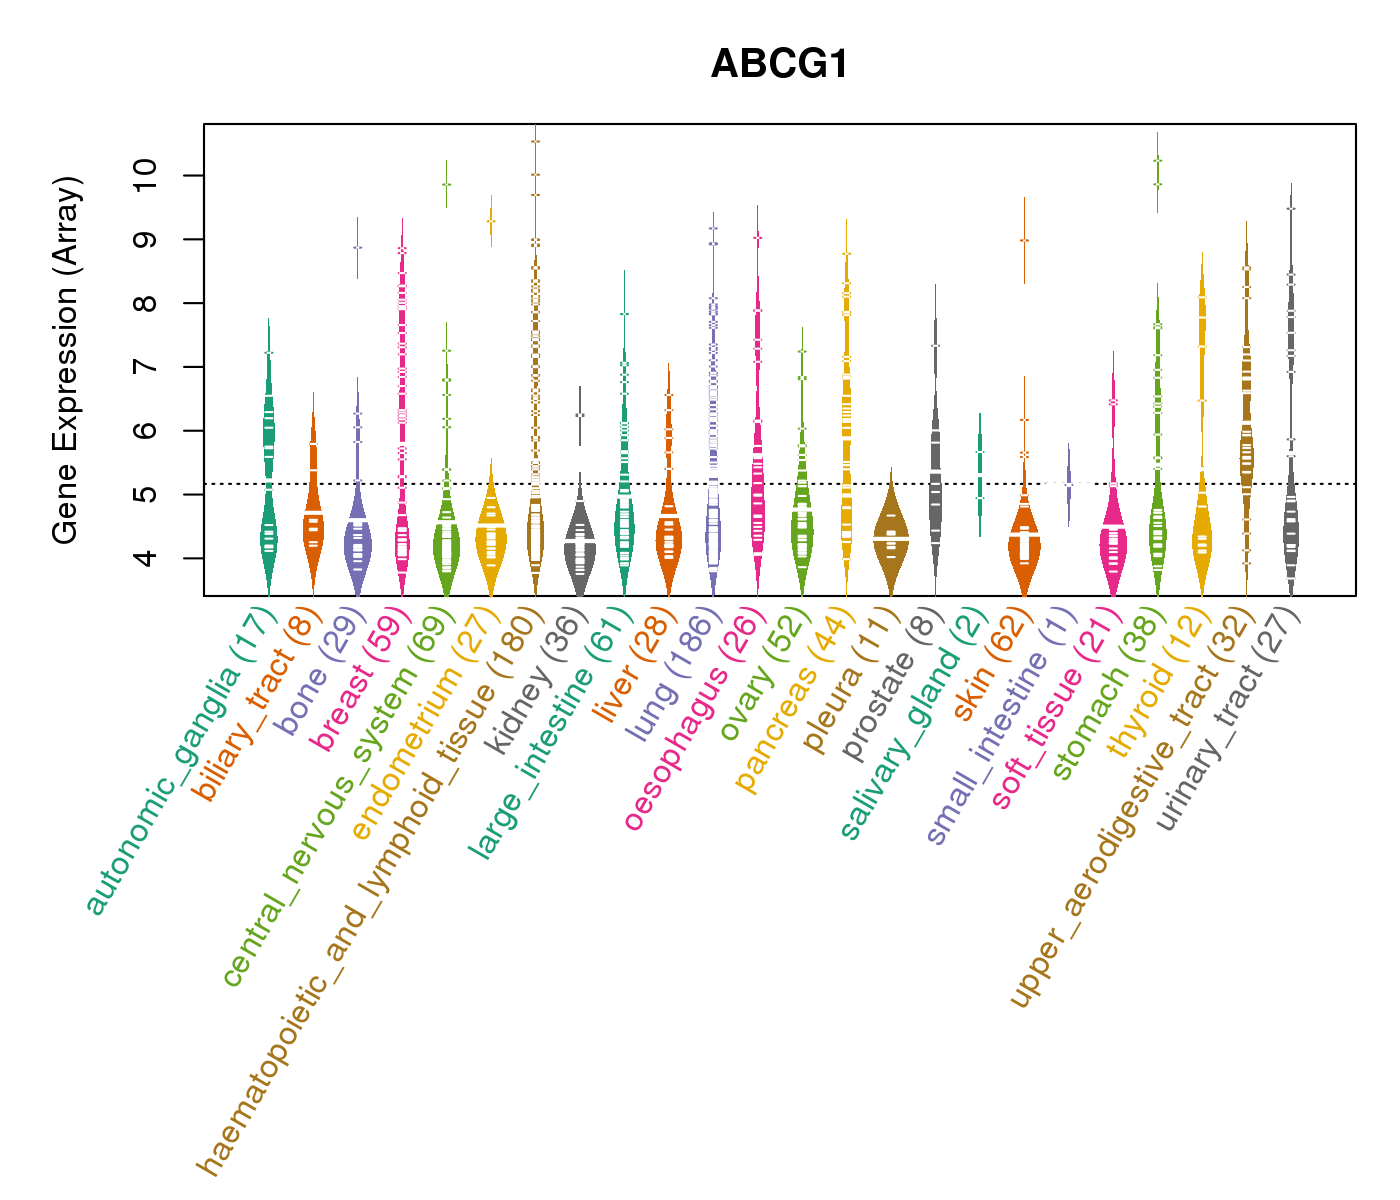 |
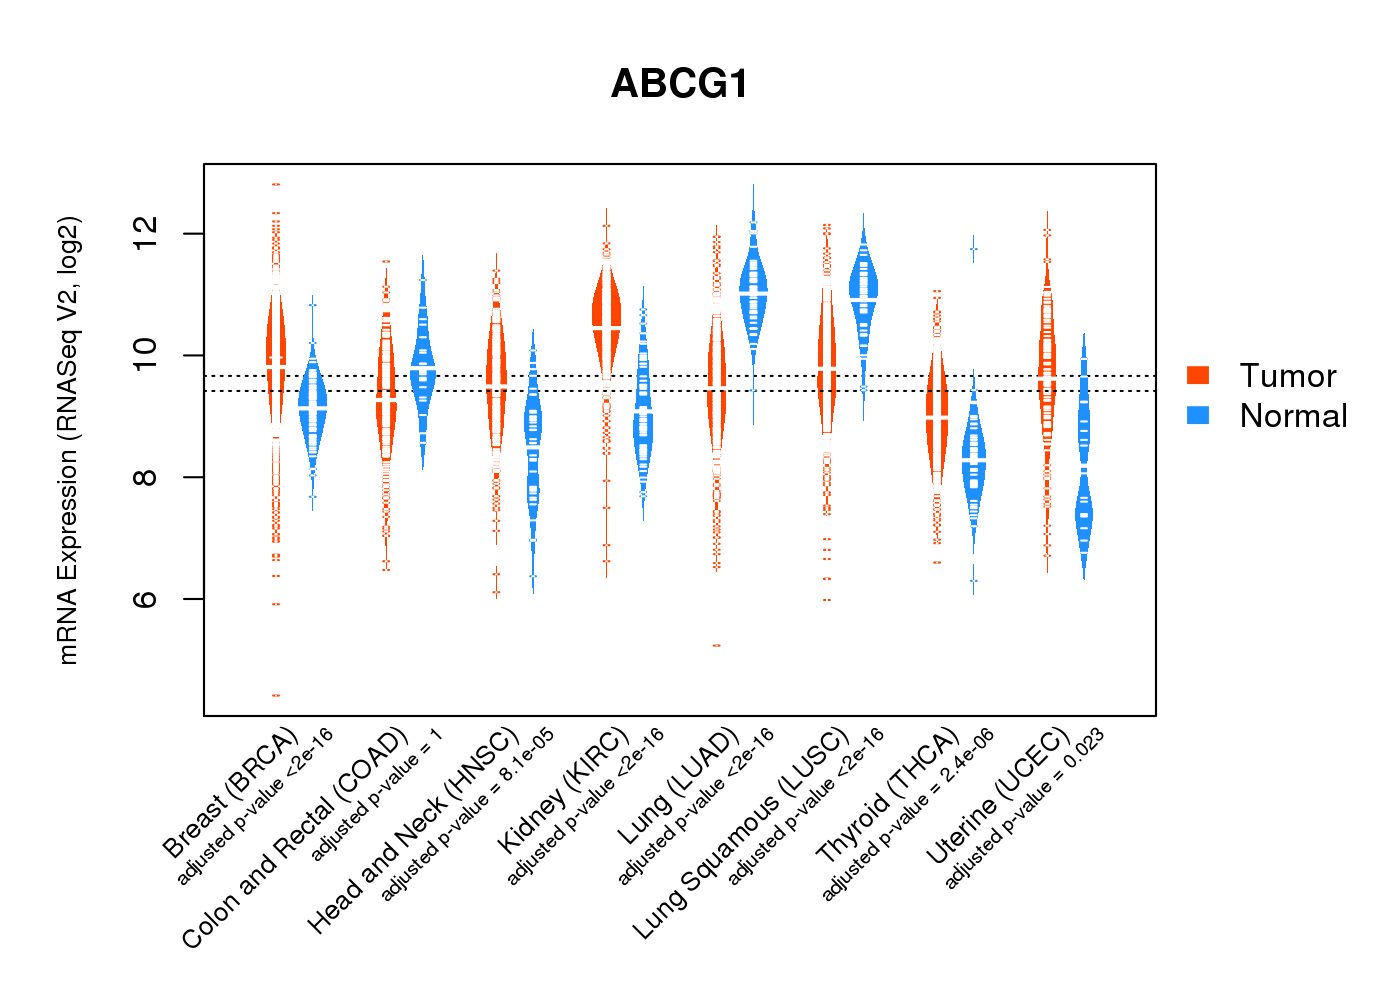
| * Normalized gene expression data of RNASeqV2 was extracted from TCGA using R package TCGA-Assembler. The URLs of all public data files on TCGA DCC data server were gathered at Jan-05-2015. Only eight cancer types have enough normal control samples for differential expression analysis. (t test, adjusted p<0.05 (using Benjamini-Hochberg FDR)) |
 |
| Top |
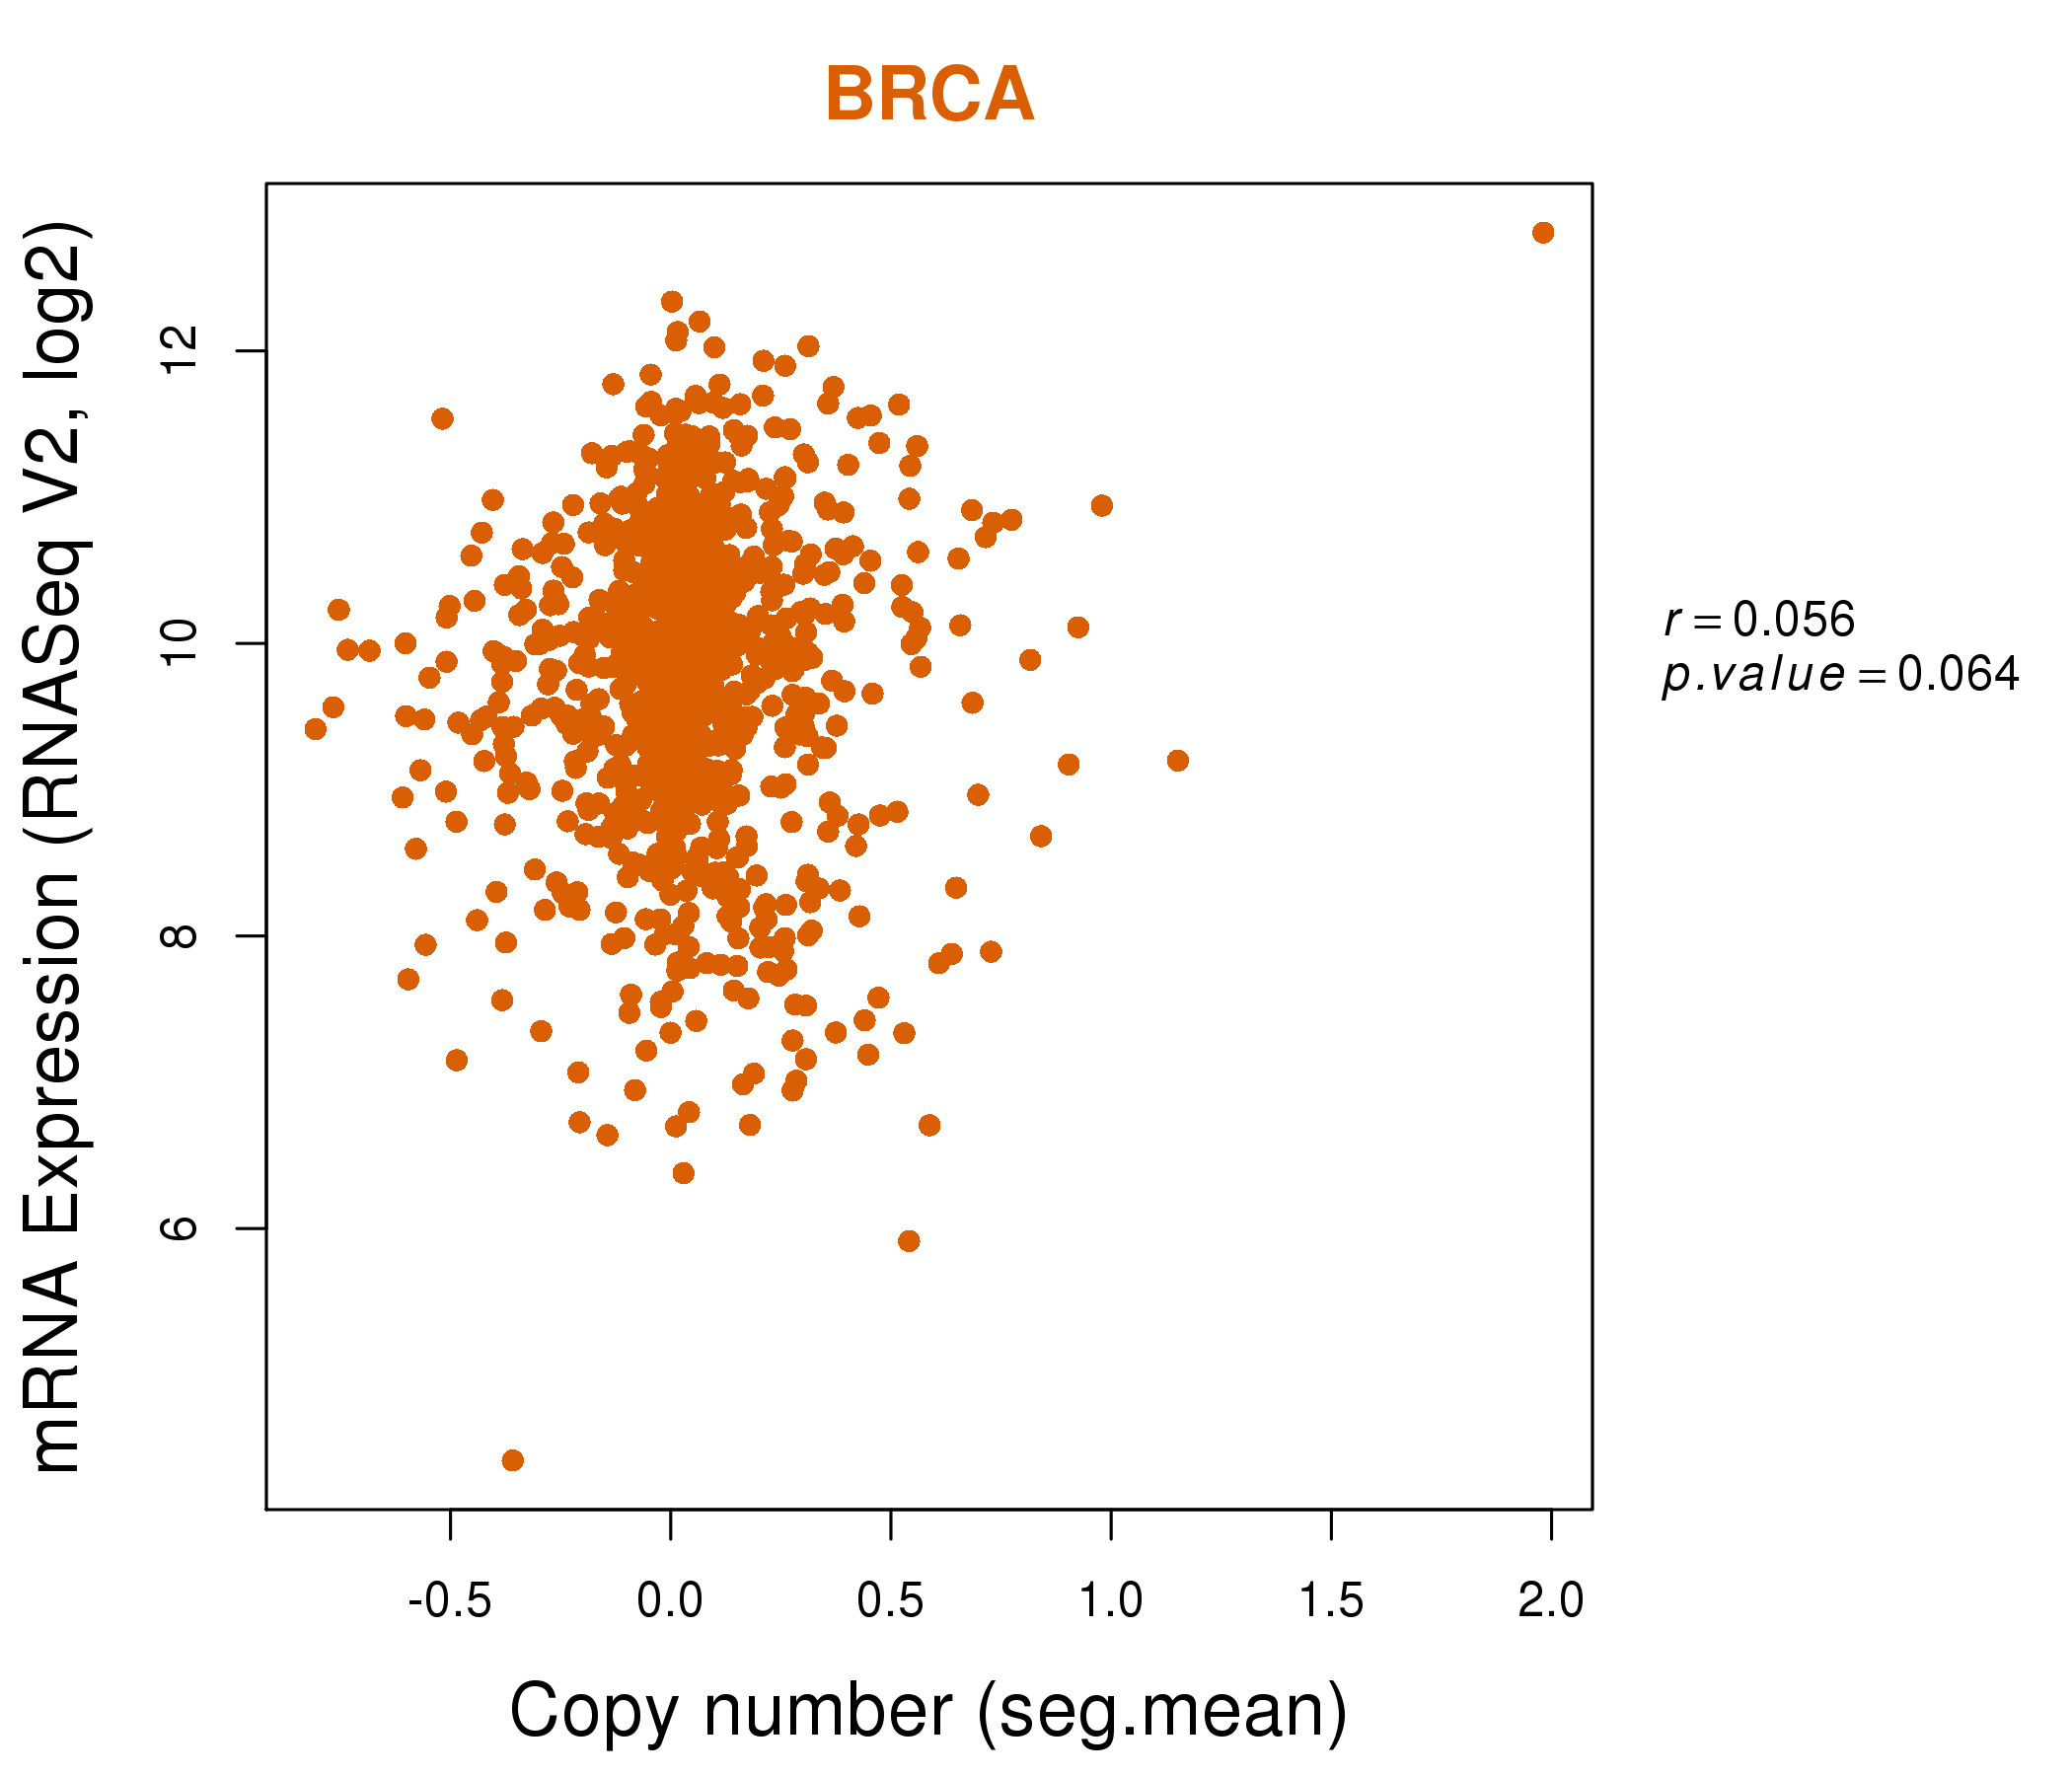
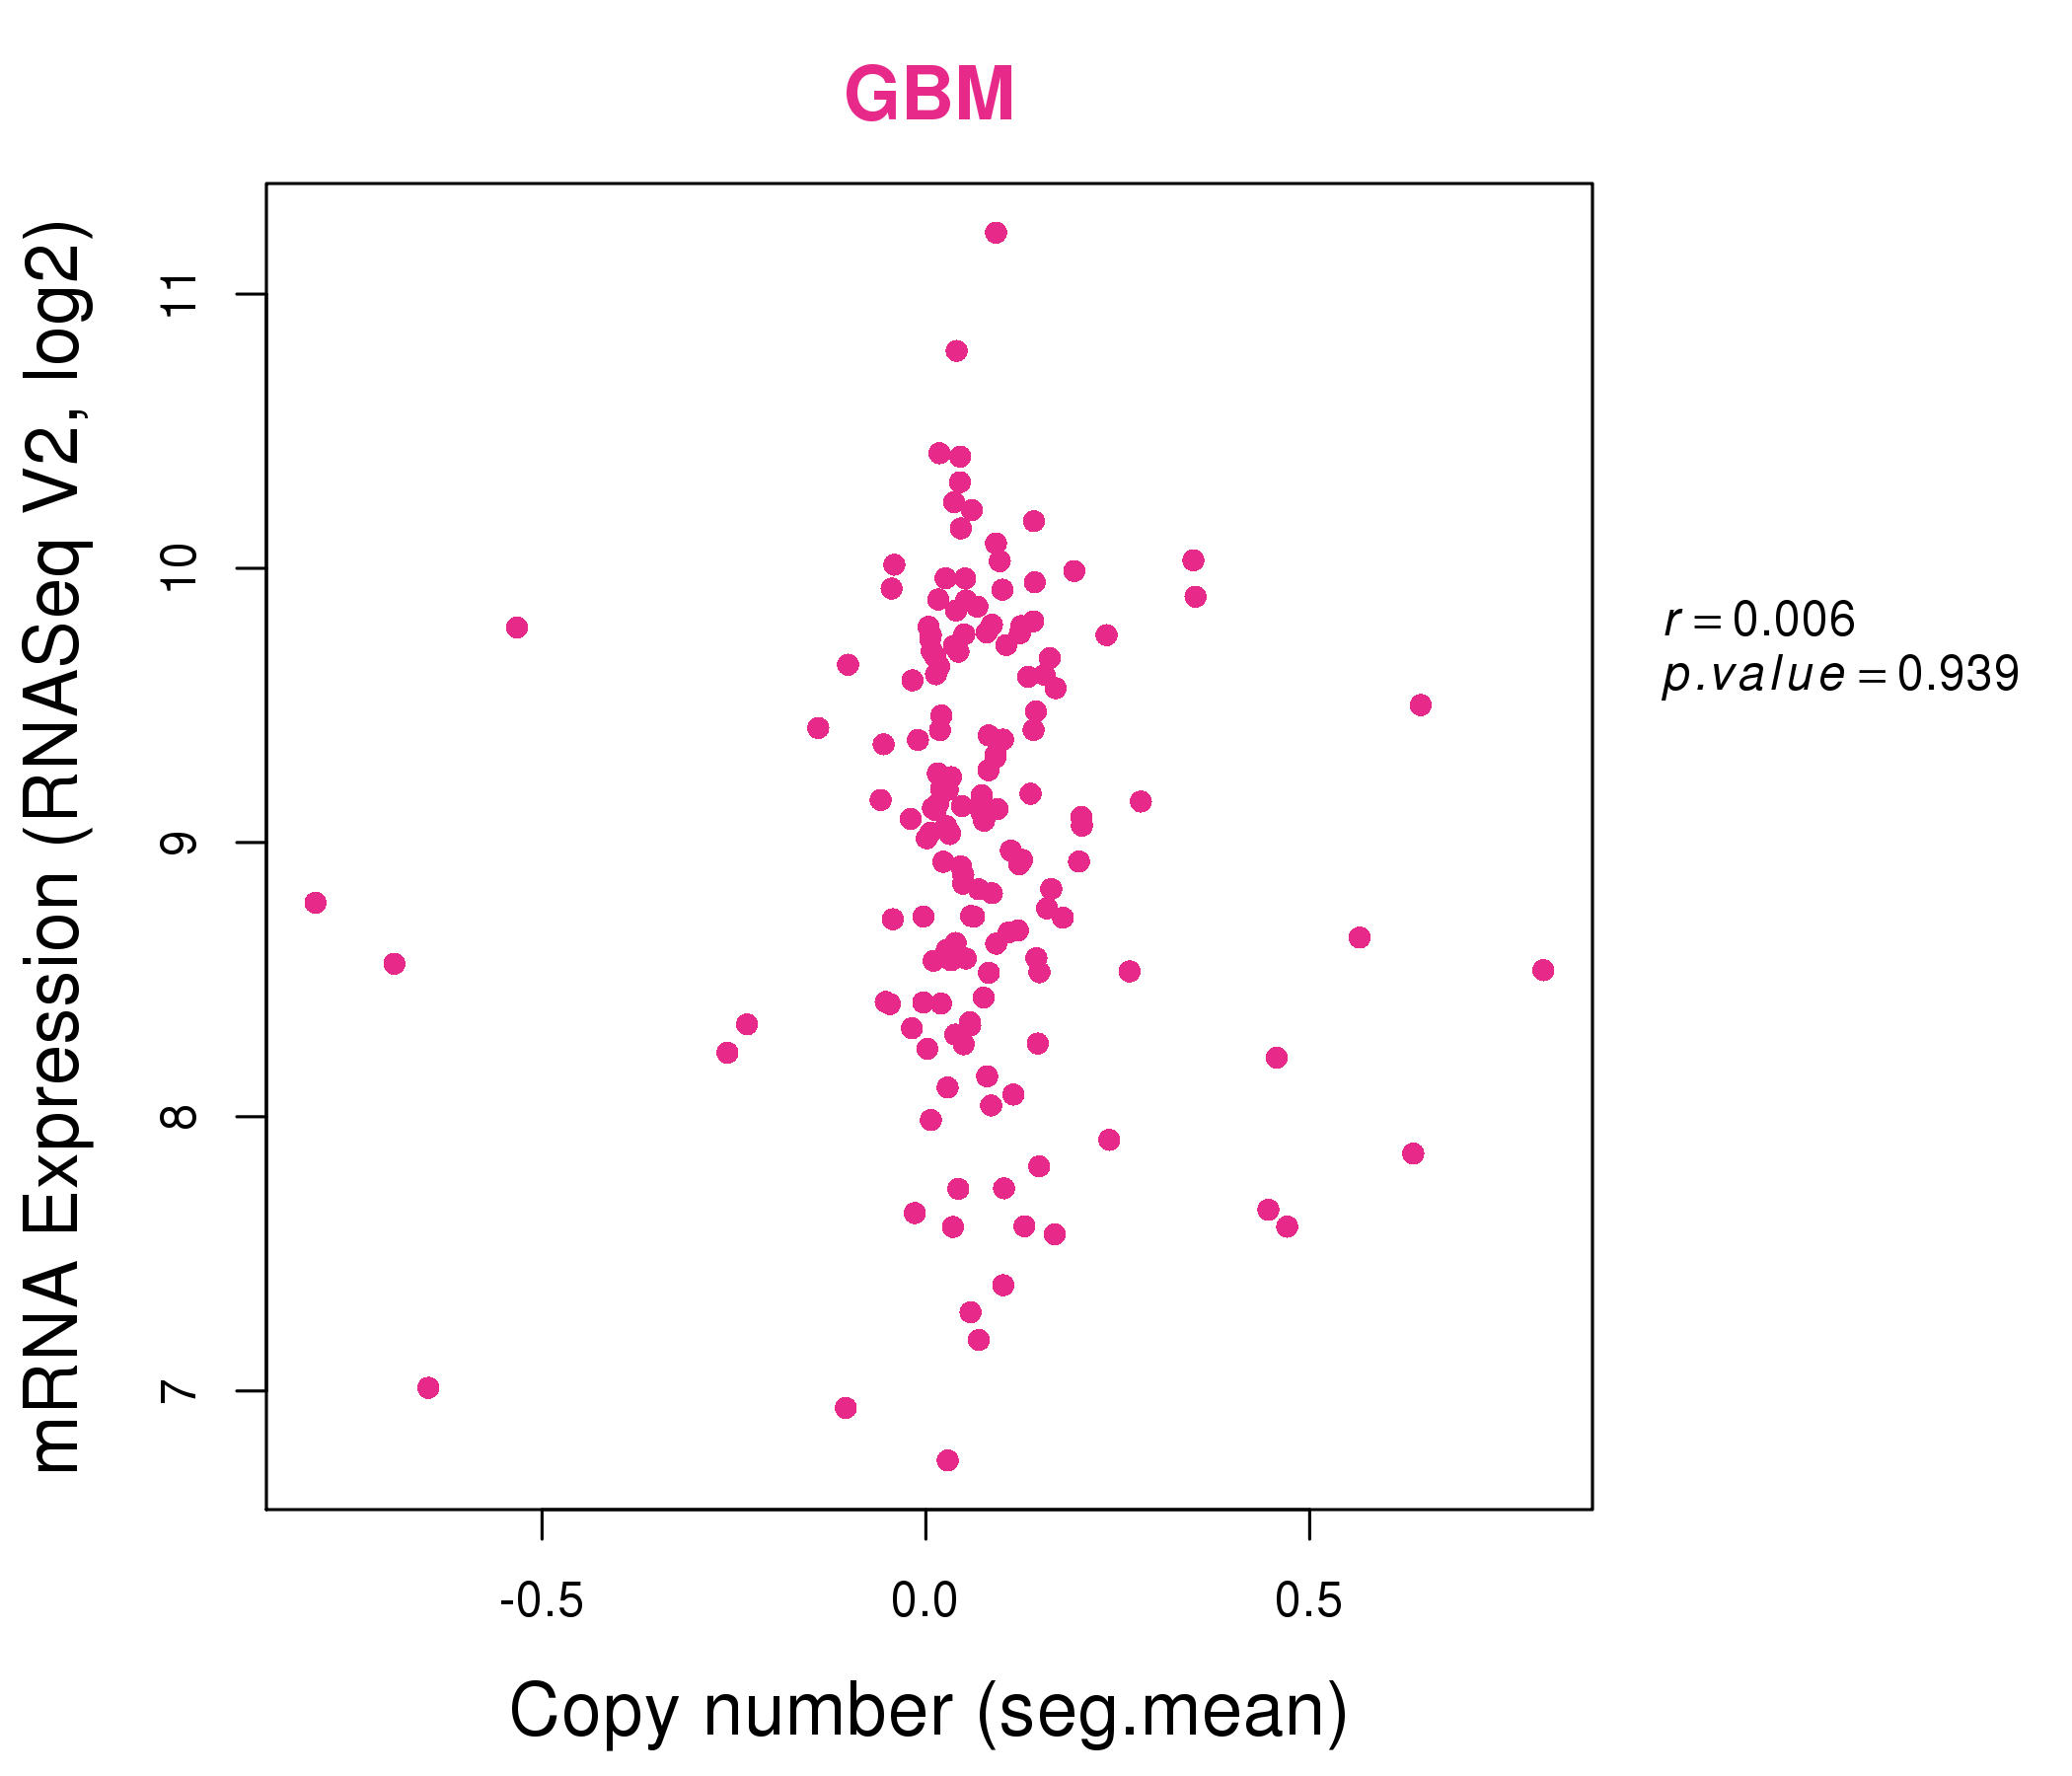
| * This plots show the correlation between CNV and gene expression. |
: Open all plots for all cancer types
 |
|
 |
|
| Top |
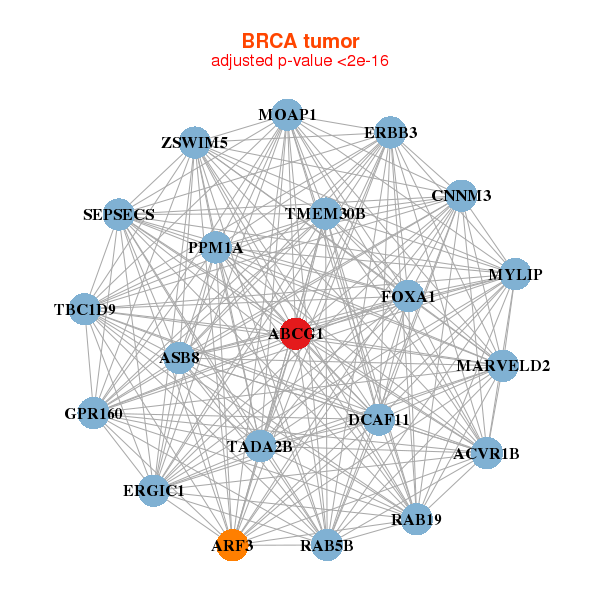
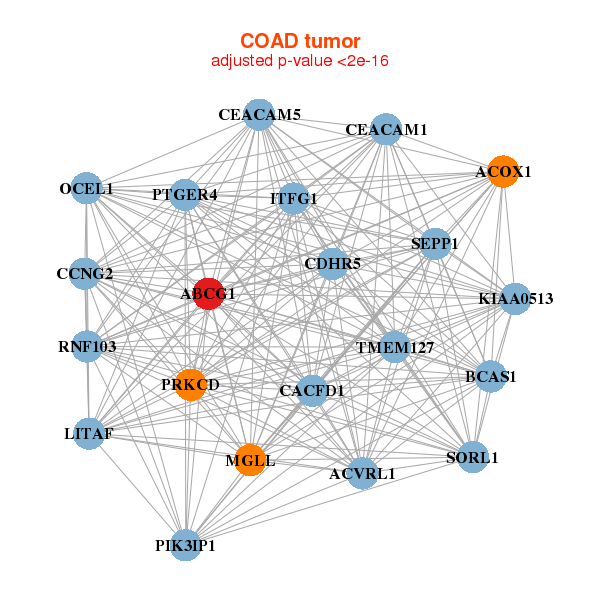
| Gene-Gene Network Information |
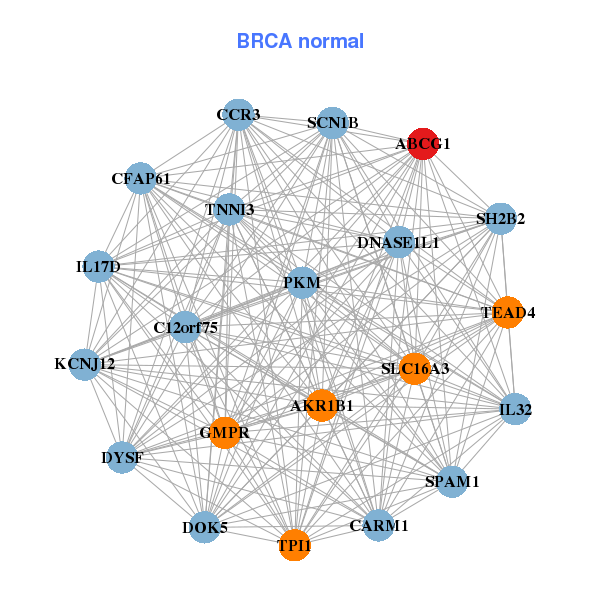
| * Co-Expression network figures were drawn using R package igraph. Only the top 20 genes with the highest correlations were shown. Red circle: input gene, orange circle: cell metabolism gene, sky circle: other gene |
: Open all plots for all cancer types
 |
| ||||
| ABCG1,ACVR1B,ARF3,ASB8,CNNM3,DCAF11,ERBB3, ERGIC1,FOXA1,GPR160,MARVELD2,MOAP1,MYLIP,PPM1A, RAB19,RAB5B,SEPSECS,TADA2B,TBC1D9,TMEM30B,ZSWIM5 | ABCG1,AKR1B1,C12orf75,CFAP61,CARM1,CCR3,DNASE1L1, DOK5,DYSF,GMPR,IL17D,IL32,KCNJ12,PKM, SCN1B,SH2B2,SLC16A3,SPAM1,TEAD4,TNNI3,TPI1 | ||||
 |
| ||||
| ABCG1,ACOX1,ACVRL1,BCAS1,CACFD1,CCNG2,CDHR5, CEACAM1,CEACAM5,ITFG1,KIAA0513,LITAF,MGLL,OCEL1, PIK3IP1,PRKCD,PTGER4,RNF103,SEPP1,SORL1,TMEM127 | ABCG1,ABHD12,AMFR,C1orf106,C1orf115,FAM102A,GDPD2, IL22RA1,KIAA0247,LASP1,LOC151534,MALL,PC,PDLIM1, PIGS,POR,PTK2B,SCIN,SLC9A3R1,TMEM82,TOM1 |
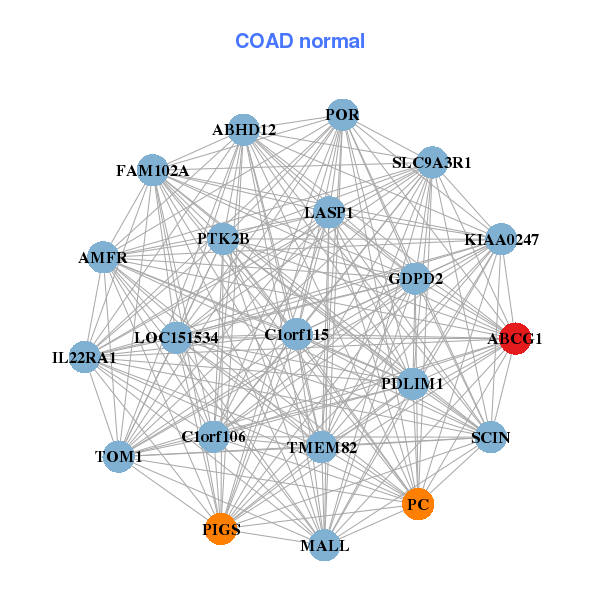
| * Co-Expression network figures were drawn using R package igraph. Only the top 20 genes with the highest correlations were shown. Red circle: input gene, orange circle: cell metabolism gene, sky circle: other gene |
: Open all plots for all cancer types
| Top |
: Open all interacting genes' information including KEGG pathway for all interacting genes from DAVID
| Top |
| Pharmacological Information for ABCG1 |
| DB Category | DB Name | DB's ID and Url link |
| * Gene Centered Interaction Network. |
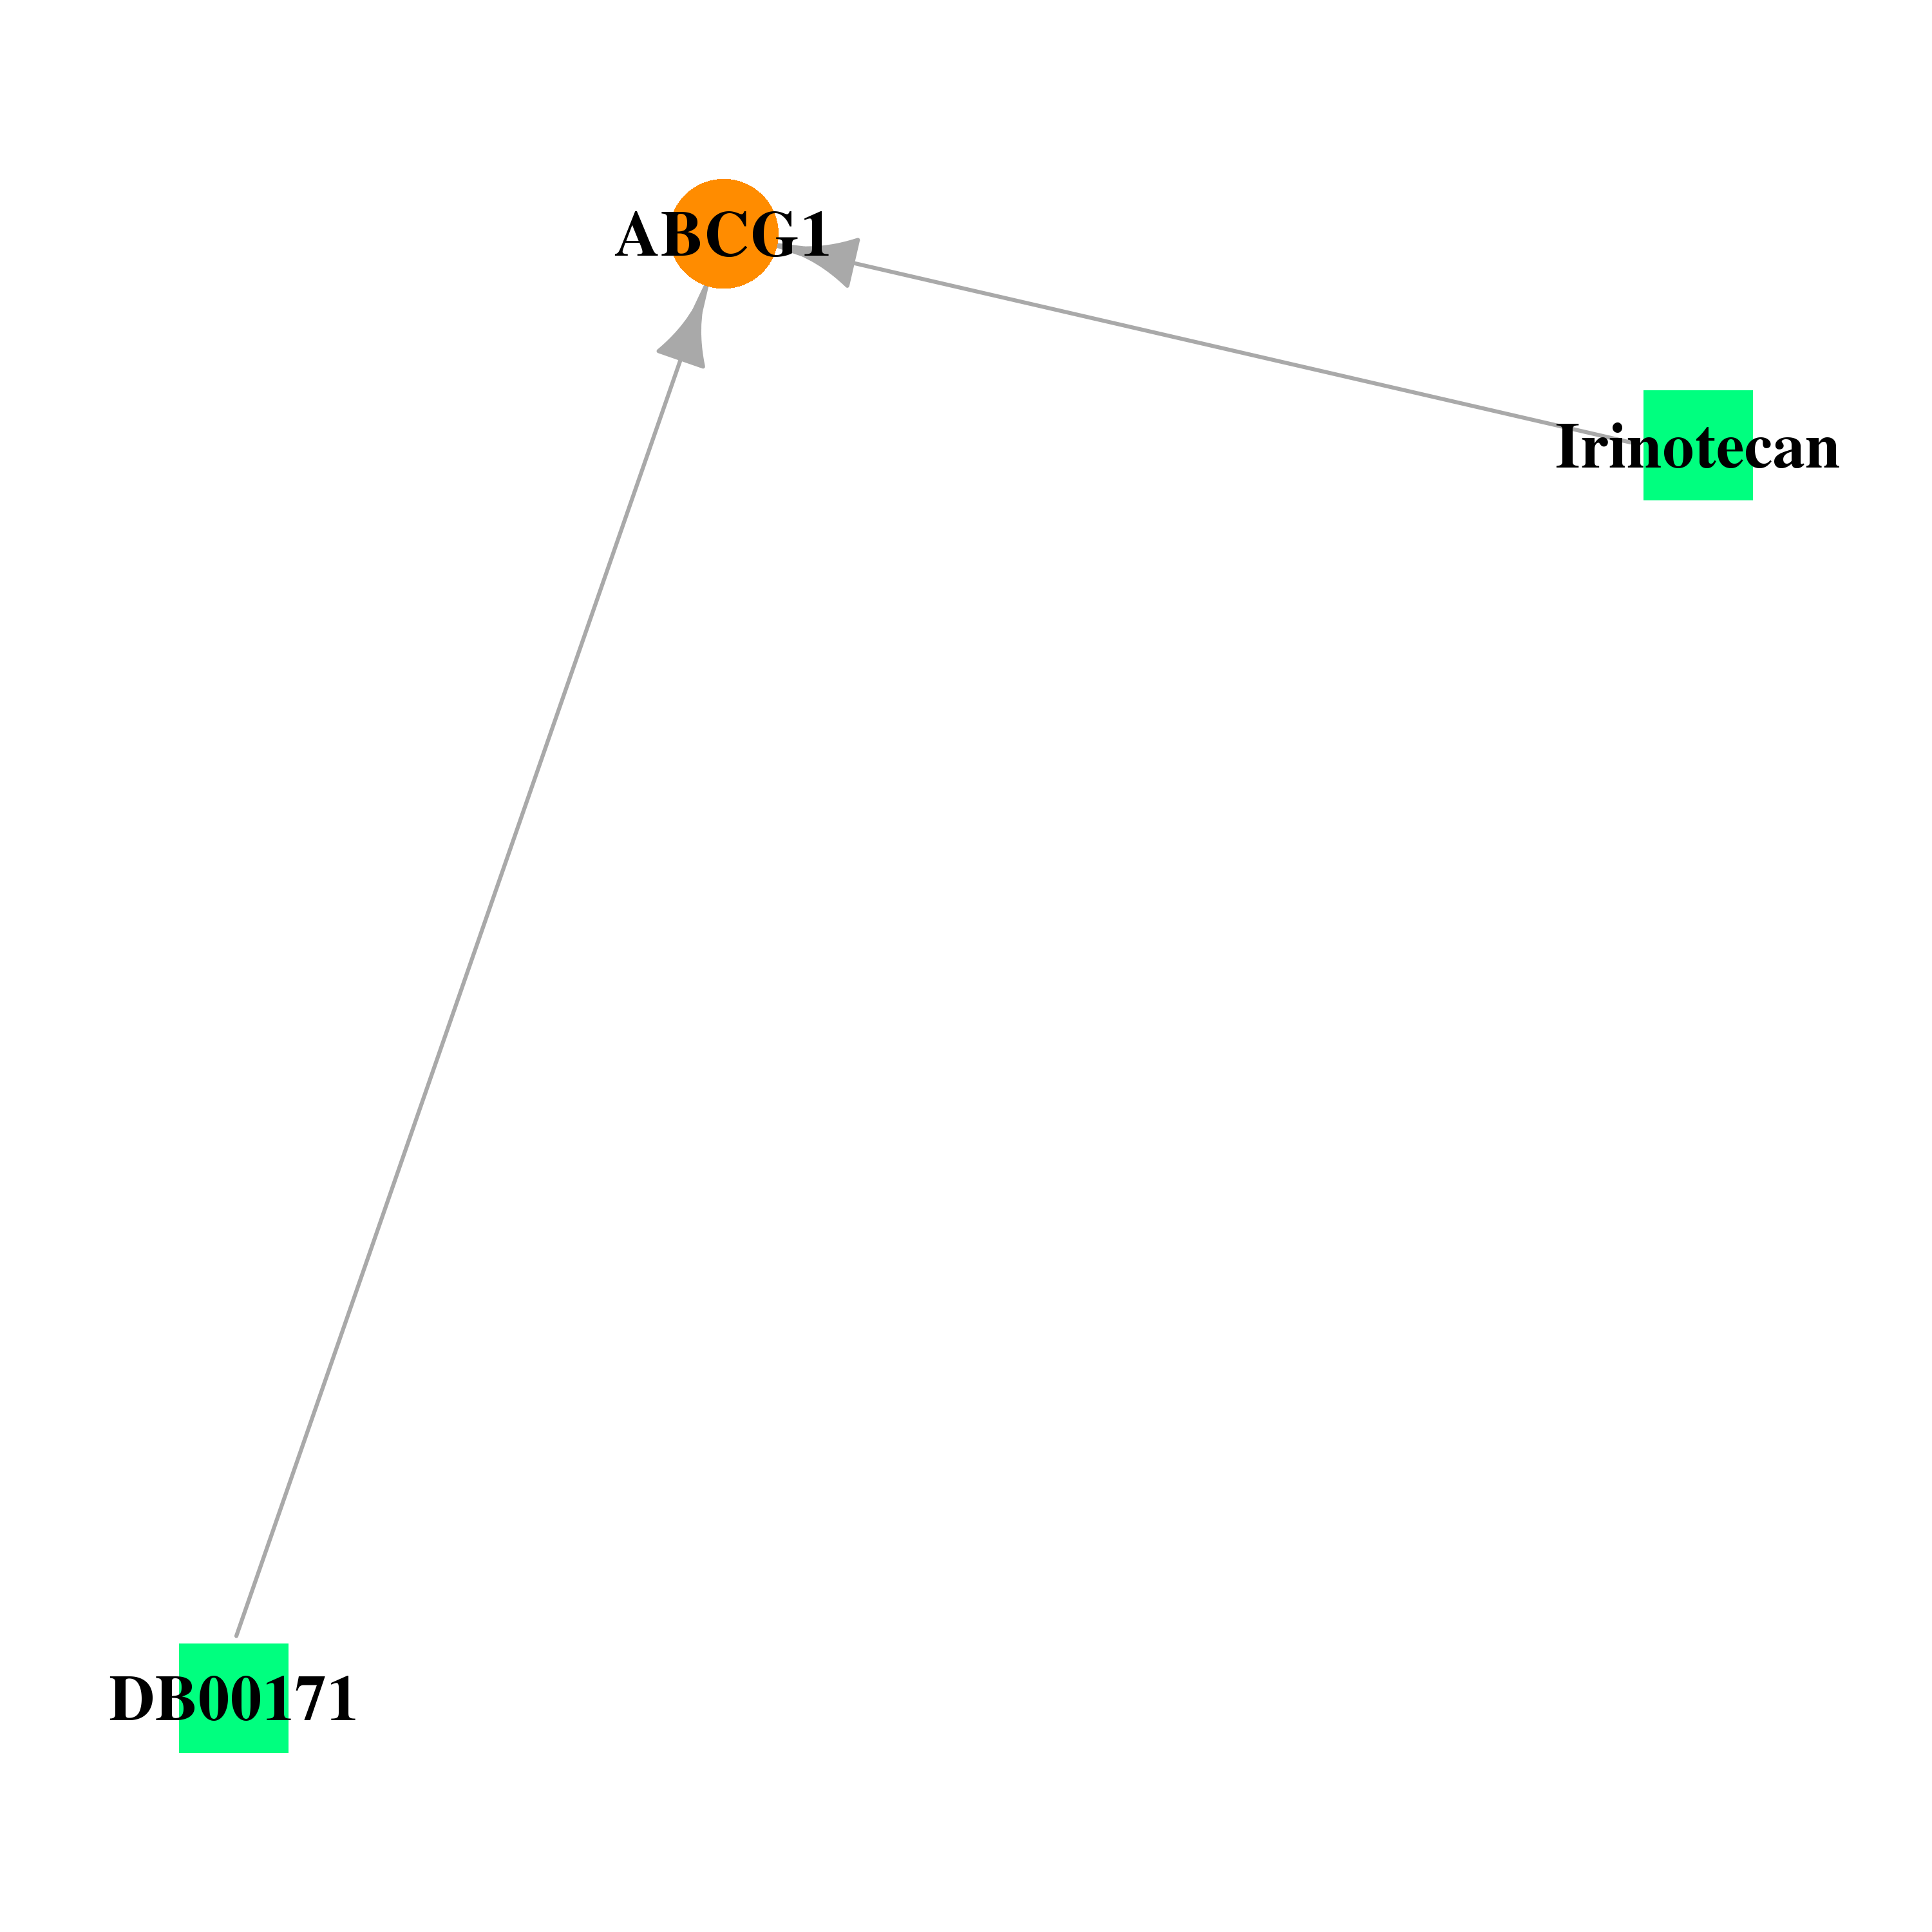 |
| * Drug Centered Interaction Network. |
| DrugBank ID | Target Name | Drug Groups | Generic Name | Drug Centered Network | Drug Structure |
| DB00171 | ATP-binding cassette, sub-family G (WHITE), member 1 | approved; nutraceutical | Adenosine triphosphate |  |  |
| DB00762 | ATP-binding cassette, sub-family G (WHITE), member 1 | approved; investigational | Irinotecan | 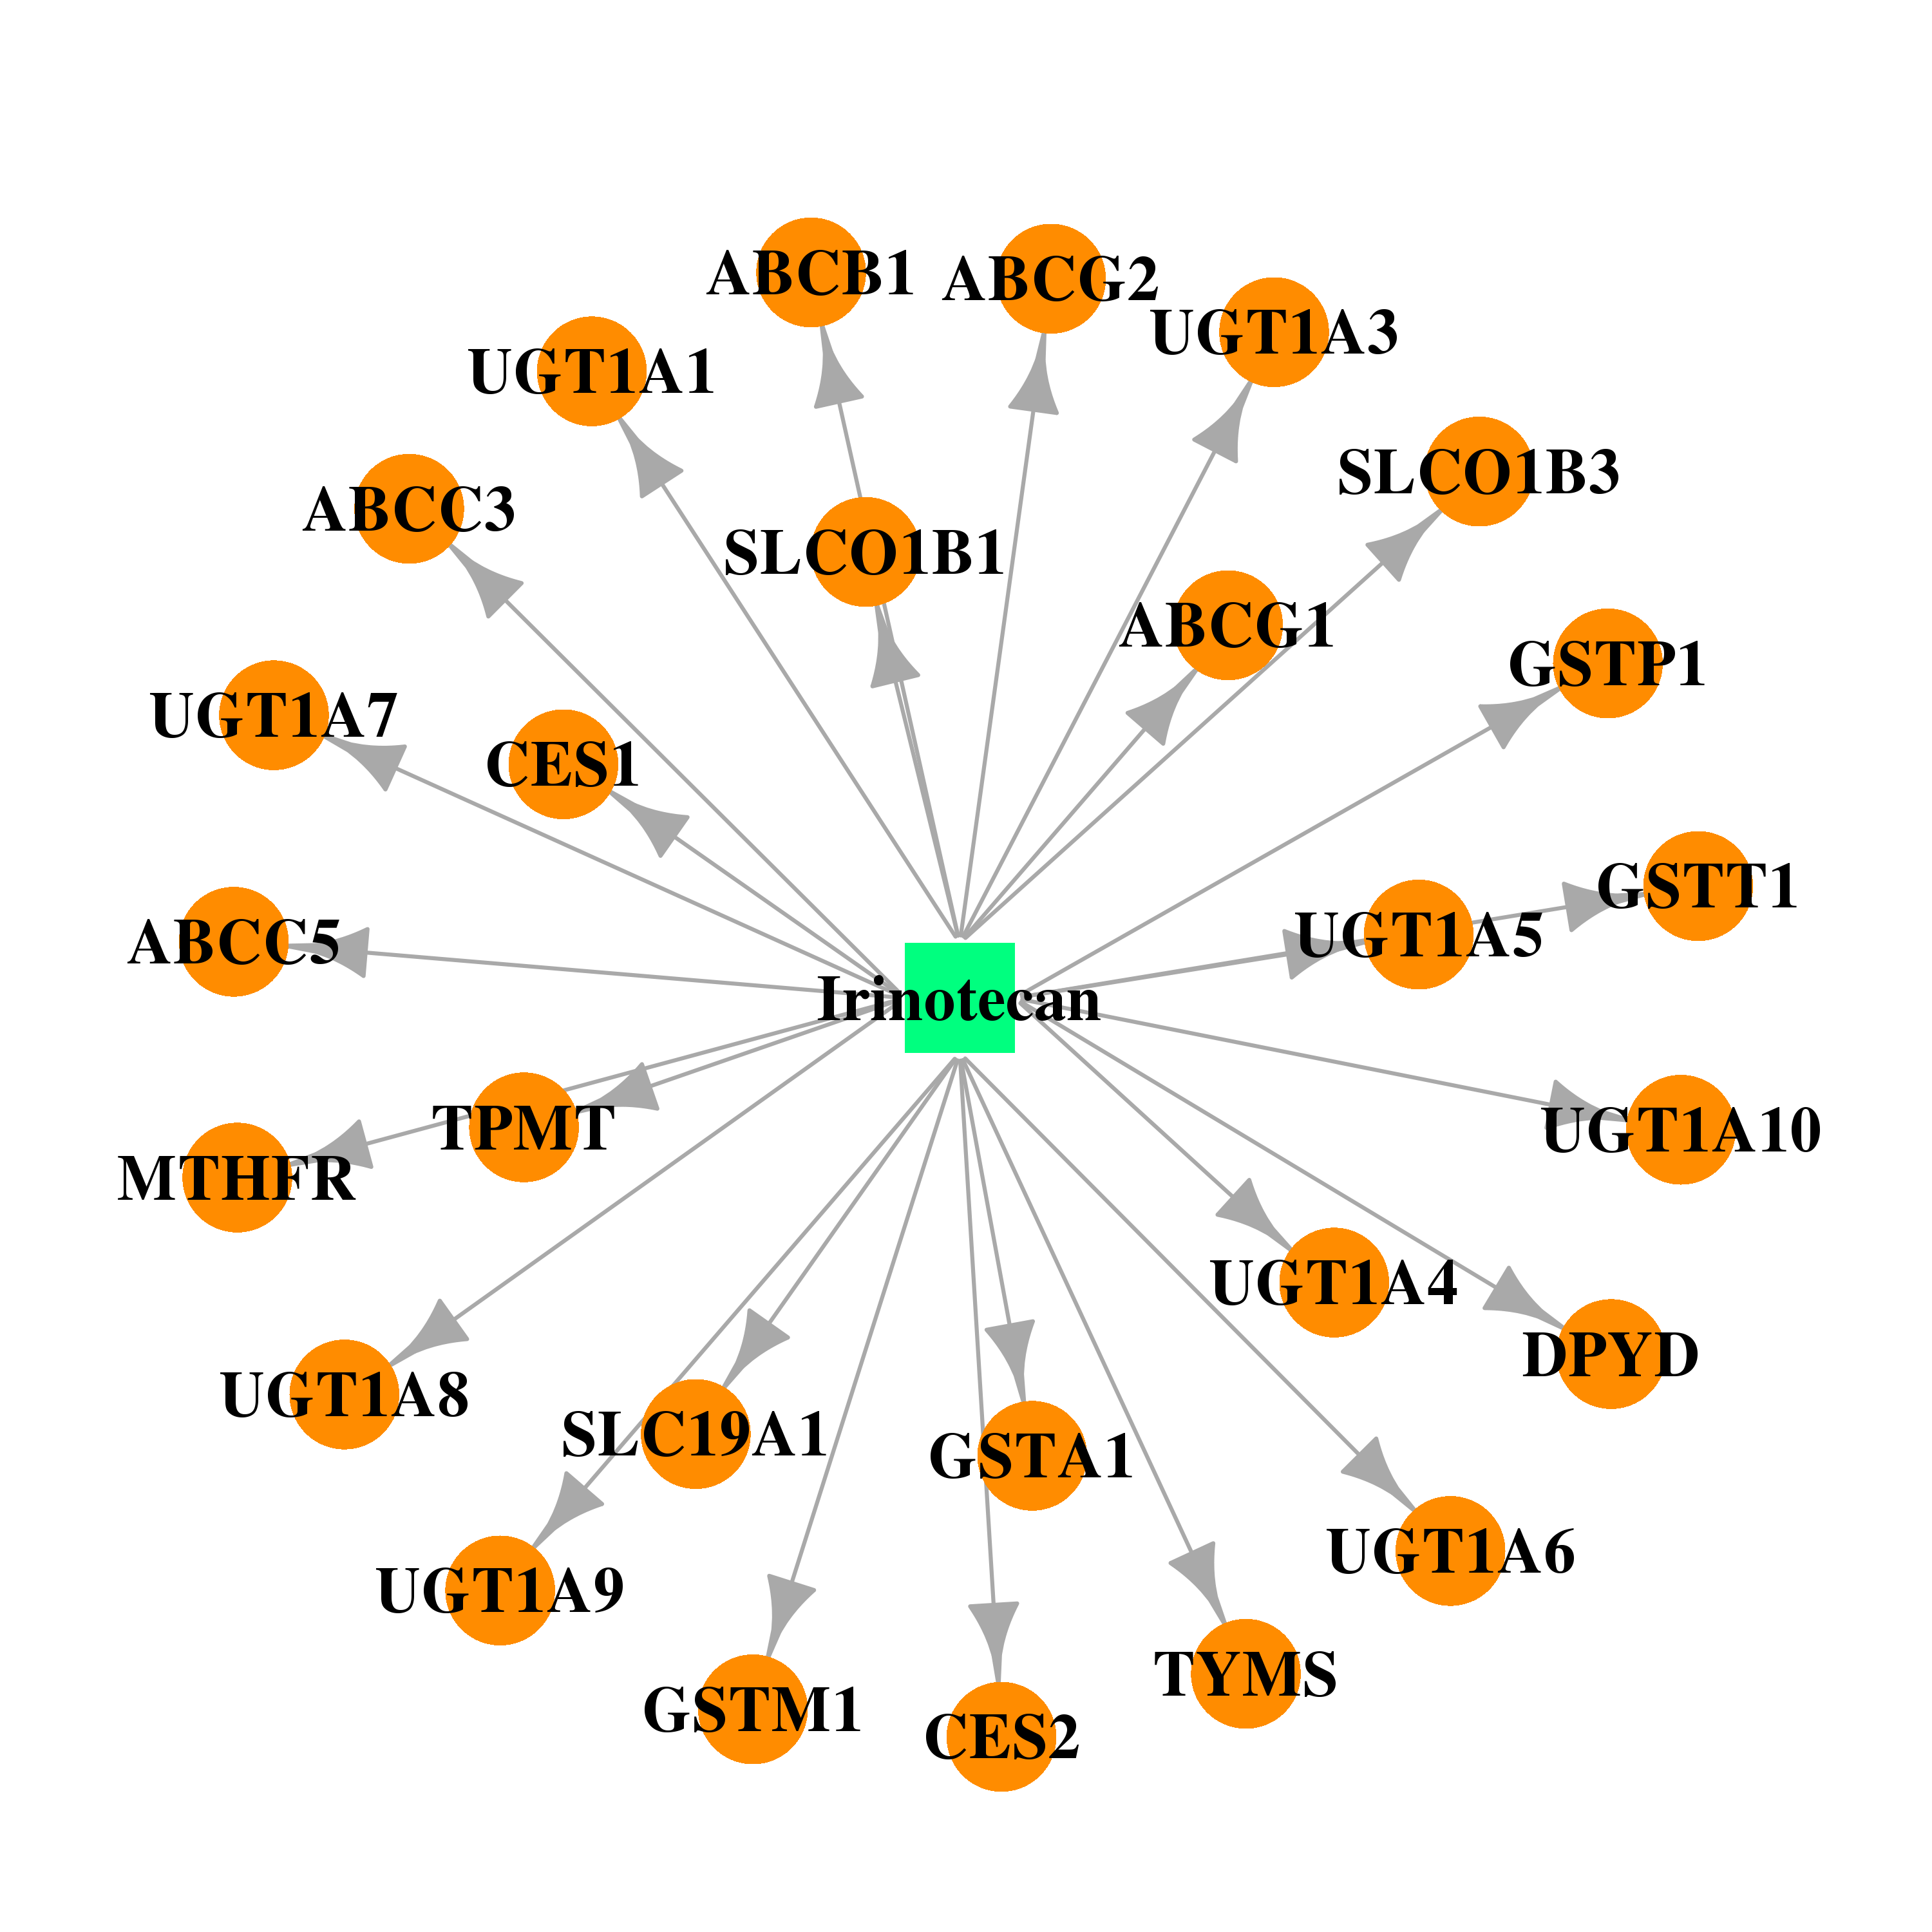 | 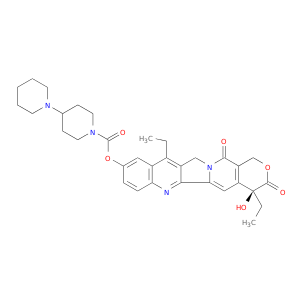 |
| Top |
| Cross referenced IDs for ABCG1 |
| * We obtained these cross-references from Uniprot database. It covers 150 different DBs, 18 categories. http://www.uniprot.org/help/cross_references_section |
: Open all cross reference information
|
Copyright © 2016-Present - The Univsersity of Texas Health Science Center at Houston @ |