|
||||||||||||||||||||||||||||||||||||||||||||||||||||||||||||||||||||||||||||||||||||||||||||||||||||||||||||||||||||||||||||||||||||||||||||||||||||||||||||||||||||||||||||||||||||||||||||||||||||||||||||||||||||||||||||||||||||||||||||||||||||||||||||||||||||||||||||||||||||||||||||||||||||||||||||||||||||||||||
| |
| Phenotypic Information (metabolism pathway, cancer, disease, phenome) |
| |
| |
| Gene-Gene Network Information: Co-Expression Network, Interacting Genes & KEGG |
| |
|


| Gene Summary for LPIN2 |
| Basic gene info. | Gene symbol | LPIN2 |
| Gene name | lipin 2 | |
| Synonyms | - | |
| Cytomap | UCSC genome browser: 18p11.31 | |
| Genomic location | chr18 :2916991-3011945 | |
| Type of gene | protein-coding | |
| RefGenes | NM_014646.2, | |
| Ensembl id | ENSG00000101577 | |
| Description | lipin-2phosphatidate phosphatase LPIN2 | |
| Modification date | 20141219 | |
| dbXrefs | MIM : 605519 | |
| HGNC : HGNC | ||
| Ensembl : ENSG00000101577 | ||
| HPRD : 16114 | ||
| Vega : OTTHUMG00000131508 | ||
| Protein | UniProt: go to UniProt's Cross Reference DB Table | |
| Expression | CleanEX: HS_LPIN2 | |
| BioGPS: 9663 | ||
| Gene Expression Atlas: ENSG00000101577 | ||
| The Human Protein Atlas: ENSG00000101577 | ||
| Pathway | NCI Pathway Interaction Database: LPIN2 | |
| KEGG: LPIN2 | ||
| REACTOME: LPIN2 | ||
| ConsensusPathDB | ||
| Pathway Commons: LPIN2 | ||
| Metabolism | MetaCyc: LPIN2 | |
| HUMANCyc: LPIN2 | ||
| Regulation | Ensembl's Regulation: ENSG00000101577 | |
| miRBase: chr18 :2,916,991-3,011,945 | ||
| TargetScan: NM_014646 | ||
| cisRED: ENSG00000101577 | ||
| Context | iHOP: LPIN2 | |
| cancer metabolism search in PubMed: LPIN2 | ||
| UCL Cancer Institute: LPIN2 | ||
| Assigned class in ccmGDB | C | |
| Top |
| Phenotypic Information for LPIN2(metabolism pathway, cancer, disease, phenome) |
| Cancer | CGAP: LPIN2 |
| Familial Cancer Database: LPIN2 | |
| * This gene is included in those cancer gene databases. |
|
|
|
|
|
|
| ||||||||||||||||||||||||||||||||||||||||||||||||||||||||||||||||||||||||||||||||||||||||||||||||||||||||||||||||||||||||||||||||||||||||||||||||||||||||||||||||||||||||||||||||||||||||||||||||||||||||||||||||||||||||||||||||||||||||||||||||||||||||||||||||||||||||||||||||||||||||||||||||||||||||||||||||||||
Oncogene 1 | Significant driver gene in | |||||||||||||||||||||||||||||||||||||||||||||||||||||||||||||||||||||||||||||||||||||||||||||||||||||||||||||||||||||||||||||||||||||||||||||||||||||||||||||||||||||||||||||||||||||||||||||||||||||||||||||||||||||||||||||||||||||||||||||||||||||||||||||||||||||||||||||||||||||||||||||||||||||||||||||||||||||||||
| cf) number; DB name 1 Oncogene; http://nar.oxfordjournals.org/content/35/suppl_1/D721.long, 2 Tumor Suppressor gene; https://bioinfo.uth.edu/TSGene/, 3 Cancer Gene Census; http://www.nature.com/nrc/journal/v4/n3/abs/nrc1299.html, 4 CancerGenes; http://nar.oxfordjournals.org/content/35/suppl_1/D721.long, 5 Network of Cancer Gene; http://ncg.kcl.ac.uk/index.php, 1Therapeutic Vulnerabilities in Cancer; http://cbio.mskcc.org/cancergenomics/statius/ |
| REACTOME_PHOSPHOLIPID_METABOLISM REACTOME_METABOLISM_OF_LIPIDS_AND_LIPOPROTEINS | |
| OMIM | |
| Orphanet | |
| Disease | KEGG Disease: LPIN2 |
| MedGen: LPIN2 (Human Medical Genetics with Condition) | |
| ClinVar: LPIN2 | |
| Phenotype | MGI: LPIN2 (International Mouse Phenotyping Consortium) |
| PhenomicDB: LPIN2 | |
| Mutations for LPIN2 |
| * Under tables are showing count per each tissue to give us broad intuition about tissue specific mutation patterns.You can go to the detailed page for each mutation database's web site. |
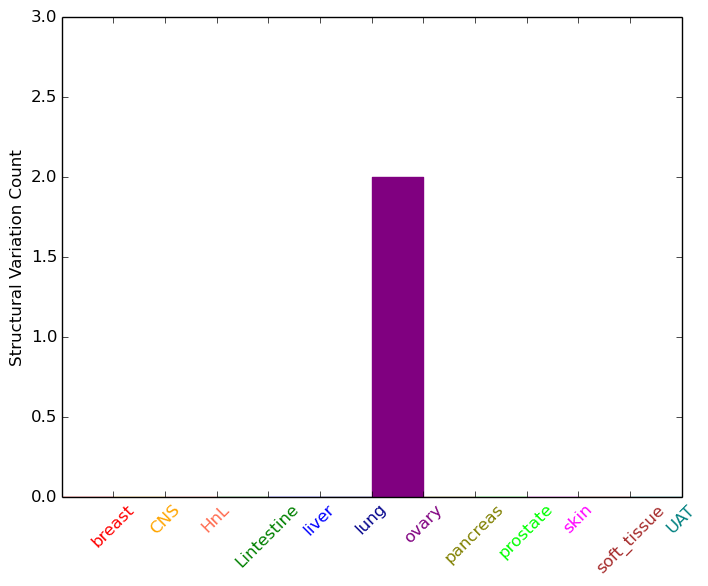
| - Statistics for Tissue and Mutation type | Top |
 |
| - For Inter-chromosomal Variations |
| There's no inter-chromosomal structural variation. |
| - For Intra-chromosomal Variations |
| * Intra-chromosomal variantions includes 'intrachromosomal amplicon to amplicon', 'intrachromosomal amplicon to non-amplified dna', 'intrachromosomal deletion', 'intrachromosomal fold-back inversion', 'intrachromosomal inversion', 'intrachromosomal tandem duplication', 'Intrachromosomal unknown type', 'intrachromosomal with inverted orientation', 'intrachromosomal with non-inverted orientation'. |
 |
| Sample | Symbol_a | Chr_a | Start_a | End_a | Symbol_b | Chr_b | Start_b | End_b |
| ovary | LPIN2 | chr18 | 2925886 | 2925906 | chr18 | 38810348 | 38810368 | |
| ovary | LPIN2 | chr18 | 2985919 | 2985939 | SMCHD1 | chr18 | 2766206 | 2766226 |
| cf) Tissue number; Tissue name (1;Breast, 2;Central_nervous_system, 3;Haematopoietic_and_lymphoid_tissue, 4;Large_intestine, 5;Liver, 6;Lung, 7;Ovary, 8;Pancreas, 9;Prostate, 10;Skin, 11;Soft_tissue, 12;Upper_aerodigestive_tract) |
| * From mRNA Sanger sequences, Chitars2.0 arranged chimeric transcripts. This table shows LPIN2 related fusion information. |
| ID | Head Gene | Tail Gene | Accession | Gene_a | qStart_a | qEnd_a | Chromosome_a | tStart_a | tEnd_a | Gene_a | qStart_a | qEnd_a | Chromosome_a | tStart_a | tEnd_a |
| Top |
| Mutation type/ Tissue ID | brca | cns | cerv | endome | haematopo | kidn | Lintest | liver | lung | ns | ovary | pancre | prost | skin | stoma | thyro | urina | |||
| Total # sample | 1 | 1 | 1 | 1 | 2 | |||||||||||||||
| GAIN (# sample) | 1 | 1 | 1 | 1 | ||||||||||||||||
| LOSS (# sample) | 1 | 1 |
| cf) Tissue ID; Tissue type (1; Breast, 2; Central_nervous_system, 3; Cervix, 4; Endometrium, 5; Haematopoietic_and_lymphoid_tissue, 6; Kidney, 7; Large_intestine, 8; Liver, 9; Lung, 10; NS, 11; Ovary, 12; Pancreas, 13; Prostate, 14; Skin, 15; Stomach, 16; Thyroid, 17; Urinary_tract) |
| Top |
|
 |
| Top |
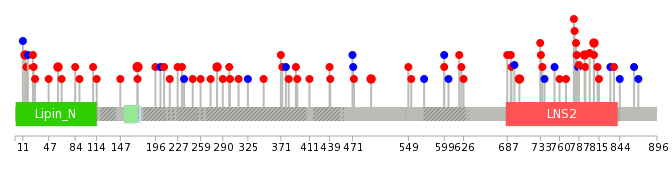
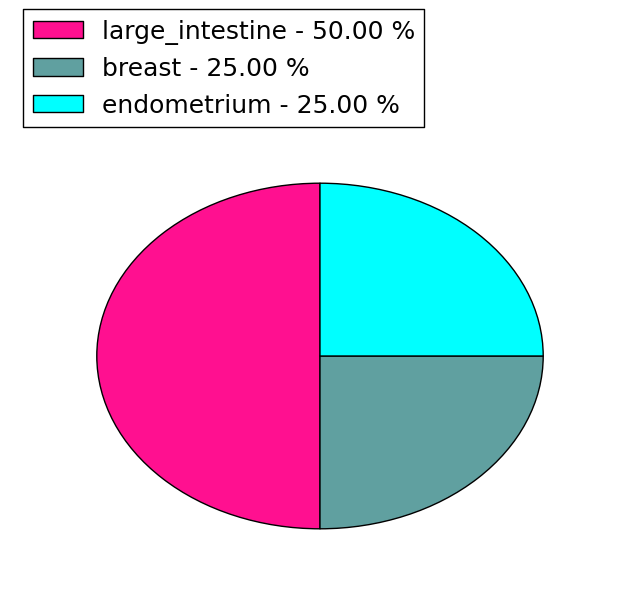
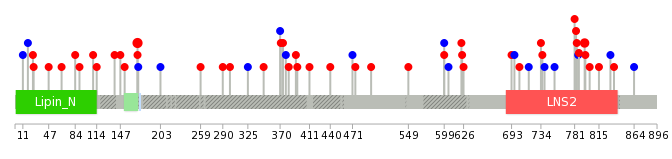
| Stat. for Non-Synonymous SNVs (# total SNVs=57) | (# total SNVs=12) |
 |  |
(# total SNVs=4) | (# total SNVs=0) |
 |
| Top |
| * When you move the cursor on each content, you can see more deailed mutation information on the Tooltip. Those are primary_site,primary_histology,mutation(aa),pubmedID. |
| GRCh37 position | Mutation(aa) | Unique sampleID count |
| chr18:2951131-2951131 | p.Q171R | 3 |
| chr18:2921550-2921550 | p.A808V | 3 |
| chr18:2960799-2960799 | p.T14P | 2 |
| chr18:2938014-2938014 | p.D282H | 2 |
| chr18:2929124-2929124 | p.E497K | 2 |
| chr18:2921588-2921588 | p.K795N | 2 |
| chr18:2960660-2960660 | p.S60F | 2 |
| chr18:2923837-2923837 | p.L704F | 2 |
| chr18:2954540-2954540 | p.G84R | 1 |
| chr18:2922093-2922093 | p.R760Q | 1 |
| Top |
|
 |
| Point Mutation/ Tissue ID | 1 | 2 | 3 | 4 | 5 | 6 | 7 | 8 | 9 | 10 | 11 | 12 | 13 | 14 | 15 | 16 | 17 | 18 | 19 | 20 |
| # sample | 6 | 5 | 1 | 10 | 3 | 1 | 10 | 7 | 1 | 6 | 6 | 8 | ||||||||
| # mutation | 6 | 5 | 1 | 7 | 3 | 1 | 10 | 7 | 1 | 6 | 6 | 8 | ||||||||
| nonsynonymous SNV | 4 | 3 | 5 | 2 | 1 | 7 | 7 | 1 | 4 | 5 | 5 | |||||||||
| synonymous SNV | 2 | 2 | 1 | 2 | 1 | 3 | 2 | 1 | 3 |
| cf) Tissue ID; Tissue type (1; BLCA[Bladder Urothelial Carcinoma], 2; BRCA[Breast invasive carcinoma], 3; CESC[Cervical squamous cell carcinoma and endocervical adenocarcinoma], 4; COAD[Colon adenocarcinoma], 5; GBM[Glioblastoma multiforme], 6; Glioma Low Grade, 7; HNSC[Head and Neck squamous cell carcinoma], 8; KICH[Kidney Chromophobe], 9; KIRC[Kidney renal clear cell carcinoma], 10; KIRP[Kidney renal papillary cell carcinoma], 11; LAML[Acute Myeloid Leukemia], 12; LUAD[Lung adenocarcinoma], 13; LUSC[Lung squamous cell carcinoma], 14; OV[Ovarian serous cystadenocarcinoma ], 15; PAAD[Pancreatic adenocarcinoma], 16; PRAD[Prostate adenocarcinoma], 17; SKCM[Skin Cutaneous Melanoma], 18:STAD[Stomach adenocarcinoma], 19:THCA[Thyroid carcinoma], 20:UCEC[Uterine Corpus Endometrial Carcinoma]) |
| Top |
| * We represented just top 10 SNVs. When you move the cursor on each content, you can see more deailed mutation information on the Tooltip. Those are primary_site, primary_histology, mutation(aa), pubmedID. |
| Genomic Position | Mutation(aa) | Unique sampleID count |
| chr18:2951131 | p.Q171R | 3 |
| chr18:2921588 | p.K795N | 2 |
| chr18:2923856 | p.T26S | 1 |
| chr18:2951227 | p.E784D | 1 |
| chr18:2931297 | p.P599L | 1 |
| chr18:2921615 | p.V300L | 1 |
| chr18:2937883 | p.A25D | 1 |
| chr18:2924406 | p.P783L | 1 |
| chr18:2951301 | p.D549Y | 1 |
| chr18:2931392 | p.I290M | 1 |
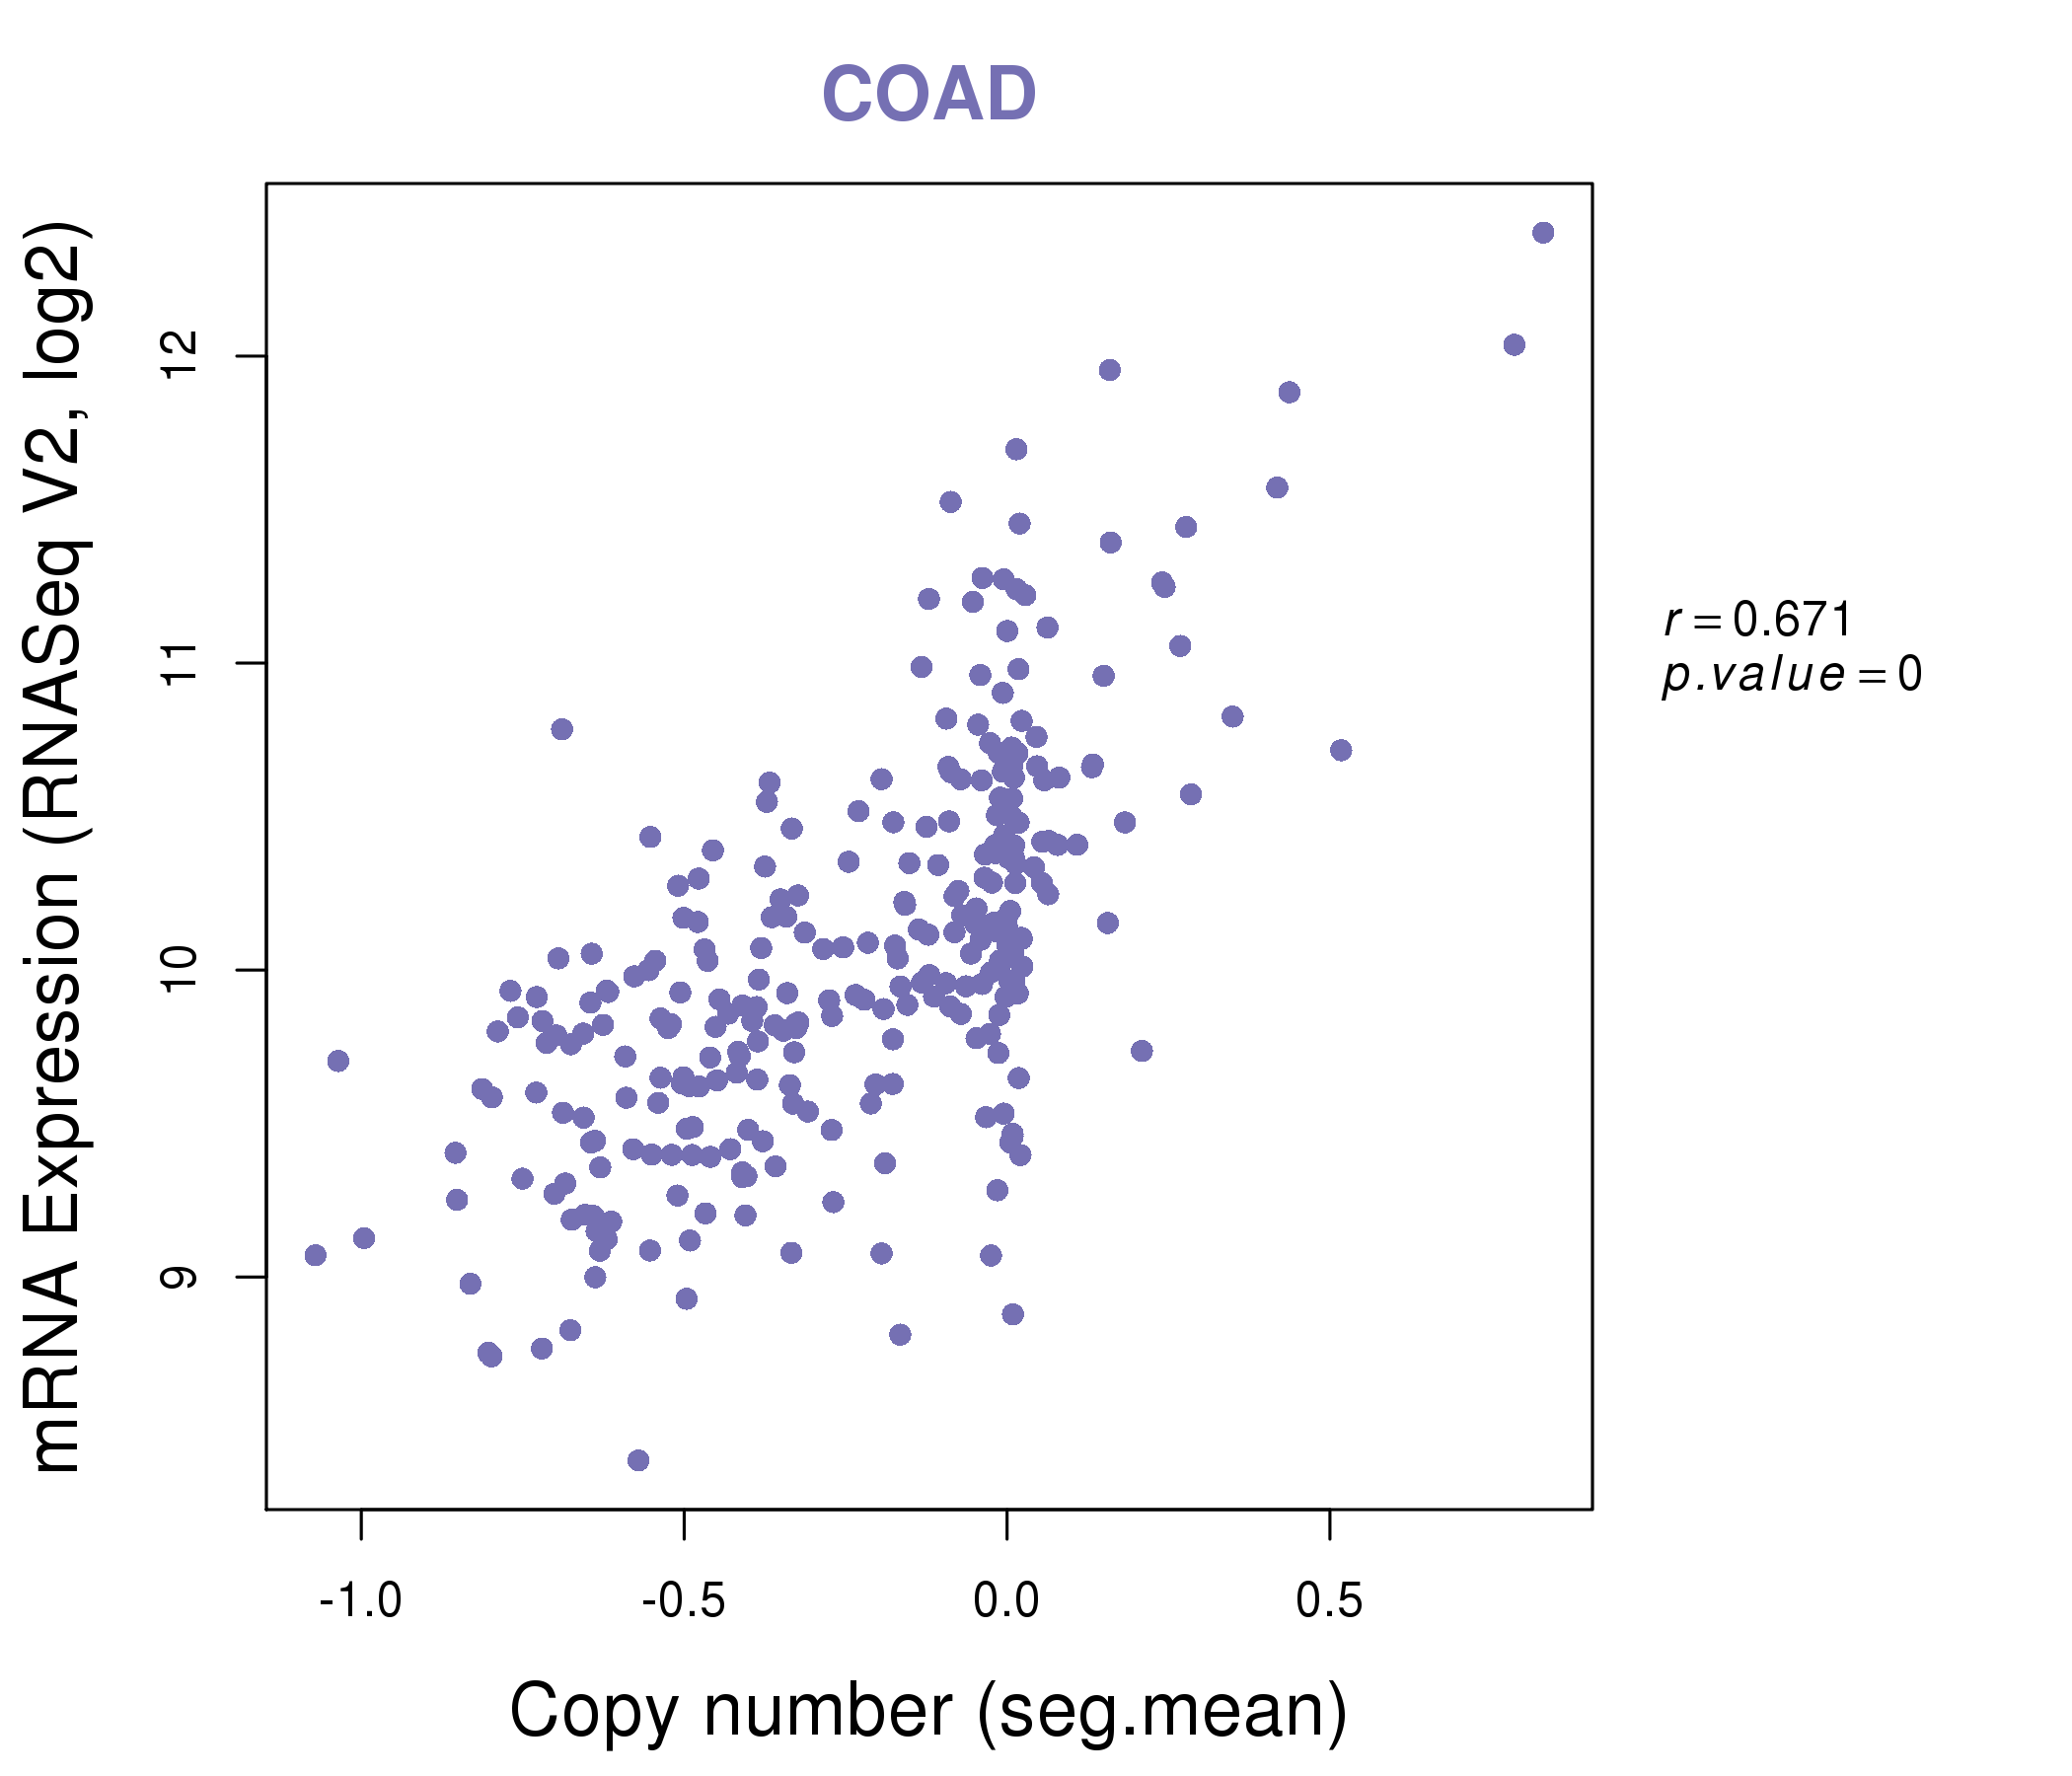
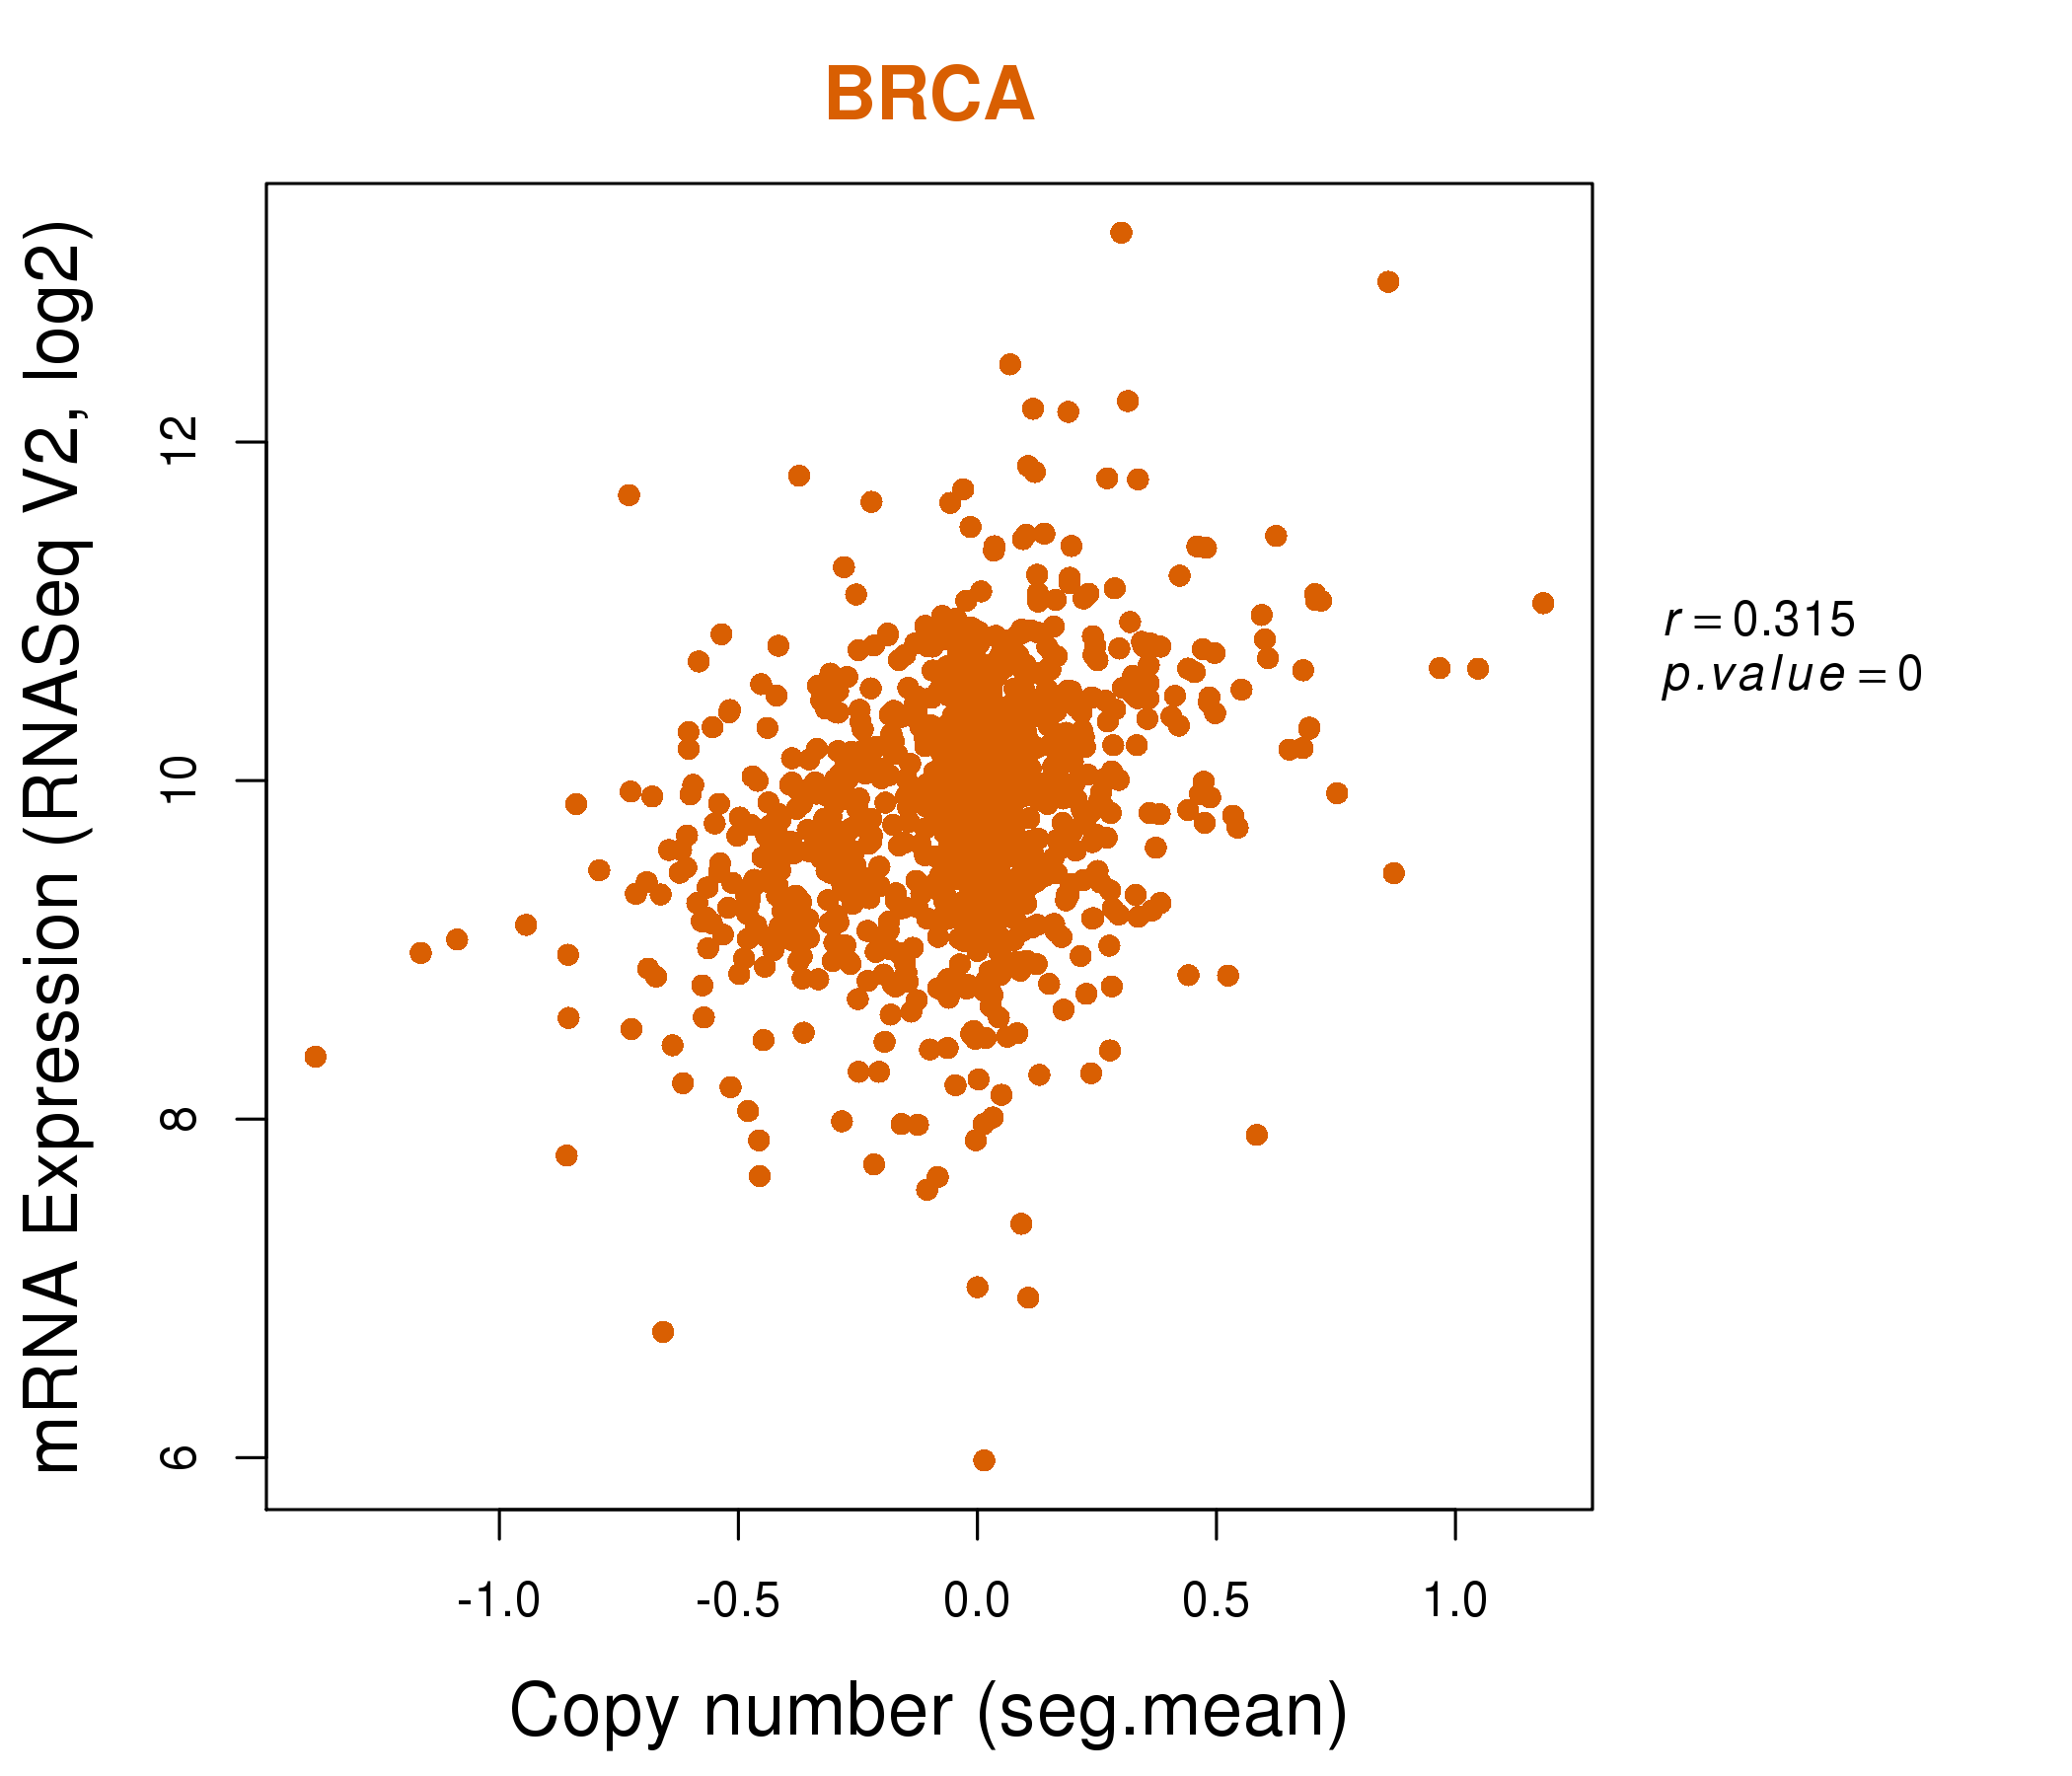
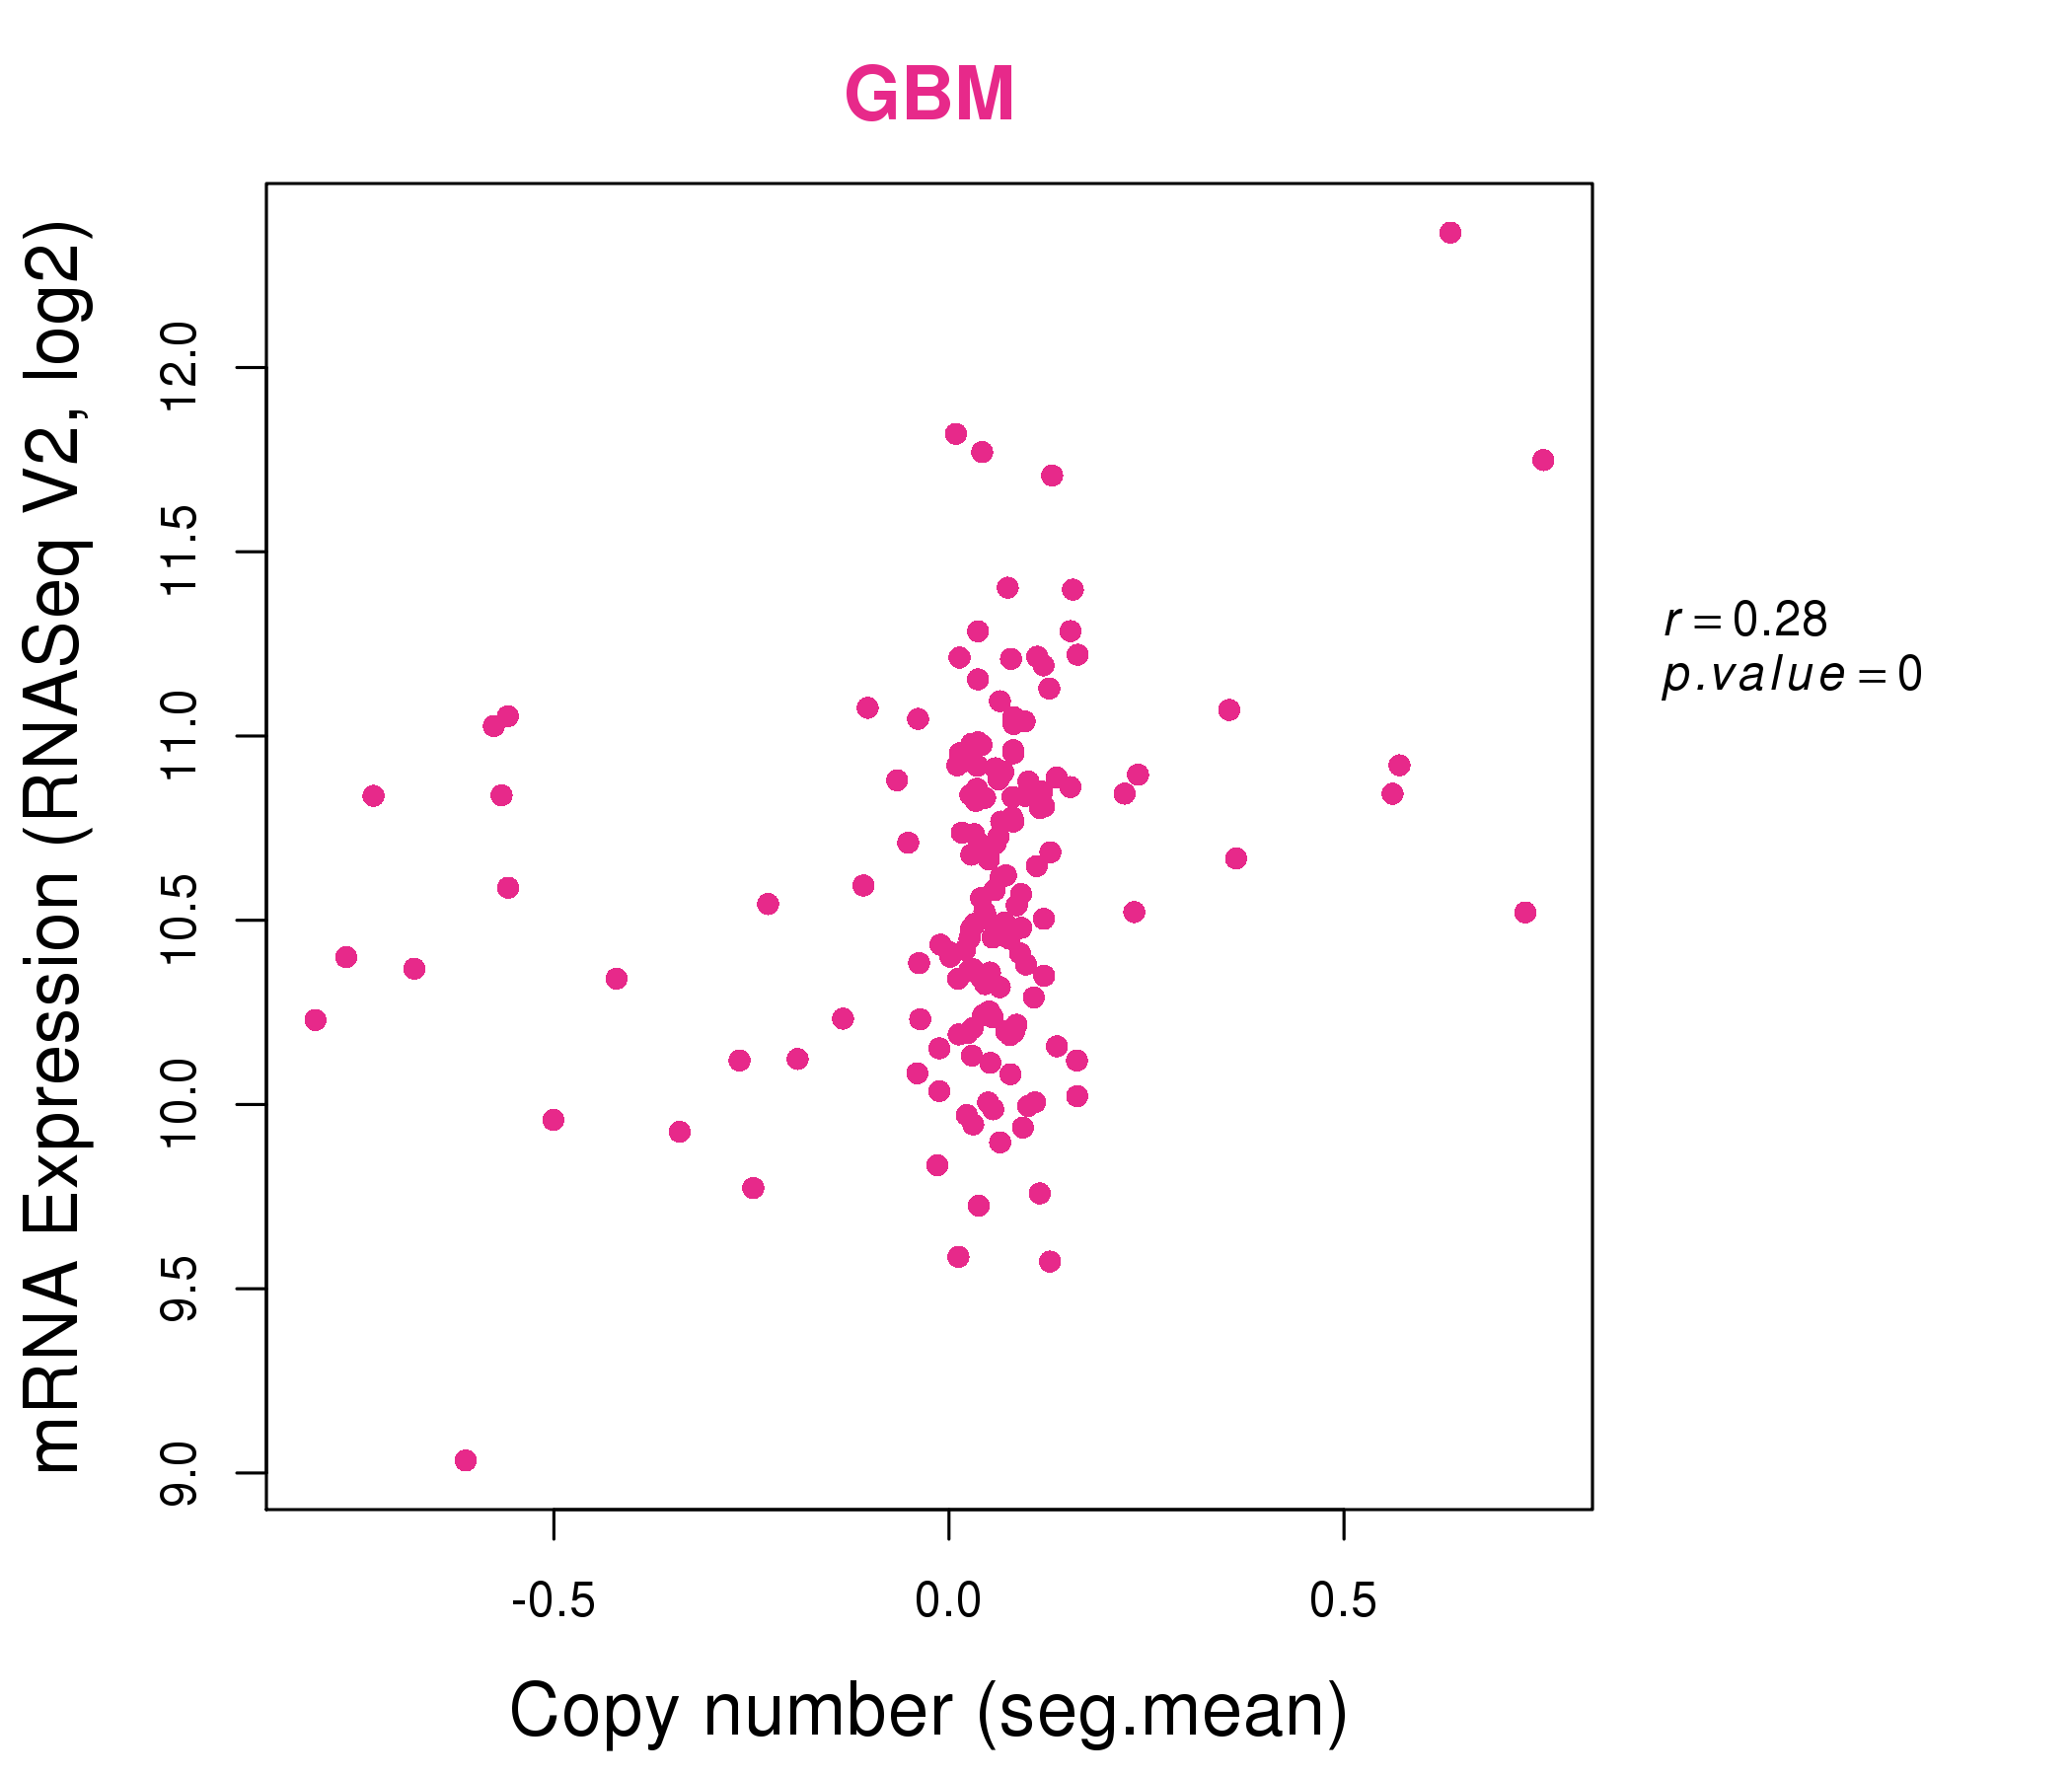
| * Copy number data were extracted from TCGA using R package TCGA-Assembler. The URLs of all public data files on TCGA DCC data server were gathered on Jan-05-2015. Function ProcessCNAData in TCGA-Assembler package was used to obtain gene-level copy number value which is calculated as the average copy number of the genomic region of a gene. |
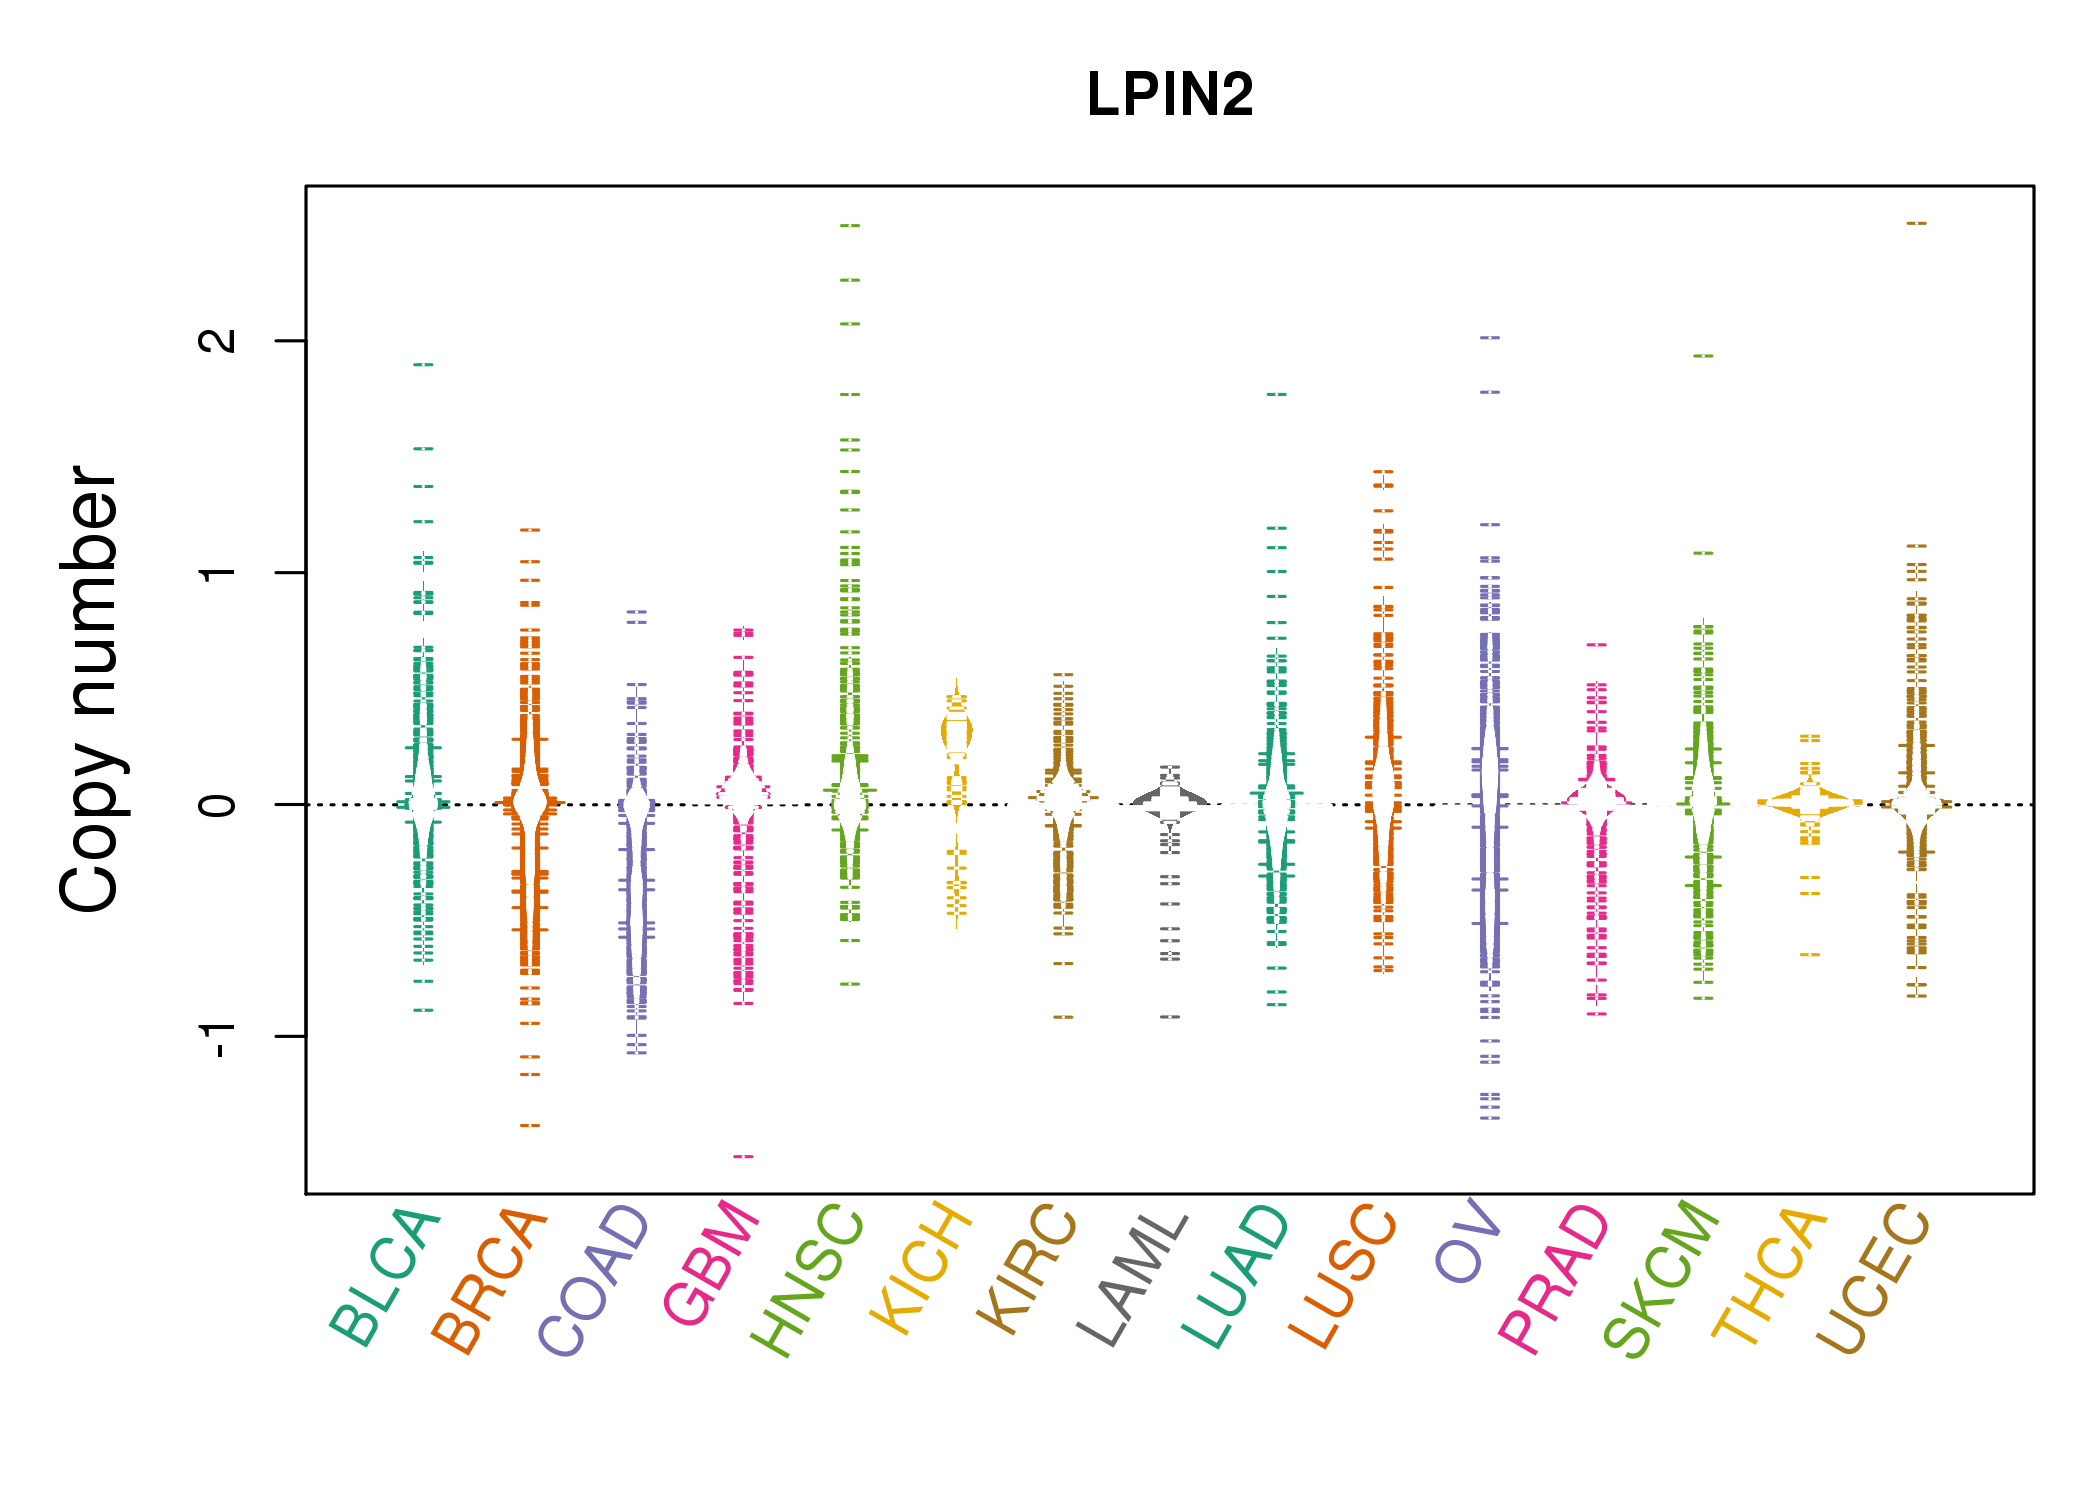 |
| cf) Tissue ID[Tissue type]: BLCA[Bladder Urothelial Carcinoma], BRCA[Breast invasive carcinoma], CESC[Cervical squamous cell carcinoma and endocervical adenocarcinoma], COAD[Colon adenocarcinoma], GBM[Glioblastoma multiforme], Glioma Low Grade, HNSC[Head and Neck squamous cell carcinoma], KICH[Kidney Chromophobe], KIRC[Kidney renal clear cell carcinoma], KIRP[Kidney renal papillary cell carcinoma], LAML[Acute Myeloid Leukemia], LUAD[Lung adenocarcinoma], LUSC[Lung squamous cell carcinoma], OV[Ovarian serous cystadenocarcinoma ], PAAD[Pancreatic adenocarcinoma], PRAD[Prostate adenocarcinoma], SKCM[Skin Cutaneous Melanoma], STAD[Stomach adenocarcinoma], THCA[Thyroid carcinoma], UCEC[Uterine Corpus Endometrial Carcinoma] |
| Top |
| Gene Expression for LPIN2 |
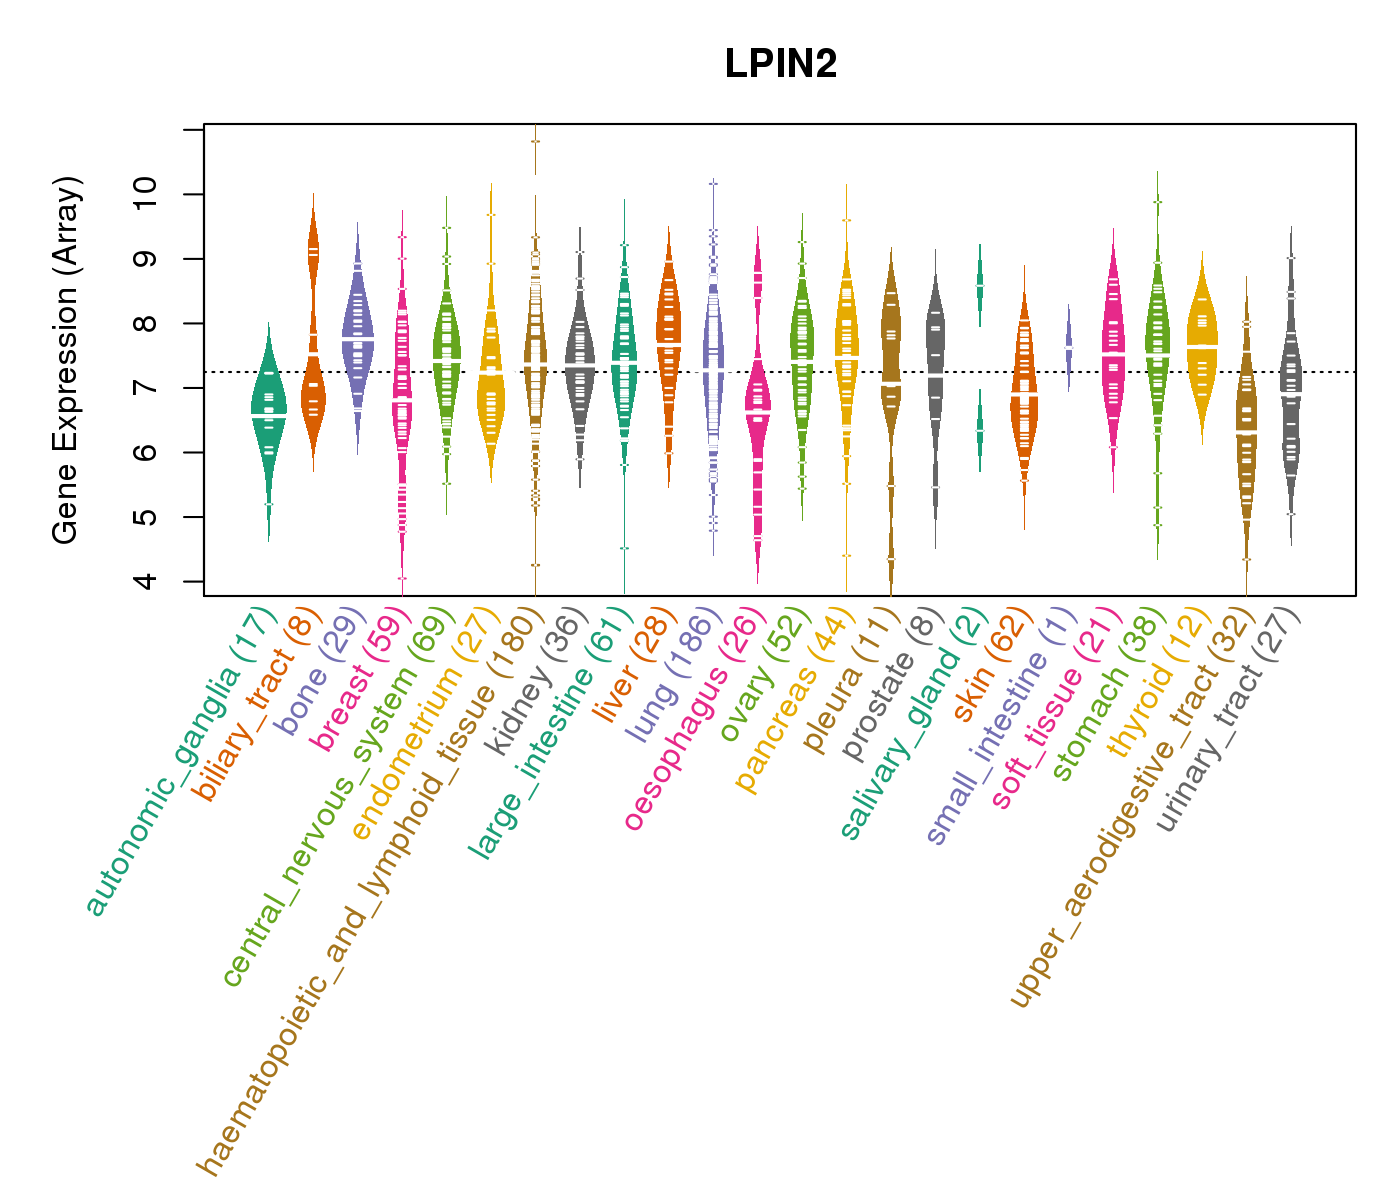
| * CCLE gene expression data were extracted from CCLE_Expression_Entrez_2012-10-18.res: Gene-centric RMA-normalized mRNA expression data. |
 |
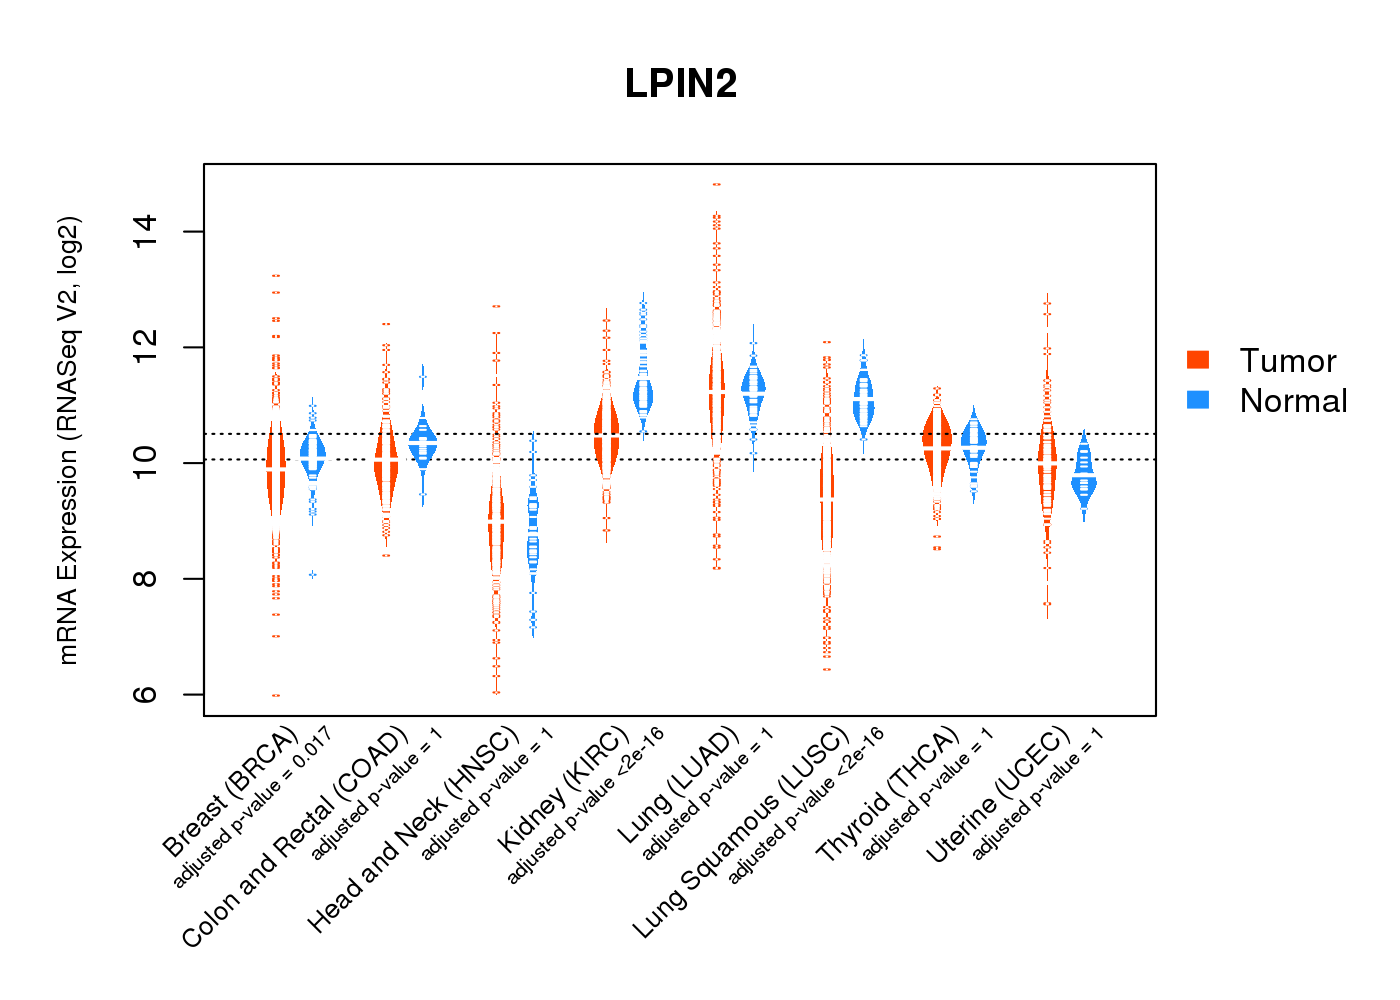
| * Normalized gene expression data of RNASeqV2 was extracted from TCGA using R package TCGA-Assembler. The URLs of all public data files on TCGA DCC data server were gathered at Jan-05-2015. Only eight cancer types have enough normal control samples for differential expression analysis. (t test, adjusted p<0.05 (using Benjamini-Hochberg FDR)) |
 |
| Top |
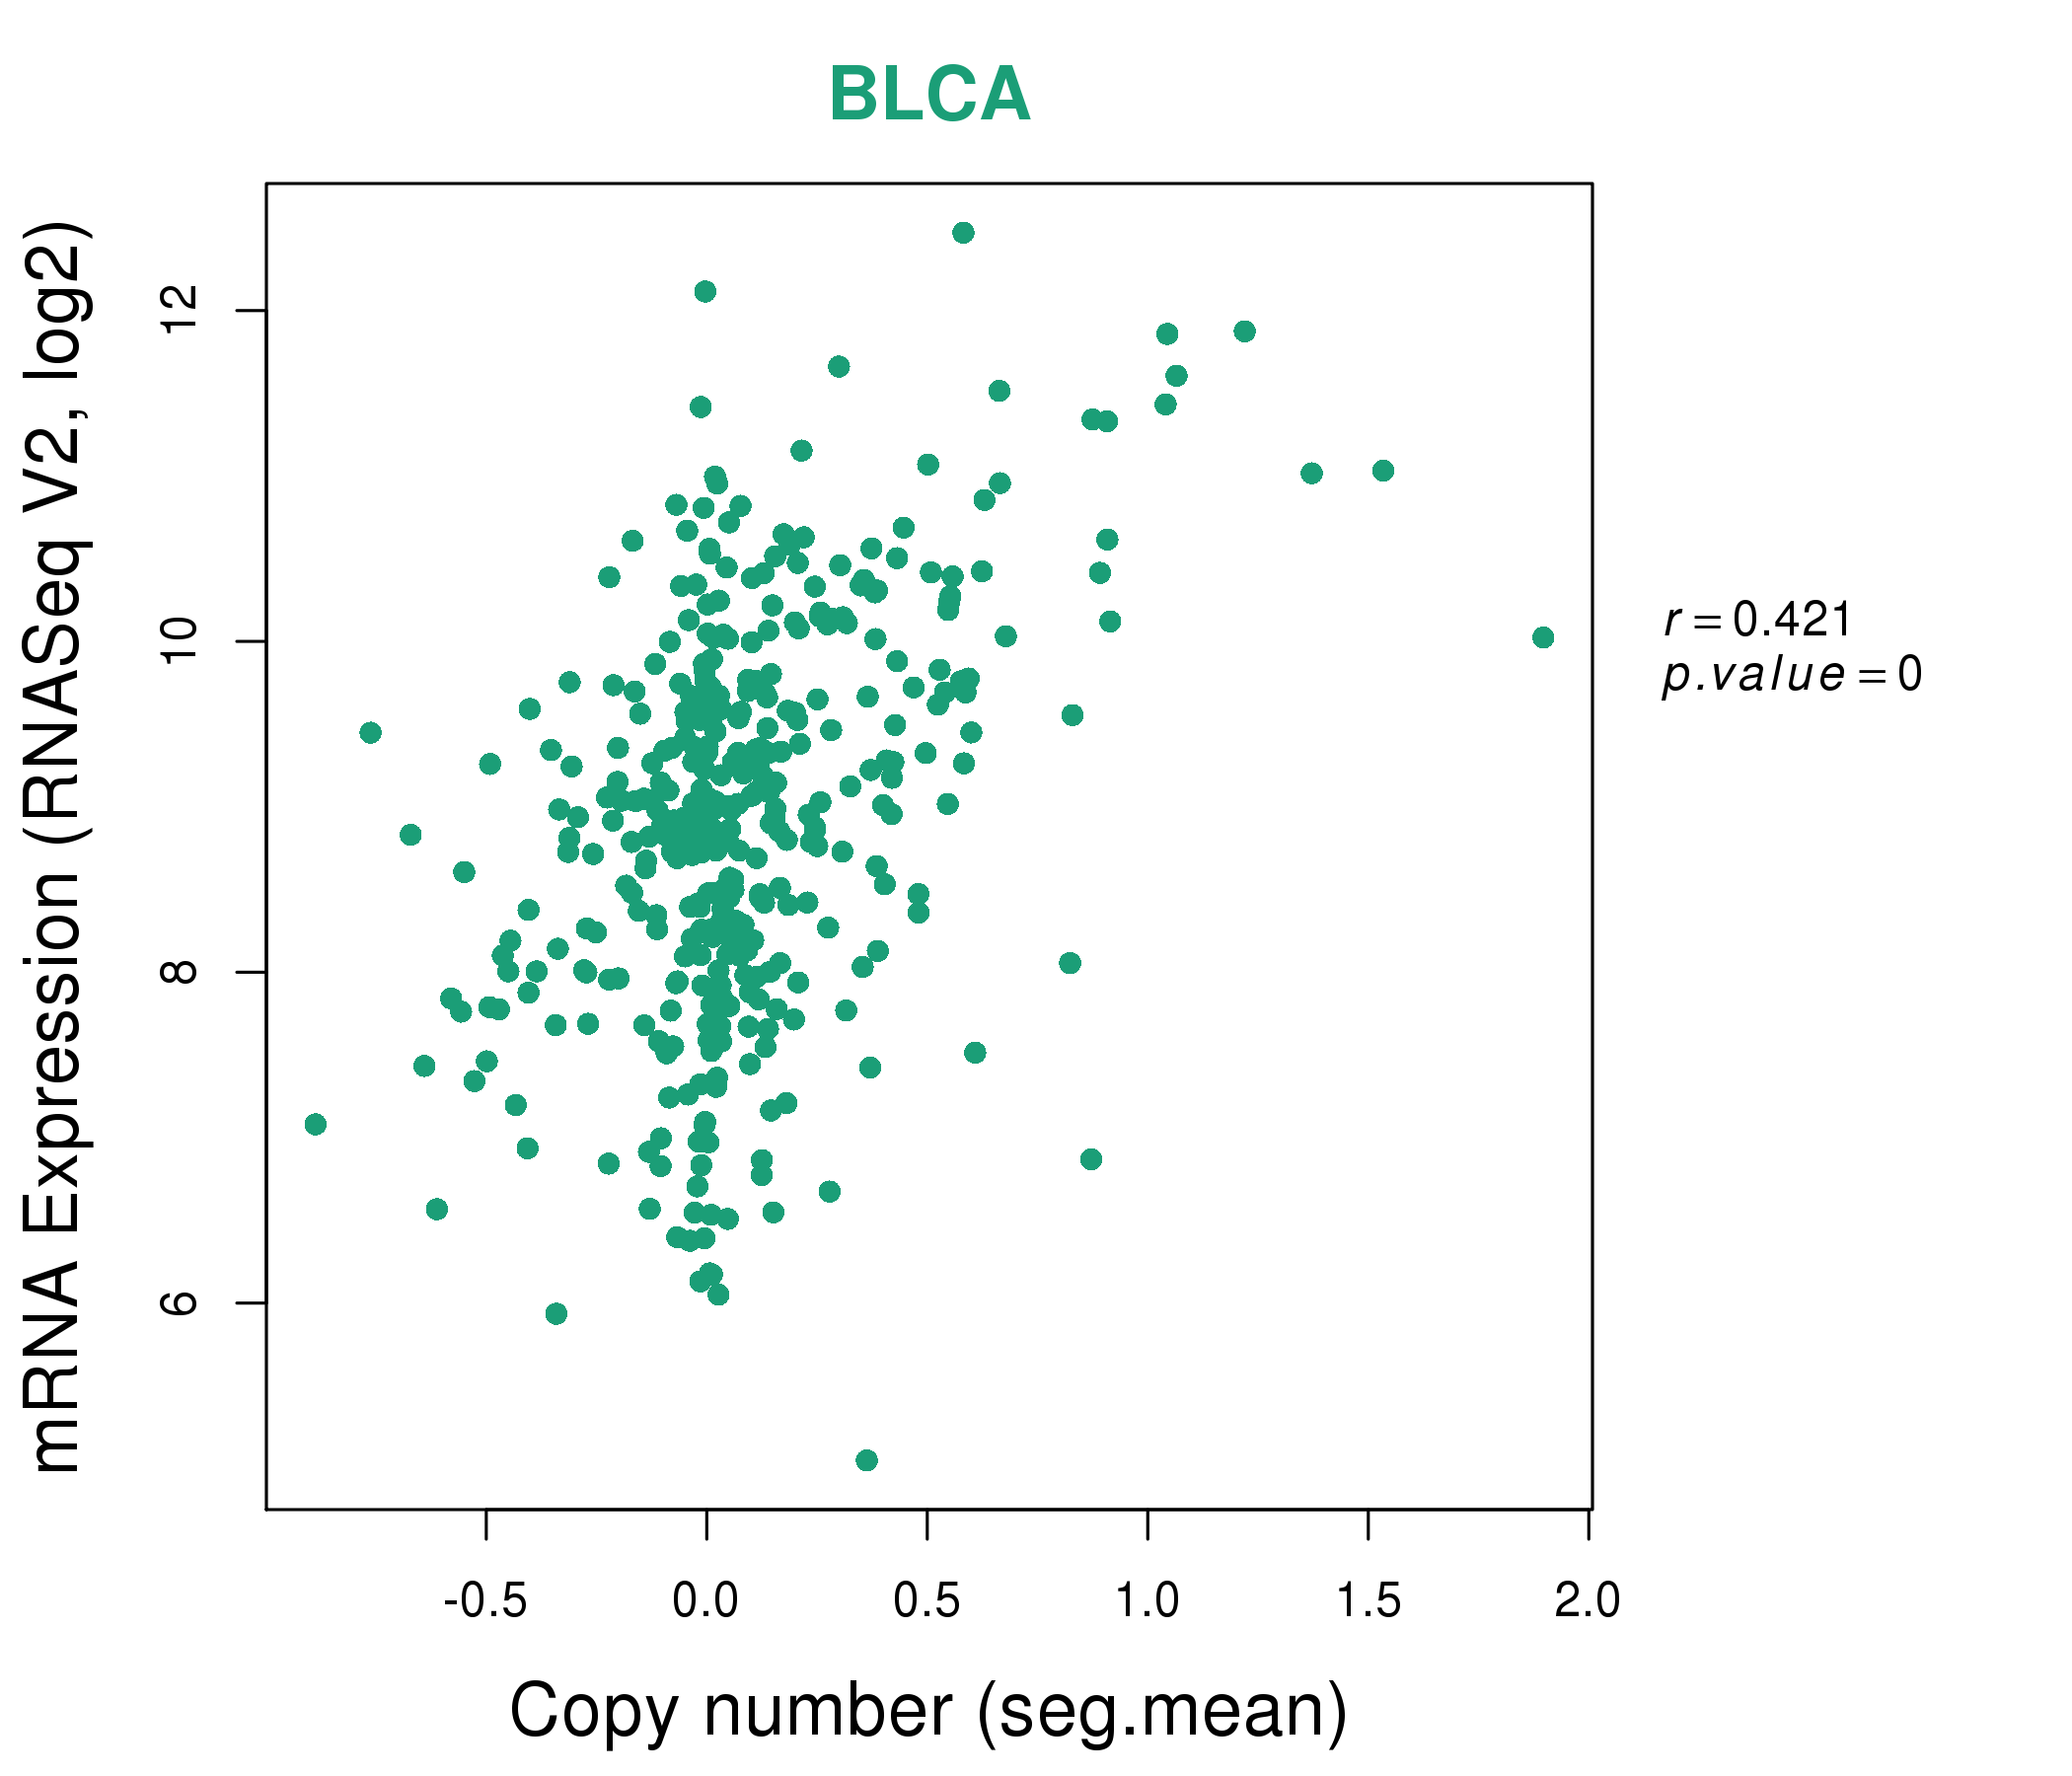
| * This plots show the correlation between CNV and gene expression. |
: Open all plots for all cancer types
 |
|
 |
|
| Top |
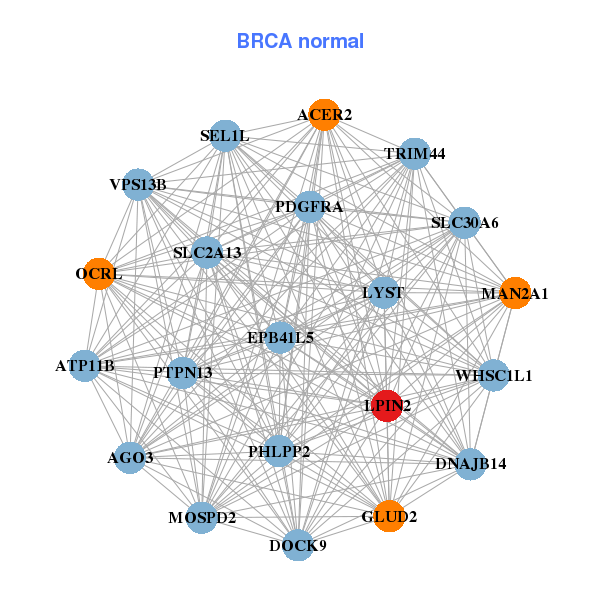
| Gene-Gene Network Information |
| * Co-Expression network figures were drawn using R package igraph. Only the top 20 genes with the highest correlations were shown. Red circle: input gene, orange circle: cell metabolism gene, sky circle: other gene |
: Open all plots for all cancer types
 |
|
| ADAM18,B4GALT6,NAT16,CEP192,CLCA1,CMTM1,CT47A11, CXXC4,DMXL2,FEZF1,FNIP2,KCNA4,KRTAP9-4,KRTAP9-9, LPIN2,PHF20L1,PTPRM,ROCK1,SEC14L3,SETX,SMCHD1 | ACER2,ATP11B,DNAJB14,DOCK9,AGO3,EPB41L5,GLUD2, LPIN2,LYST,MAN2A1,MOSPD2,OCRL,PDGFRA,PHLPP2, PTPN13,SEL1L,SLC2A13,SLC30A6,TRIM44,VPS13B,WHSC1L1 |
 |
|
| AFG3L2,ANKRD12,CEP192,CHMP1B,KIAA1211,LPIN2,METTL4, MPPE1,MYL12A,NAPG,PPP4R1,PTPN2,RALBP1,RNMT, SLC6A10P,SMCHD1,SPIRE1,TTC7A,USP14,VAPA,YES1 | APPL2,C1orf106,C2CD2L,CTSZ,CXADR,FTH1P3,GNA11, HECTD3,KIAA0247,KIAA1211,LASP1,LPIN2,MAST2,MGAT4A, MPP5,MYO15B,PAG1,PRKCD,PTPRJ,TUBAL3,ZBTB7B |
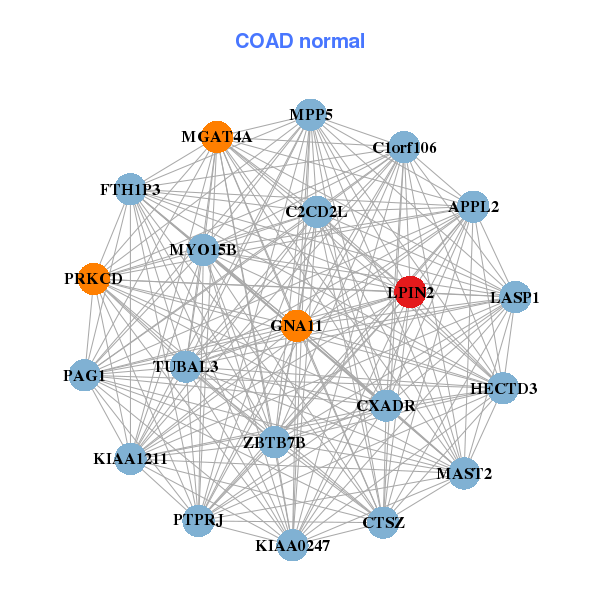
| * Co-Expression network figures were drawn using R package igraph. Only the top 20 genes with the highest correlations were shown. Red circle: input gene, orange circle: cell metabolism gene, sky circle: other gene |
: Open all plots for all cancer types
| Top |
: Open all interacting genes' information including KEGG pathway for all interacting genes from DAVID
| Top |
| Pharmacological Information for LPIN2 |
| There's no related Drug. |
| Top |
| Cross referenced IDs for LPIN2 |
| * We obtained these cross-references from Uniprot database. It covers 150 different DBs, 18 categories. http://www.uniprot.org/help/cross_references_section |
: Open all cross reference information
|
Copyright © 2016-Present - The Univsersity of Texas Health Science Center at Houston @ |