|
|||||||||||||||||||||||||||||||||||||||||||||||||||||||||||||||||||||||||||||||||||||||||||||||||||||||||||||||||||||||||||||||||||||||||||||||||||||||||||||||||||||||||||||||||||||||||||||||||||||||||||||||||||||||||||||||||||||||||||||||||||||||||||||||||||||||||||||||||||||||||||||||||||||||||||||||||||||||||||||||||||||||||||||
| |
| Phenotypic Information (metabolism pathway, cancer, disease, phenome) |
| |
| |
| Gene-Gene Network Information: Co-Expression Network, Interacting Genes & KEGG |
| |
|


| Gene Summary for SDC3 |
| Basic gene info. | Gene symbol | SDC3 |
| Gene name | syndecan 3 | |
| Synonyms | SDCN|SYND3 | |
| Cytomap | UCSC genome browser: 1p35.2 | |
| Genomic location | chr1 :31342312-31381480 | |
| Type of gene | protein-coding | |
| RefGenes | NM_014654.3, | |
| Ensembl id | ENSG00000162512 | |
| Description | N-syndecansyndecan neural typesyndecan proteoglycan 3syndecan-3 | |
| Modification date | 20141207 | |
| dbXrefs | MIM : 186357 | |
| HGNC : HGNC | ||
| HPRD : 01719 | ||
| Protein | UniProt: go to UniProt's Cross Reference DB Table | |
| Expression | CleanEX: HS_SDC3 | |
| BioGPS: 9672 | ||
| Gene Expression Atlas: ENSG00000162512 | ||
| The Human Protein Atlas: ENSG00000162512 | ||
| Pathway | NCI Pathway Interaction Database: SDC3 | |
| KEGG: SDC3 | ||
| REACTOME: SDC3 | ||
| ConsensusPathDB | ||
| Pathway Commons: SDC3 | ||
| Metabolism | MetaCyc: SDC3 | |
| HUMANCyc: SDC3 | ||
| Regulation | Ensembl's Regulation: ENSG00000162512 | |
| miRBase: chr1 :31,342,312-31,381,480 | ||
| TargetScan: NM_014654 | ||
| cisRED: ENSG00000162512 | ||
| Context | iHOP: SDC3 | |
| cancer metabolism search in PubMed: SDC3 | ||
| UCL Cancer Institute: SDC3 | ||
| Assigned class in ccmGDB | C | |
| Top |
| Phenotypic Information for SDC3(metabolism pathway, cancer, disease, phenome) |
| Cancer | CGAP: SDC3 |
| Familial Cancer Database: SDC3 | |
| * This gene is included in those cancer gene databases. |
|
|
|
|
|
| . | |||||||||||||||||||||||||||||||||||||||||||||||||||||||||||||||||||||||||||||||||||||||||||||||||||||||||||||||||||||||||||||||||||||||||||||||||||||||||||||||||||||||||||||||||||||||||||||||||||||||||||||||||||||||||||||||||||||||||||||||||||||||||||||||||||||||||||||||||||||||||||||||||||||||||||||||||||||||||||||||||||||||
Oncogene 1 | Significant driver gene in | ||||||||||||||||||||||||||||||||||||||||||||||||||||||||||||||||||||||||||||||||||||||||||||||||||||||||||||||||||||||||||||||||||||||||||||||||||||||||||||||||||||||||||||||||||||||||||||||||||||||||||||||||||||||||||||||||||||||||||||||||||||||||||||||||||||||||||||||||||||||||||||||||||||||||||||||||||||||||||||||||||||||||||||
| cf) number; DB name 1 Oncogene; http://nar.oxfordjournals.org/content/35/suppl_1/D721.long, 2 Tumor Suppressor gene; https://bioinfo.uth.edu/TSGene/, 3 Cancer Gene Census; http://www.nature.com/nrc/journal/v4/n3/abs/nrc1299.html, 4 CancerGenes; http://nar.oxfordjournals.org/content/35/suppl_1/D721.long, 5 Network of Cancer Gene; http://ncg.kcl.ac.uk/index.php, 1Therapeutic Vulnerabilities in Cancer; http://cbio.mskcc.org/cancergenomics/statius/ |
| REACTOME_METABOLISM_OF_CARBOHYDRATES | |
| OMIM | |
| Orphanet | |
| Disease | KEGG Disease: SDC3 |
| MedGen: SDC3 (Human Medical Genetics with Condition) | |
| ClinVar: SDC3 | |
| Phenotype | MGI: SDC3 (International Mouse Phenotyping Consortium) |
| PhenomicDB: SDC3 | |
| Mutations for SDC3 |
| * Under tables are showing count per each tissue to give us broad intuition about tissue specific mutation patterns.You can go to the detailed page for each mutation database's web site. |
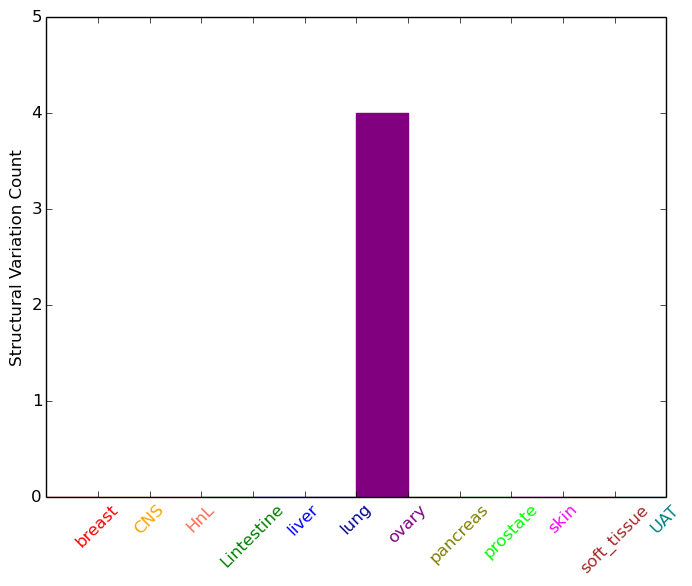
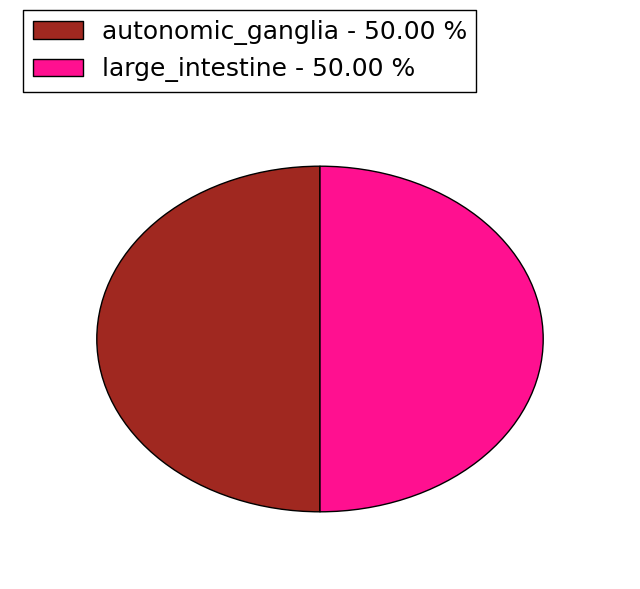
| - Statistics for Tissue and Mutation type | Top |
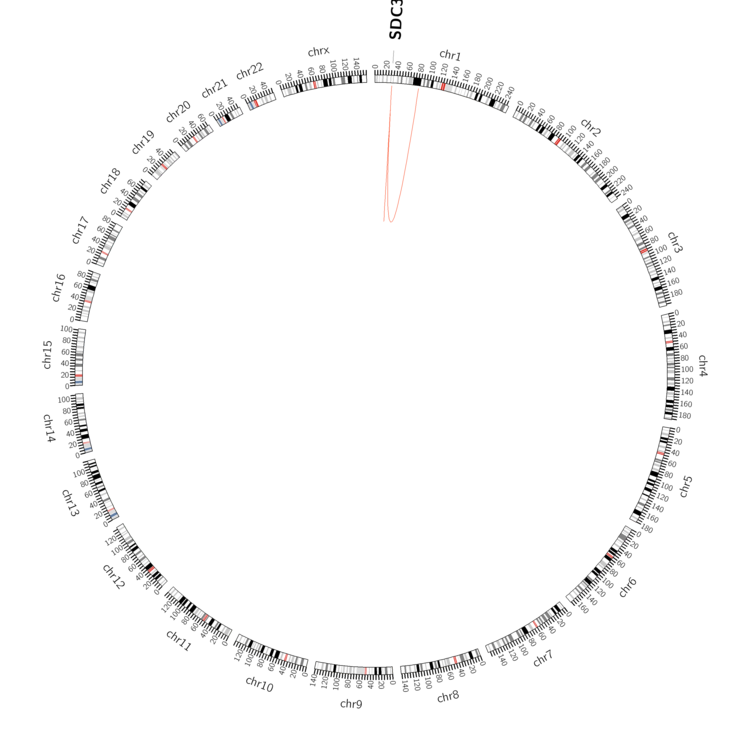 |
| - For Inter-chromosomal Variations |
| There's no inter-chromosomal structural variation. |
| - For Intra-chromosomal Variations |
| * Intra-chromosomal variantions includes 'intrachromosomal amplicon to amplicon', 'intrachromosomal amplicon to non-amplified dna', 'intrachromosomal deletion', 'intrachromosomal fold-back inversion', 'intrachromosomal inversion', 'intrachromosomal tandem duplication', 'Intrachromosomal unknown type', 'intrachromosomal with inverted orientation', 'intrachromosomal with non-inverted orientation'. |
 |
| Sample | Symbol_a | Chr_a | Start_a | End_a | Symbol_b | Chr_b | Start_b | End_b |
| ovary | SDC3 | chr1 | 31363439 | 31363459 | SDC3 | chr1 | 31365464 | 31365484 |
| ovary | SDC3 | chr1 | 31364415 | 31364435 | SDC3 | chr1 | 31365778 | 31365798 |
| ovary | SDC3 | chr1 | 31366737 | 31366757 | chr1 | 81591224 | 81591244 | |
| ovary | SDC3 | chr1 | 31376217 | 31376237 | SDC3 | chr1 | 31377405 | 31377425 |
| cf) Tissue number; Tissue name (1;Breast, 2;Central_nervous_system, 3;Haematopoietic_and_lymphoid_tissue, 4;Large_intestine, 5;Liver, 6;Lung, 7;Ovary, 8;Pancreas, 9;Prostate, 10;Skin, 11;Soft_tissue, 12;Upper_aerodigestive_tract) |
| * From mRNA Sanger sequences, Chitars2.0 arranged chimeric transcripts. This table shows SDC3 related fusion information. |
| ID | Head Gene | Tail Gene | Accession | Gene_a | qStart_a | qEnd_a | Chromosome_a | tStart_a | tEnd_a | Gene_a | qStart_a | qEnd_a | Chromosome_a | tStart_a | tEnd_a |
| DA180215 | MAP7D2 | 1 | 125 | X | 20134892 | 20135016 | SDC3 | 126 | 569 | 1 | 31345191 | 31345634 | |
| BF935530 | LAS1L | 5 | 127 | X | 64739134 | 64739256 | SDC3 | 113 | 294 | 1 | 31345192 | 31345374 | |
| AI148370 | SIRT6 | 2 | 67 | 19 | 4174106 | 4174171 | SDC3 | 64 | 484 | 1 | 31346053 | 31346473 | |
| AW166100 | YWHAH | 18 | 412 | 22 | 32353196 | 32353590 | SDC3 | 407 | 502 | 1 | 31378064 | 31378159 | |
| DB262991 | MYH11 | 1 | 351 | 16 | 15931864 | 15950885 | SDC3 | 345 | 598 | 1 | 31343631 | 31349869 | |
| BM991776 | SDC3 | 18 | 367 | 1 | 31342313 | 31342662 | SDC3 | 360 | 651 | 1 | 31345788 | 31346079 | |
| BE925576 | CD97 | 1 | 192 | 19 | 14518023 | 14518974 | SDC3 | 186 | 304 | 1 | 31344486 | 31344859 | |
| DA194626 | LOC100507412 | 1 | 151 | ? | 112030 | 112180 | SDC3 | 152 | 543 | 1 | 31344753 | 31345143 | |
| Top |
| Mutation type/ Tissue ID | brca | cns | cerv | endome | haematopo | kidn | Lintest | liver | lung | ns | ovary | pancre | prost | skin | stoma | thyro | urina | |||
| Total # sample | 1 | 1 | 2 | |||||||||||||||||
| GAIN (# sample) | 1 | 1 | 2 | |||||||||||||||||
| LOSS (# sample) |
| cf) Tissue ID; Tissue type (1; Breast, 2; Central_nervous_system, 3; Cervix, 4; Endometrium, 5; Haematopoietic_and_lymphoid_tissue, 6; Kidney, 7; Large_intestine, 8; Liver, 9; Lung, 10; NS, 11; Ovary, 12; Pancreas, 13; Prostate, 14; Skin, 15; Stomach, 16; Thyroid, 17; Urinary_tract) |
| Top |
|
 |
| Top |
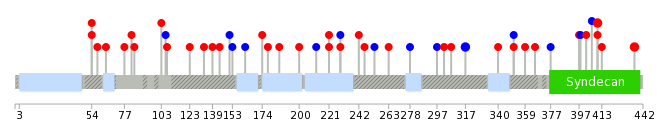
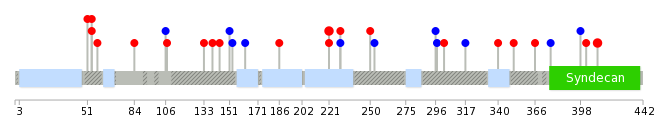
| Stat. for Non-Synonymous SNVs (# total SNVs=25) | (# total SNVs=11) |
 |  |
(# total SNVs=2) | (# total SNVs=0) |
 |
| Top |
| * When you move the cursor on each content, you can see more deailed mutation information on the Tooltip. Those are primary_site,primary_histology,mutation(aa),pubmedID. |
| GRCh37 position | Mutation(aa) | Unique sampleID count |
| chr1:31346080-31346080 | p.K436R | 2 |
| chr1:31346158-31346158 | p.R410H | 2 |
| chr1:31350004-31350004 | p.Q89* | 2 |
| chr1:31347355-31347355 | p.F317F | 2 |
| chr1:31349607-31349607 | p.T221M | 2 |
| chr1:31349713-31349713 | p.A186T | 1 |
| chr1:31347210-31347210 | p.D366Y | 1 |
| chr1:31349901-31349901 | p.G123D | 1 |
| chr1:31349482-31349482 | p.A263T | 1 |
| chr1:31351566-31351566 | p.N54H | 1 |
| Top |
|
 |
| Point Mutation/ Tissue ID | 1 | 2 | 3 | 4 | 5 | 6 | 7 | 8 | 9 | 10 | 11 | 12 | 13 | 14 | 15 | 16 | 17 | 18 | 19 | 20 |
| # sample | 2 | 1 | 9 | 1 | 1 | 2 | 1 | 7 | 4 | 1 | 3 | |||||||||
| # mutation | 2 | 1 | 8 | 1 | 1 | 2 | 1 | 7 | 4 | 1 | 3 | |||||||||
| nonsynonymous SNV | 1 | 5 | 1 | 1 | 2 | 4 | 4 | 1 | 1 | |||||||||||
| synonymous SNV | 1 | 1 | 3 | 1 | 3 | 2 |
| cf) Tissue ID; Tissue type (1; BLCA[Bladder Urothelial Carcinoma], 2; BRCA[Breast invasive carcinoma], 3; CESC[Cervical squamous cell carcinoma and endocervical adenocarcinoma], 4; COAD[Colon adenocarcinoma], 5; GBM[Glioblastoma multiforme], 6; Glioma Low Grade, 7; HNSC[Head and Neck squamous cell carcinoma], 8; KICH[Kidney Chromophobe], 9; KIRC[Kidney renal clear cell carcinoma], 10; KIRP[Kidney renal papillary cell carcinoma], 11; LAML[Acute Myeloid Leukemia], 12; LUAD[Lung adenocarcinoma], 13; LUSC[Lung squamous cell carcinoma], 14; OV[Ovarian serous cystadenocarcinoma ], 15; PAAD[Pancreatic adenocarcinoma], 16; PRAD[Prostate adenocarcinoma], 17; SKCM[Skin Cutaneous Melanoma], 18:STAD[Stomach adenocarcinoma], 19:THCA[Thyroid carcinoma], 20:UCEC[Uterine Corpus Endometrial Carcinoma]) |
| Top |
| * We represented just top 10 SNVs. When you move the cursor on each content, you can see more deailed mutation information on the Tooltip. Those are primary_site, primary_histology, mutation(aa), pubmedID. |
| Genomic Position | Mutation(aa) | Unique sampleID count |
| chr1:31349607 | p.T221M | 3 |
| chr1:31346158 | p.R410H | 2 |
| chr1:31347415 | p.A229A | 1 |
| chr1:31349839 | p.R51H | 1 |
| chr1:31347418 | p.A229V | 1 |
| chr1:31349853 | p.A186T | 1 |
| chr1:31349510 | p.F402V | 1 |
| chr1:31349871 | p.T162T | 1 |
| chr1:31346183 | p.L398L | 1 |
| chr1:31349520 | p.S153S | 1 |
| * Copy number data were extracted from TCGA using R package TCGA-Assembler. The URLs of all public data files on TCGA DCC data server were gathered on Jan-05-2015. Function ProcessCNAData in TCGA-Assembler package was used to obtain gene-level copy number value which is calculated as the average copy number of the genomic region of a gene. |
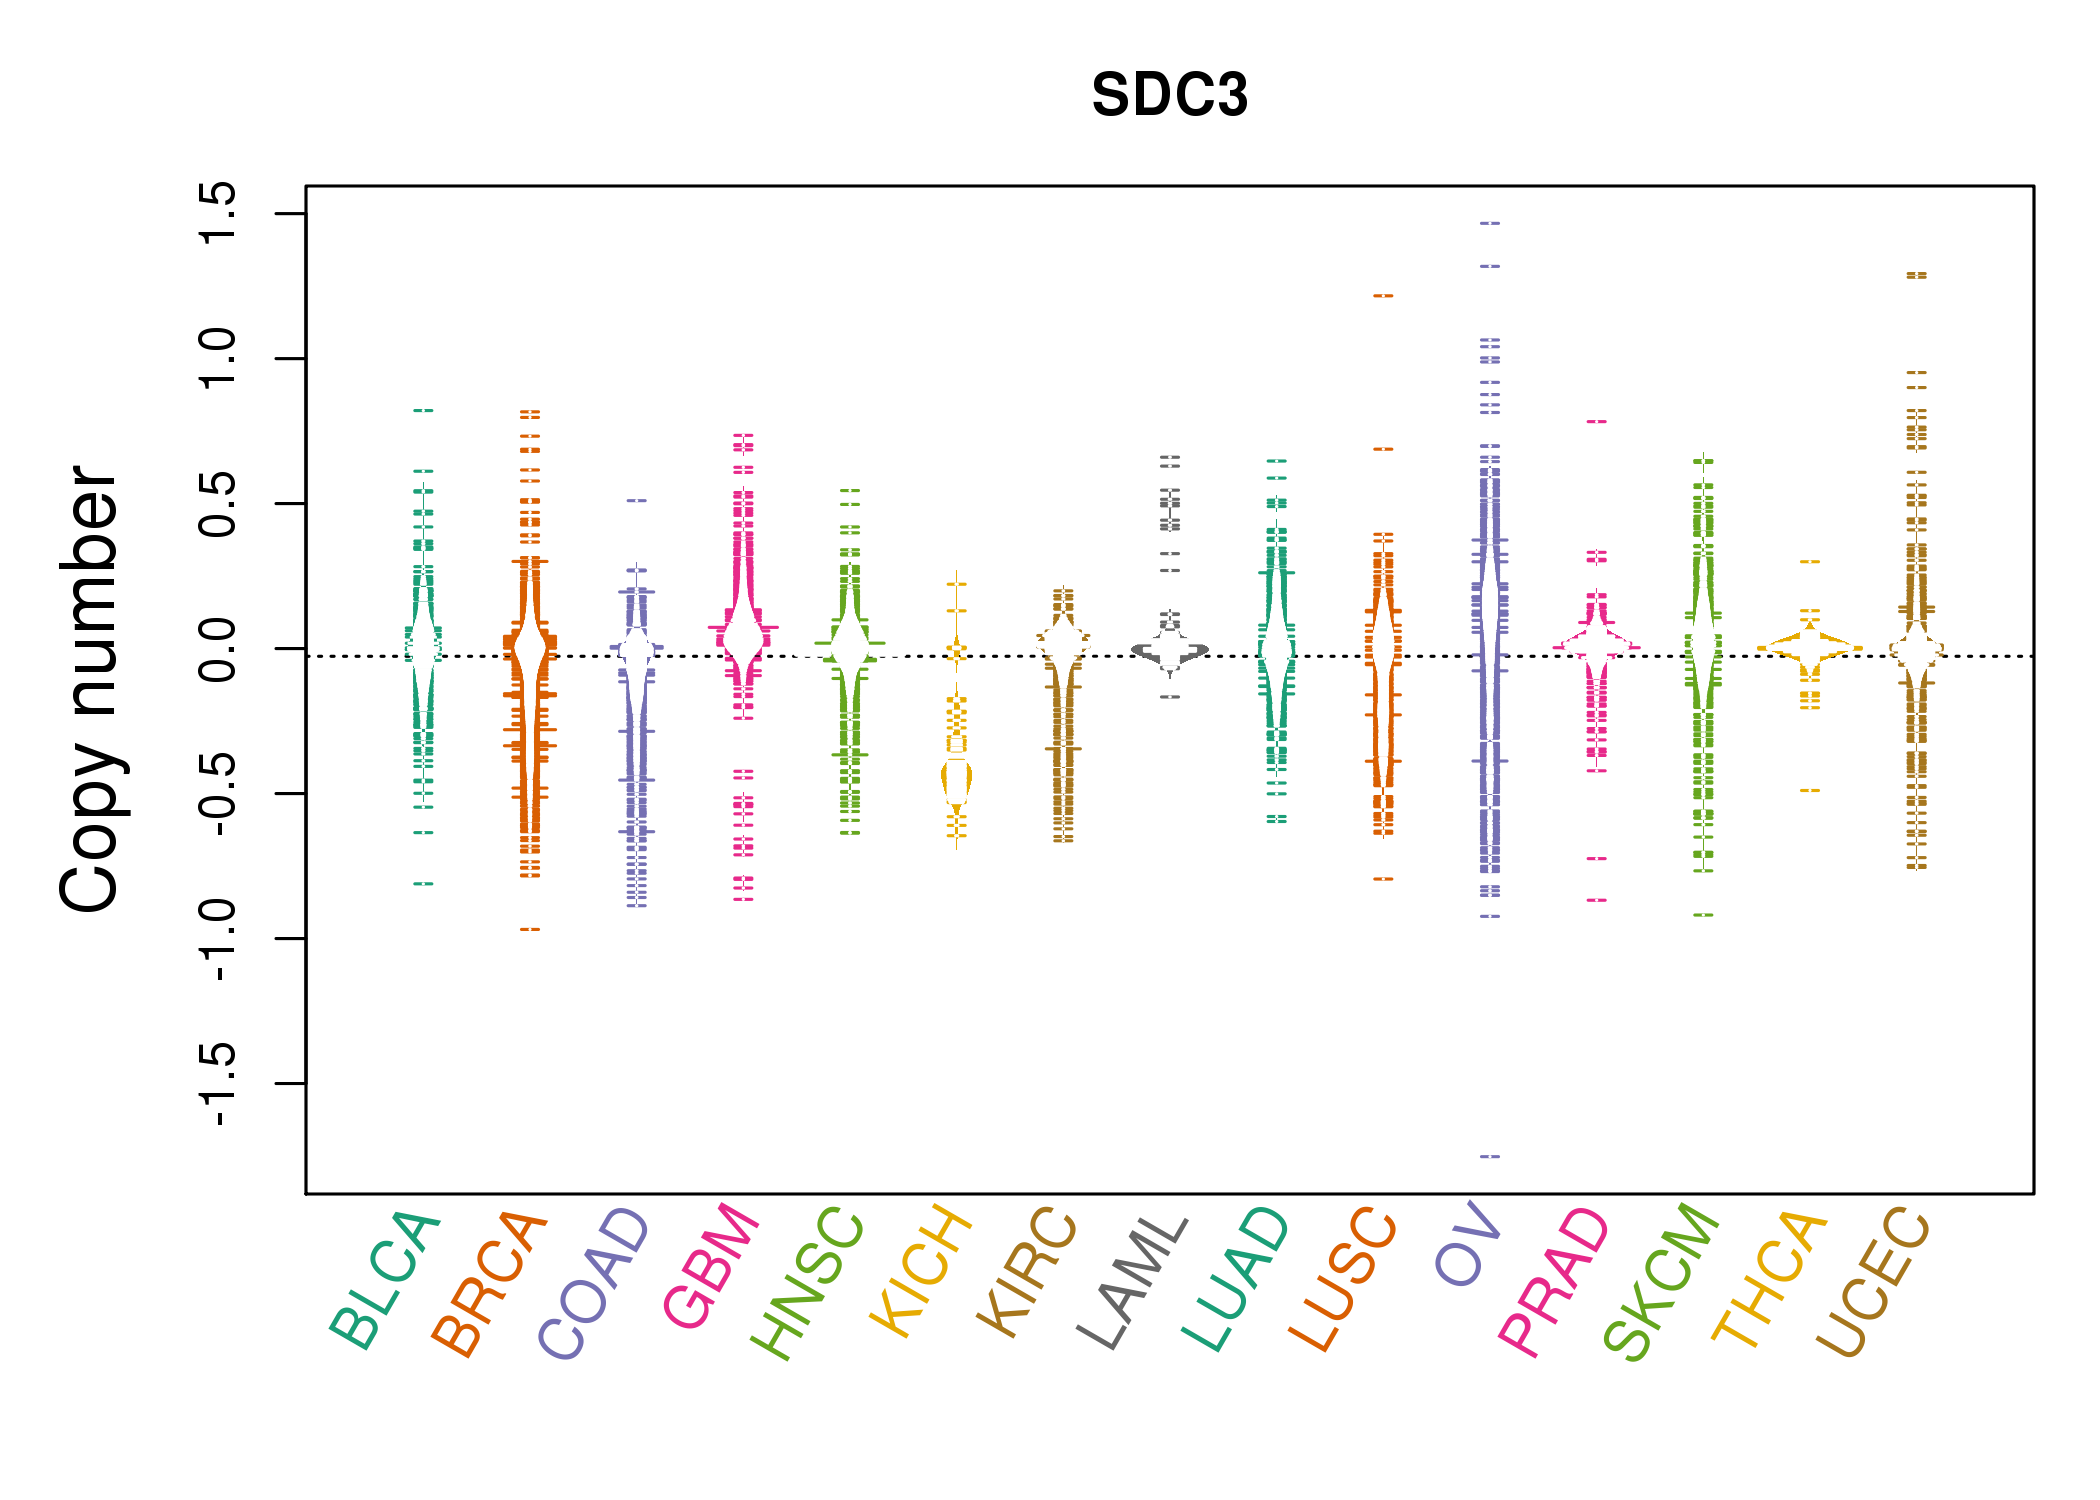 |
| cf) Tissue ID[Tissue type]: BLCA[Bladder Urothelial Carcinoma], BRCA[Breast invasive carcinoma], CESC[Cervical squamous cell carcinoma and endocervical adenocarcinoma], COAD[Colon adenocarcinoma], GBM[Glioblastoma multiforme], Glioma Low Grade, HNSC[Head and Neck squamous cell carcinoma], KICH[Kidney Chromophobe], KIRC[Kidney renal clear cell carcinoma], KIRP[Kidney renal papillary cell carcinoma], LAML[Acute Myeloid Leukemia], LUAD[Lung adenocarcinoma], LUSC[Lung squamous cell carcinoma], OV[Ovarian serous cystadenocarcinoma ], PAAD[Pancreatic adenocarcinoma], PRAD[Prostate adenocarcinoma], SKCM[Skin Cutaneous Melanoma], STAD[Stomach adenocarcinoma], THCA[Thyroid carcinoma], UCEC[Uterine Corpus Endometrial Carcinoma] |
| Top |
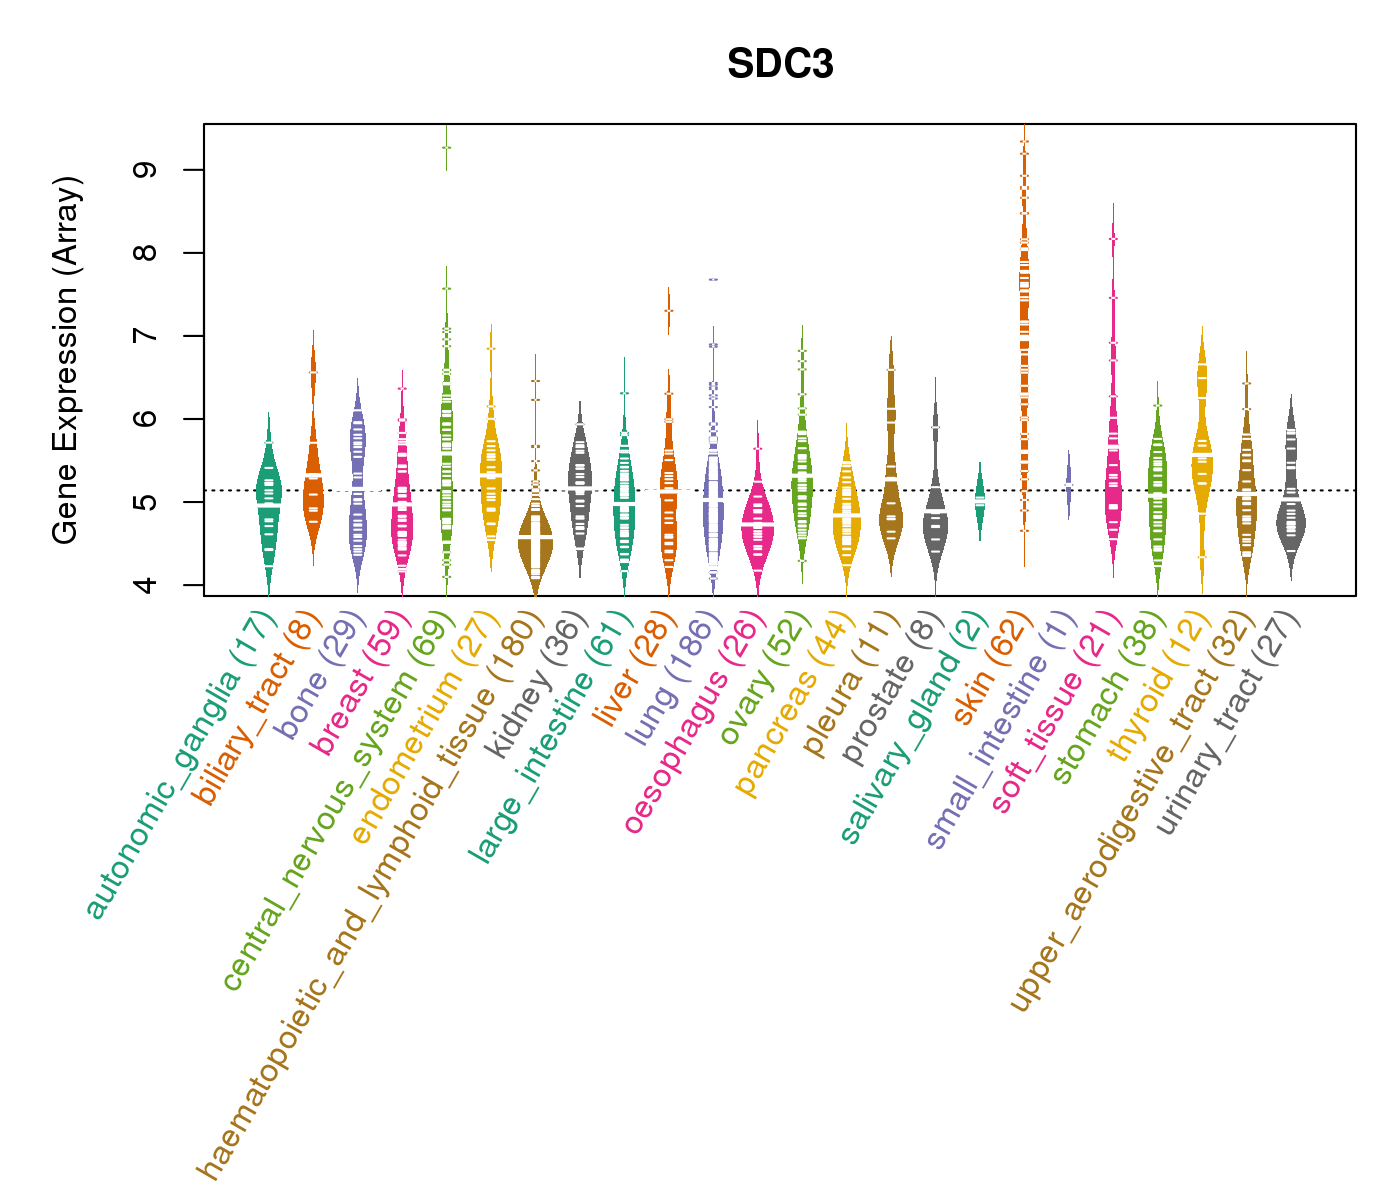
| Gene Expression for SDC3 |
| * CCLE gene expression data were extracted from CCLE_Expression_Entrez_2012-10-18.res: Gene-centric RMA-normalized mRNA expression data. |
 |
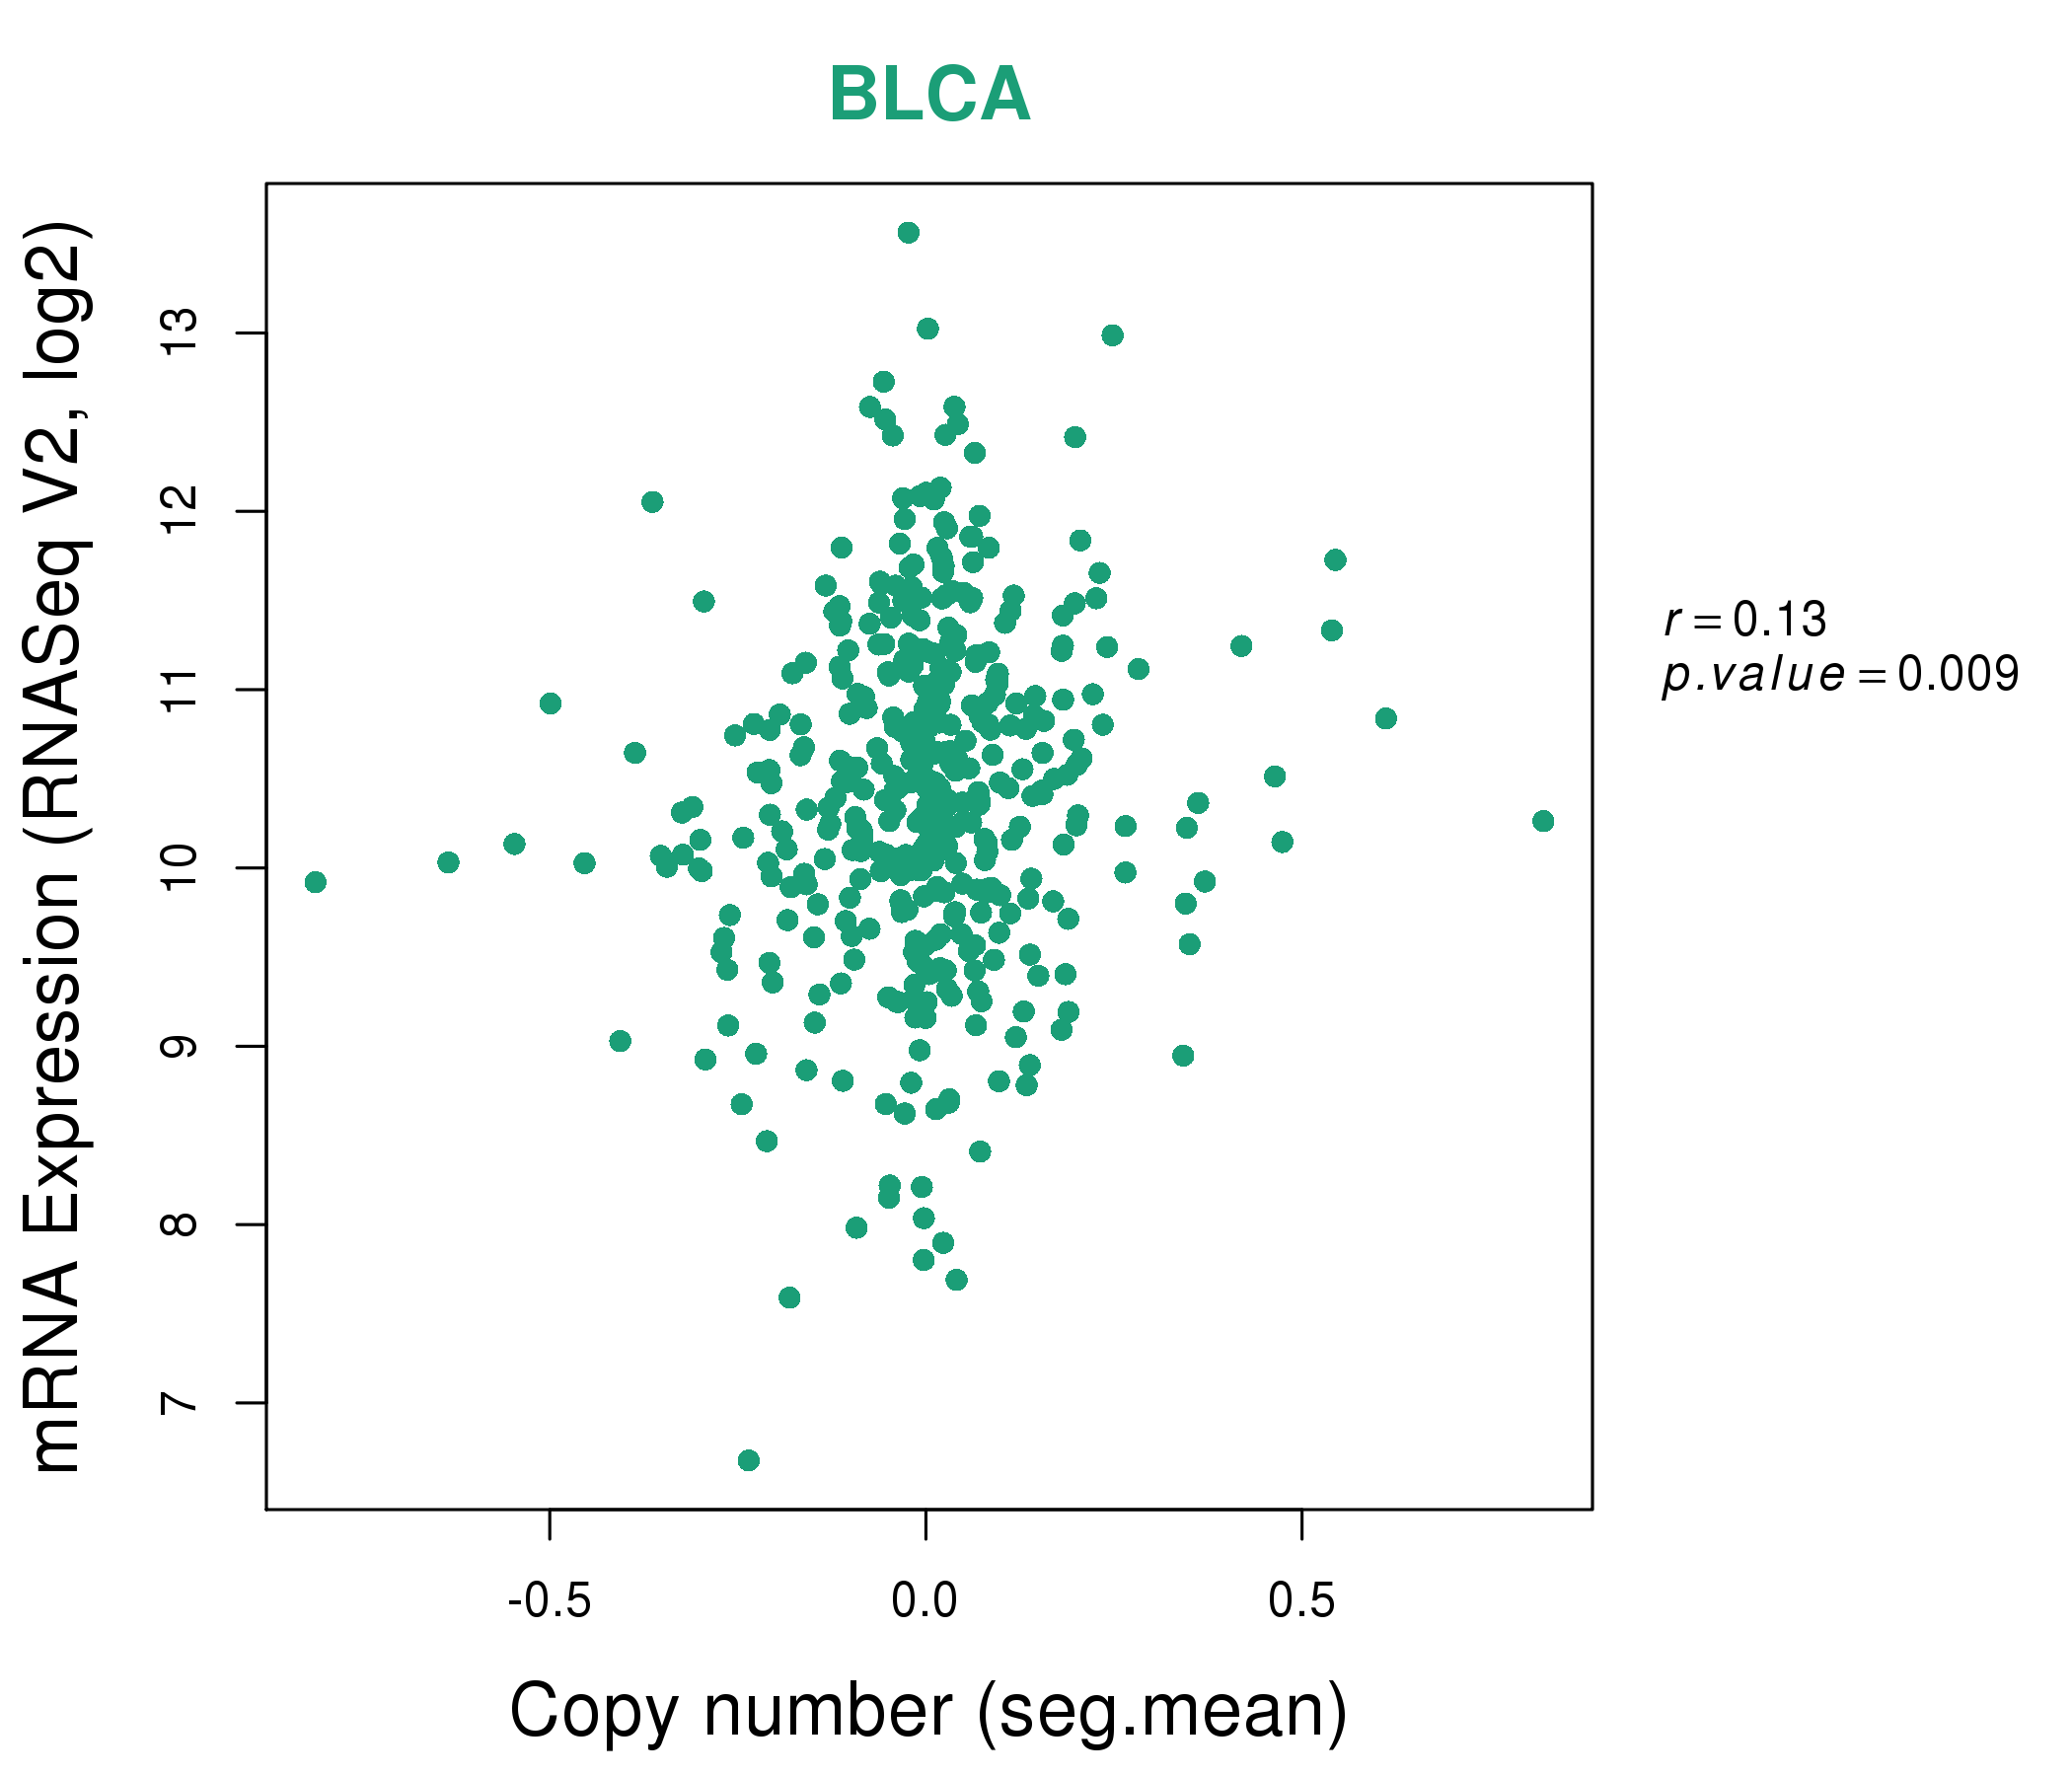
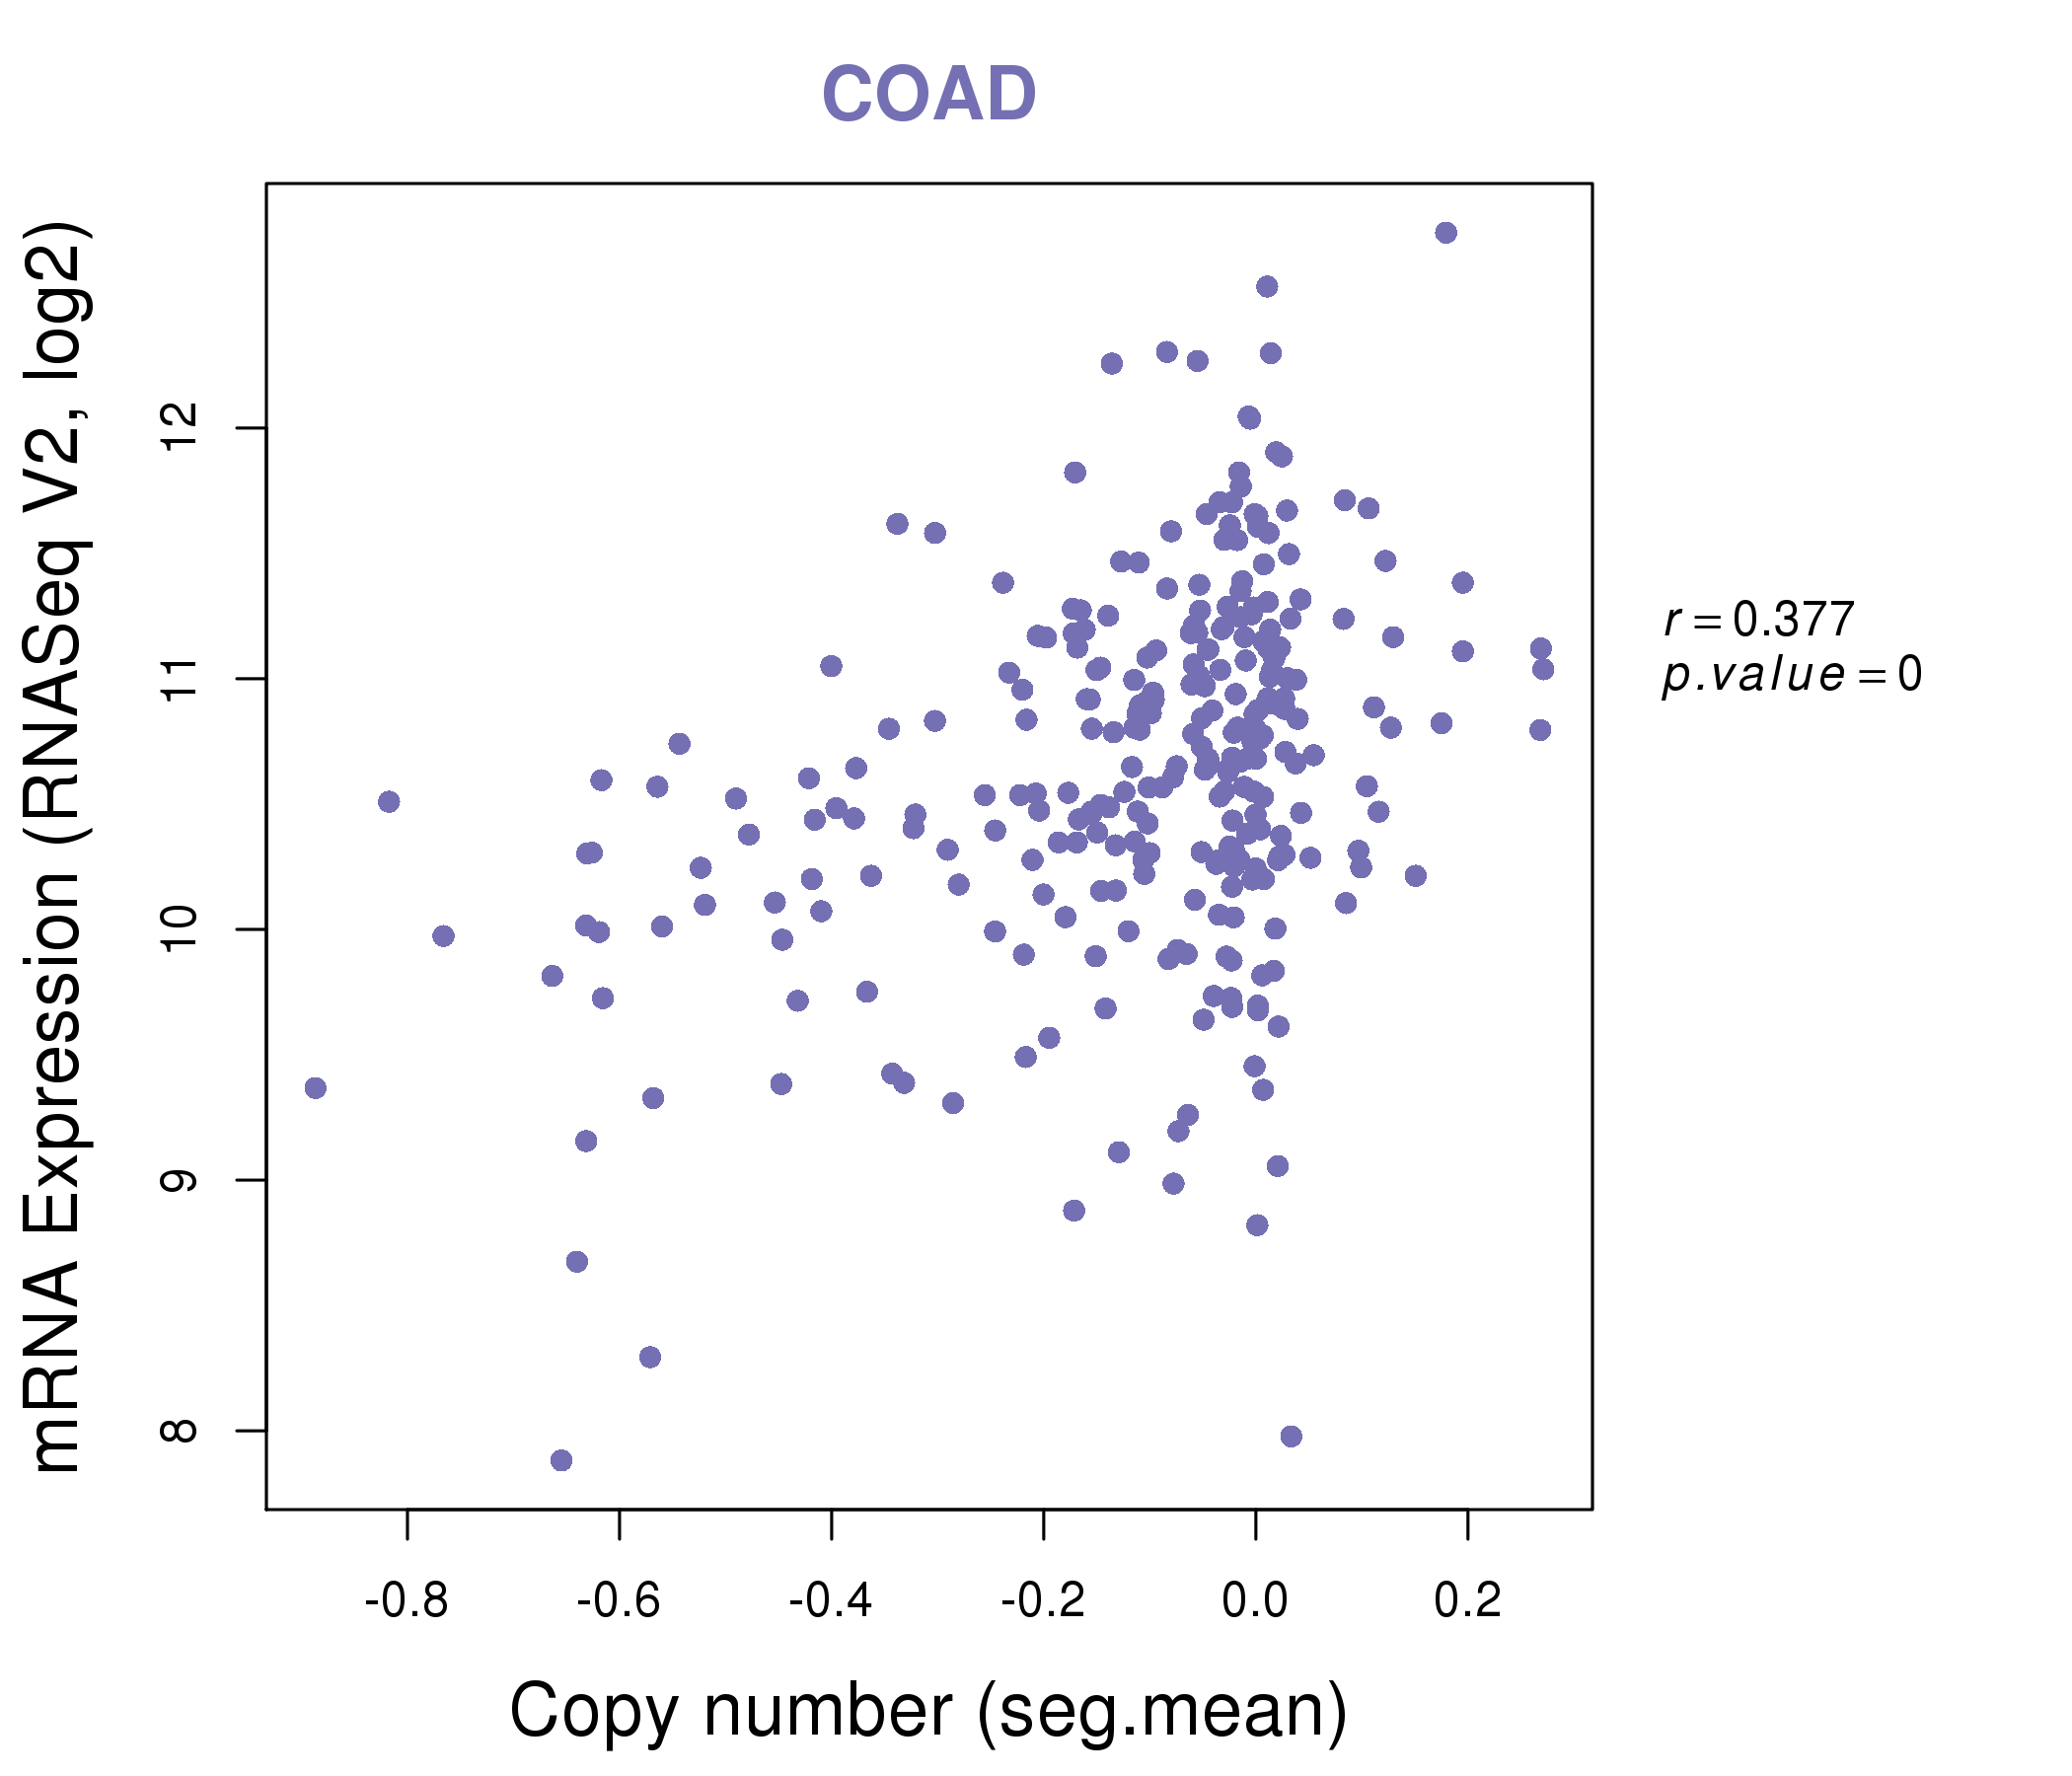
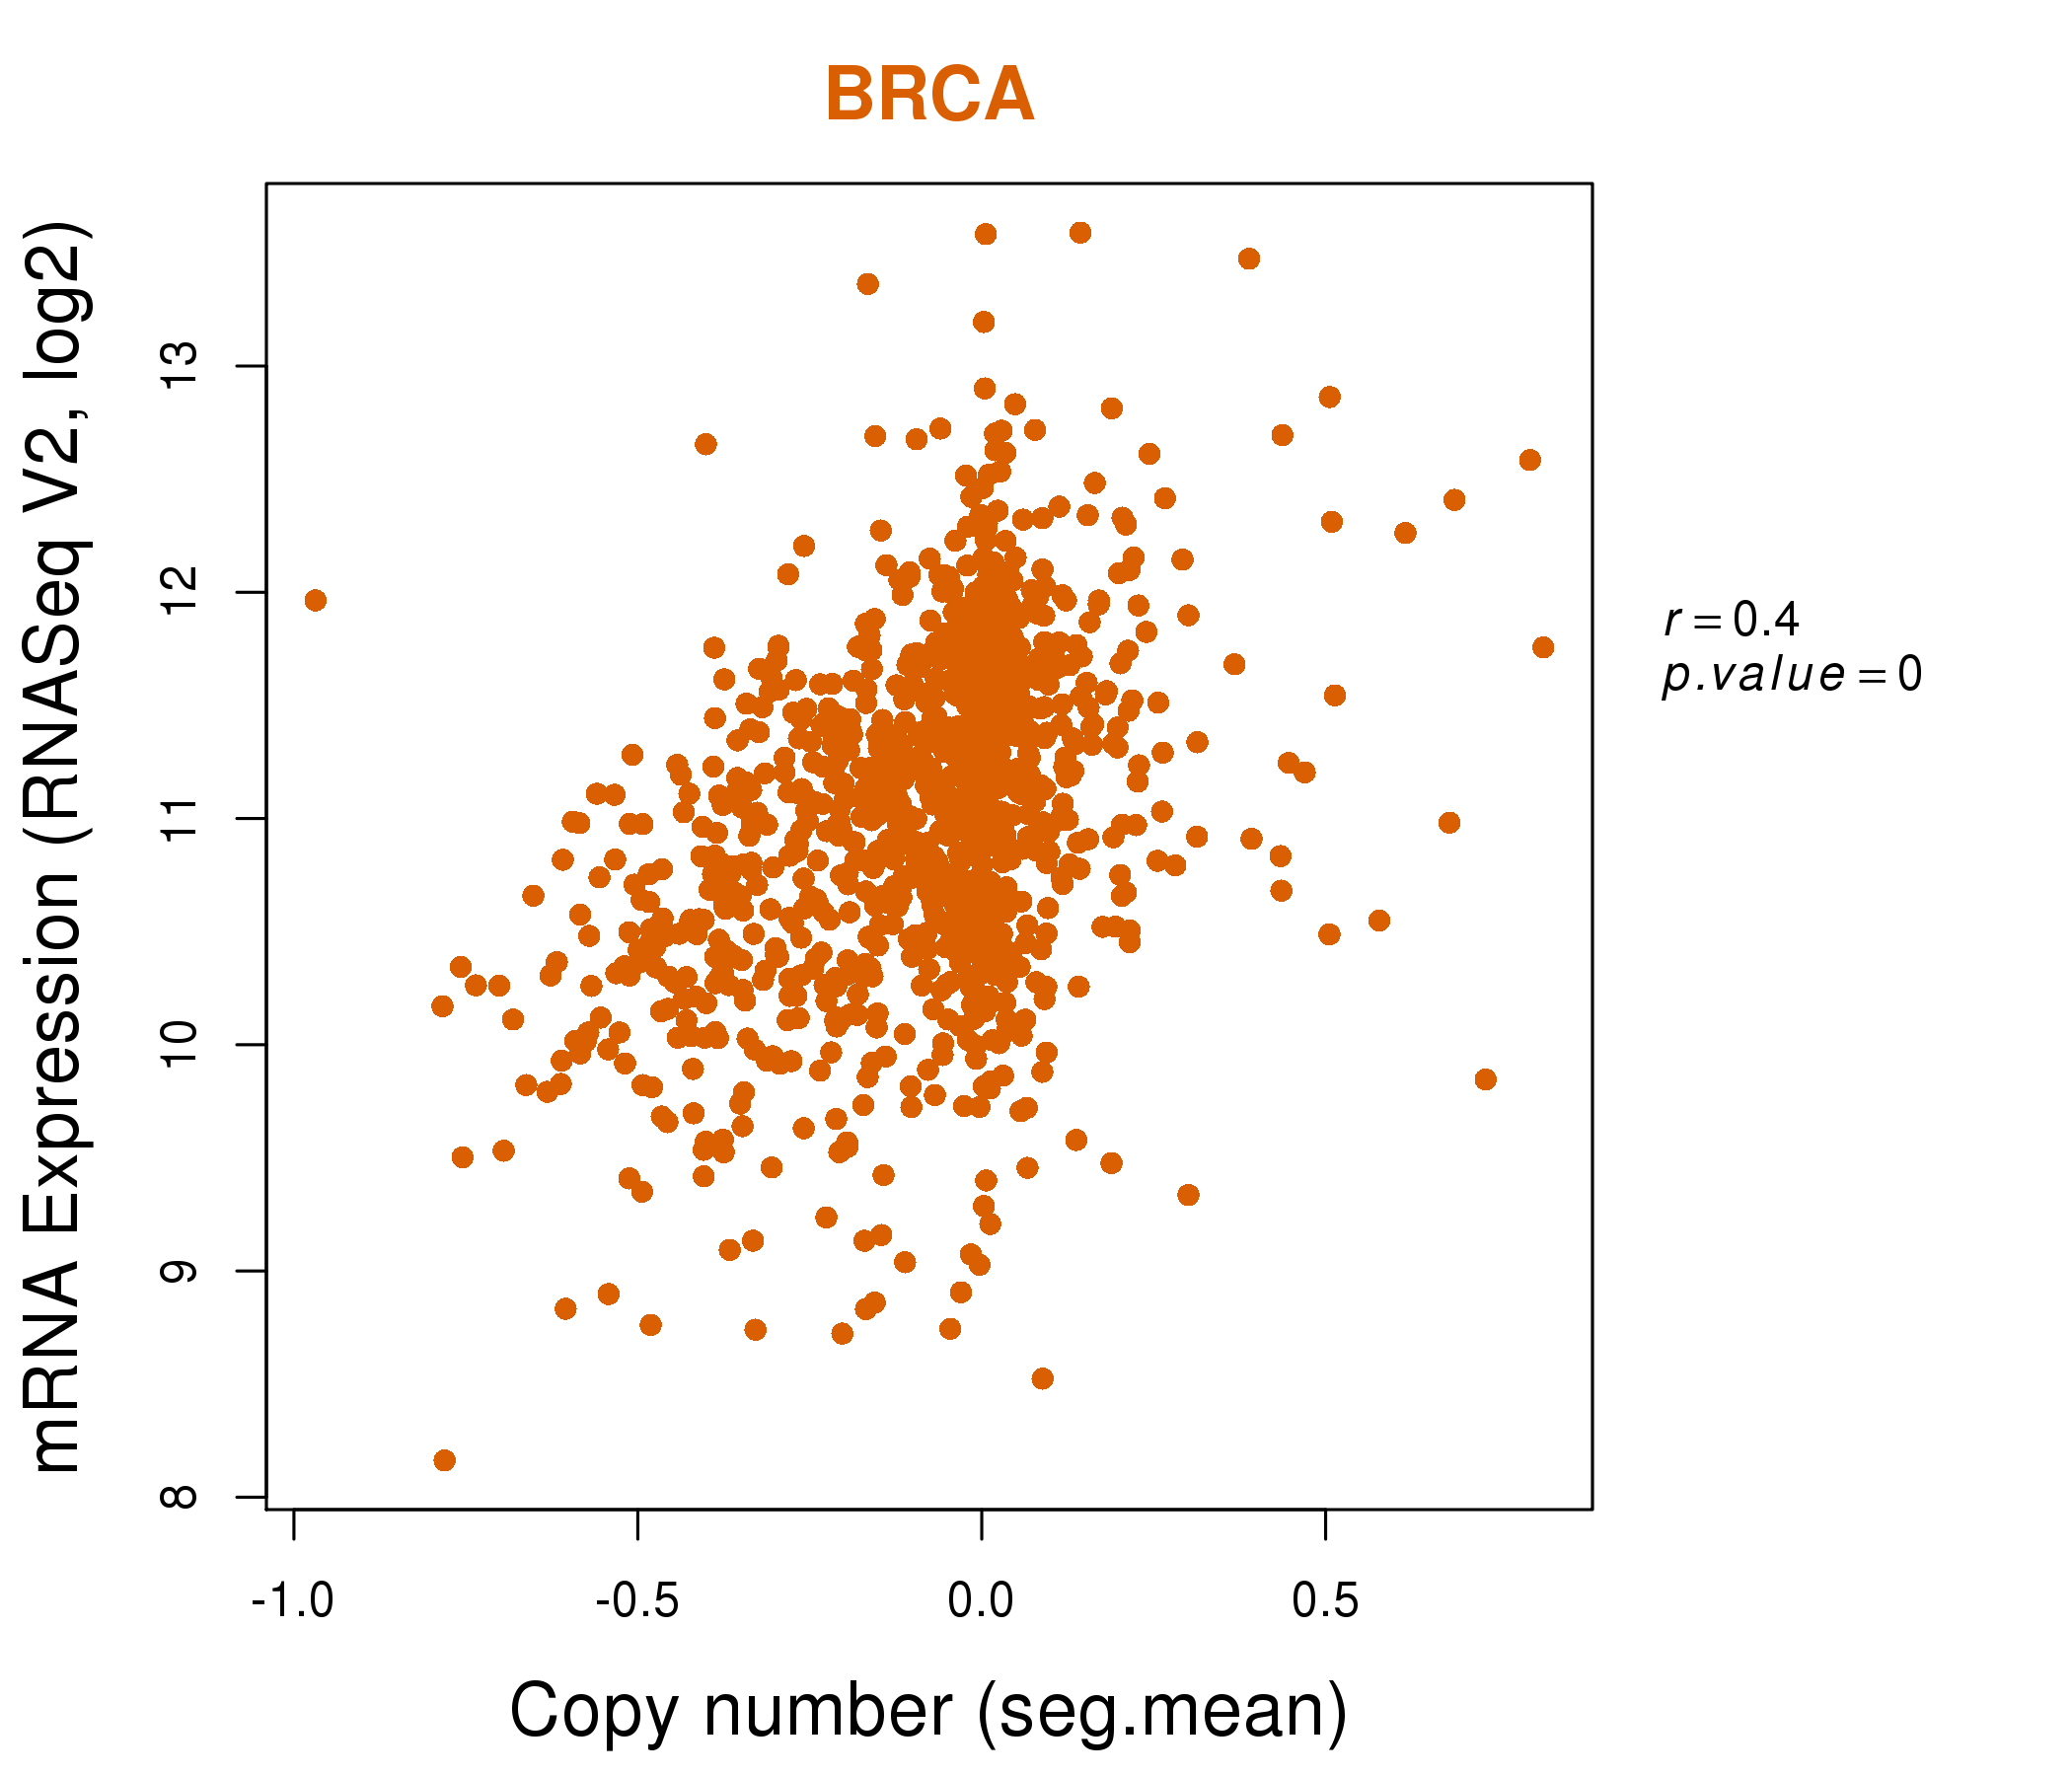
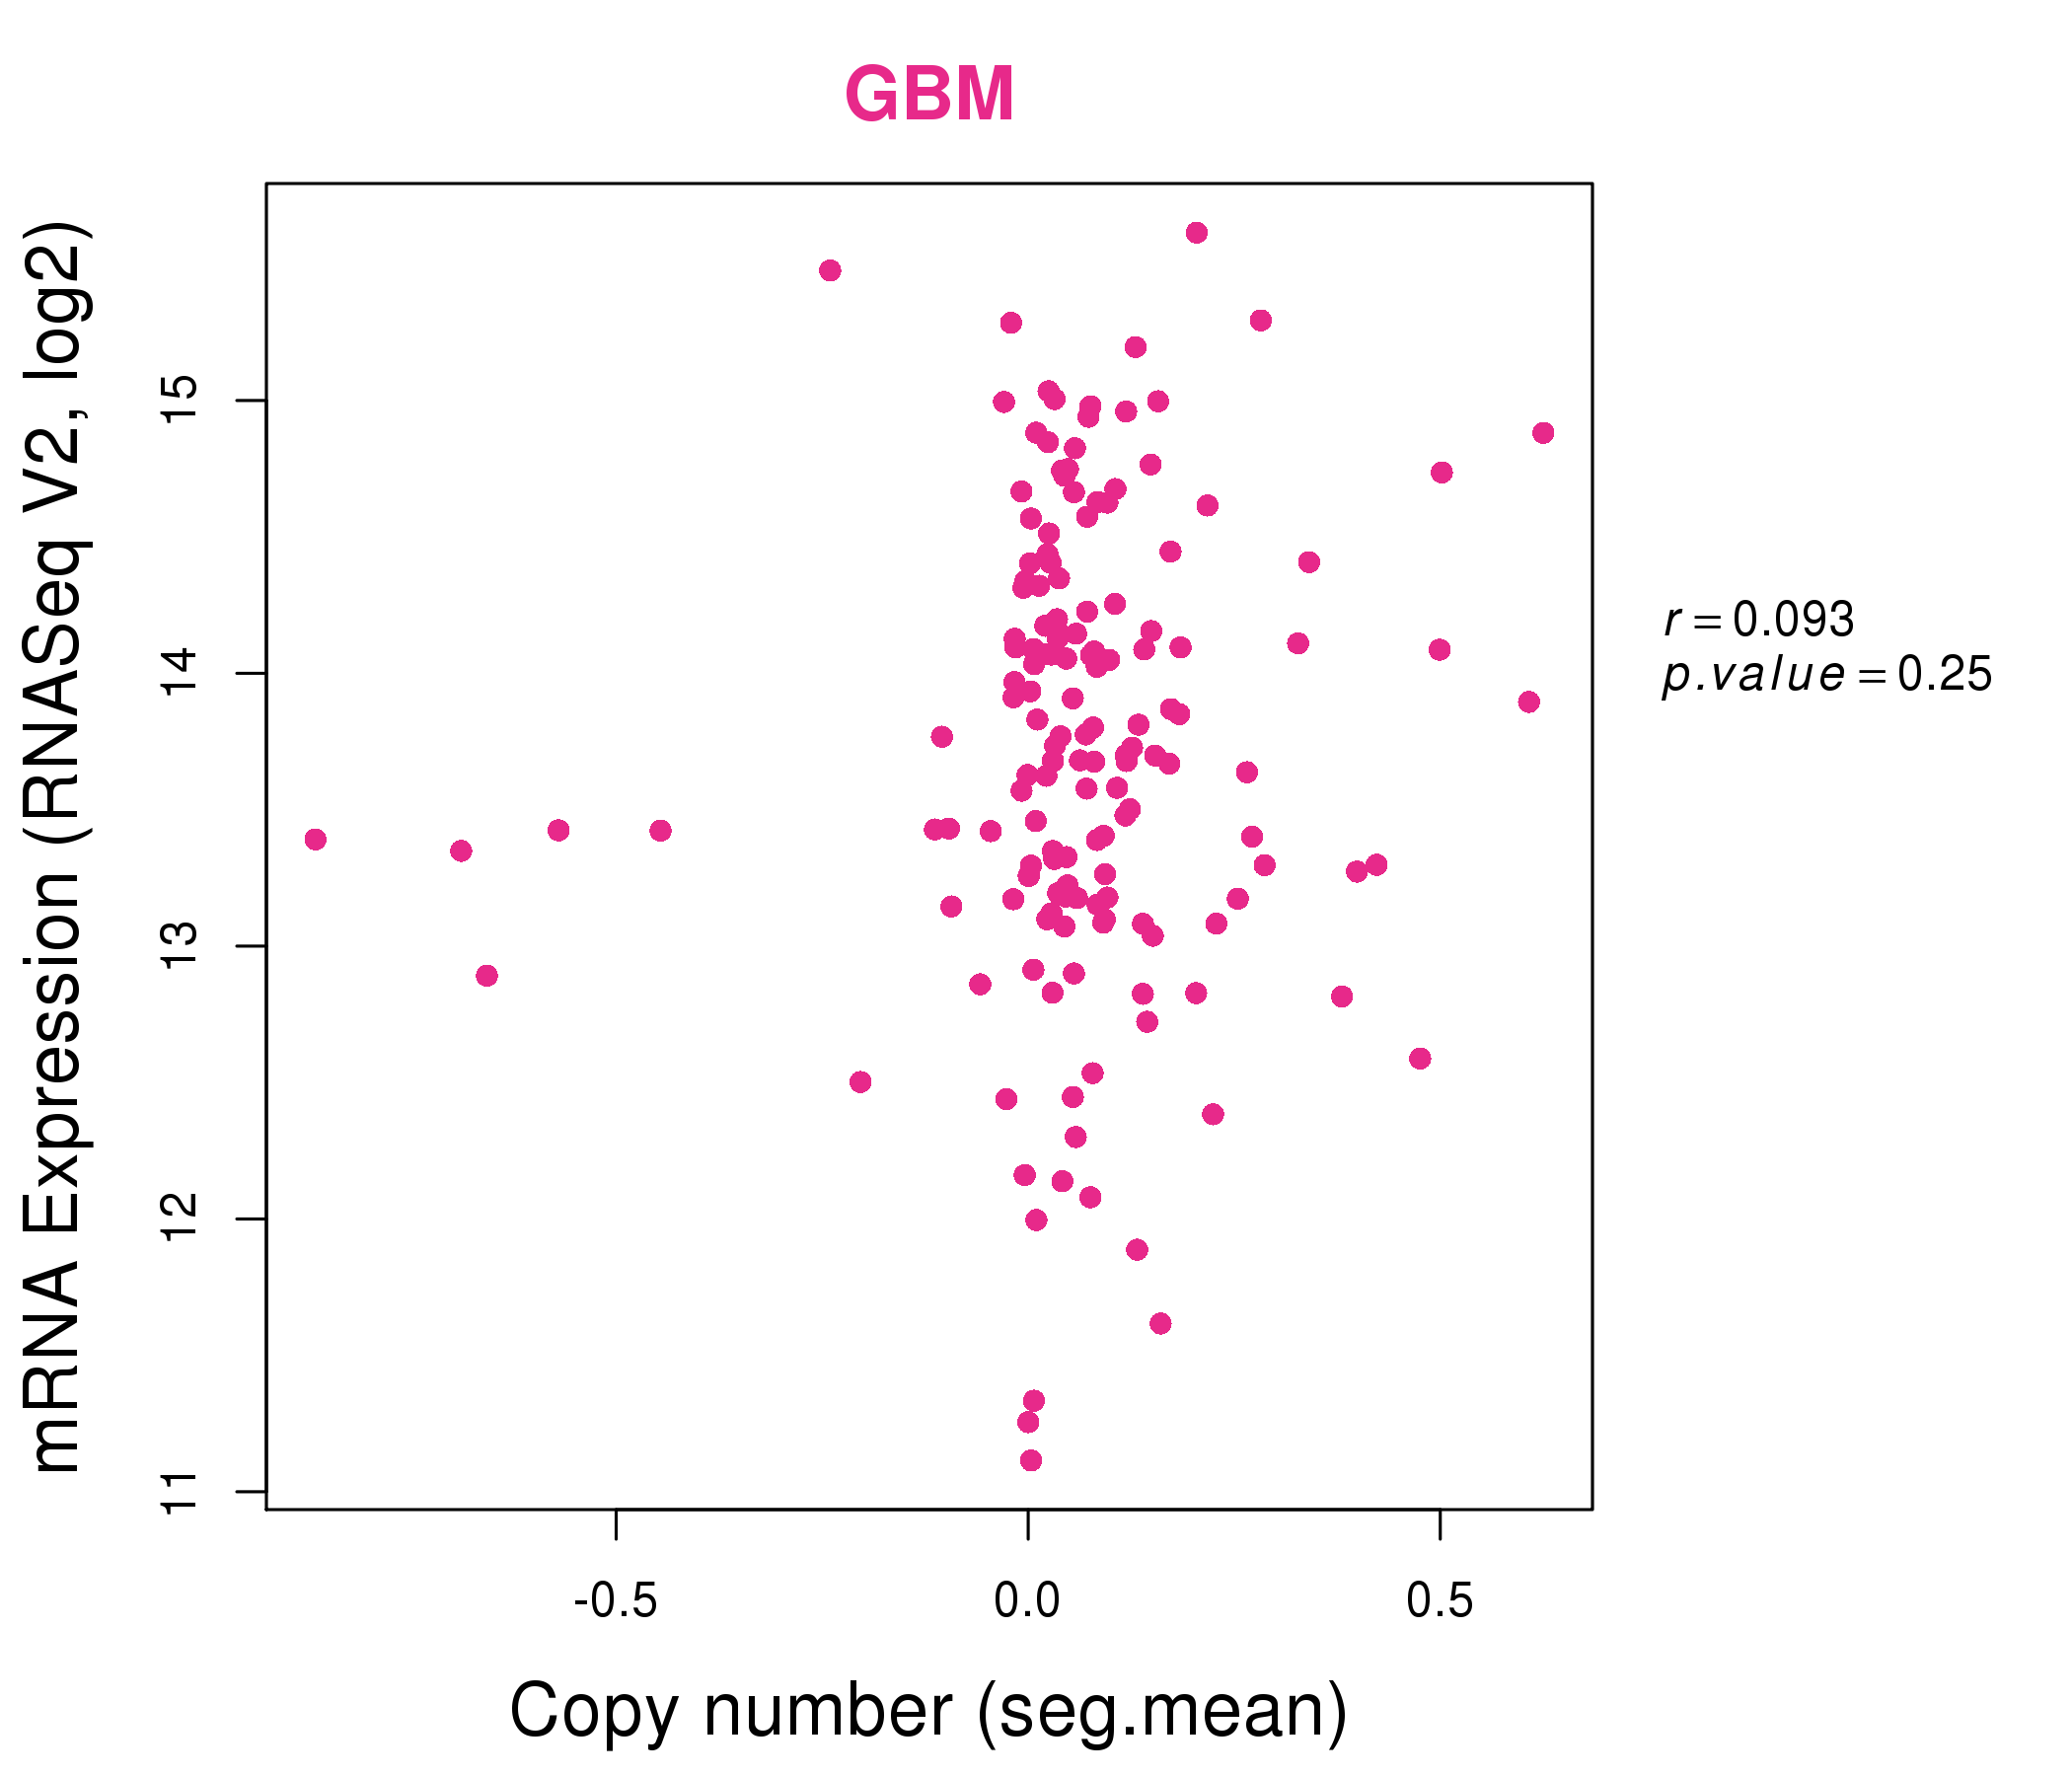
| * Normalized gene expression data of RNASeqV2 was extracted from TCGA using R package TCGA-Assembler. The URLs of all public data files on TCGA DCC data server were gathered at Jan-05-2015. Only eight cancer types have enough normal control samples for differential expression analysis. (t test, adjusted p<0.05 (using Benjamini-Hochberg FDR)) |
 |
| Top |
| * This plots show the correlation between CNV and gene expression. |
: Open all plots for all cancer types
 |
|
 |
|
| Top |
| Gene-Gene Network Information |
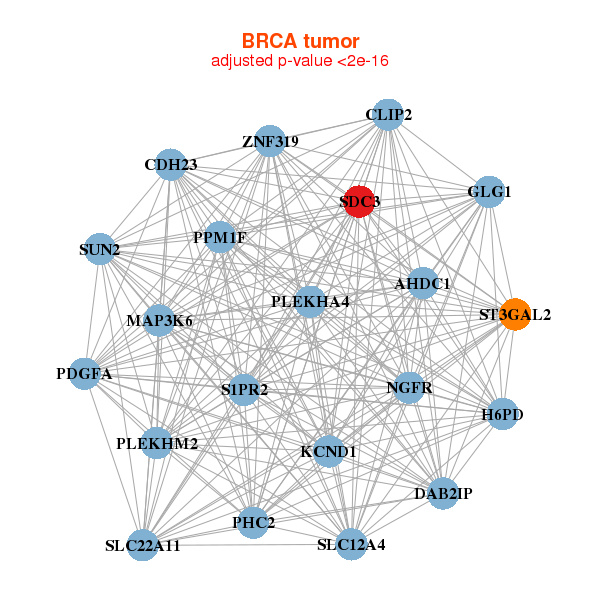
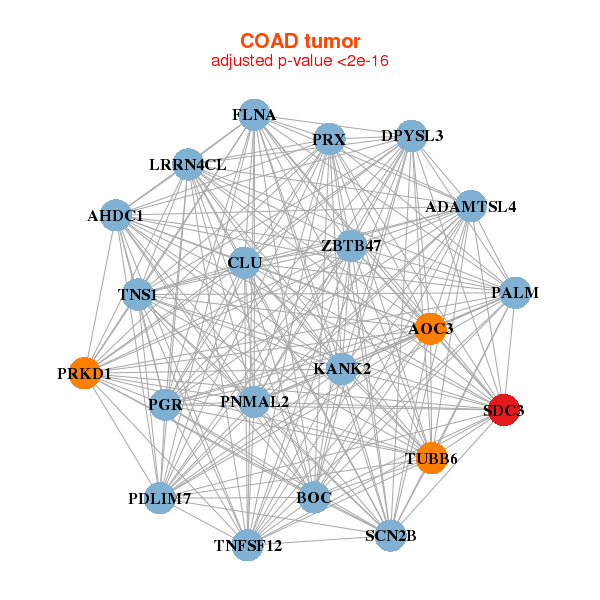
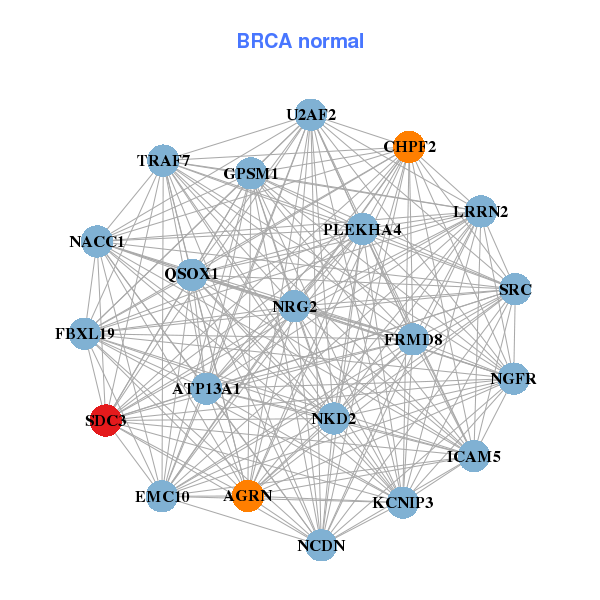
| * Co-Expression network figures were drawn using R package igraph. Only the top 20 genes with the highest correlations were shown. Red circle: input gene, orange circle: cell metabolism gene, sky circle: other gene |
: Open all plots for all cancer types
 |
| ||||
| AHDC1,CDH23,CLIP2,DAB2IP,GLG1,H6PD,KCND1, MAP3K6,NGFR,PDGFA,PHC2,PLEKHA4,PLEKHM2,PPM1F, S1PR2,SDC3,SLC12A4,SLC22A11,ST3GAL2,SUN2,ZNF319 | AGRN,ATP13A1,EMC10,CHPF2,FBXL19,FRMD8,GPSM1, ICAM5,KCNIP3,LRRN2,NACC1,NCDN,NGFR,NKD2, NRG2,PLEKHA4,QSOX1,SDC3,SRC,TRAF7,U2AF2 | ||||
 |
| ||||
| ADAMTSL4,AHDC1,AOC3,BOC,CLU,DPYSL3,FLNA, KANK2,LRRN4CL,PALM,PDLIM7,PGR,PNMAL2,PRKD1, PRX,SCN2B,SDC3,TNFSF12,TNS1,TUBB6,ZBTB47 | C20orf166-AS1,CACNA1C,CCBE1,DYSF,EMILIN1,FBXL22,GNAO1, GRIK5,KANK2,KCNMA1,LOC728264,MEIS2,MRVI1,NRG2, NRP2,TENM3___TENM1,RGAG4,SDC3,SPEG,TRPS1,TSHZ3 |
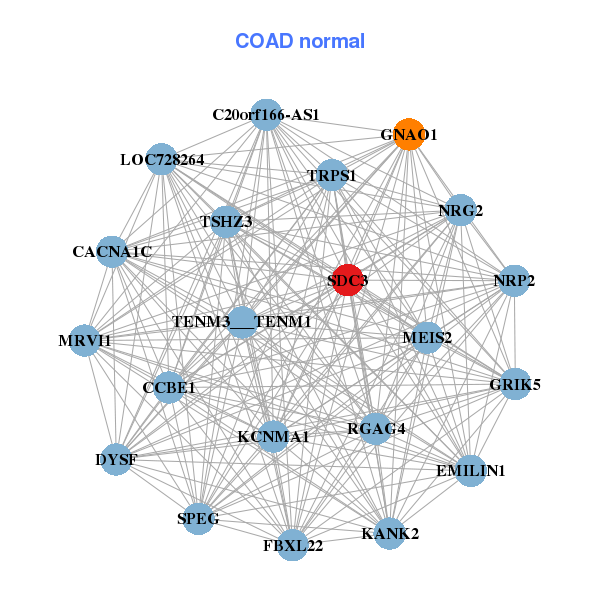
| * Co-Expression network figures were drawn using R package igraph. Only the top 20 genes with the highest correlations were shown. Red circle: input gene, orange circle: cell metabolism gene, sky circle: other gene |
: Open all plots for all cancer types
| Top |
: Open all interacting genes' information including KEGG pathway for all interacting genes from DAVID
| Top |
| Pharmacological Information for SDC3 |
| DB Category | DB Name | DB's ID and Url link |
| * Gene Centered Interaction Network. |
 |
| * Drug Centered Interaction Network. |
| DrugBank ID | Target Name | Drug Groups | Generic Name | Drug Centered Network | Drug Structure |
| DB00987 | syndecan 3 | approved; investigational | Cytarabine | 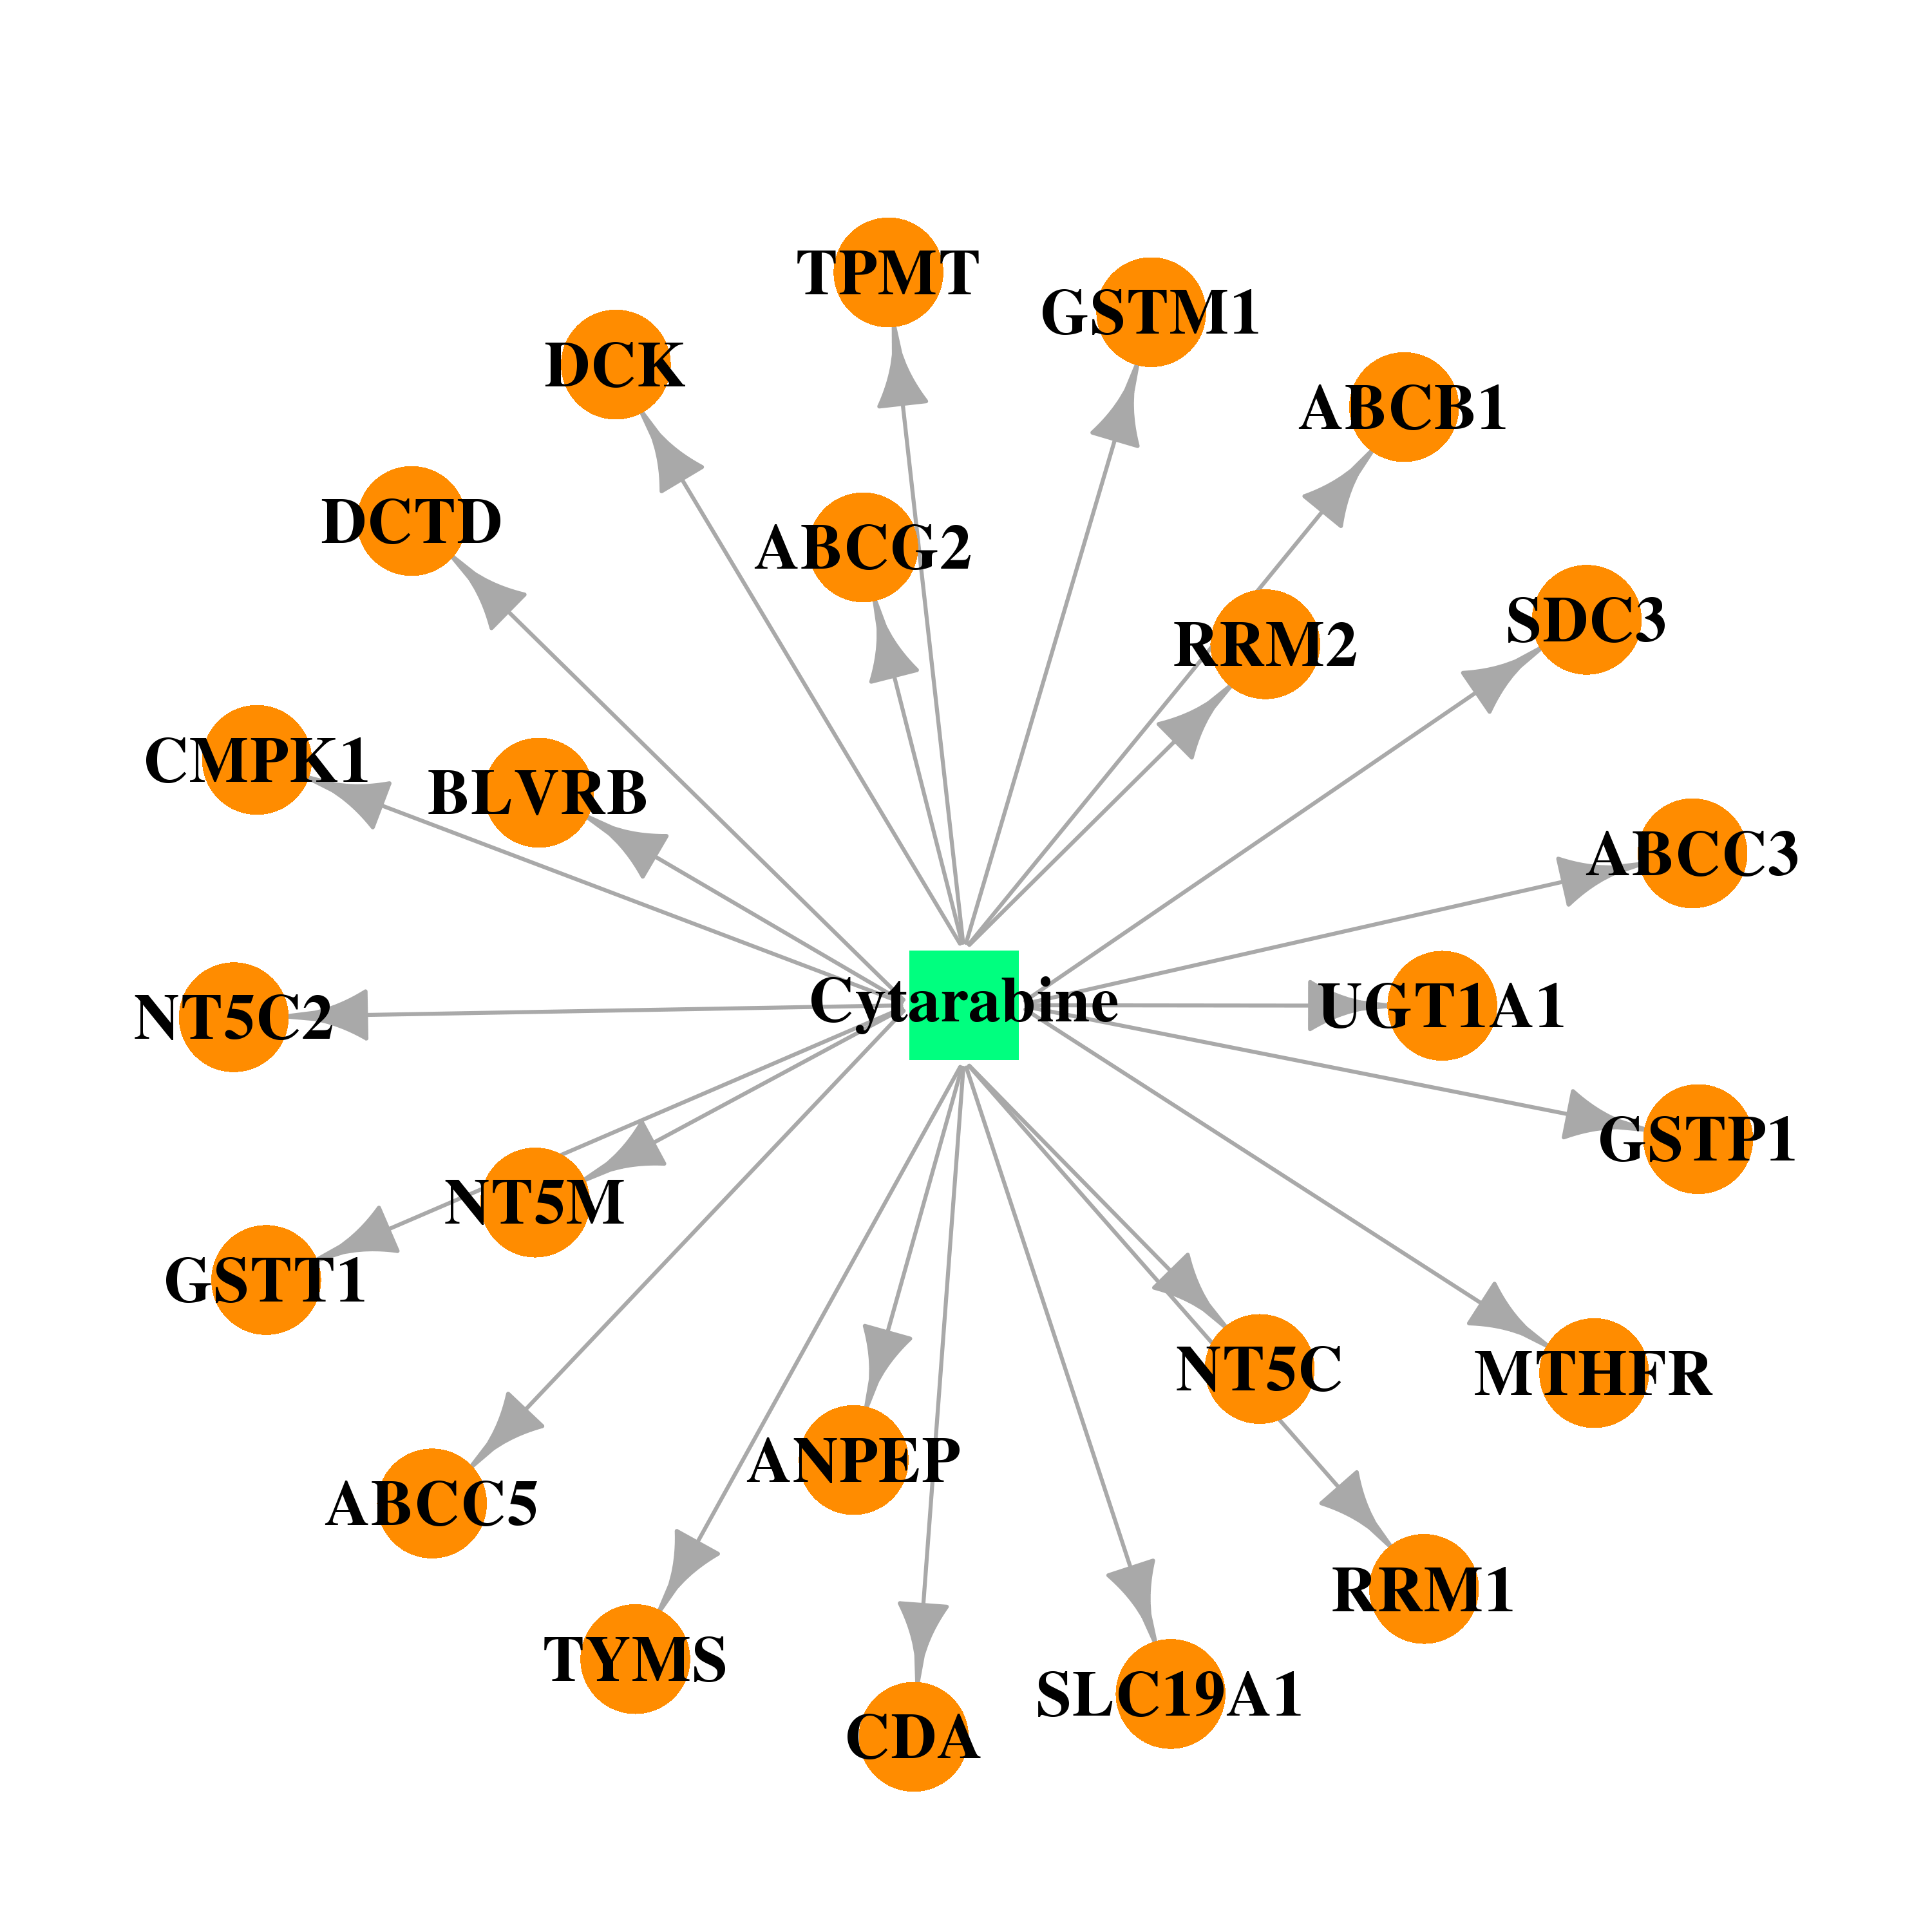 | 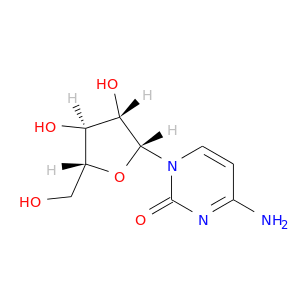 |
| Top |
| Cross referenced IDs for SDC3 |
| * We obtained these cross-references from Uniprot database. It covers 150 different DBs, 18 categories. http://www.uniprot.org/help/cross_references_section |
: Open all cross reference information
|
Copyright © 2016-Present - The Univsersity of Texas Health Science Center at Houston @ |