|
||||||||||||||||||||||||||||||||||||||||||||||||||||||||||||||||||||||||||||||||||||||||||||||||||||||||||||||||||||||||||||||||||||||||||||||||||||||||||||||||||||||||||||||||||||||||||||||||||||||||||||||||||||||||||||||||||||||||||||||||||||||||||||||||||||||||||||||||||||||||||||||||||||||||||||||||||||||||||
| |
| Phenotypic Information (metabolism pathway, cancer, disease, phenome) |
| |
| |
| Gene-Gene Network Information: Co-Expression Network, Interacting Genes & KEGG |
| |
|


| Gene Summary for EDEM1 |
| Top |
| Phenotypic Information for EDEM1(metabolism pathway, cancer, disease, phenome) |
| Cancer | CGAP: EDEM1 |
| Familial Cancer Database: EDEM1 | |
| * This gene is included in those cancer gene databases. |
|
|
|
|
|
| . | ||||||||||||||||||||||||||||||||||||||||||||||||||||||||||||||||||||||||||||||||||||||||||||||||||||||||||||||||||||||||||||||||||||||||||||||||||||||||||||||||||||||||||||||||||||||||||||||||||||||||||||||||||||||||||||||||||||||||||||||||||||||||||||||||||||||||||||||||||||||||||||||||||||||||||||||||||||
Oncogene 1 | Significant driver gene in | |||||||||||||||||||||||||||||||||||||||||||||||||||||||||||||||||||||||||||||||||||||||||||||||||||||||||||||||||||||||||||||||||||||||||||||||||||||||||||||||||||||||||||||||||||||||||||||||||||||||||||||||||||||||||||||||||||||||||||||||||||||||||||||||||||||||||||||||||||||||||||||||||||||||||||||||||||||||||
| cf) number; DB name 1 Oncogene; http://nar.oxfordjournals.org/content/35/suppl_1/D721.long, 2 Tumor Suppressor gene; https://bioinfo.uth.edu/TSGene/, 3 Cancer Gene Census; http://www.nature.com/nrc/journal/v4/n3/abs/nrc1299.html, 4 CancerGenes; http://nar.oxfordjournals.org/content/35/suppl_1/D721.long, 5 Network of Cancer Gene; http://ncg.kcl.ac.uk/index.php, 1Therapeutic Vulnerabilities in Cancer; http://cbio.mskcc.org/cancergenomics/statius/ |
| REACTOME_METABOLISM_OF_PROTEINS | |
| OMIM | |
| Orphanet | |
| Disease | KEGG Disease: EDEM1 |
| MedGen: EDEM1 (Human Medical Genetics with Condition) | |
| ClinVar: EDEM1 | |
| Phenotype | MGI: EDEM1 (International Mouse Phenotyping Consortium) |
| PhenomicDB: EDEM1 | |
| Mutations for EDEM1 |
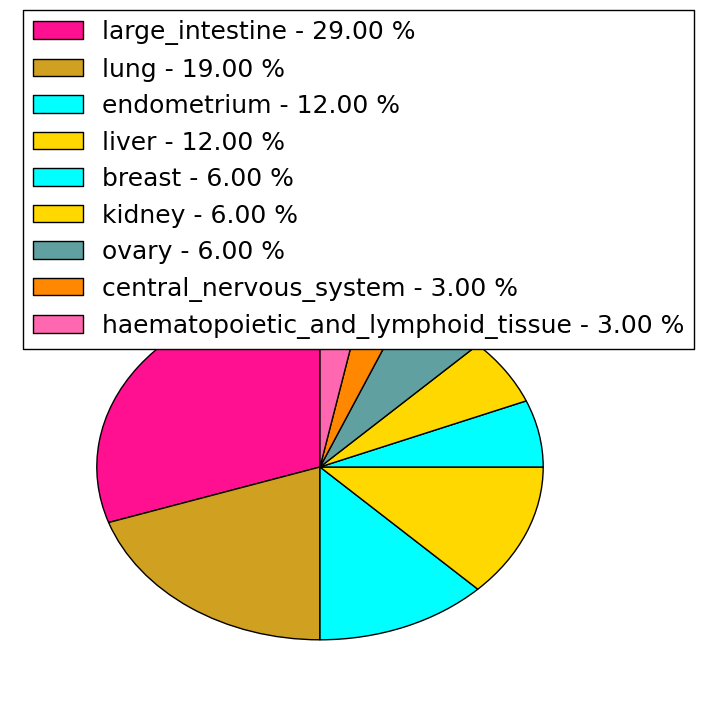
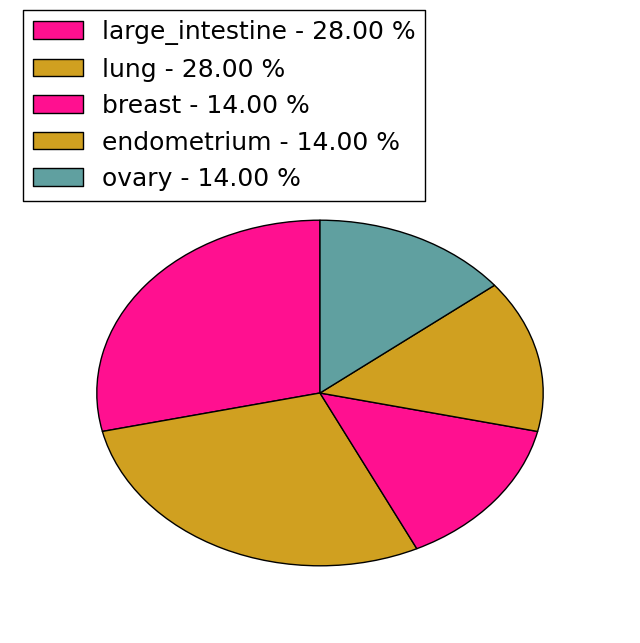
| * Under tables are showing count per each tissue to give us broad intuition about tissue specific mutation patterns.You can go to the detailed page for each mutation database's web site. |
| There's no structural variation information in COSMIC data for this gene. |
| * From mRNA Sanger sequences, Chitars2.0 arranged chimeric transcripts. This table shows EDEM1 related fusion information. |
| ID | Head Gene | Tail Gene | Accession | Gene_a | qStart_a | qEnd_a | Chromosome_a | tStart_a | tEnd_a | Gene_a | qStart_a | qEnd_a | Chromosome_a | tStart_a | tEnd_a |
| BX487661 | ANP32E | 3 | 181 | 1 | 150208282 | 150208460 | EDEM1 | 178 | 639 | 3 | 5259631 | 5260091 | |
| R93121 | RAPGEF5 | 1 | 98 | 7 | 22352155 | 22352252 | EDEM1 | 95 | 395 | 3 | 5241903 | 5242197 | |
| AW372554 | CHM | 9 | 224 | X | 85128204 | 85128421 | EDEM1 | 217 | 293 | 3 | 5259964 | 5260040 | |
| Top |
| Mutation type/ Tissue ID | brca | cns | cerv | endome | haematopo | kidn | Lintest | liver | lung | ns | ovary | pancre | prost | skin | stoma | thyro | urina | |||
| Total # sample | 2 | 1 | ||||||||||||||||||
| GAIN (# sample) | 1 | 1 | ||||||||||||||||||
| LOSS (# sample) | 1 |
| cf) Tissue ID; Tissue type (1; Breast, 2; Central_nervous_system, 3; Cervix, 4; Endometrium, 5; Haematopoietic_and_lymphoid_tissue, 6; Kidney, 7; Large_intestine, 8; Liver, 9; Lung, 10; NS, 11; Ovary, 12; Pancreas, 13; Prostate, 14; Skin, 15; Stomach, 16; Thyroid, 17; Urinary_tract) |
| Top |
|
 |
| Top |
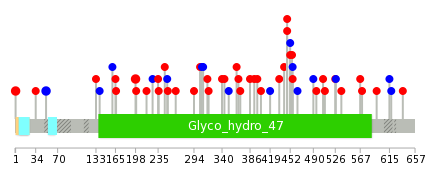
| Stat. for Non-Synonymous SNVs (# total SNVs=31) | (# total SNVs=7) |
 |  |
(# total SNVs=1) | (# total SNVs=0) |
 |
| Top |
| * When you move the cursor on each content, you can see more deailed mutation information on the Tooltip. Those are primary_site,primary_histology,mutation(aa),pubmedID. |
| GRCh37 position | Mutation(aa) | Unique sampleID count |
| chr3:5241287-5241287 | p.N198I | 2 |
| chr3:5229491-5229491 | p.M1V | 2 |
| chr3:5249807-5249807 | p.I456I | 2 |
| chr3:5229643-5229643 | p.G51G | 2 |
| chr3:5229970-5229970 | p.C160C | 1 |
| chr3:5248946-5248946 | p.F442L | 1 |
| chr3:5243503-5243503 | p.M251T | 1 |
| chr3:5251877-5251877 | p.F509L | 1 |
| chr3:5246762-5246762 | p.V351V | 1 |
| chr3:5255213-5255213 | p.? | 1 |
| Top |
|
 |
| Point Mutation/ Tissue ID | 1 | 2 | 3 | 4 | 5 | 6 | 7 | 8 | 9 | 10 | 11 | 12 | 13 | 14 | 15 | 16 | 17 | 18 | 19 | 20 |
| # sample | 6 | 1 | 1 | 7 | 3 | 4 | 2 | 2 | 5 | 5 | 2 | 4 | ||||||||
| # mutation | 7 | 1 | 1 | 8 | 3 | 4 | 2 | 2 | 5 | 5 | 2 | 5 | ||||||||
| nonsynonymous SNV | 4 | 1 | 1 | 8 | 1 | 2 | 1 | 1 | 1 | 3 | 2 | 4 | ||||||||
| synonymous SNV | 3 | 2 | 2 | 1 | 1 | 4 | 2 | 1 |
| cf) Tissue ID; Tissue type (1; BLCA[Bladder Urothelial Carcinoma], 2; BRCA[Breast invasive carcinoma], 3; CESC[Cervical squamous cell carcinoma and endocervical adenocarcinoma], 4; COAD[Colon adenocarcinoma], 5; GBM[Glioblastoma multiforme], 6; Glioma Low Grade, 7; HNSC[Head and Neck squamous cell carcinoma], 8; KICH[Kidney Chromophobe], 9; KIRC[Kidney renal clear cell carcinoma], 10; KIRP[Kidney renal papillary cell carcinoma], 11; LAML[Acute Myeloid Leukemia], 12; LUAD[Lung adenocarcinoma], 13; LUSC[Lung squamous cell carcinoma], 14; OV[Ovarian serous cystadenocarcinoma ], 15; PAAD[Pancreatic adenocarcinoma], 16; PRAD[Prostate adenocarcinoma], 17; SKCM[Skin Cutaneous Melanoma], 18:STAD[Stomach adenocarcinoma], 19:THCA[Thyroid carcinoma], 20:UCEC[Uterine Corpus Endometrial Carcinoma]) |
| Top |
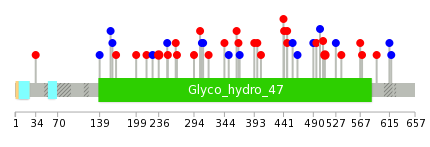
| * We represented just top 10 SNVs. When you move the cursor on each content, you can see more deailed mutation information on the Tooltip. Those are primary_site, primary_histology, mutation(aa), pubmedID. |
| Genomic Position | Mutation(aa) | Unique sampleID count |
| chr3:5243458 | p.F509L | 2 |
| chr3:5251877 | p.S236F | 2 |
| chr3:5241340 | p.A304V | 1 |
| chr3:5252828 | p.I456I | 1 |
| chr3:5244745 | p.G307G | 1 |
| chr3:5249778 | p.A464A | 1 |
| chr3:5241372 | p.Y34S | 1 |
| chr3:5255023 | p.L309L | 1 |
| chr3:5244822 | p.L490L | 1 |
| chr3:5249779 | p.V139V | 1 |
| * Copy number data were extracted from TCGA using R package TCGA-Assembler. The URLs of all public data files on TCGA DCC data server were gathered on Jan-05-2015. Function ProcessCNAData in TCGA-Assembler package was used to obtain gene-level copy number value which is calculated as the average copy number of the genomic region of a gene. |
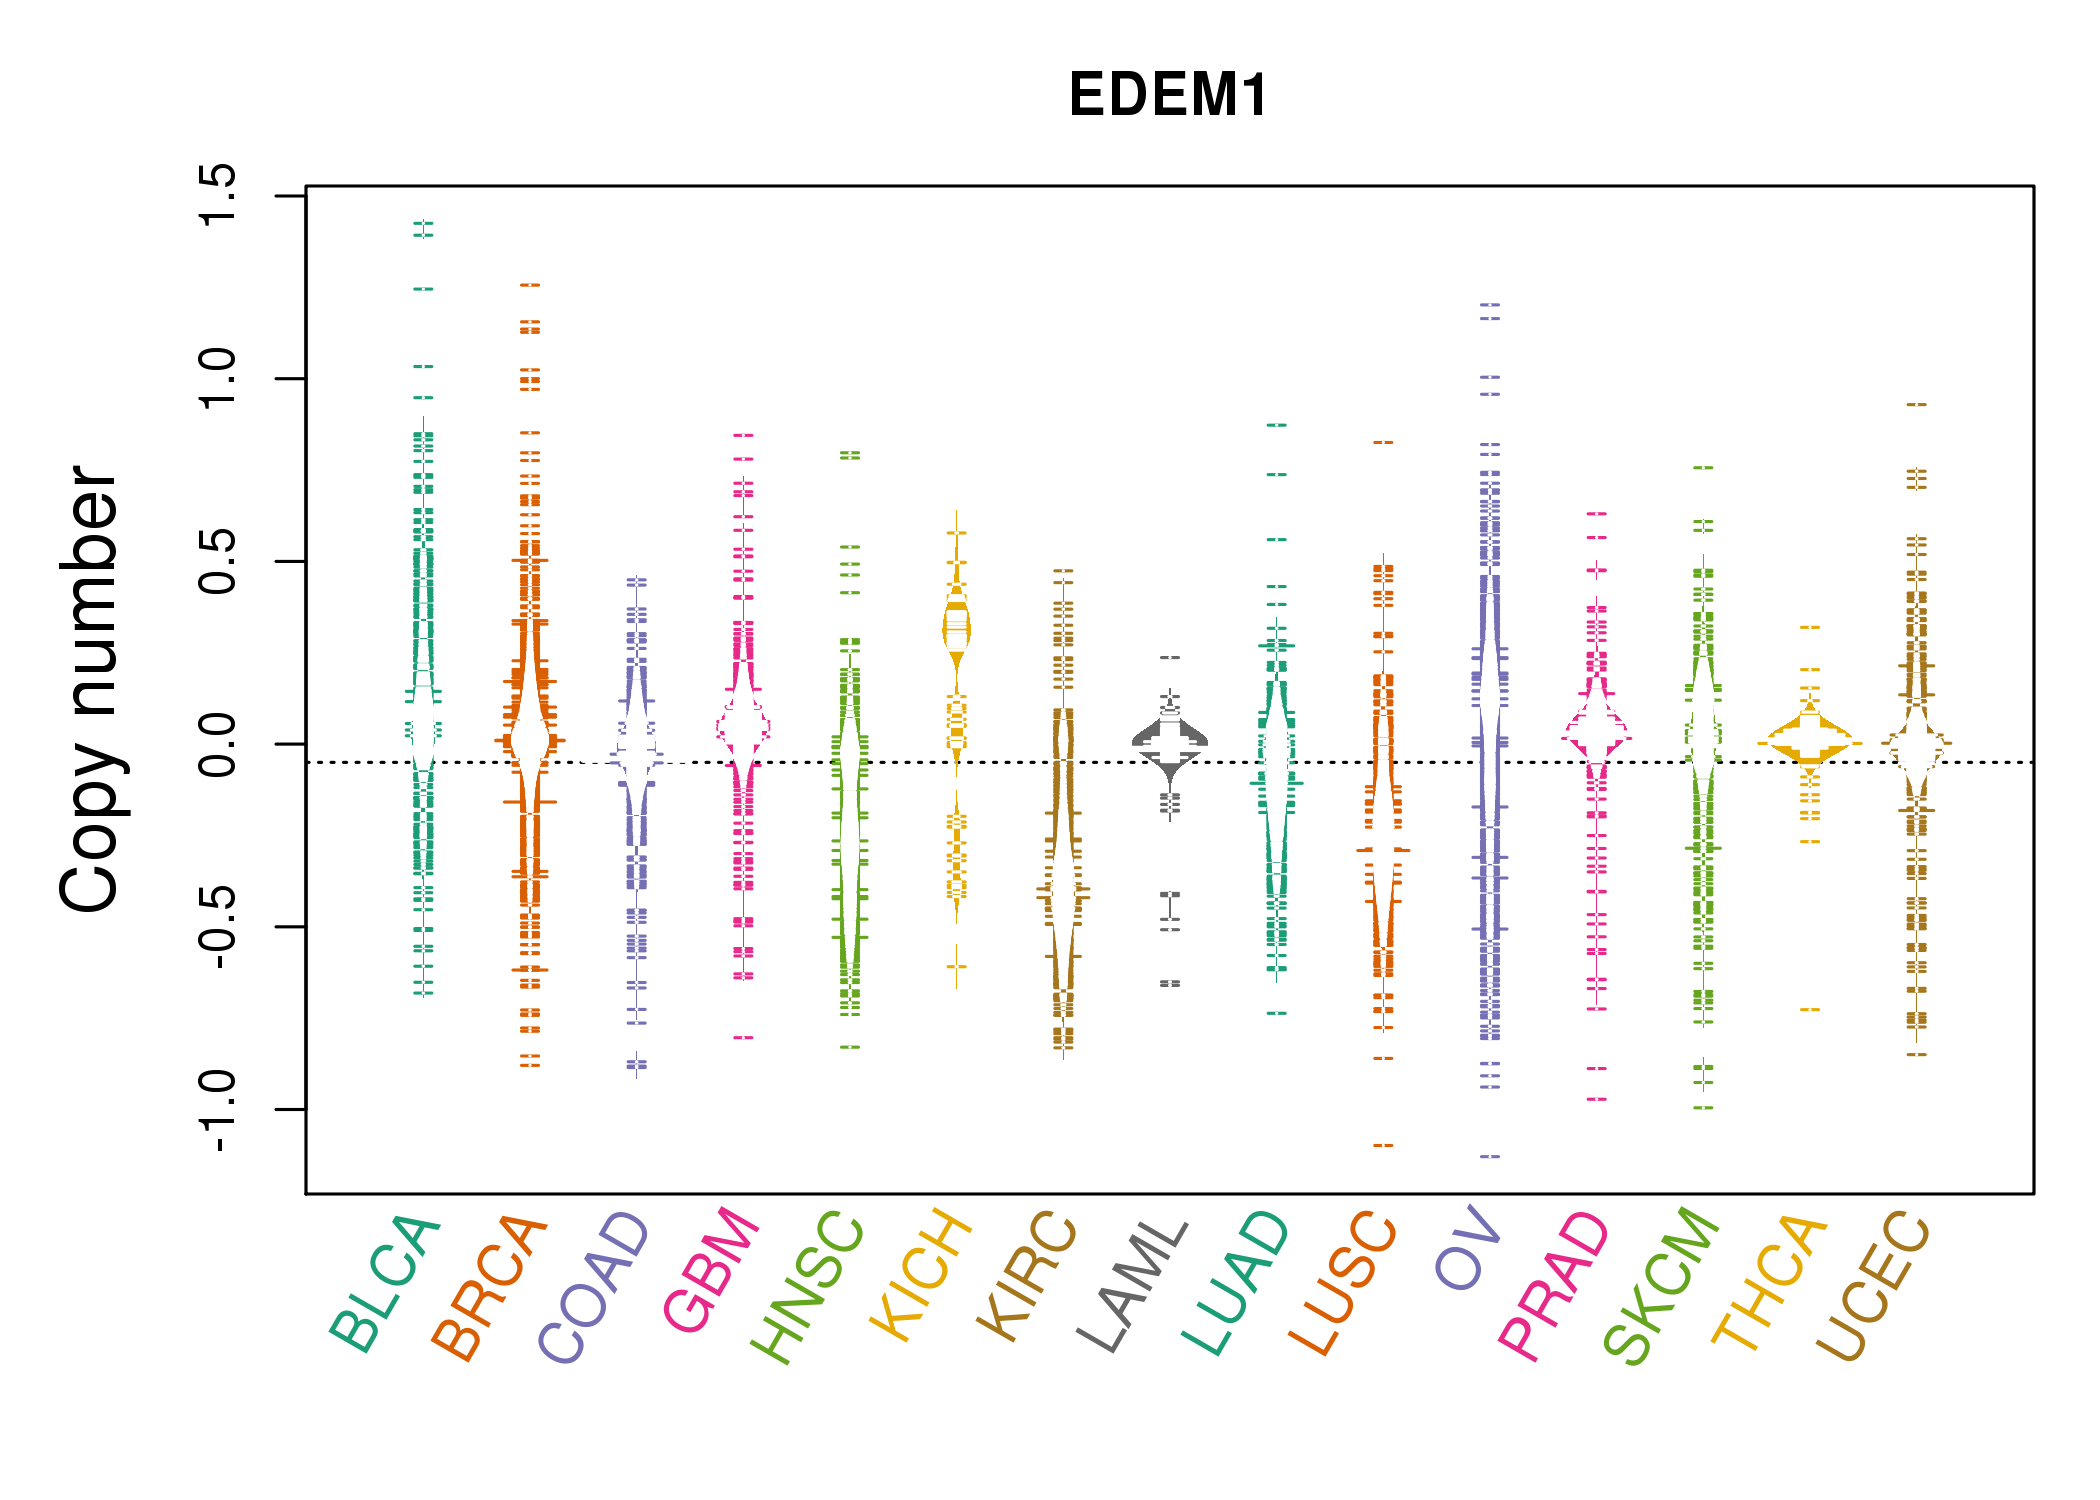 |
| cf) Tissue ID[Tissue type]: BLCA[Bladder Urothelial Carcinoma], BRCA[Breast invasive carcinoma], CESC[Cervical squamous cell carcinoma and endocervical adenocarcinoma], COAD[Colon adenocarcinoma], GBM[Glioblastoma multiforme], Glioma Low Grade, HNSC[Head and Neck squamous cell carcinoma], KICH[Kidney Chromophobe], KIRC[Kidney renal clear cell carcinoma], KIRP[Kidney renal papillary cell carcinoma], LAML[Acute Myeloid Leukemia], LUAD[Lung adenocarcinoma], LUSC[Lung squamous cell carcinoma], OV[Ovarian serous cystadenocarcinoma ], PAAD[Pancreatic adenocarcinoma], PRAD[Prostate adenocarcinoma], SKCM[Skin Cutaneous Melanoma], STAD[Stomach adenocarcinoma], THCA[Thyroid carcinoma], UCEC[Uterine Corpus Endometrial Carcinoma] |
| Top |
| Gene Expression for EDEM1 |
| * CCLE gene expression data were extracted from CCLE_Expression_Entrez_2012-10-18.res: Gene-centric RMA-normalized mRNA expression data. |
 |
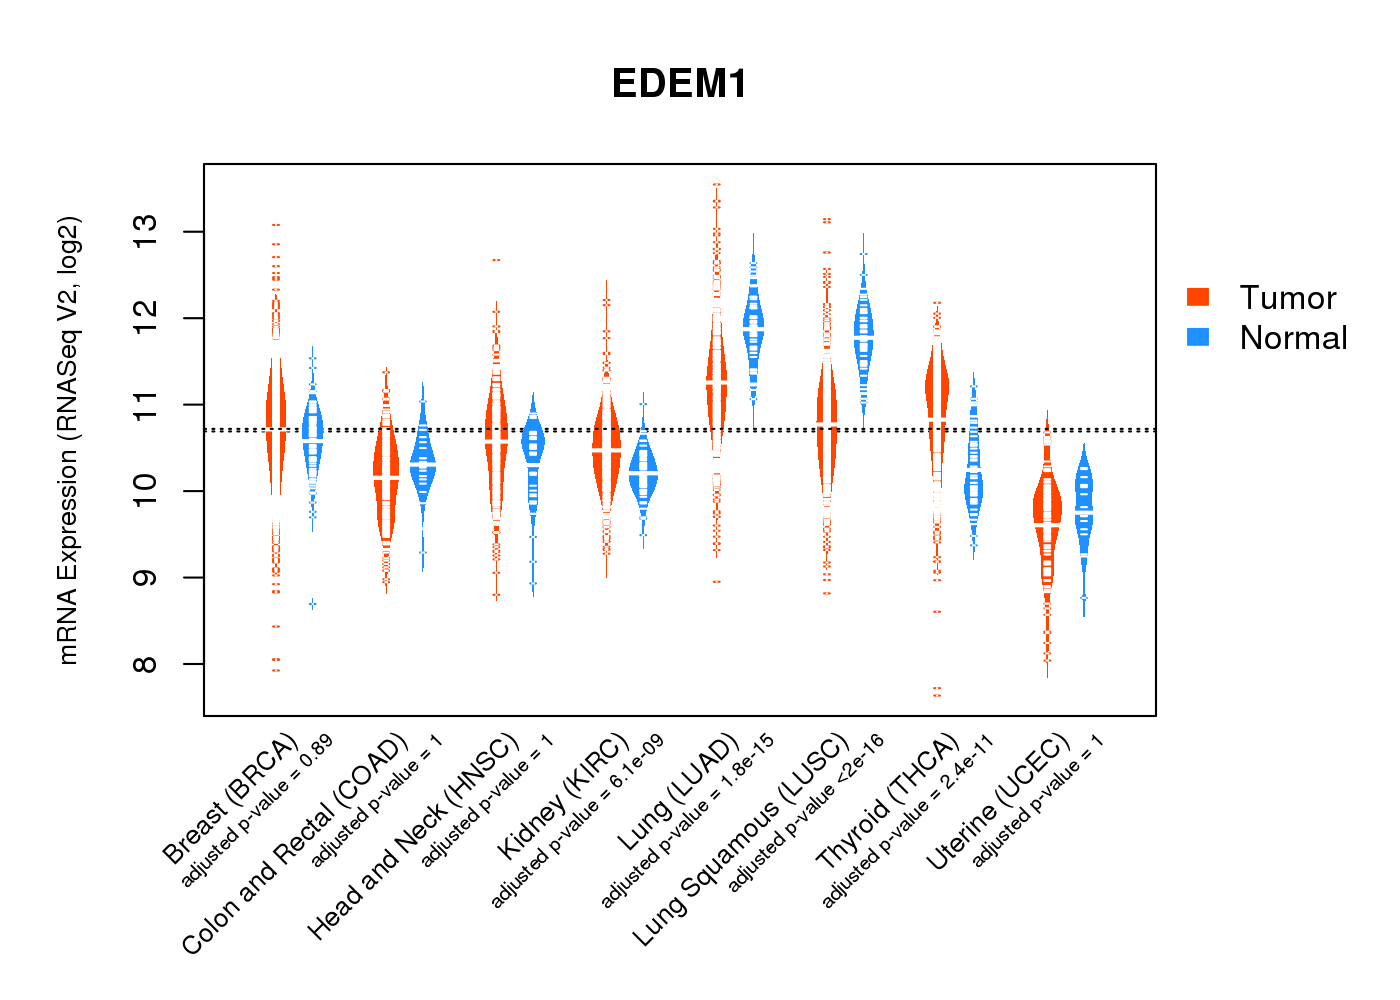
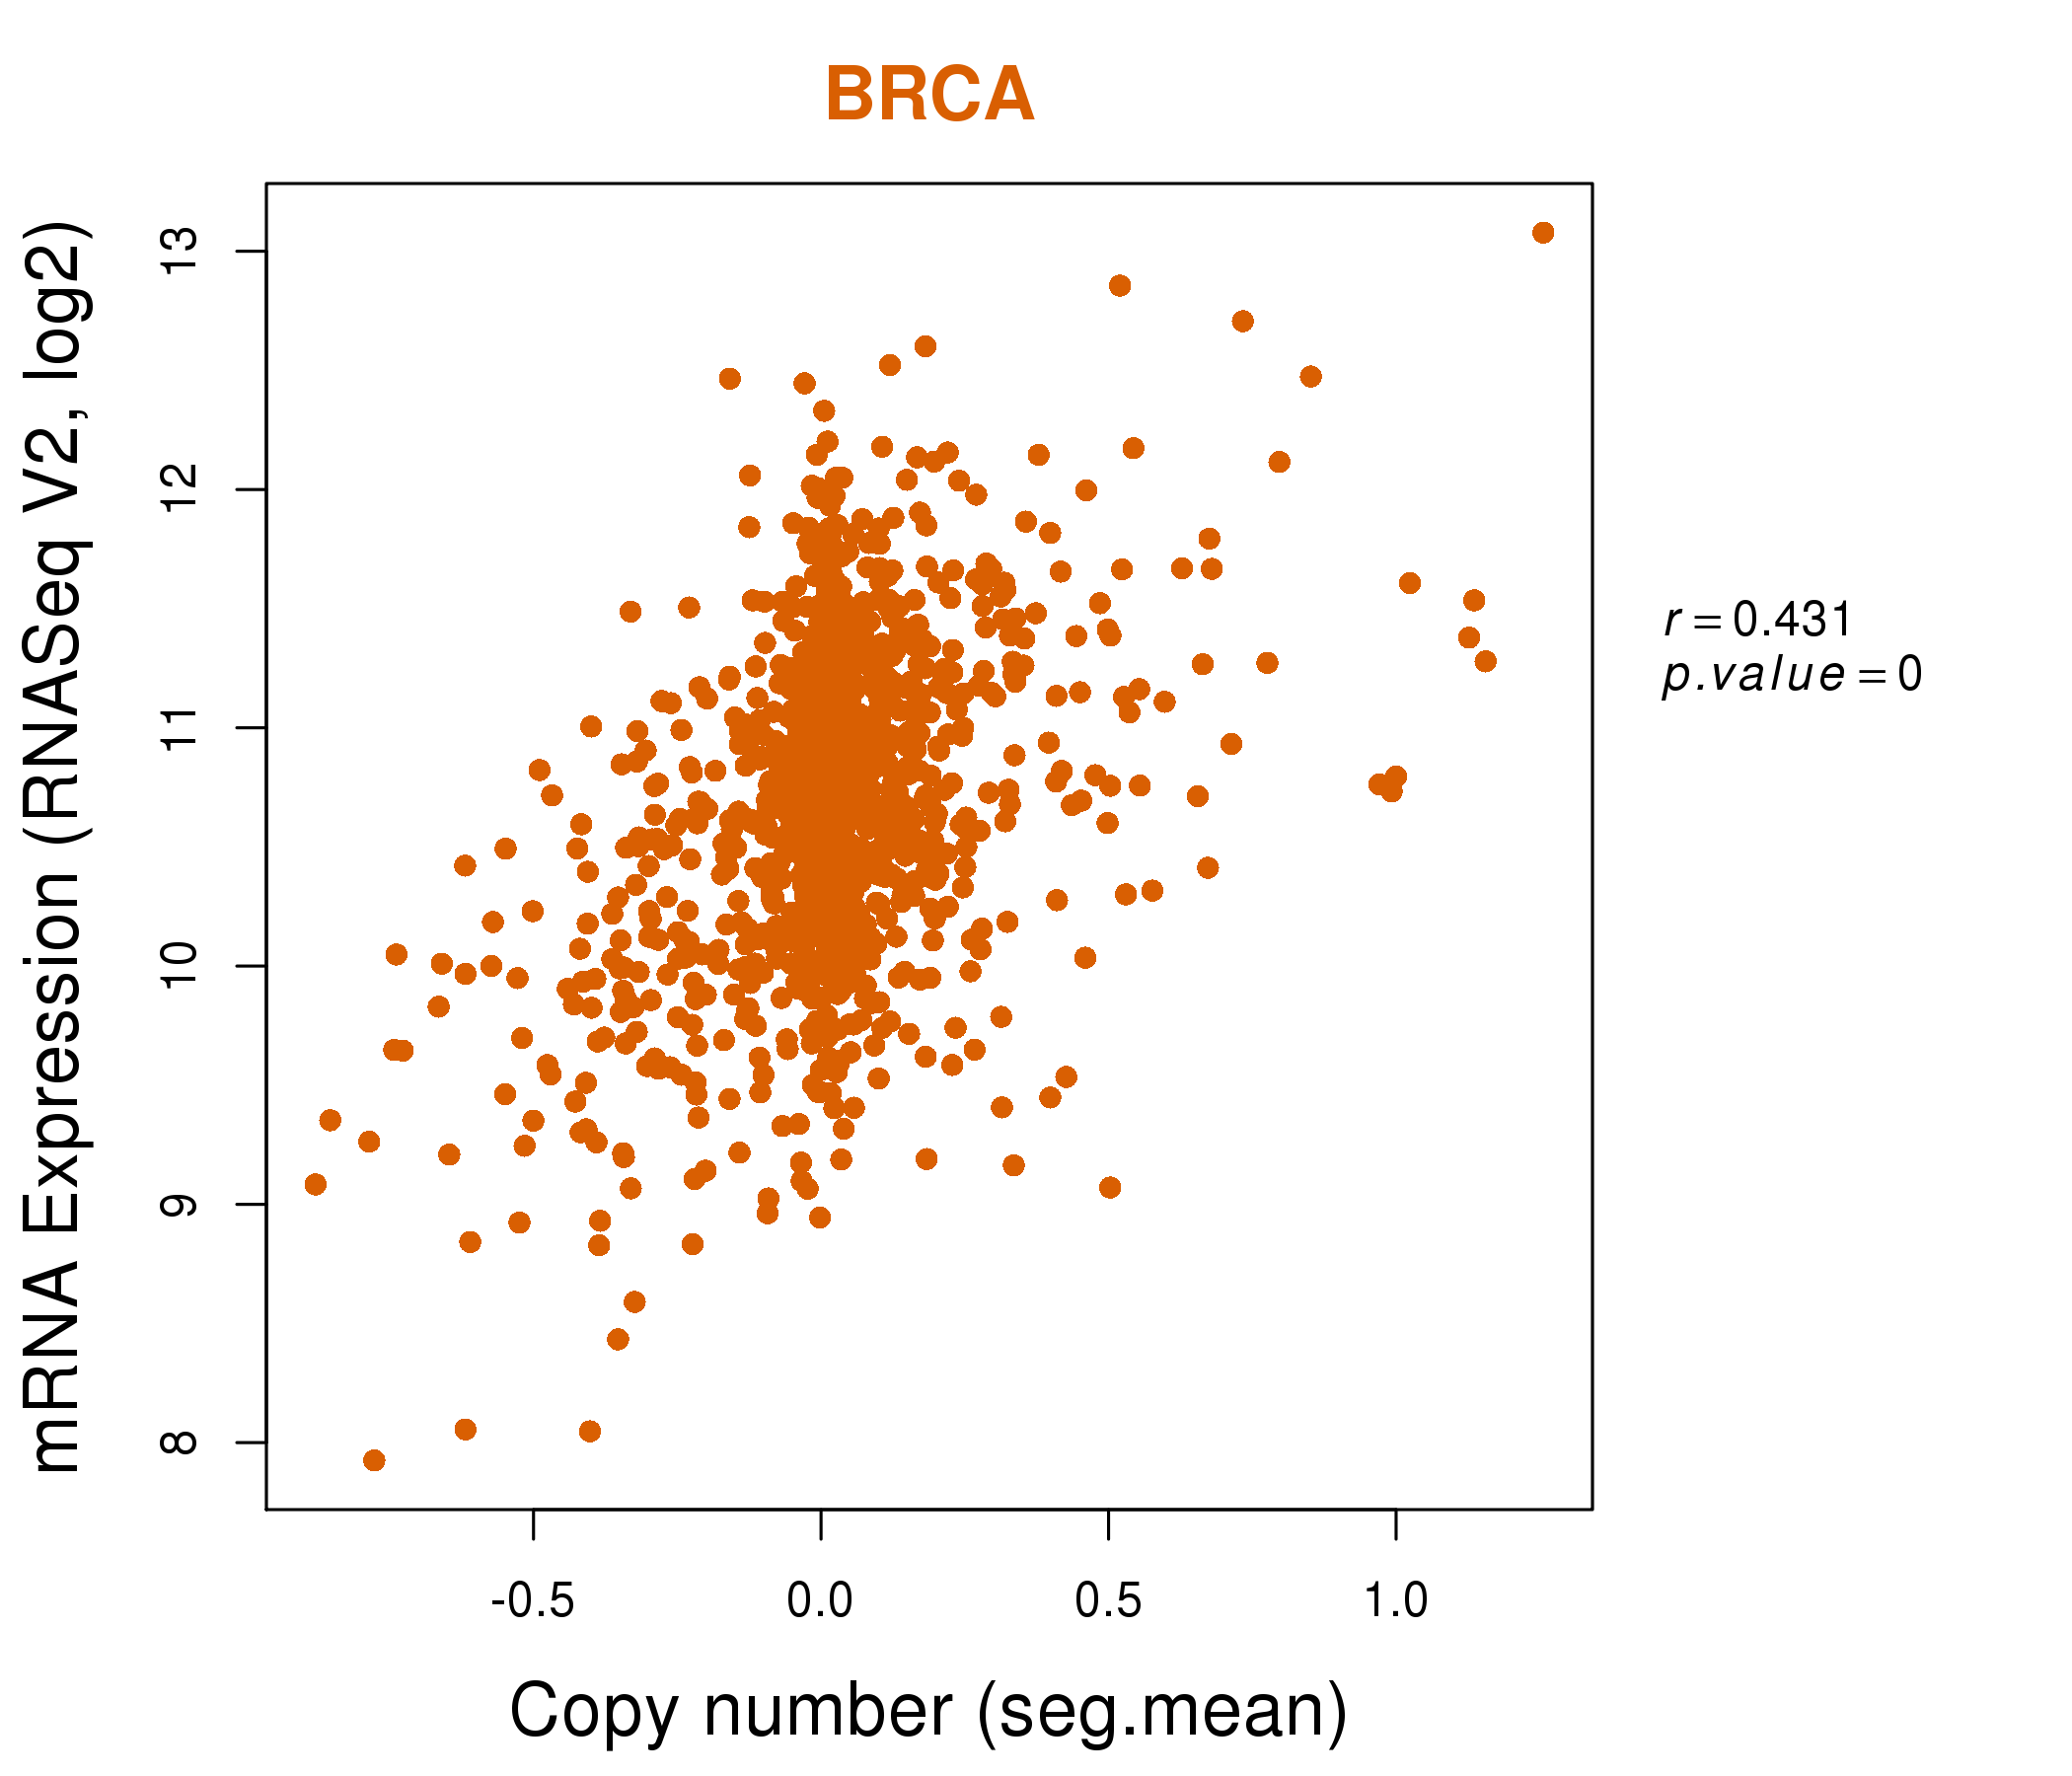
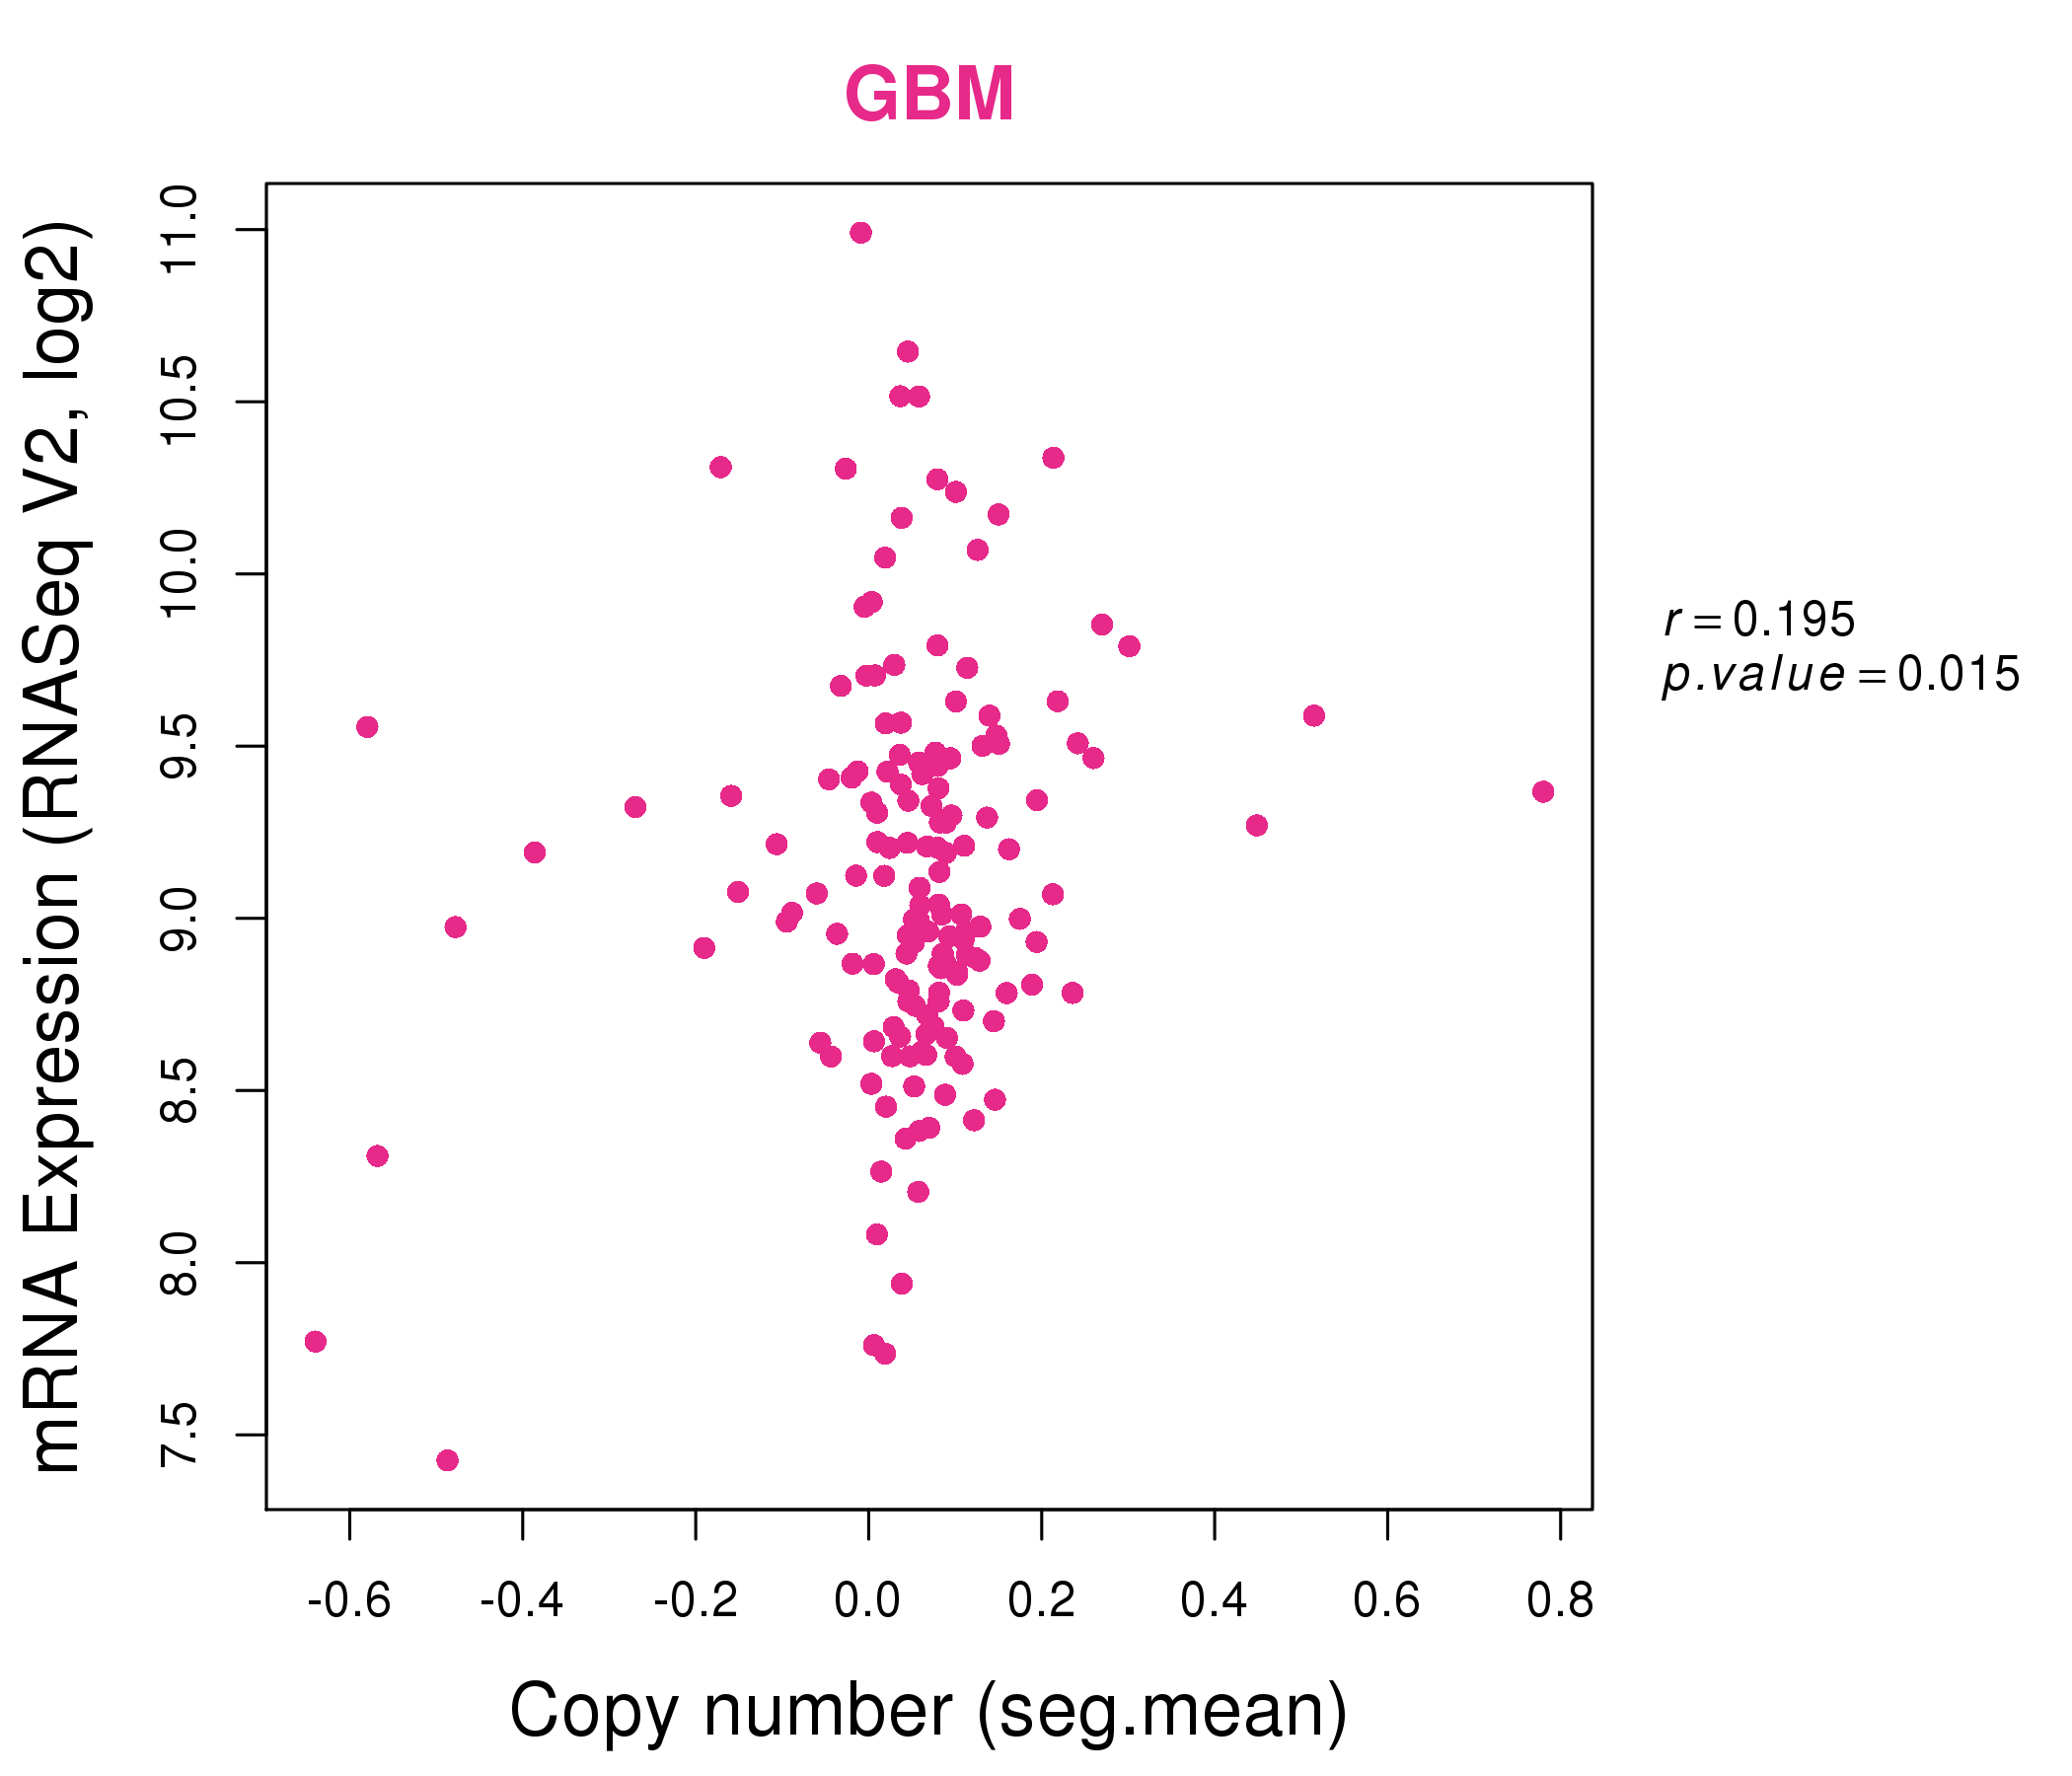
| * Normalized gene expression data of RNASeqV2 was extracted from TCGA using R package TCGA-Assembler. The URLs of all public data files on TCGA DCC data server were gathered at Jan-05-2015. Only eight cancer types have enough normal control samples for differential expression analysis. (t test, adjusted p<0.05 (using Benjamini-Hochberg FDR)) |
 |
| Top |
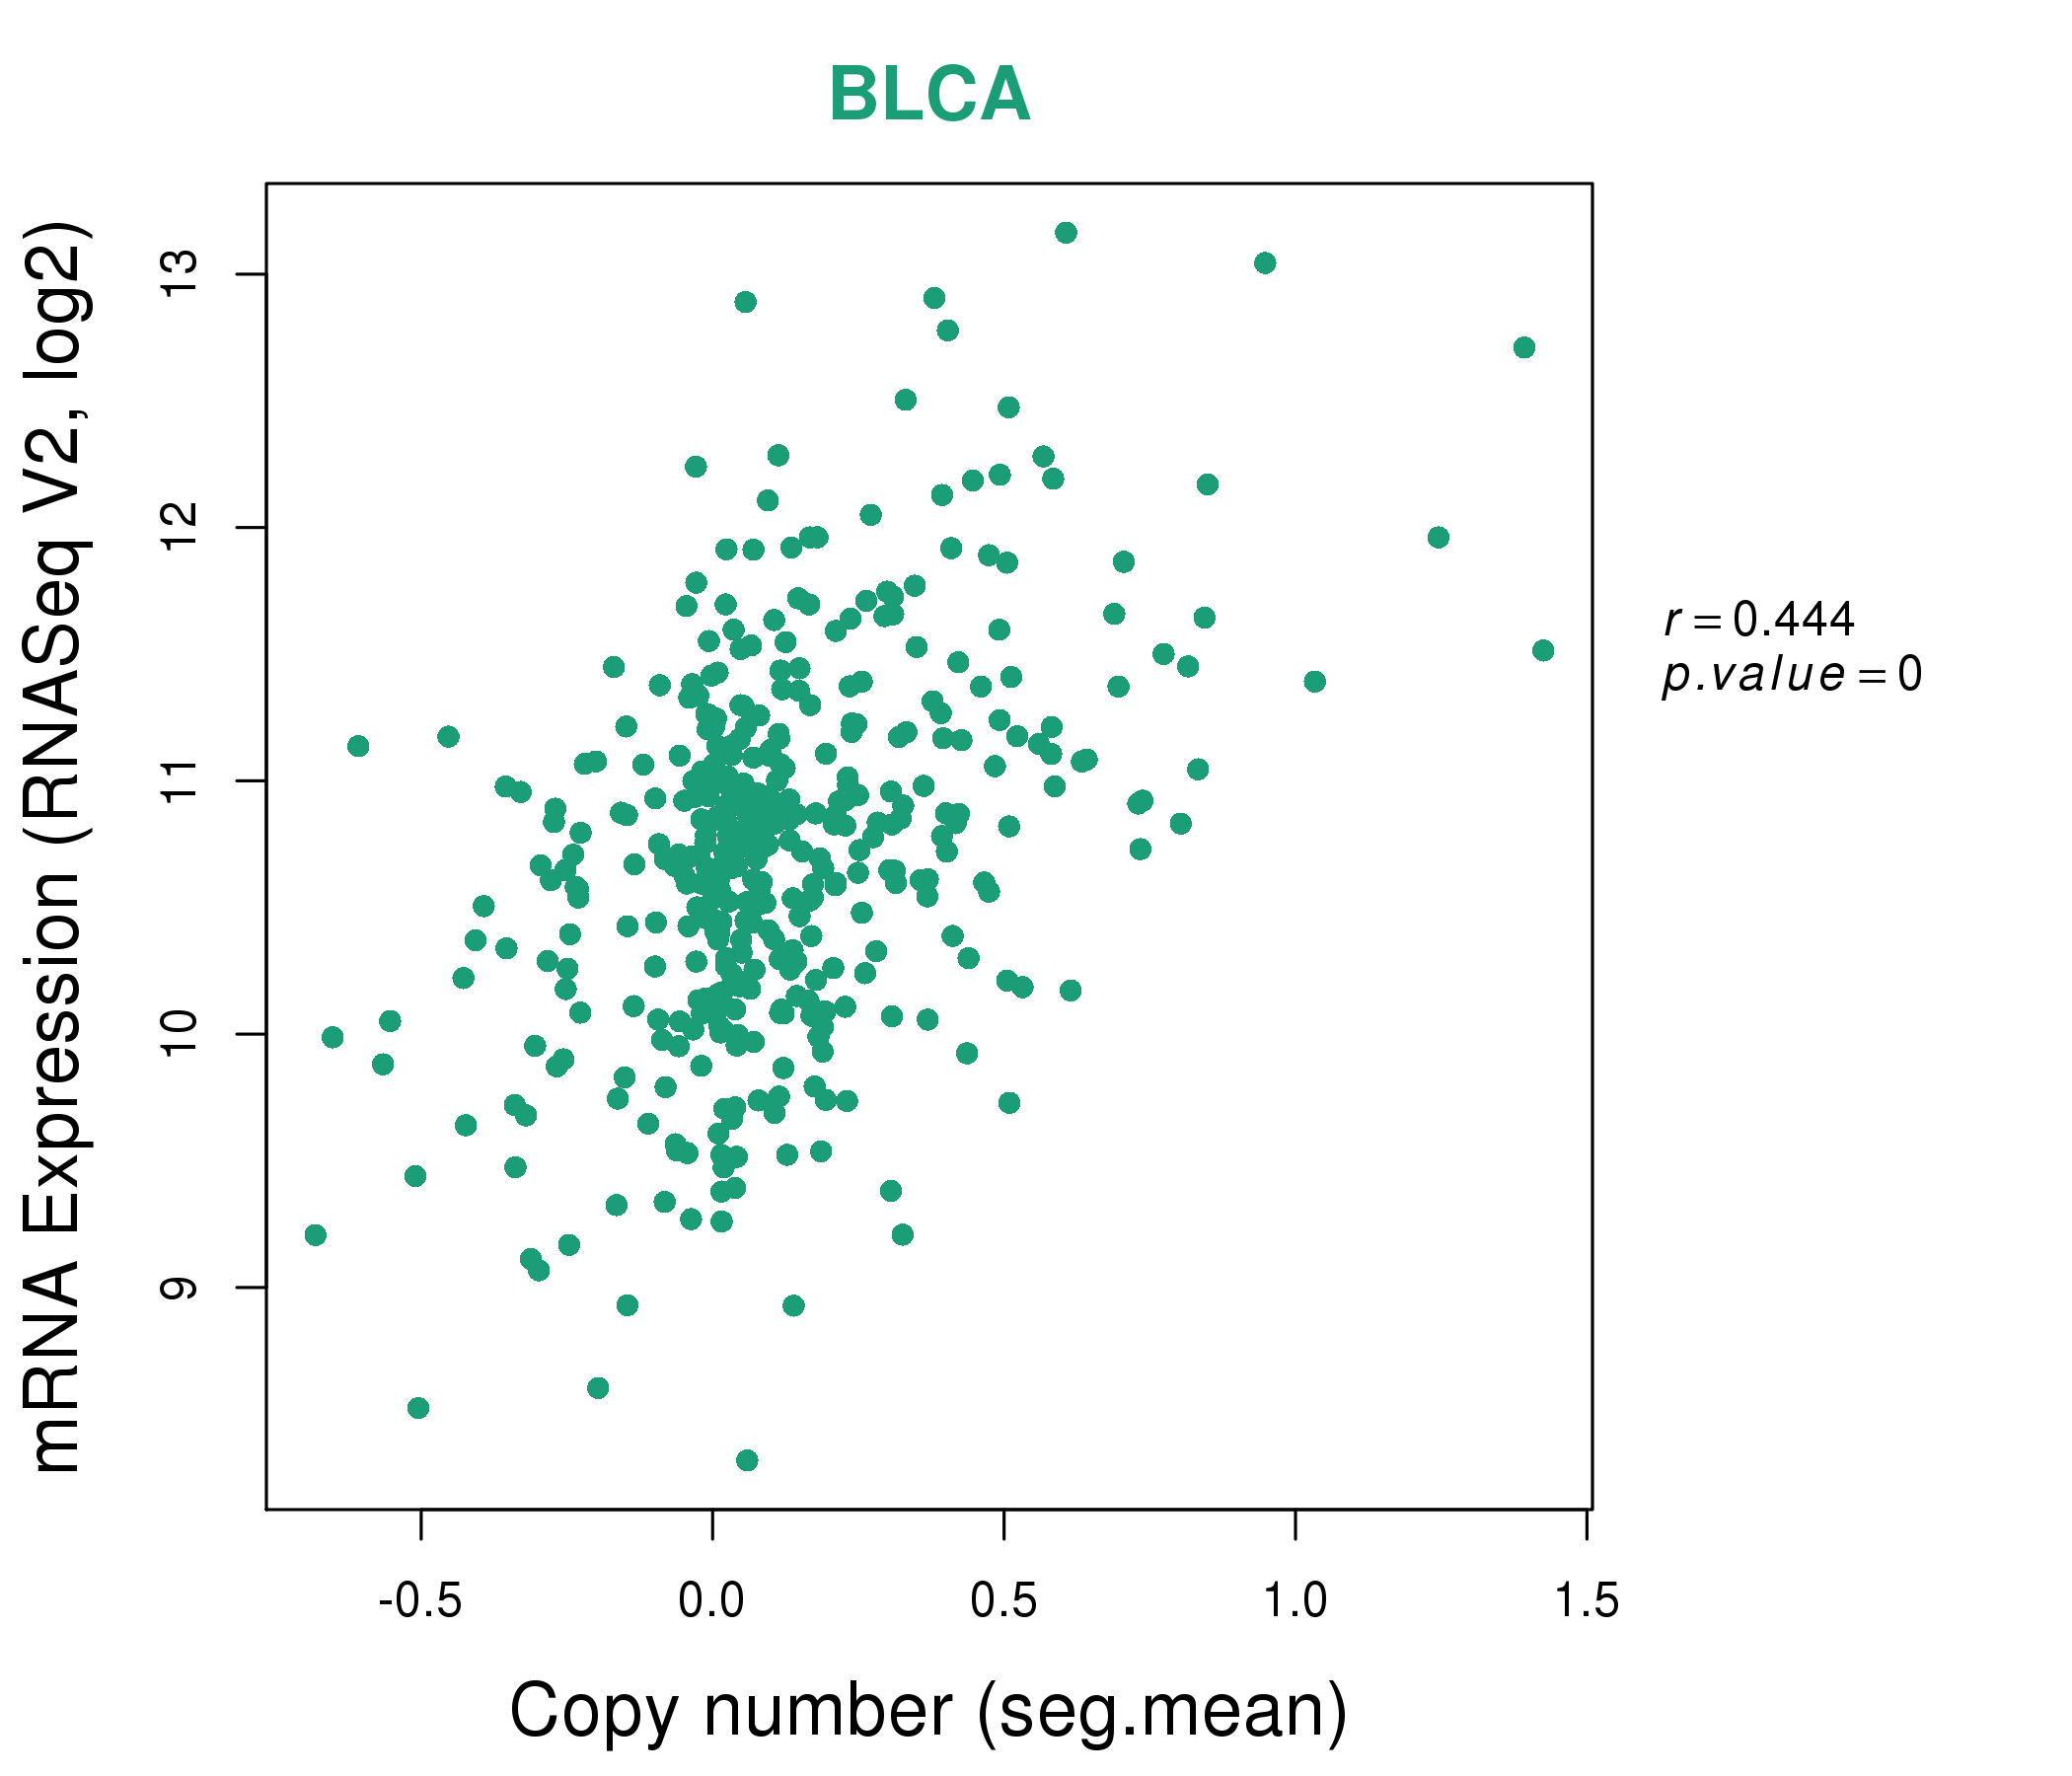
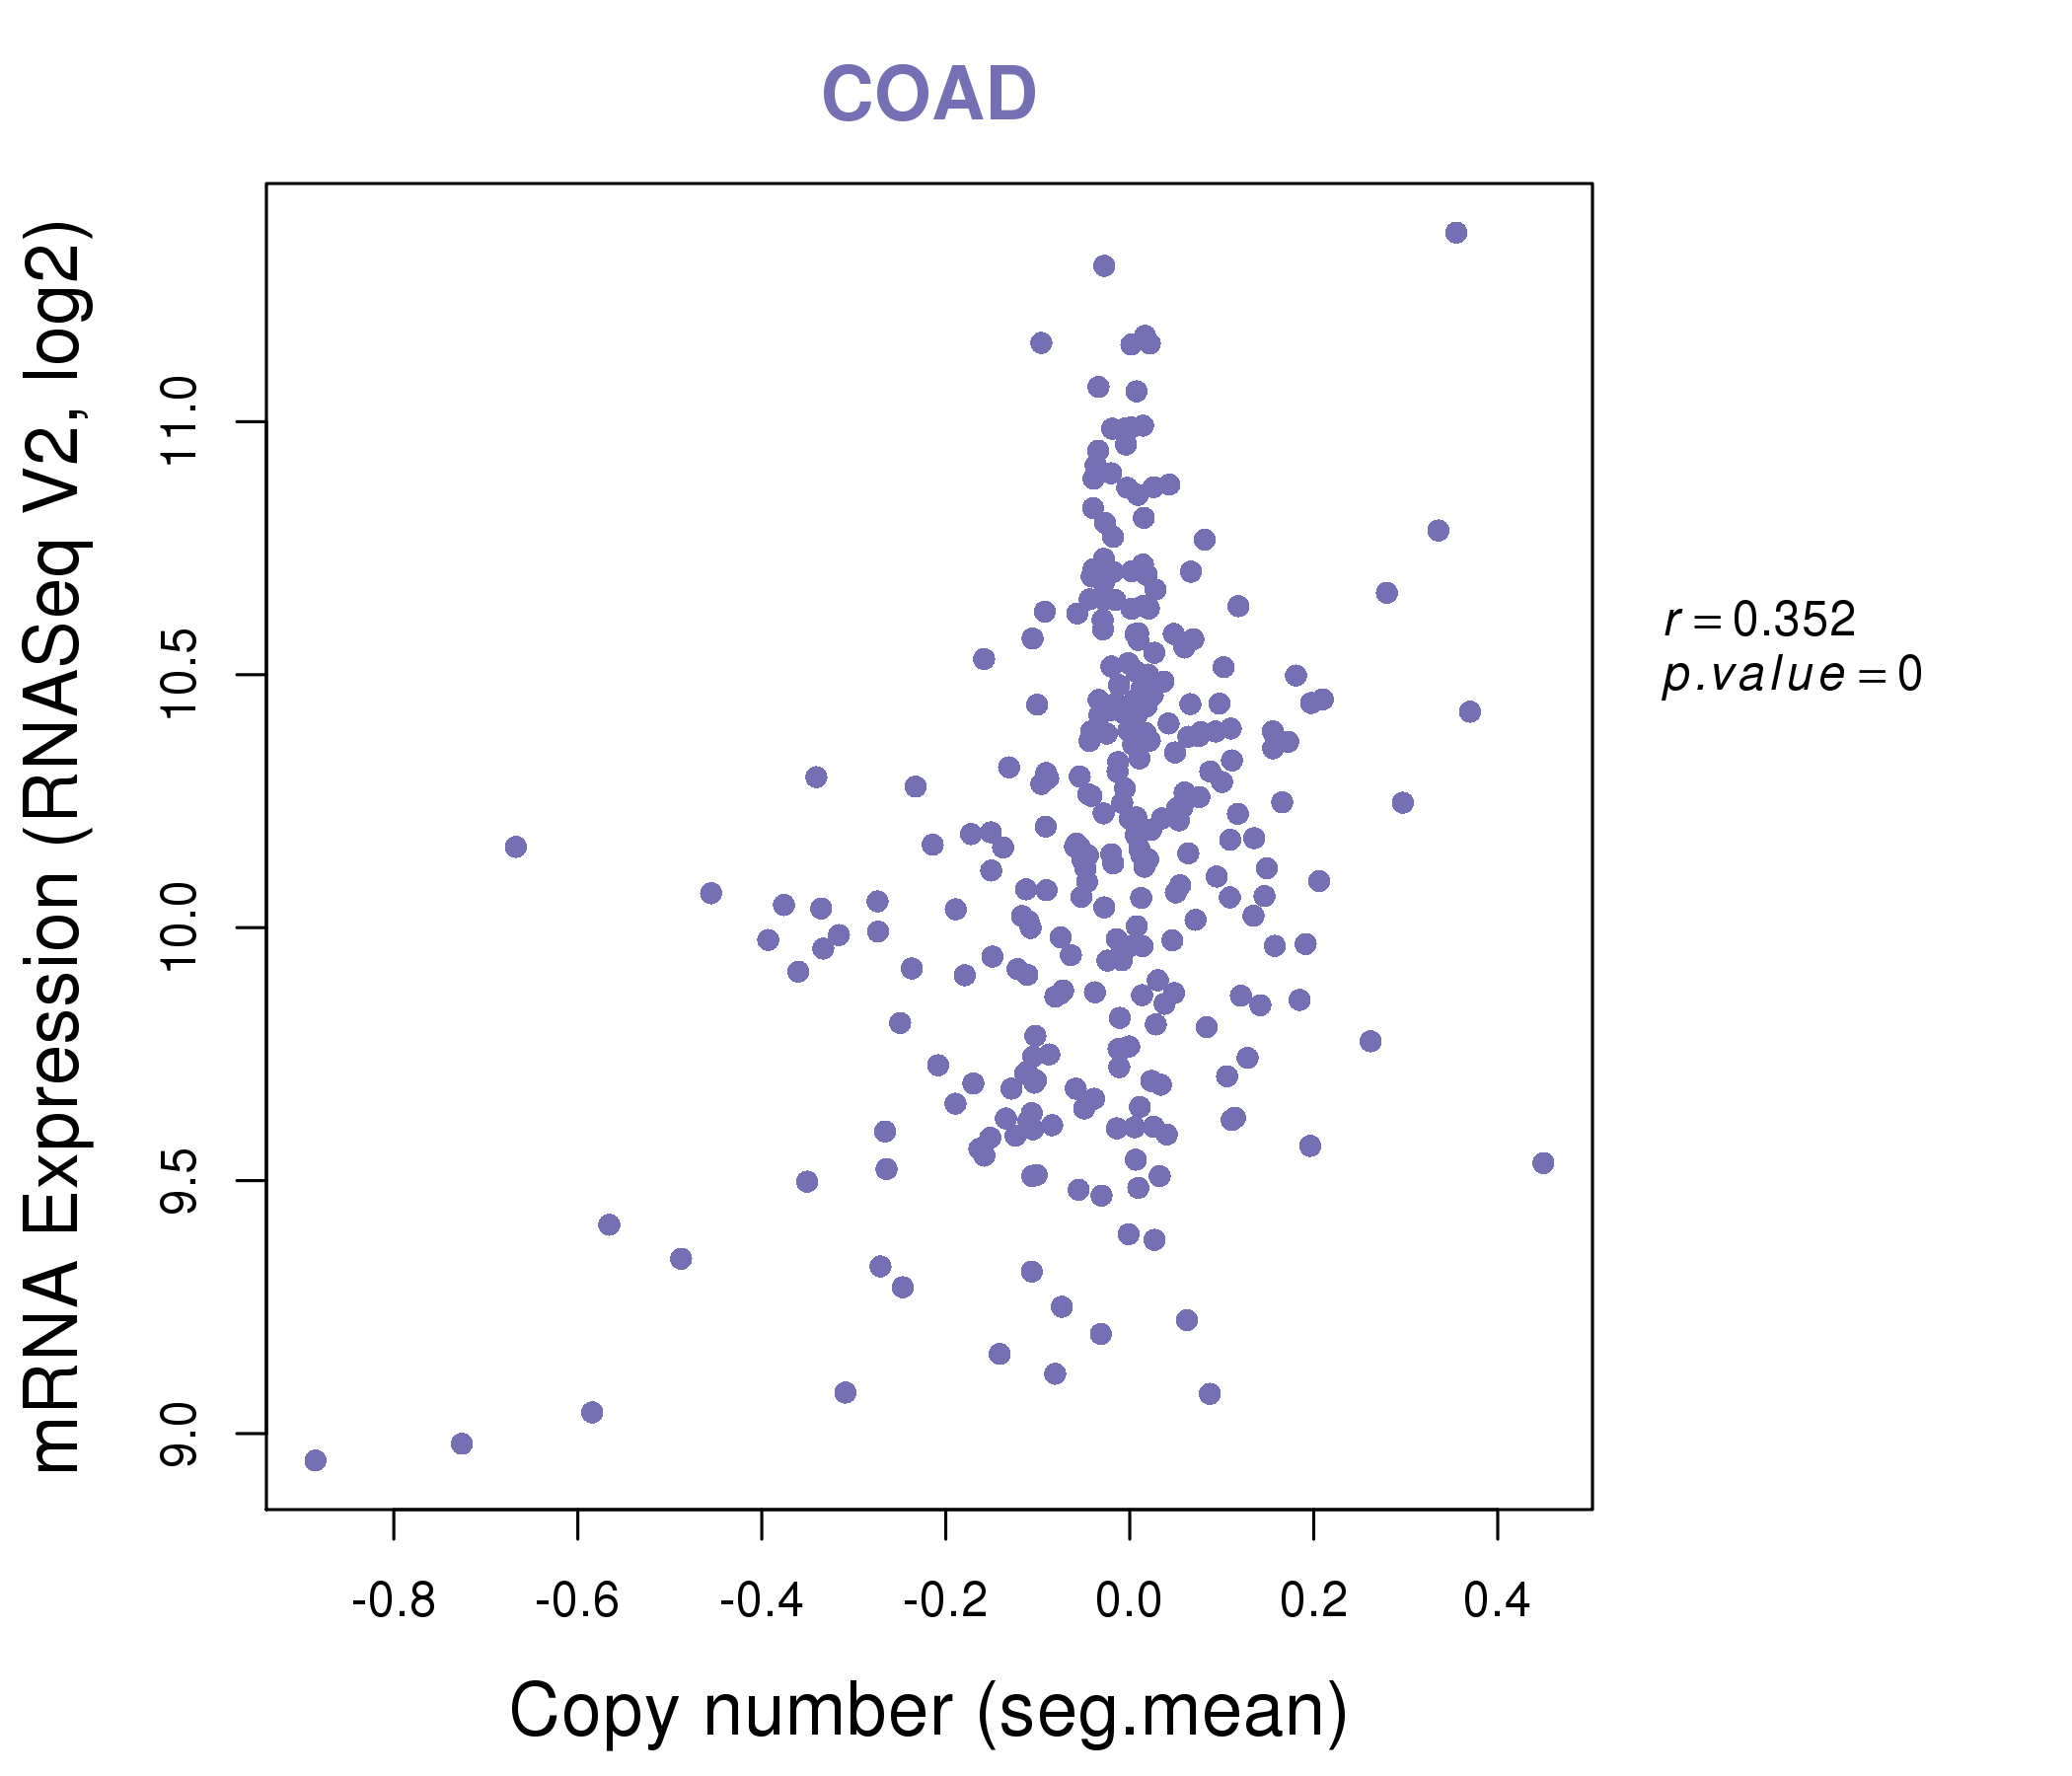
| * This plots show the correlation between CNV and gene expression. |
: Open all plots for all cancer types
 |
|
 |
|
| Top |
| Gene-Gene Network Information |
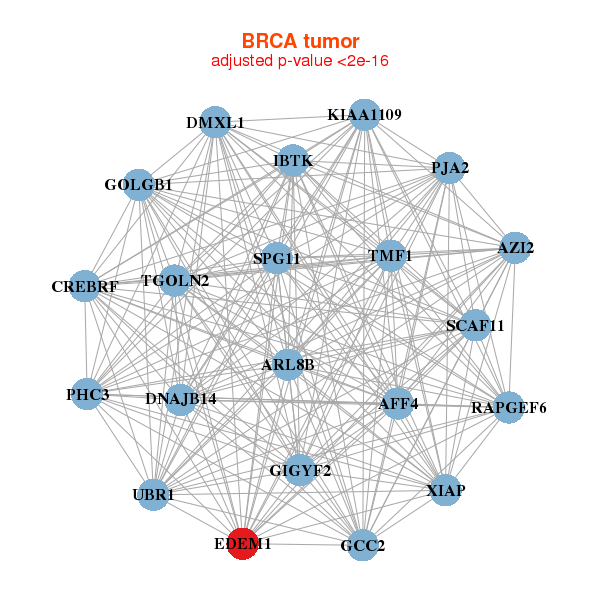
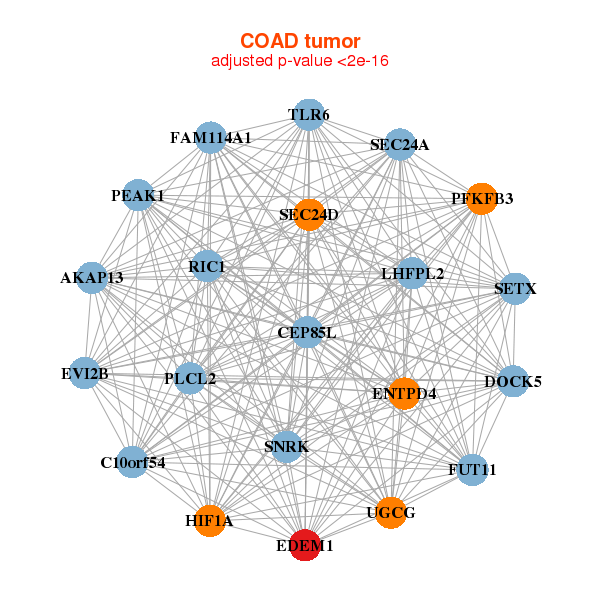
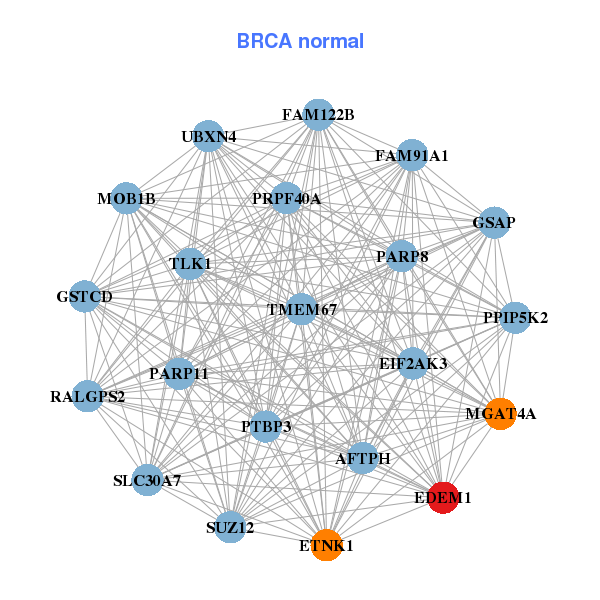
| * Co-Expression network figures were drawn using R package igraph. Only the top 20 genes with the highest correlations were shown. Red circle: input gene, orange circle: cell metabolism gene, sky circle: other gene |
: Open all plots for all cancer types
 |
|
| AFF4,ARL8B,AZI2,CREBRF,DMXL1,DNAJB14,EDEM1, GCC2,GIGYF2,GOLGB1,IBTK,KIAA1109,PHC3,PJA2, RAPGEF6,SCAF11,SPG11,TGOLN2,TMF1,UBR1,XIAP | AFTPH,EDEM1,EIF2AK3,ETNK1,FAM122B,FAM91A1,GSTCD, MGAT4A,MOB1B,PARP11,PARP8,GSAP,PPIP5K2,PRPF40A, RALGPS2,PTBP3,SLC30A7,SUZ12,TLK1,TMEM67,UBXN4 |
 |
|
| AKAP13,C10orf54,CEP85L,DOCK5,EDEM1,ENTPD4,EVI2B, FAM114A1,FUT11,HIF1A,RIC1,LHFPL2,PFKFB3,PLCL2, SEC24A,SEC24D,SETX,PEAK1,SNRK,TLR6,UGCG | ADRBK1,ARHGEF16,ARID3B,CSF2RB,CYTH1,DENND1C,DOCK2, DOCK8,EDEM1,EIF2AK3,ELL,GMIP,GPR114,HMHA1, HSH2D,PTK2B,PTPRE,SEL1L3,SYNRG,TXNDC11,ZFYVE28 |
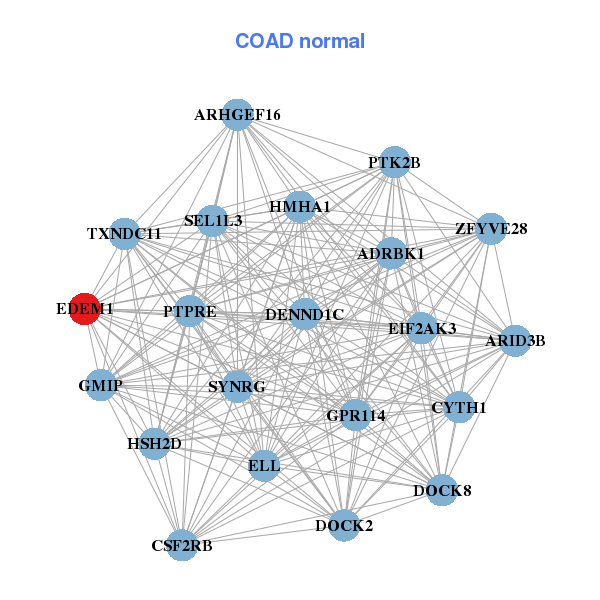
| * Co-Expression network figures were drawn using R package igraph. Only the top 20 genes with the highest correlations were shown. Red circle: input gene, orange circle: cell metabolism gene, sky circle: other gene |
: Open all plots for all cancer types
| Top |
: Open all interacting genes' information including KEGG pathway for all interacting genes from DAVID
| Top |
| Pharmacological Information for EDEM1 |
| There's no related Drug. |
| Top |
| Cross referenced IDs for EDEM1 |
| * We obtained these cross-references from Uniprot database. It covers 150 different DBs, 18 categories. http://www.uniprot.org/help/cross_references_section |
: Open all cross reference information
|
Copyright © 2016-Present - The Univsersity of Texas Health Science Center at Houston @ |