|
|||||||||||||||||||||||||||||||||||||||||||||||||||||||||||||||||||||||||||||||||||||||||||||||||||||||||||||||||||||||||||||||||||||||||||||||||||||||||||||||||||||||||||||||||||||||||||||||||||||||||||||||||||||||||||||||||||||||||||||||||||||||||||||||||||||||||||||||||||||||||||||||||||||||||||||||||||||||||||||||||||||||||||||
| |
| Phenotypic Information (metabolism pathway, cancer, disease, phenome) |
| |
| |
| Gene-Gene Network Information: Co-Expression Network, Interacting Genes & KEGG |
| |
|


| Gene Summary for PTDSS1 |
| Basic gene info. | Gene symbol | PTDSS1 |
| Gene name | phosphatidylserine synthase 1 | |
| Synonyms | LMHD|PSS1|PSSA | |
| Cytomap | UCSC genome browser: 8q22 | |
| Genomic location | chr8 :97274166-97346774 | |
| Type of gene | protein-coding | |
| RefGenes | NM_001290225.1, NM_014754.2, | |
| Ensembl id | ENSG00000156471 | |
| Description | PSS-1ptdSer synthase 1serine-exchange enzyme I | |
| Modification date | 20141207 | |
| dbXrefs | MIM : 612792 | |
| HGNC : HGNC | ||
| HPRD : 17926 | ||
| Protein | UniProt: go to UniProt's Cross Reference DB Table | |
| Expression | CleanEX: HS_PTDSS1 | |
| BioGPS: 9791 | ||
| Gene Expression Atlas: ENSG00000156471 | ||
| The Human Protein Atlas: ENSG00000156471 | ||
| Pathway | NCI Pathway Interaction Database: PTDSS1 | |
| KEGG: PTDSS1 | ||
| REACTOME: PTDSS1 | ||
| ConsensusPathDB | ||
| Pathway Commons: PTDSS1 | ||
| Metabolism | MetaCyc: PTDSS1 | |
| HUMANCyc: PTDSS1 | ||
| Regulation | Ensembl's Regulation: ENSG00000156471 | |
| miRBase: chr8 :97,274,166-97,346,774 | ||
| TargetScan: NM_001290225 | ||
| cisRED: ENSG00000156471 | ||
| Context | iHOP: PTDSS1 | |
| cancer metabolism search in PubMed: PTDSS1 | ||
| UCL Cancer Institute: PTDSS1 | ||
| Assigned class in ccmGDB | C | |
| Top |
| Phenotypic Information for PTDSS1(metabolism pathway, cancer, disease, phenome) |
| Cancer | CGAP: PTDSS1 |
| Familial Cancer Database: PTDSS1 | |
| * This gene is included in those cancer gene databases. |
|
|
|
|
|
| . | |||||||||||||||||||||||||||||||||||||||||||||||||||||||||||||||||||||||||||||||||||||||||||||||||||||||||||||||||||||||||||||||||||||||||||||||||||||||||||||||||||||||||||||||||||||||||||||||||||||||||||||||||||||||||||||||||||||||||||||||||||||||||||||||||||||||||||||||||||||||||||||||||||||||||||||||||||||||||||||||||||||||
Oncogene 1 | Significant driver gene in | ||||||||||||||||||||||||||||||||||||||||||||||||||||||||||||||||||||||||||||||||||||||||||||||||||||||||||||||||||||||||||||||||||||||||||||||||||||||||||||||||||||||||||||||||||||||||||||||||||||||||||||||||||||||||||||||||||||||||||||||||||||||||||||||||||||||||||||||||||||||||||||||||||||||||||||||||||||||||||||||||||||||||||||
| cf) number; DB name 1 Oncogene; http://nar.oxfordjournals.org/content/35/suppl_1/D721.long, 2 Tumor Suppressor gene; https://bioinfo.uth.edu/TSGene/, 3 Cancer Gene Census; http://www.nature.com/nrc/journal/v4/n3/abs/nrc1299.html, 4 CancerGenes; http://nar.oxfordjournals.org/content/35/suppl_1/D721.long, 5 Network of Cancer Gene; http://ncg.kcl.ac.uk/index.php, 1Therapeutic Vulnerabilities in Cancer; http://cbio.mskcc.org/cancergenomics/statius/ |
| KEGG_GLYCEROPHOSPHOLIPID_METABOLISM REACTOME_PHOSPHOLIPID_METABOLISM REACTOME_METABOLISM_OF_LIPIDS_AND_LIPOPROTEINS | |
| OMIM | |
| Orphanet | |
| Disease | KEGG Disease: PTDSS1 |
| MedGen: PTDSS1 (Human Medical Genetics with Condition) | |
| ClinVar: PTDSS1 | |
| Phenotype | MGI: PTDSS1 (International Mouse Phenotyping Consortium) |
| PhenomicDB: PTDSS1 | |
| Mutations for PTDSS1 |
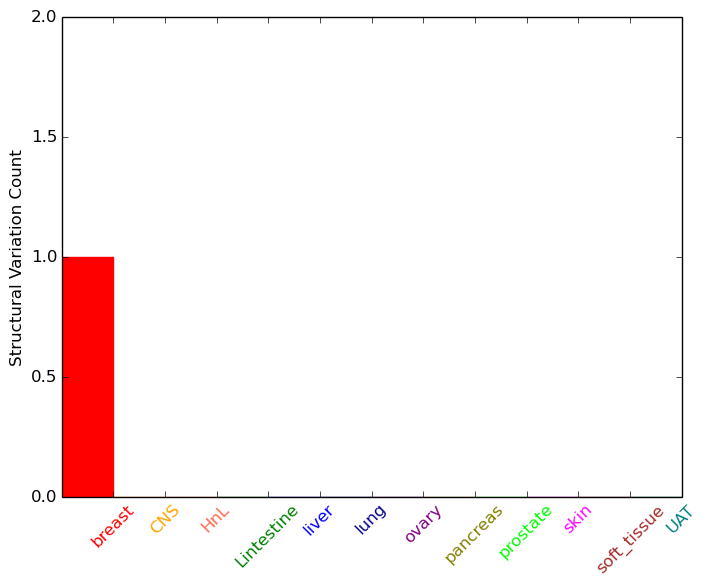
| * Under tables are showing count per each tissue to give us broad intuition about tissue specific mutation patterns.You can go to the detailed page for each mutation database's web site. |
| - Statistics for Tissue and Mutation type | Top |
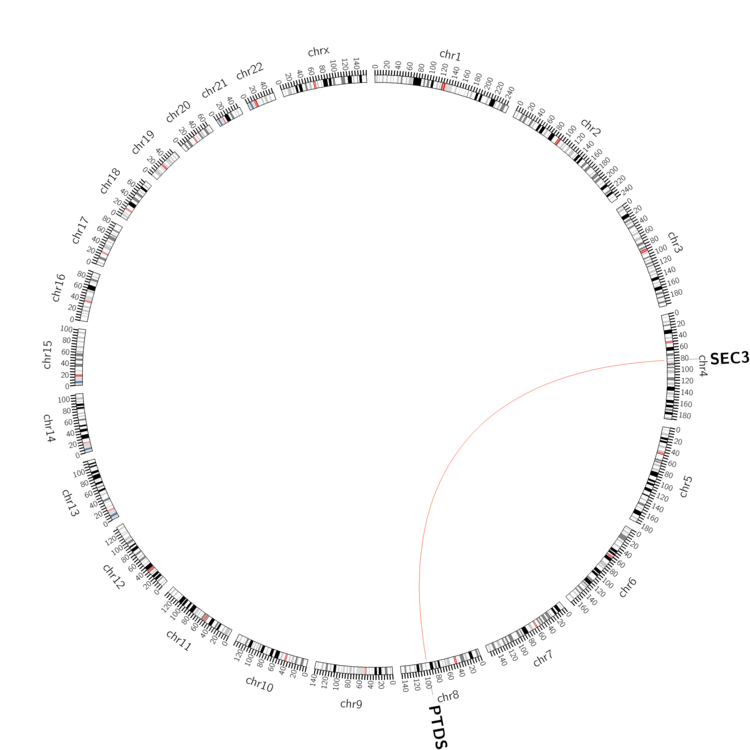 |
| - For Inter-chromosomal Variations |
| * Inter-chromosomal variantions includes 'interchromosomal amplicon to amplicon', 'interchromosomal amplicon to non-amplified dna', 'interchromosomal insertion', 'Interchromosomal unknown type'. |
 |
| - For Intra-chromosomal Variations |
| There's no intra-chromosomal structural variation. |
| Sample | Symbol_a | Chr_a | Start_a | End_a | Symbol_b | Chr_b | Start_b | End_b |
| cf) Tissue number; Tissue name (1;Breast, 2;Central_nervous_system, 3;Haematopoietic_and_lymphoid_tissue, 4;Large_intestine, 5;Liver, 6;Lung, 7;Ovary, 8;Pancreas, 9;Prostate, 10;Skin, 11;Soft_tissue, 12;Upper_aerodigestive_tract) |
| * From mRNA Sanger sequences, Chitars2.0 arranged chimeric transcripts. This table shows PTDSS1 related fusion information. |
| ID | Head Gene | Tail Gene | Accession | Gene_a | qStart_a | qEnd_a | Chromosome_a | tStart_a | tEnd_a | Gene_a | qStart_a | qEnd_a | Chromosome_a | tStart_a | tEnd_a |
| BE677852 | PTDSS1 | 5 | 132 | 8 | 97346653 | 97346780 | PTDSS1 | 130 | 357 | 8 | 97346007 | 97346234 | |
| AL589407 | WSCD1 | 1 | 313 | 17 | 6002153 | 6002468 | PTDSS1 | 309 | 492 | 8 | 97315086 | 97315269 | |
| Top |
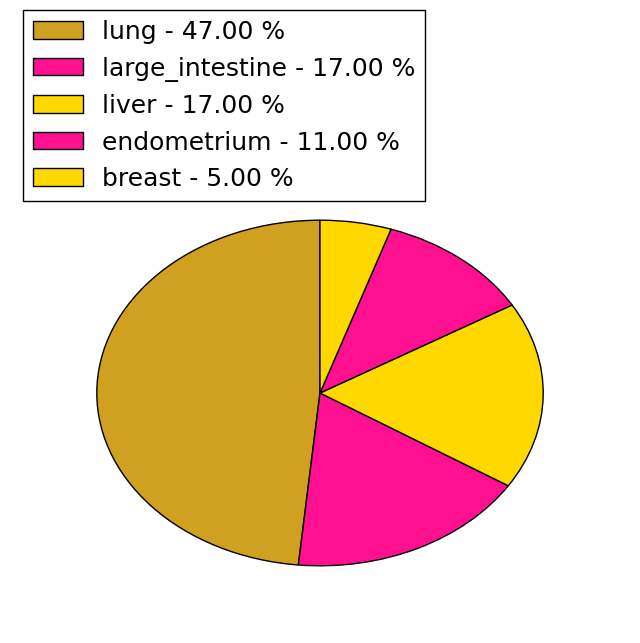
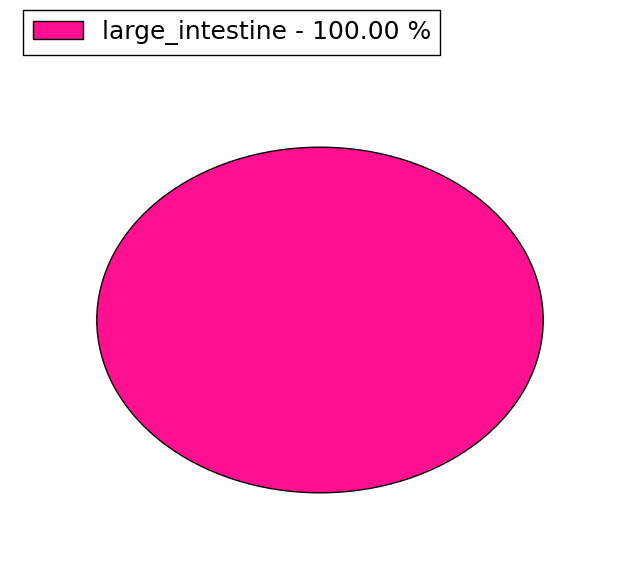
| Mutation type/ Tissue ID | brca | cns | cerv | endome | haematopo | kidn | Lintest | liver | lung | ns | ovary | pancre | prost | skin | stoma | thyro | urina | |||
| Total # sample | 3 | 1 | 2 | 1 | 2 | |||||||||||||||
| GAIN (# sample) | 3 | 1 | 2 | 1 | 2 | |||||||||||||||
| LOSS (# sample) |
| cf) Tissue ID; Tissue type (1; Breast, 2; Central_nervous_system, 3; Cervix, 4; Endometrium, 5; Haematopoietic_and_lymphoid_tissue, 6; Kidney, 7; Large_intestine, 8; Liver, 9; Lung, 10; NS, 11; Ovary, 12; Pancreas, 13; Prostate, 14; Skin, 15; Stomach, 16; Thyroid, 17; Urinary_tract) |
| Top |
|
 |
| Top |
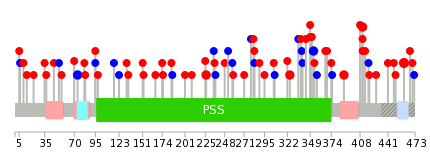
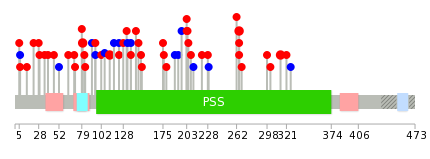
| Stat. for Non-Synonymous SNVs (# total SNVs=60) | (# total SNVs=17) |
 |  |
(# total SNVs=1) | (# total SNVs=0) |
 |
| Top |
| * When you move the cursor on each content, you can see more deailed mutation information on the Tooltip. Those are primary_site,primary_histology,mutation(aa),pubmedID. |
| GRCh37 position | Mutation(aa) | Unique sampleID count |
| chr8:97345750-97345750 | p.R460W | 3 |
| chr8:97318750-97318750 | p.L325I | 2 |
| chr8:97311998-97311998 | p.N226S | 2 |
| chr8:97332566-97332566 | p.L389R | 2 |
| chr8:97321823-97321823 | p.R349H | 2 |
| chr8:97342499-97342499 | p.H411R | 2 |
| chr8:97321836-97321836 | p.Q353Q | 2 |
| chr8:97285569-97285569 | p.L74L | 2 |
| chr8:97299345-97299345 | p.R138* | 1 |
| chr8:97318741-97318741 | p.G322C | 1 |
| Top |
|
 |
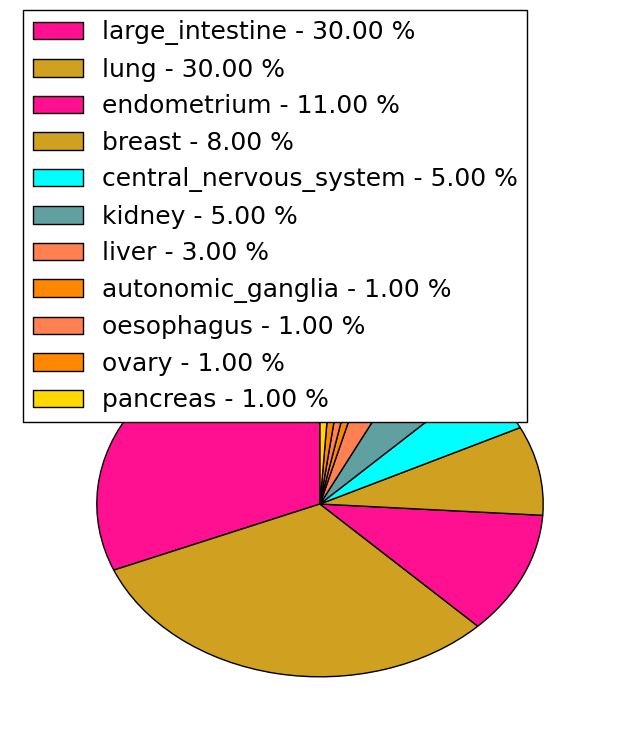
| Point Mutation/ Tissue ID | 1 | 2 | 3 | 4 | 5 | 6 | 7 | 8 | 9 | 10 | 11 | 12 | 13 | 14 | 15 | 16 | 17 | 18 | 19 | 20 |
| # sample | 2 | 3 | 13 | 3 | 4 | 2 | 14 | 5 | 1 | 1 | 1 | 2 | 4 | 6 | ||||||
| # mutation | 2 | 3 | 12 | 3 | 4 | 2 | 15 | 6 | 1 | 1 | 1 | 2 | 4 | 7 | ||||||
| nonsynonymous SNV | 2 | 2 | 10 | 3 | 4 | 2 | 11 | 4 | 1 | 1 | 1 | 2 | 5 | |||||||
| synonymous SNV | 1 | 2 | 4 | 2 | 2 | 2 | 2 |
| cf) Tissue ID; Tissue type (1; BLCA[Bladder Urothelial Carcinoma], 2; BRCA[Breast invasive carcinoma], 3; CESC[Cervical squamous cell carcinoma and endocervical adenocarcinoma], 4; COAD[Colon adenocarcinoma], 5; GBM[Glioblastoma multiforme], 6; Glioma Low Grade, 7; HNSC[Head and Neck squamous cell carcinoma], 8; KICH[Kidney Chromophobe], 9; KIRC[Kidney renal clear cell carcinoma], 10; KIRP[Kidney renal papillary cell carcinoma], 11; LAML[Acute Myeloid Leukemia], 12; LUAD[Lung adenocarcinoma], 13; LUSC[Lung squamous cell carcinoma], 14; OV[Ovarian serous cystadenocarcinoma ], 15; PAAD[Pancreatic adenocarcinoma], 16; PRAD[Prostate adenocarcinoma], 17; SKCM[Skin Cutaneous Melanoma], 18:STAD[Stomach adenocarcinoma], 19:THCA[Thyroid carcinoma], 20:UCEC[Uterine Corpus Endometrial Carcinoma]) |
| Top |
| * We represented just top 10 SNVs. When you move the cursor on each content, you can see more deailed mutation information on the Tooltip. Those are primary_site, primary_histology, mutation(aa), pubmedID. |
| Genomic Position | Mutation(aa) | Unique sampleID count |
| chr8:97311998 | p.H265R,PTDSS1 | 2 |
| chr8:97299302 | p.N80S,PTDSS1 | 2 |
| chr8:97345750 | p.R314W,PTDSS1 | 2 |
| chr8:97316287 | p.G112W,PTDSS1 | 2 |
| chr8:97342499 | p.F123F | 2 |
| chr8:97311995 | p.V5A | 1 |
| chr8:97342509 | p.N6T,PTDSS1 | 1 |
| chr8:97274286 | p.L146I,PTDSS1 | 1 |
| chr8:97316399 | p.D228N,PTDSS1 | 1 |
| chr8:97299284 | p.L229L,PTDSS1 | 1 |
| * Copy number data were extracted from TCGA using R package TCGA-Assembler. The URLs of all public data files on TCGA DCC data server were gathered on Jan-05-2015. Function ProcessCNAData in TCGA-Assembler package was used to obtain gene-level copy number value which is calculated as the average copy number of the genomic region of a gene. |
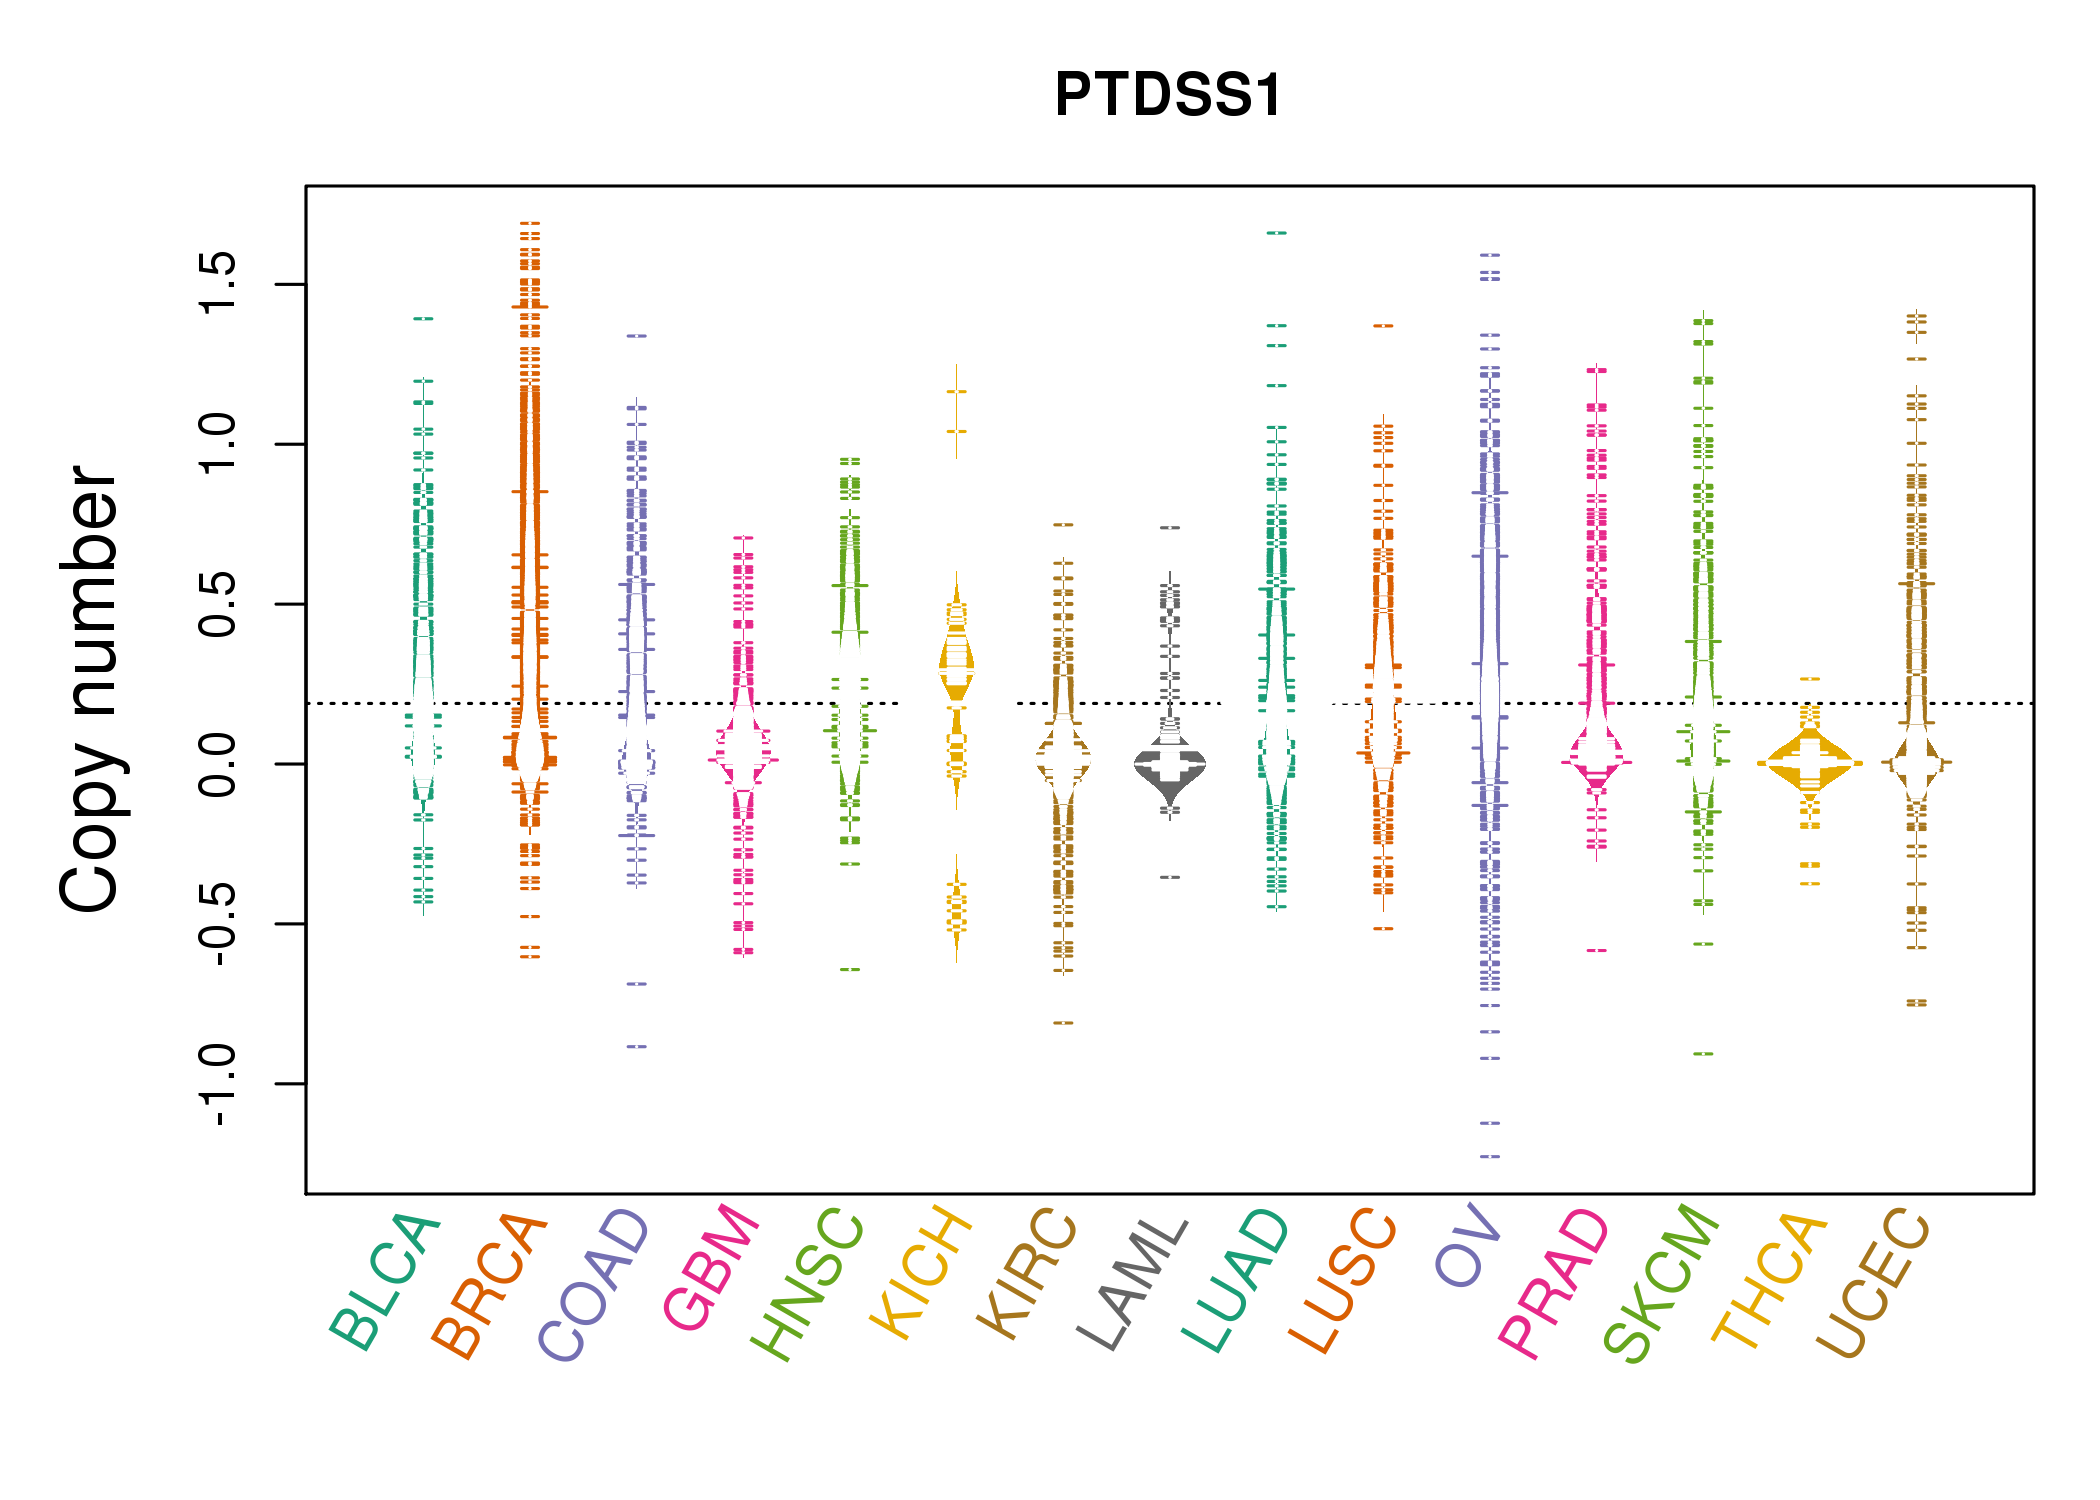 |
| cf) Tissue ID[Tissue type]: BLCA[Bladder Urothelial Carcinoma], BRCA[Breast invasive carcinoma], CESC[Cervical squamous cell carcinoma and endocervical adenocarcinoma], COAD[Colon adenocarcinoma], GBM[Glioblastoma multiforme], Glioma Low Grade, HNSC[Head and Neck squamous cell carcinoma], KICH[Kidney Chromophobe], KIRC[Kidney renal clear cell carcinoma], KIRP[Kidney renal papillary cell carcinoma], LAML[Acute Myeloid Leukemia], LUAD[Lung adenocarcinoma], LUSC[Lung squamous cell carcinoma], OV[Ovarian serous cystadenocarcinoma ], PAAD[Pancreatic adenocarcinoma], PRAD[Prostate adenocarcinoma], SKCM[Skin Cutaneous Melanoma], STAD[Stomach adenocarcinoma], THCA[Thyroid carcinoma], UCEC[Uterine Corpus Endometrial Carcinoma] |
| Top |
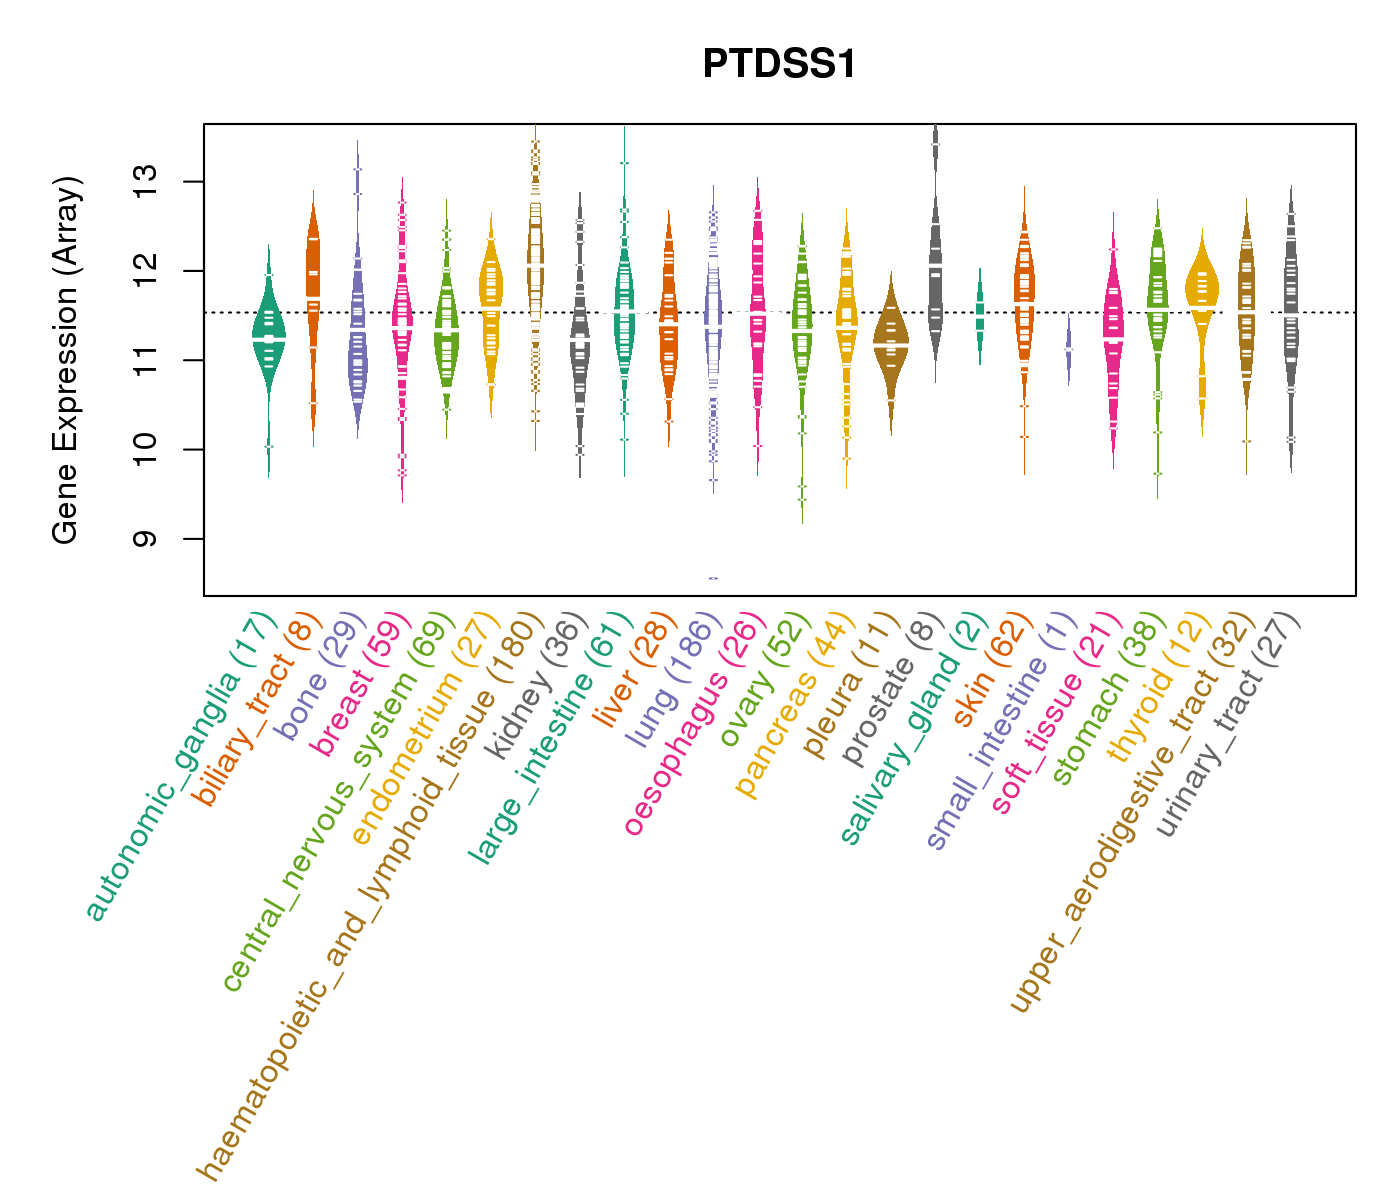
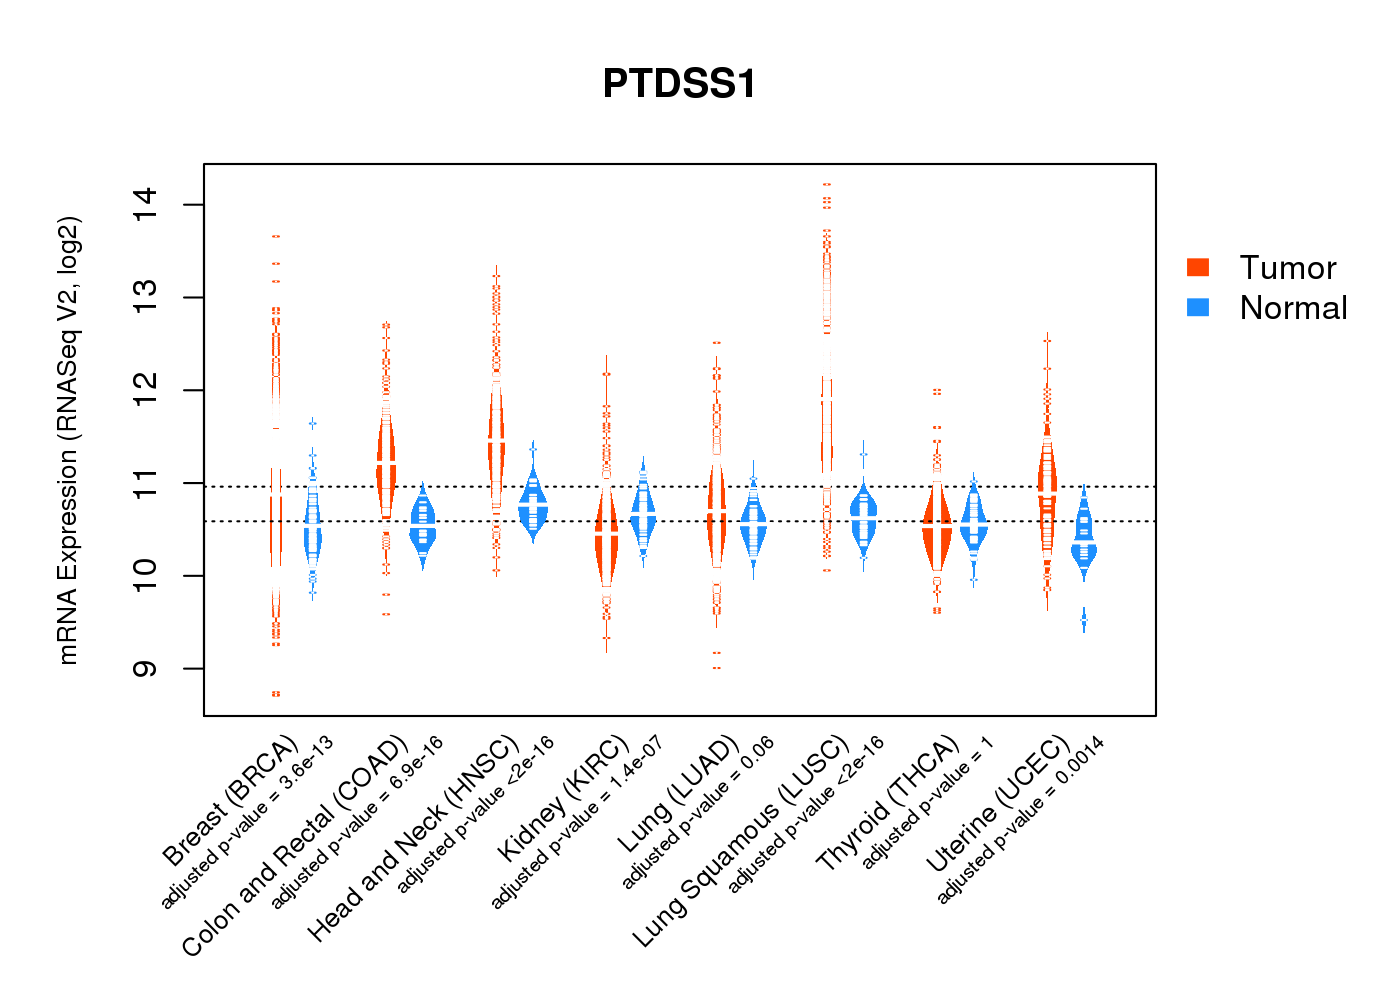
| Gene Expression for PTDSS1 |
| * CCLE gene expression data were extracted from CCLE_Expression_Entrez_2012-10-18.res: Gene-centric RMA-normalized mRNA expression data. |
 |
| * Normalized gene expression data of RNASeqV2 was extracted from TCGA using R package TCGA-Assembler. The URLs of all public data files on TCGA DCC data server were gathered at Jan-05-2015. Only eight cancer types have enough normal control samples for differential expression analysis. (t test, adjusted p<0.05 (using Benjamini-Hochberg FDR)) |
 |
| Top |
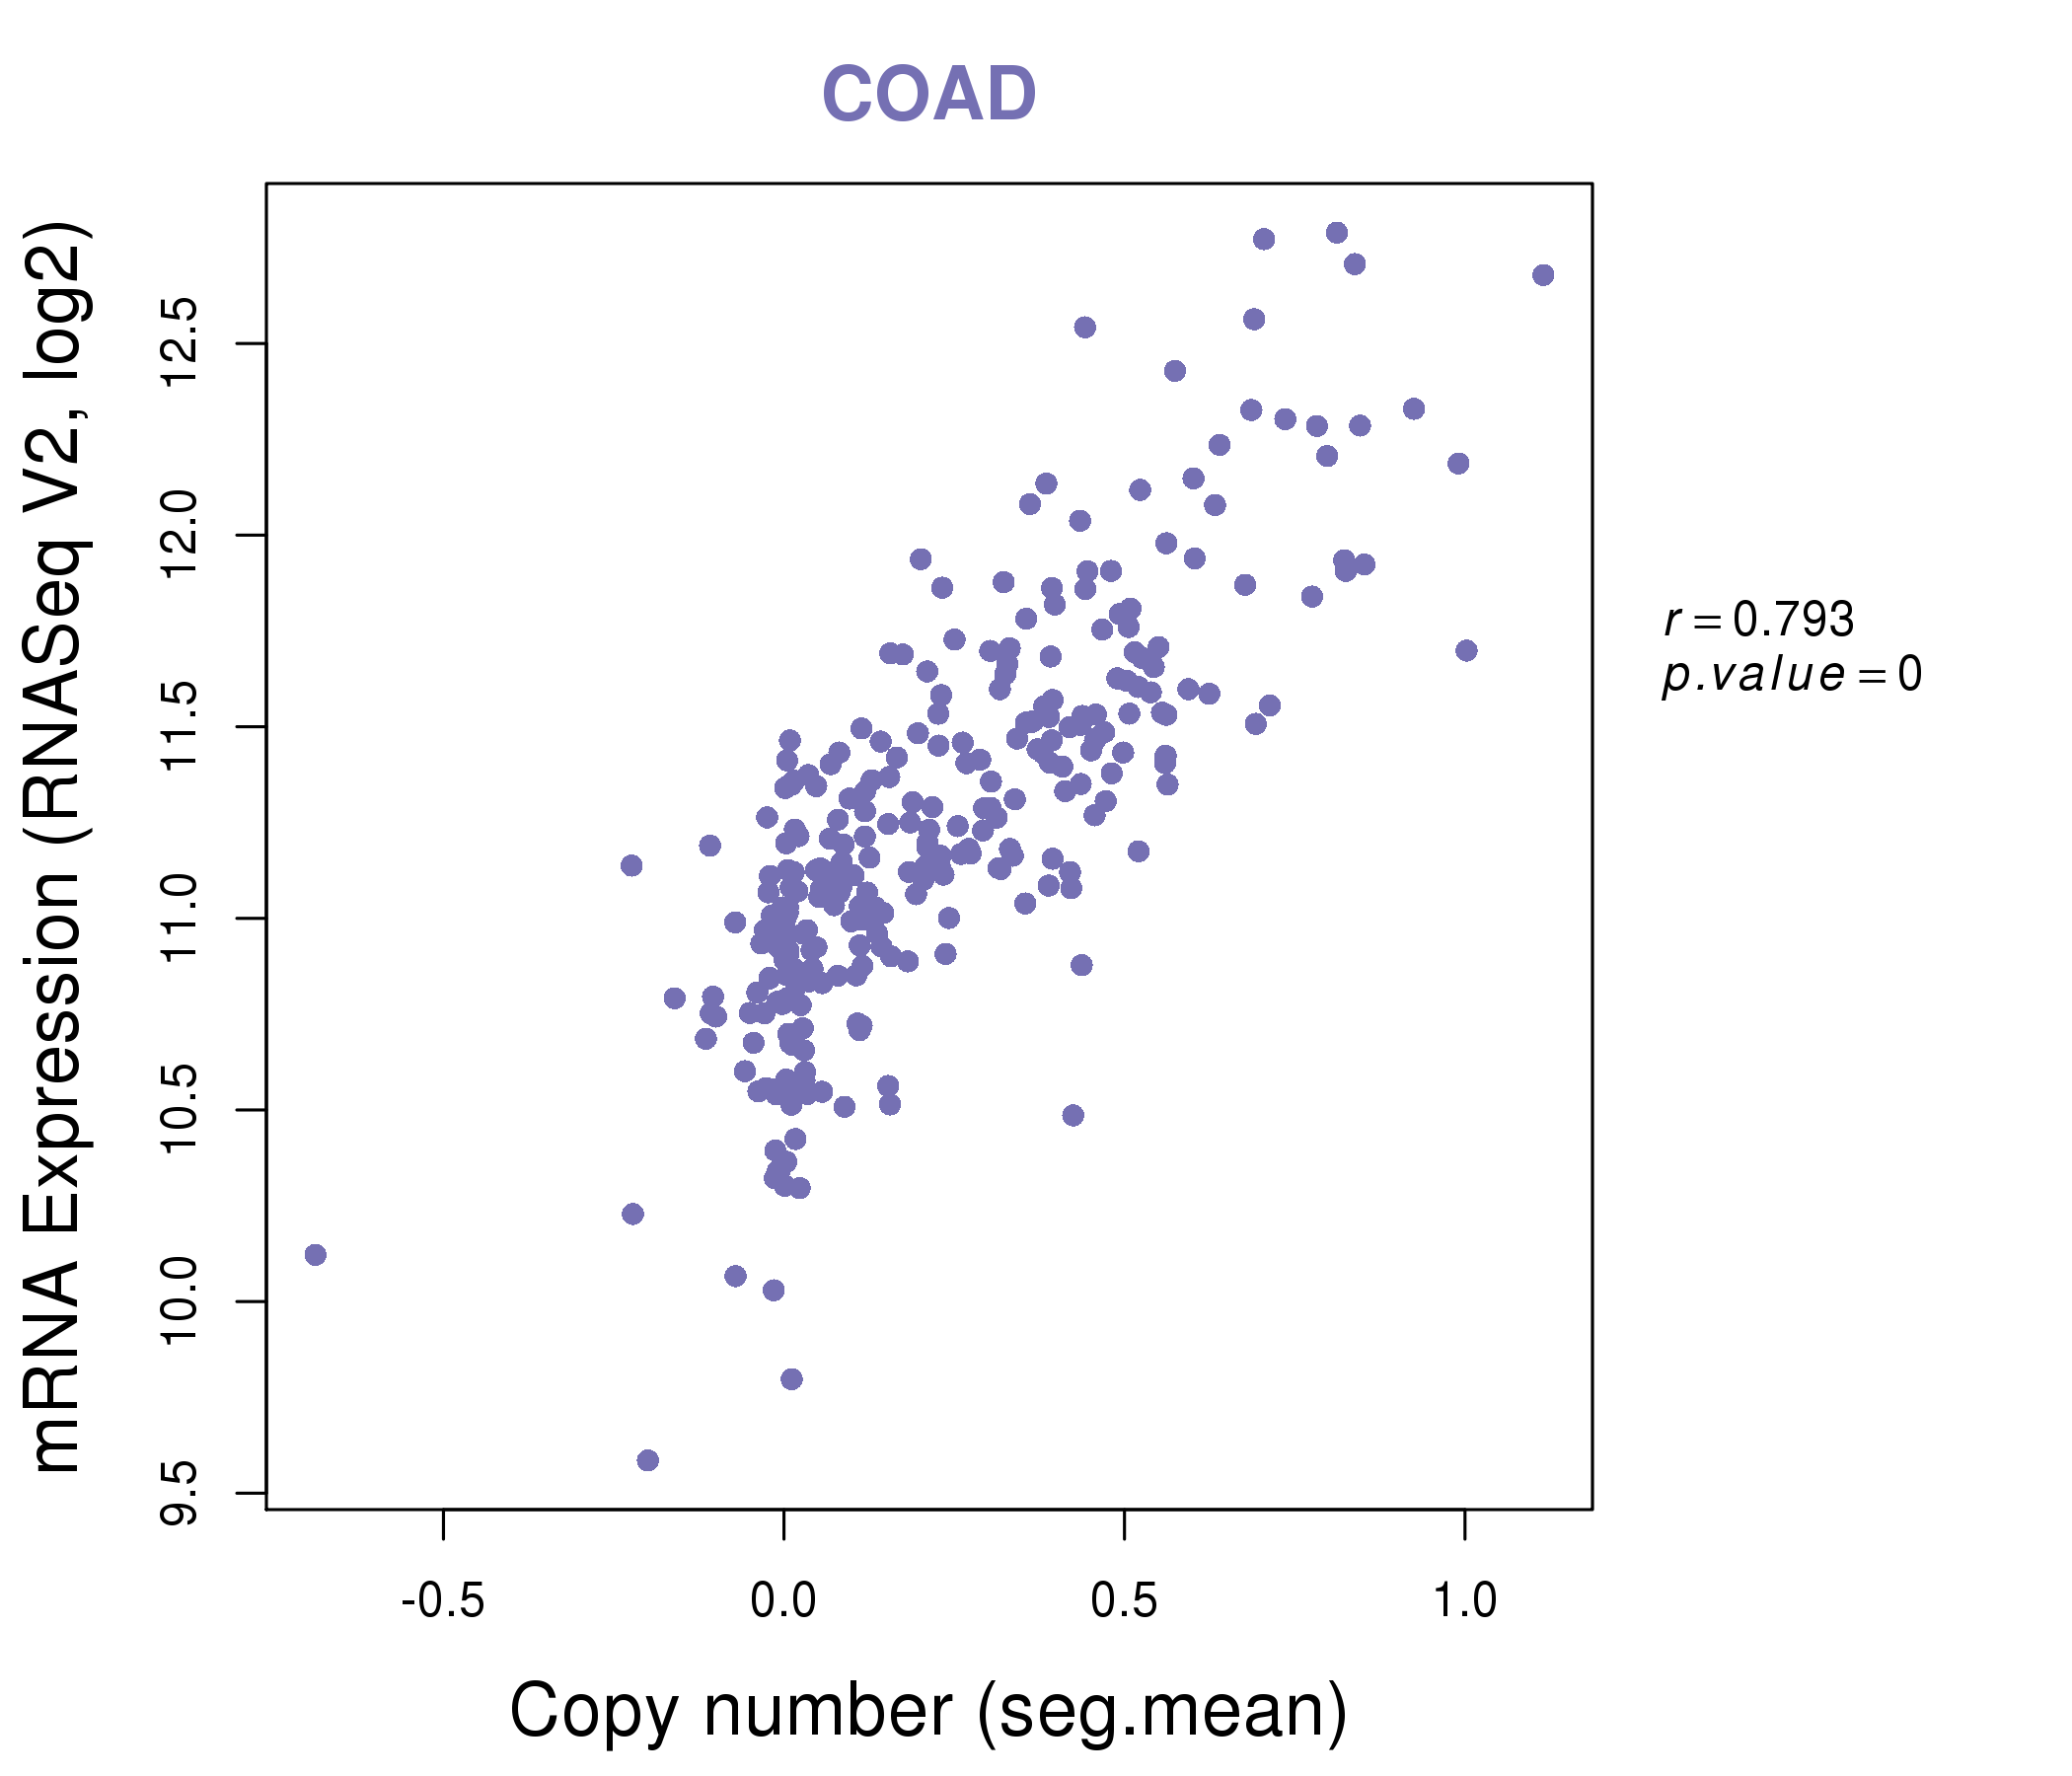
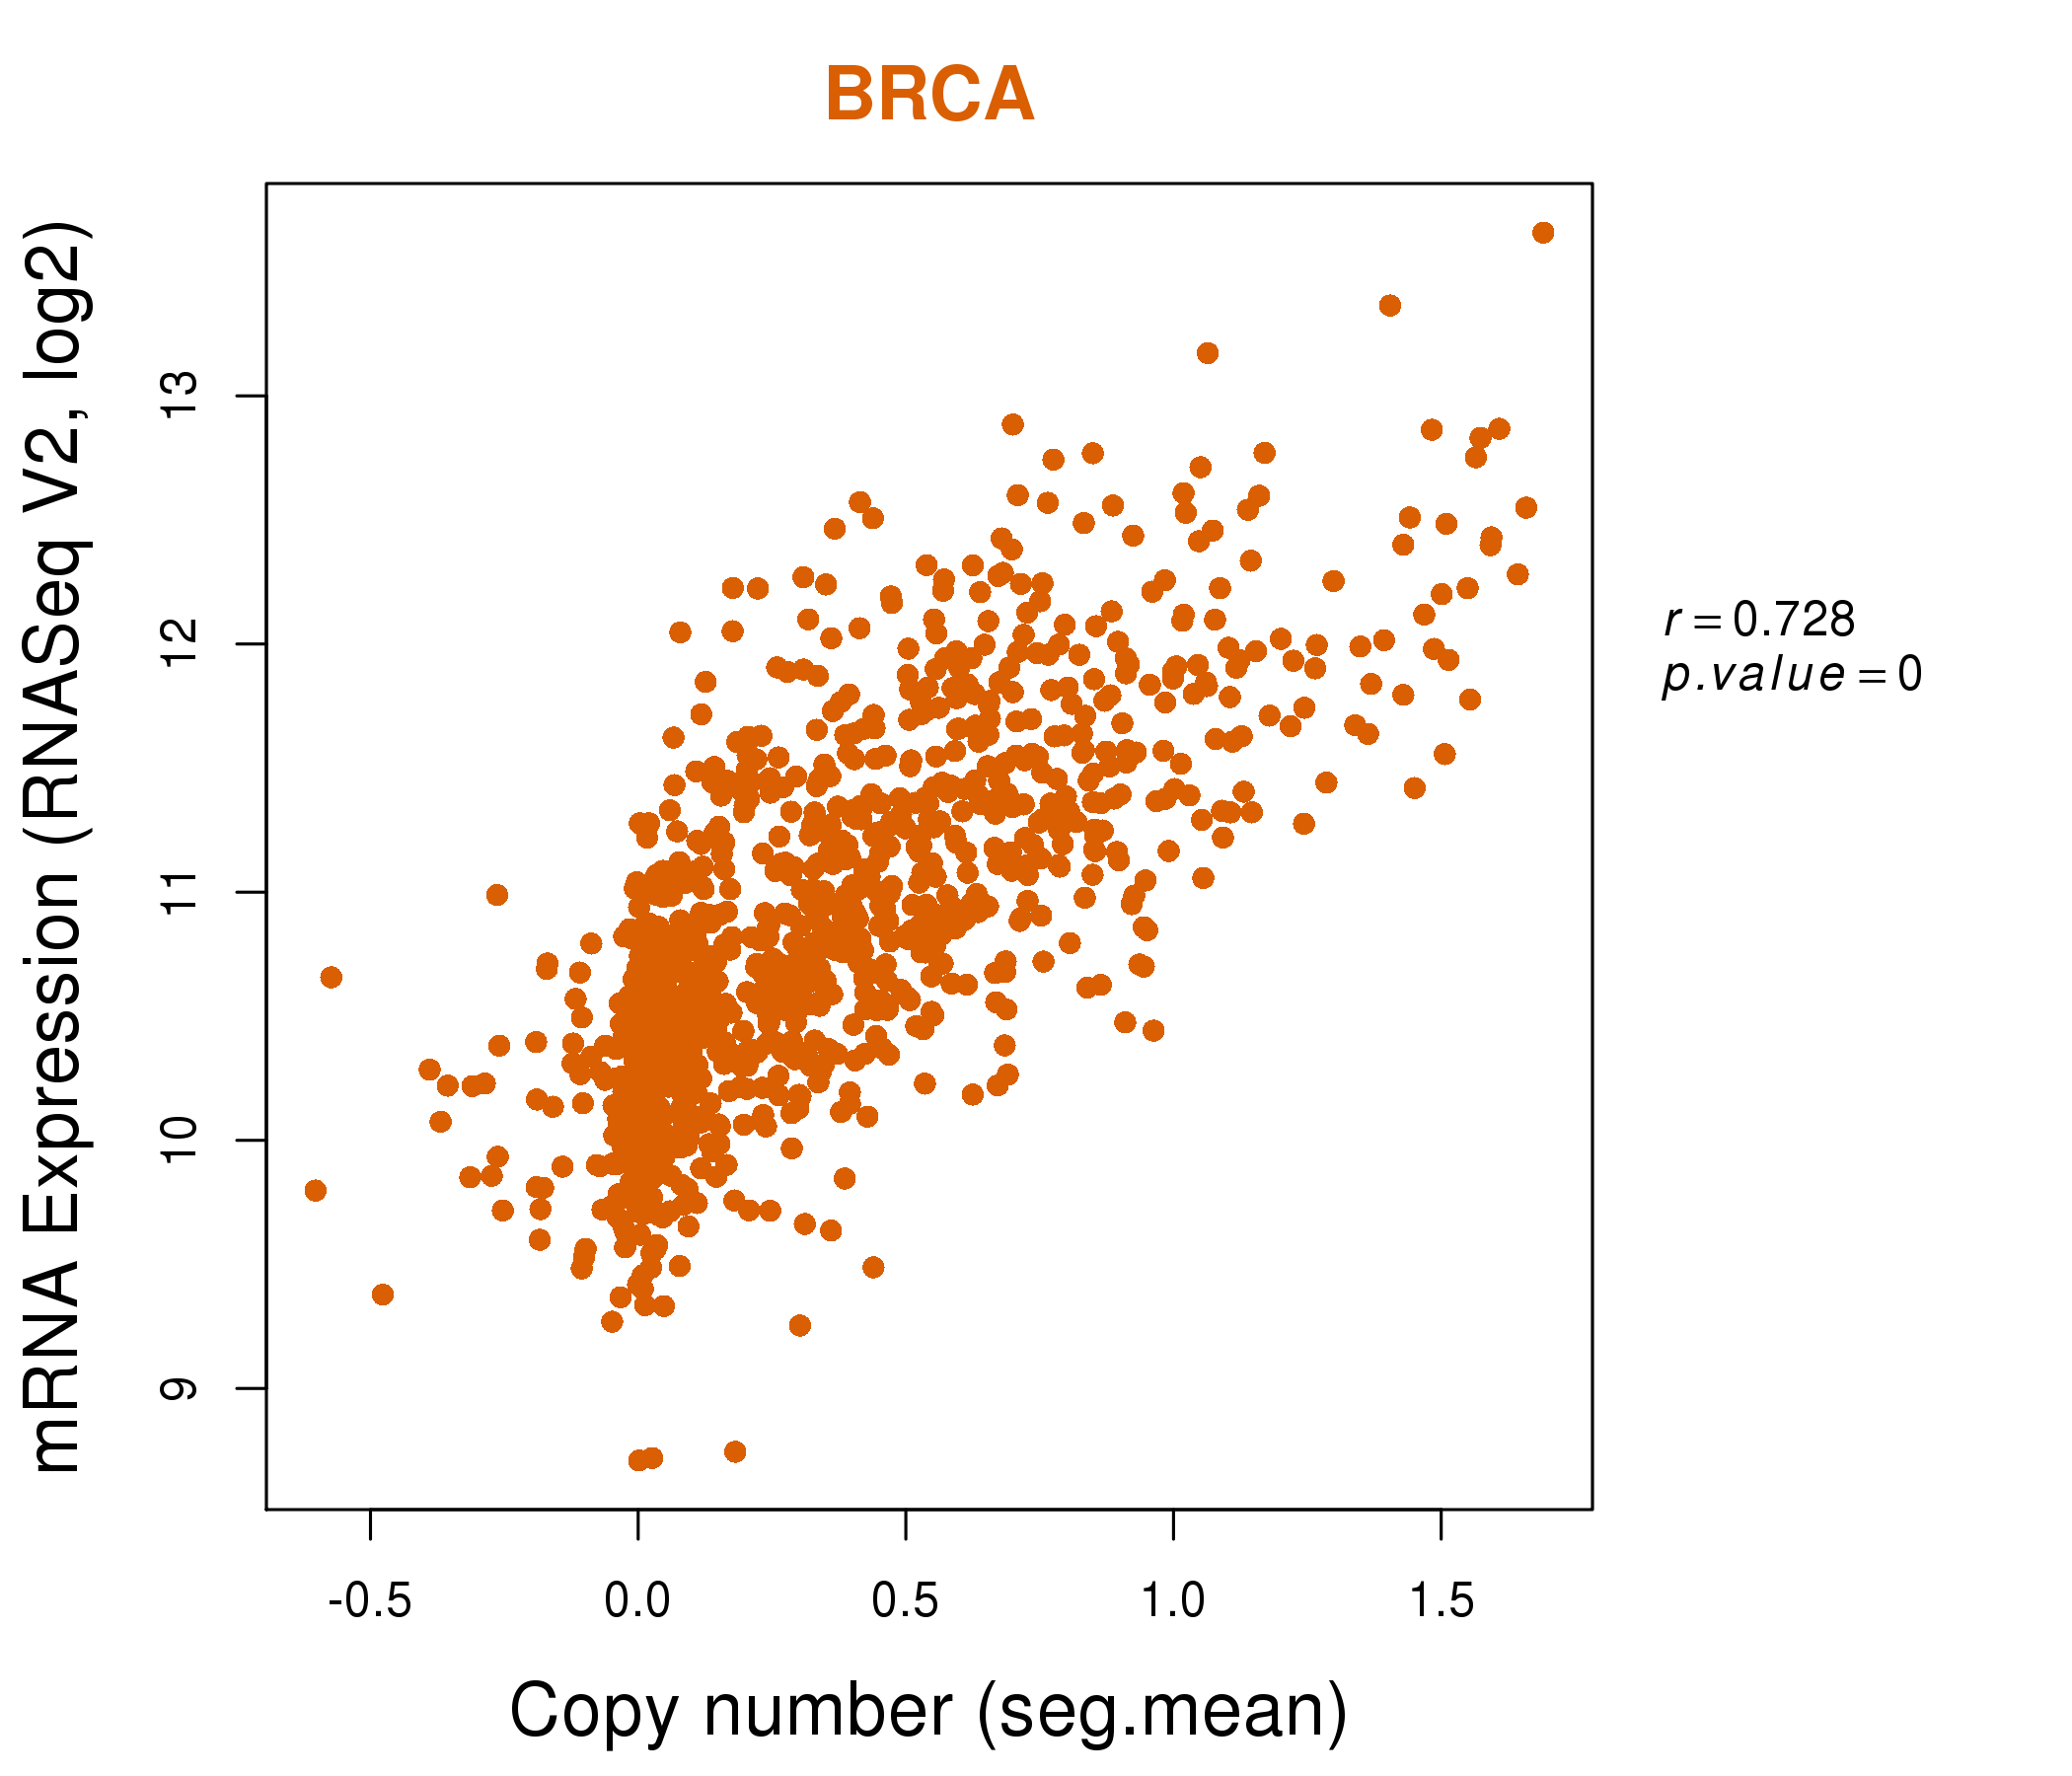
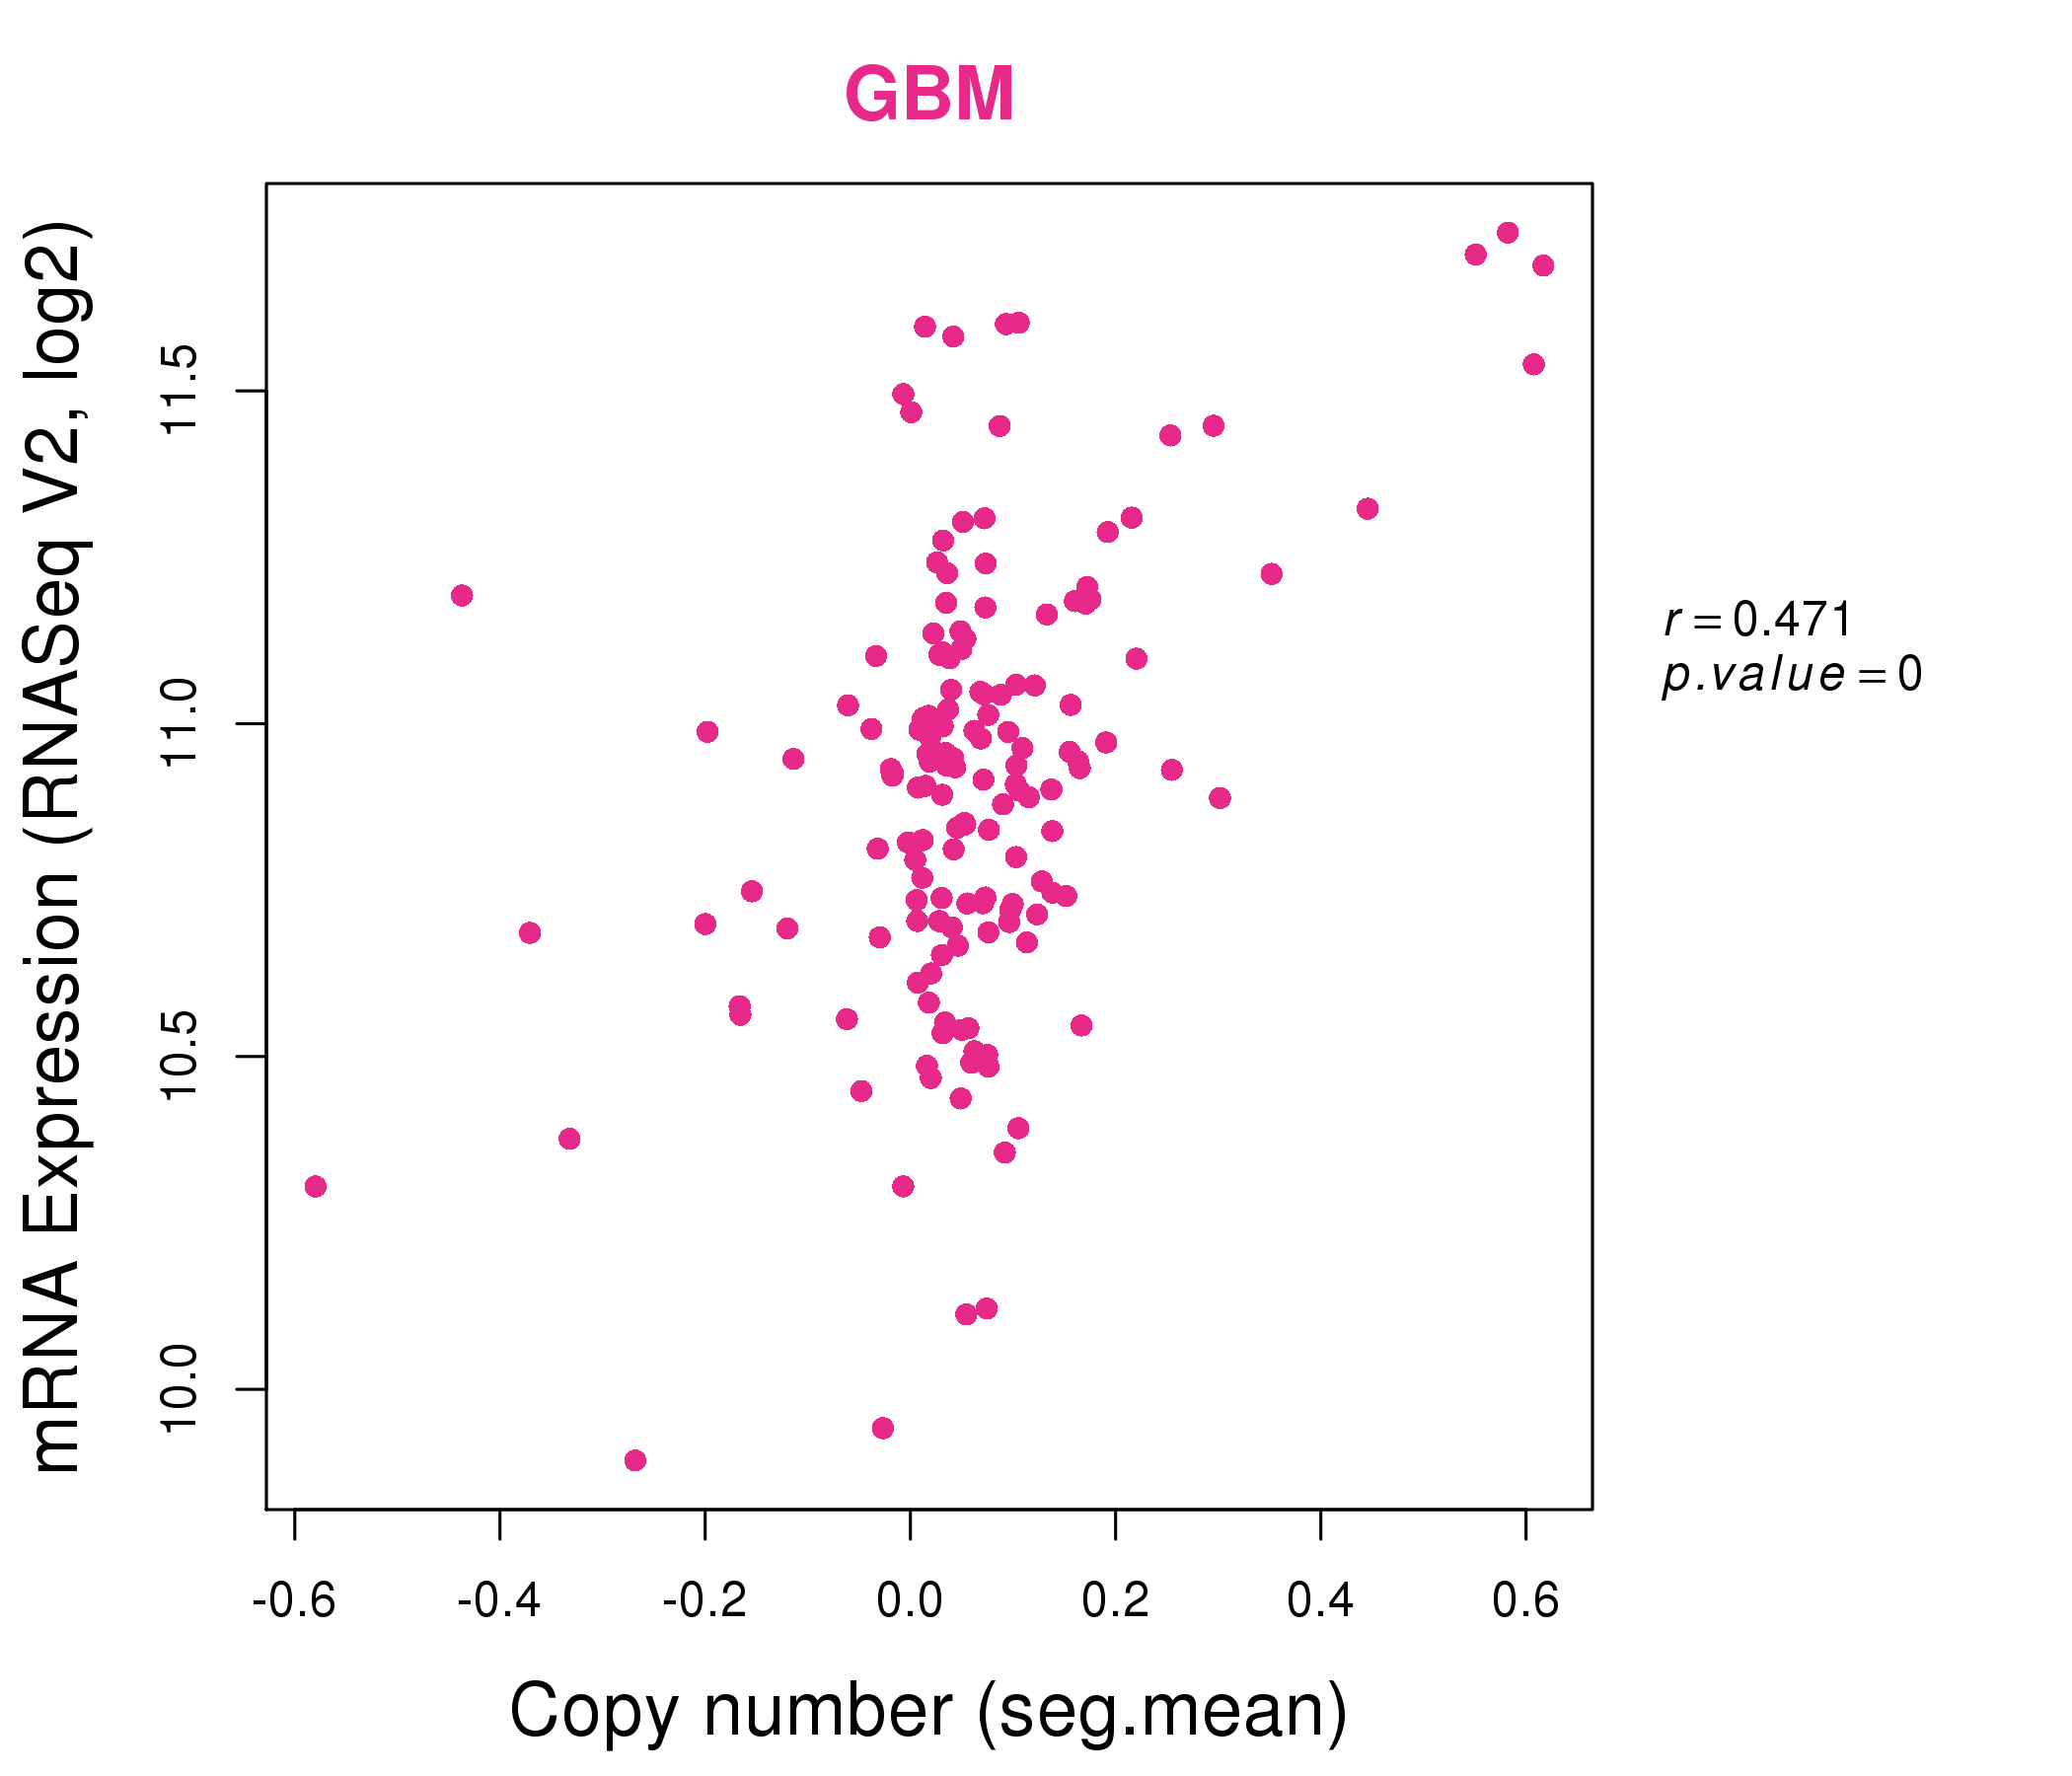
| * This plots show the correlation between CNV and gene expression. |
: Open all plots for all cancer types
 |
|
 |
|
| Top |
| Gene-Gene Network Information |
| * Co-Expression network figures were drawn using R package igraph. Only the top 20 genes with the highest correlations were shown. Red circle: input gene, orange circle: cell metabolism gene, sky circle: other gene |
: Open all plots for all cancer types
 |
| ||||
| CHMP4C,DCAF13,DSCC1,EIF3E,ESRP1,INTS8,MRPL15, MTDH,MTERF3,MTFR1,NUDCD1,PABPC1,POP1,PTDSS1, RAD54B,SLC25A32,TGS1,EMC2,UBE2V2,YWHAZ,ZFAND1 | APEX1,GID8,CHMP4C,CSTF1,DKC1,GINS2,ILF2, NONO,NPM1,PABPC1,PGAP2,PRMT5,PTDSS1,RAE1, RFC5,RPLP0,RPS4X,SET,SSR2,NELFCD,XRCC5 | ||||
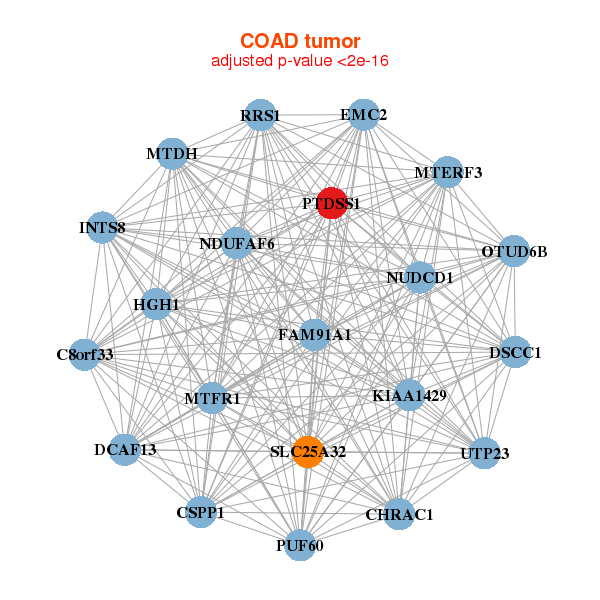 |
| ||||
| HGH1,C8orf33,NDUFAF6,CHRAC1,CSPP1,DCAF13,DSCC1, FAM91A1,INTS8,KIAA1429,MTDH,MTERF3,MTFR1,NUDCD1, OTUD6B,PTDSS1,PUF60,RRS1,SLC25A32,EMC2,UTP23 | CCT8,FARSB,FBL,GEMIN4,IMPDH2,LARS,MRPL37, MRPS2,MRPS30,MRPS9,NARS2,NOP14,PPIF,PTDSS1, RNMTL1,SHMT2,TMEM5,TRAP1,TSFM,UMPS,UNG |
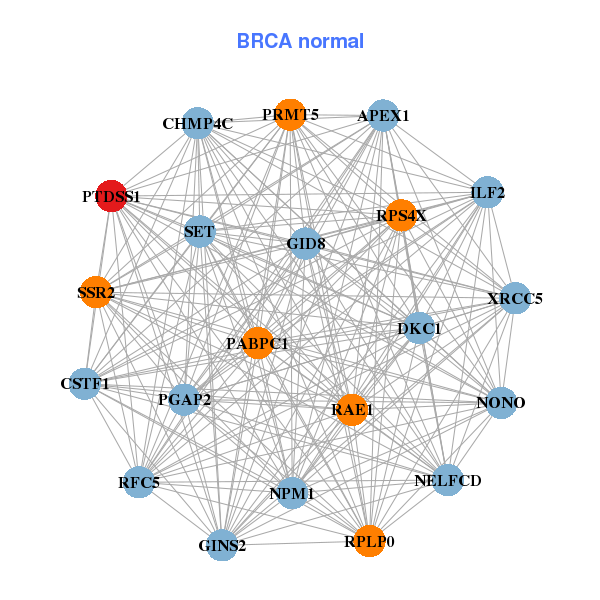
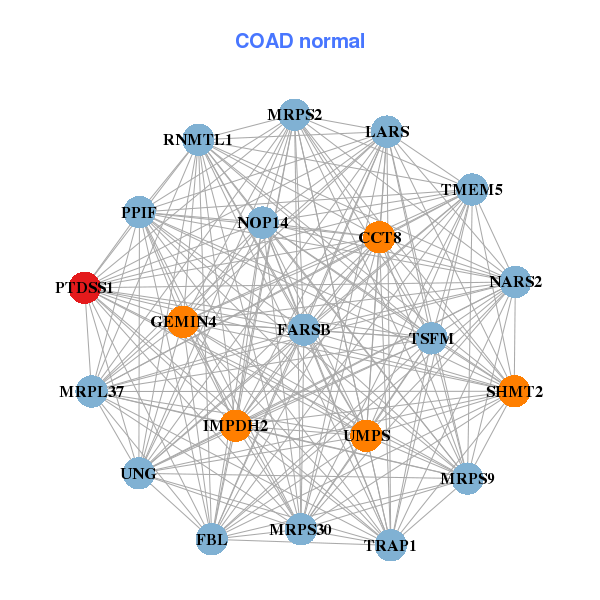
| * Co-Expression network figures were drawn using R package igraph. Only the top 20 genes with the highest correlations were shown. Red circle: input gene, orange circle: cell metabolism gene, sky circle: other gene |
: Open all plots for all cancer types
| Top |
: Open all interacting genes' information including KEGG pathway for all interacting genes from DAVID
| Top |
| Pharmacological Information for PTDSS1 |
| DB Category | DB Name | DB's ID and Url link |
| * Gene Centered Interaction Network. |
 |
| * Drug Centered Interaction Network. |
| DrugBank ID | Target Name | Drug Groups | Generic Name | Drug Centered Network | Drug Structure |
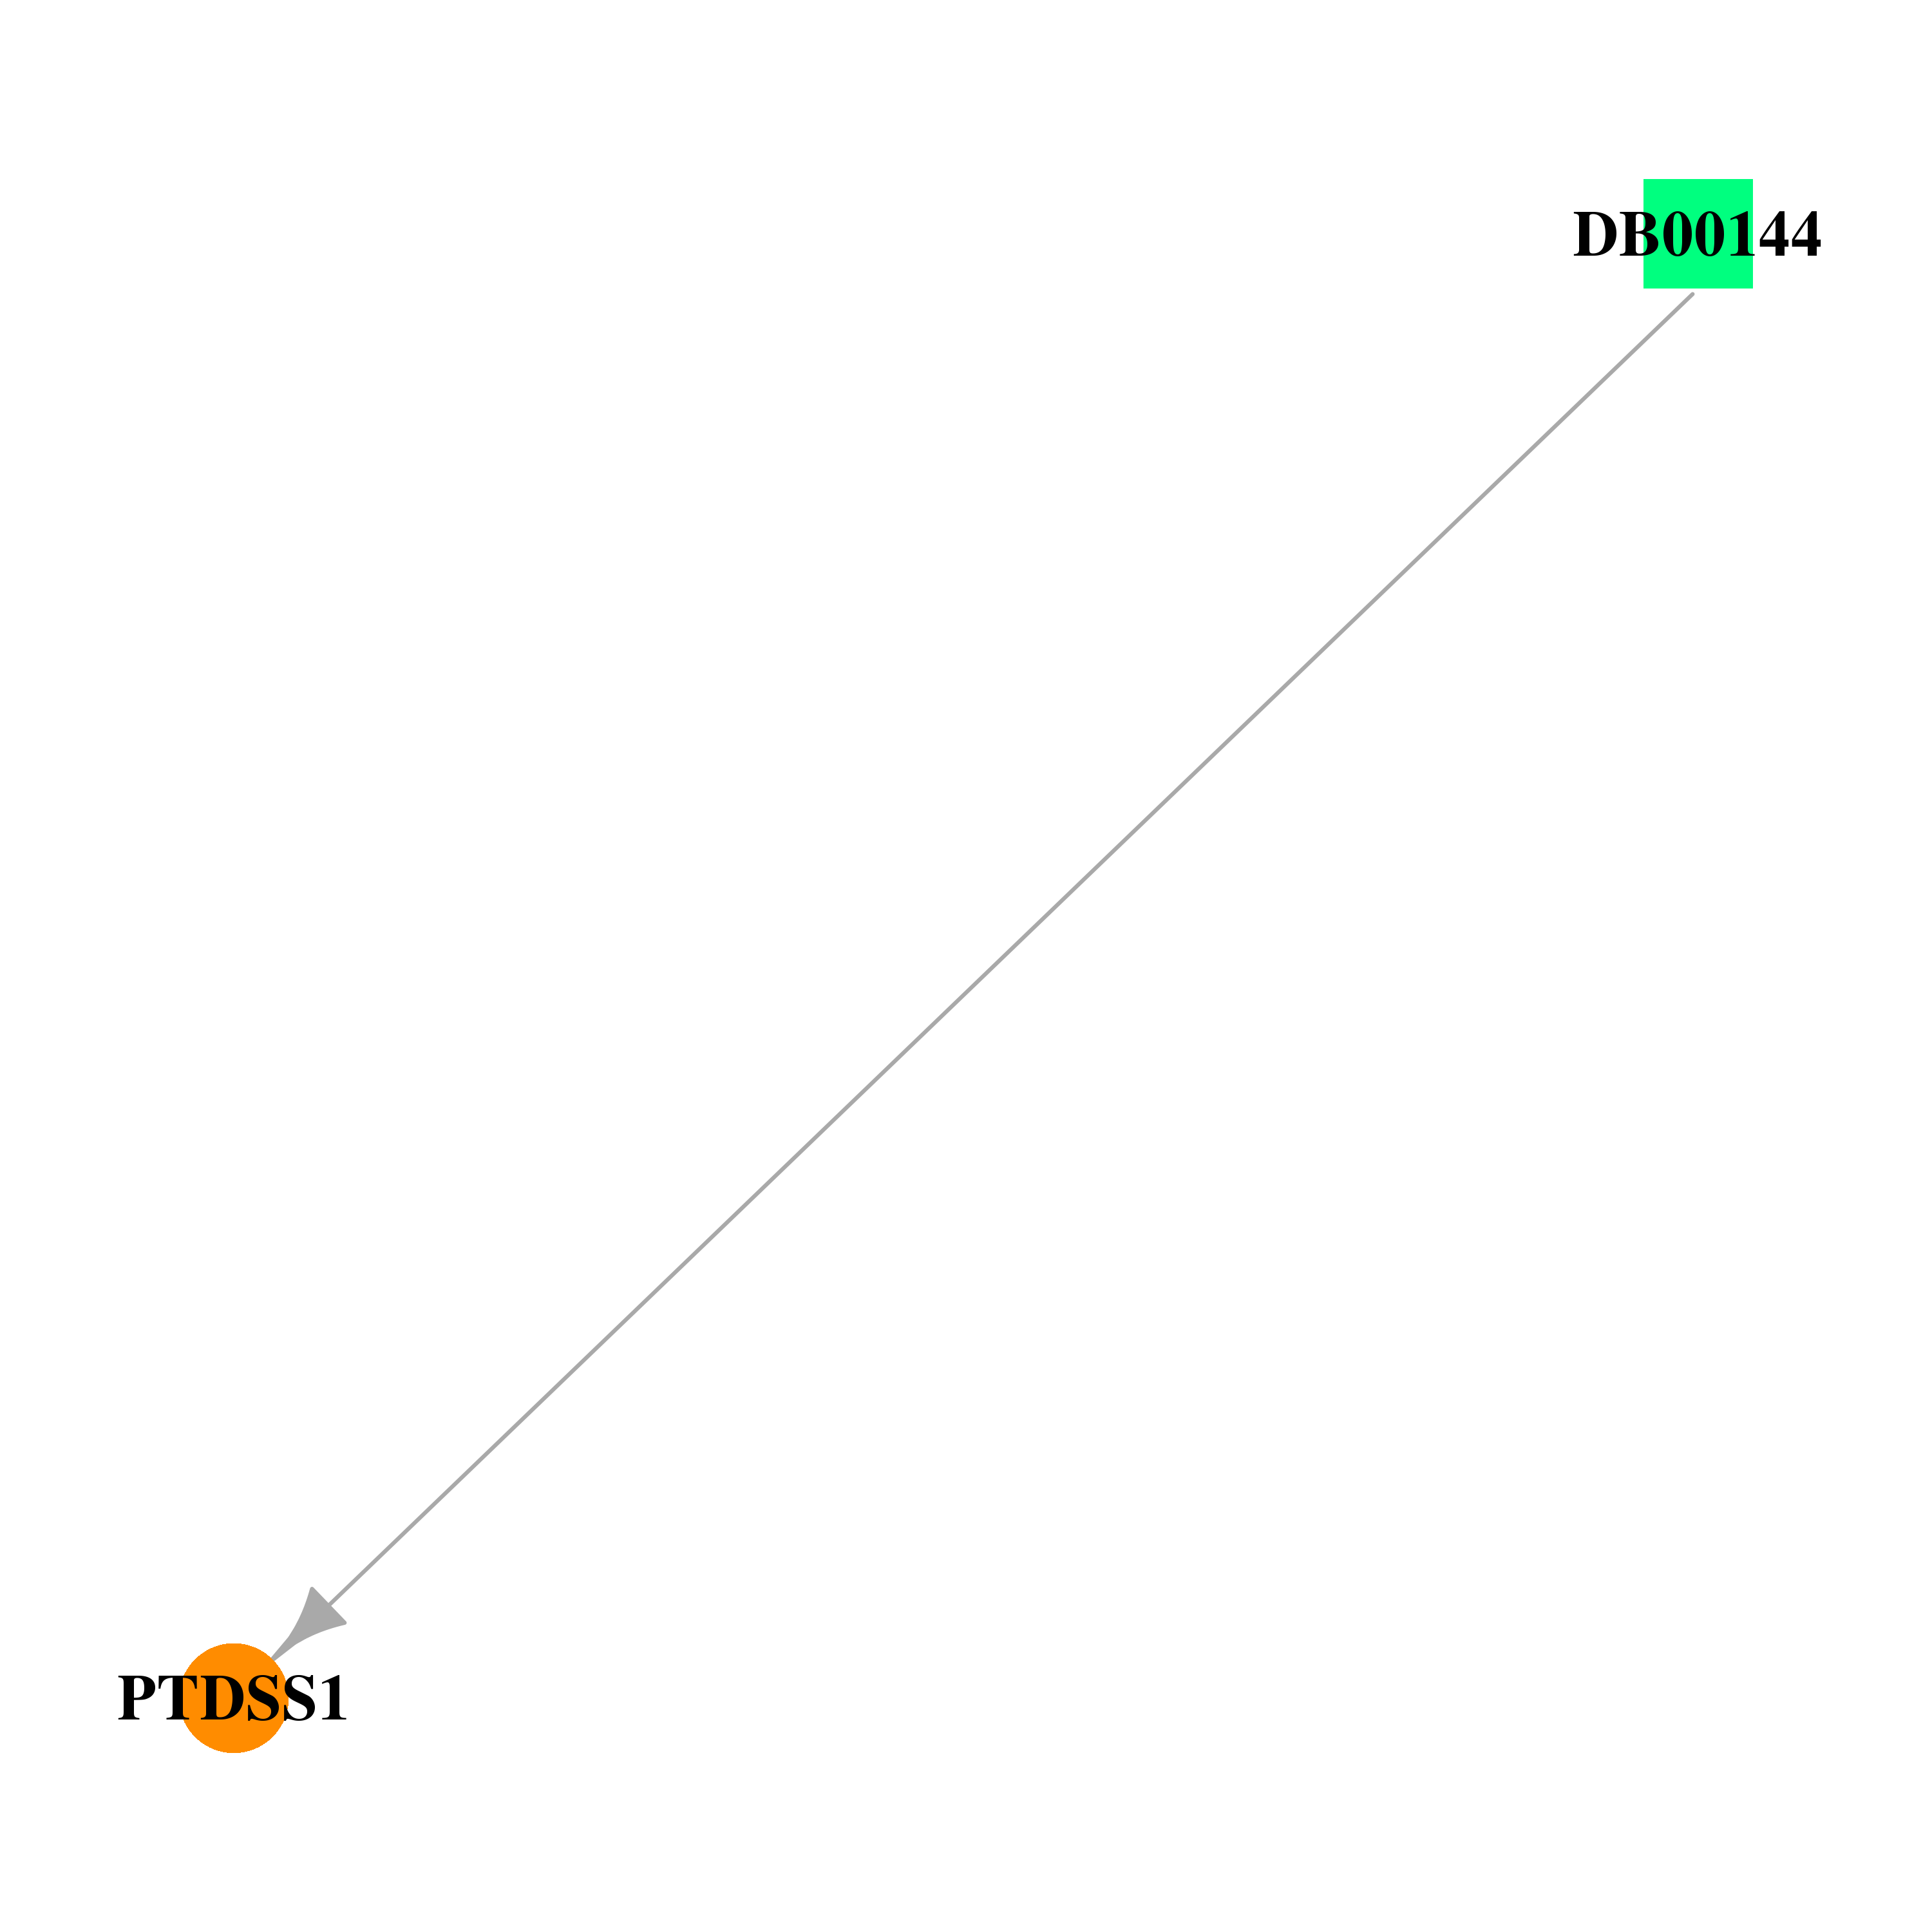
| DB00144 | phosphatidylserine synthase 1 | approved; nutraceutical | Phosphatidylserine |  |  |
| Top |
| Cross referenced IDs for PTDSS1 |
| * We obtained these cross-references from Uniprot database. It covers 150 different DBs, 18 categories. http://www.uniprot.org/help/cross_references_section |
: Open all cross reference information
|
Copyright © 2016-Present - The Univsersity of Texas Health Science Center at Houston @ |