|
||||||||||||||||||||||||||||||||||||||||||||||||||||||||||||||||||||||||||||||||||||||||||||||||||||||||||||||||||||||||||||||||||||||||||||||||||||||||||||||||||||||||||||||||||||||||||||||||||||||||||||||||||||||||||||||||||||||||||||||||||||||||||||||||||||||||||||||||||||||||||||||||||||||||||||||
| |
| Phenotypic Information (metabolism pathway, cancer, disease, phenome) |
| |
| |
| Gene-Gene Network Information: Co-Expression Network, Interacting Genes & KEGG |
| |
|


| Gene Summary for TOMM20 |
| Basic gene info. | Gene symbol | TOMM20 |
| Gene name | translocase of outer mitochondrial membrane 20 homolog (yeast) | |
| Synonyms | MAS20|MOM19|TOM20 | |
| Cytomap | UCSC genome browser: 1q42 | |
| Genomic location | chr1 :235272657-235292256 | |
| Type of gene | protein-coding | |
| RefGenes | NM_014765.2, | |
| Ensembl id | ENSG00000173726 | |
| Description | mitochondrial 20 kDa outer membrane proteinmitochondrial import receptor subunit TOM20 homologouter mitochondrial membrane receptor Tom20translocase of outer mitochondrial membrane 20 homolog type II | |
| Modification date | 20141207 | |
| dbXrefs | MIM : 601848 | |
| HGNC : HGNC | ||
| Ensembl : ENSG00000173726 | ||
| HPRD : 03507 | ||
| Vega : OTTHUMG00000039619 | ||
| Protein | UniProt: go to UniProt's Cross Reference DB Table | |
| Expression | CleanEX: HS_TOMM20 | |
| BioGPS: 9804 | ||
| Gene Expression Atlas: ENSG00000173726 | ||
| The Human Protein Atlas: ENSG00000173726 | ||
| Pathway | NCI Pathway Interaction Database: TOMM20 | |
| KEGG: TOMM20 | ||
| REACTOME: TOMM20 | ||
| ConsensusPathDB | ||
| Pathway Commons: TOMM20 | ||
| Metabolism | MetaCyc: TOMM20 | |
| HUMANCyc: TOMM20 | ||
| Regulation | Ensembl's Regulation: ENSG00000173726 | |
| miRBase: chr1 :235,272,657-235,292,256 | ||
| TargetScan: NM_014765 | ||
| cisRED: ENSG00000173726 | ||
| Context | iHOP: TOMM20 | |
| cancer metabolism search in PubMed: TOMM20 | ||
| UCL Cancer Institute: TOMM20 | ||
| Assigned class in ccmGDB | C | |
| Top |
| Phenotypic Information for TOMM20(metabolism pathway, cancer, disease, phenome) |
| Cancer | CGAP: TOMM20 |
| Familial Cancer Database: TOMM20 | |
| * This gene is included in those cancer gene databases. |
|
|
|
|
|
| . | ||||||||||||||||||||||||||||||||||||||||||||||||||||||||||||||||||||||||||||||||||||||||||||||||||||||||||||||||||||||||||||||||||||||||||||||||||||||||||||||||||||||||||||||||||||||||||||||||||||||||||||||||||||||||||||||||||||||||||||||||||||||||||||||||||||||||||||||||||||||||||||||||||||||||
Oncogene 1 | Significant driver gene in | |||||||||||||||||||||||||||||||||||||||||||||||||||||||||||||||||||||||||||||||||||||||||||||||||||||||||||||||||||||||||||||||||||||||||||||||||||||||||||||||||||||||||||||||||||||||||||||||||||||||||||||||||||||||||||||||||||||||||||||||||||||||||||||||||||||||||||||||||||||||||||||||||||||||||||||
| cf) number; DB name 1 Oncogene; http://nar.oxfordjournals.org/content/35/suppl_1/D721.long, 2 Tumor Suppressor gene; https://bioinfo.uth.edu/TSGene/, 3 Cancer Gene Census; http://www.nature.com/nrc/journal/v4/n3/abs/nrc1299.html, 4 CancerGenes; http://nar.oxfordjournals.org/content/35/suppl_1/D721.long, 5 Network of Cancer Gene; http://ncg.kcl.ac.uk/index.php, 1Therapeutic Vulnerabilities in Cancer; http://cbio.mskcc.org/cancergenomics/statius/ |
| REACTOME_METABOLISM_OF_PROTEINS | |
| OMIM | |
| Orphanet | |
| Disease | KEGG Disease: TOMM20 |
| MedGen: TOMM20 (Human Medical Genetics with Condition) | |
| ClinVar: TOMM20 | |
| Phenotype | MGI: TOMM20 (International Mouse Phenotyping Consortium) |
| PhenomicDB: TOMM20 | |
| Mutations for TOMM20 |
| * Under tables are showing count per each tissue to give us broad intuition about tissue specific mutation patterns.You can go to the detailed page for each mutation database's web site. |
| There's no structural variation information in COSMIC data for this gene. |
| * From mRNA Sanger sequences, Chitars2.0 arranged chimeric transcripts. This table shows TOMM20 related fusion information. |
| ID | Head Gene | Tail Gene | Accession | Gene_a | qStart_a | qEnd_a | Chromosome_a | tStart_a | tEnd_a | Gene_a | qStart_a | qEnd_a | Chromosome_a | tStart_a | tEnd_a |
| BI561585 | SLC20A1 | 11 | 83 | 2 | 113403596 | 113403668 | TOMM20 | 74 | 783 | 1 | 235275145 | 235292066 | |
| BF809919 | TOMM20 | 5 | 147 | 1 | 235273945 | 235274086 | SARNP | 146 | 214 | 12 | 56194347 | 56194415 | |
| Top |
| Mutation type/ Tissue ID | brca | cns | cerv | endome | haematopo | kidn | Lintest | liver | lung | ns | ovary | pancre | prost | skin | stoma | thyro | urina | |||
| Total # sample | 2 | 1 | 1 | 1 | ||||||||||||||||
| GAIN (# sample) | 2 | 1 | 1 | 1 | ||||||||||||||||
| LOSS (# sample) |
| cf) Tissue ID; Tissue type (1; Breast, 2; Central_nervous_system, 3; Cervix, 4; Endometrium, 5; Haematopoietic_and_lymphoid_tissue, 6; Kidney, 7; Large_intestine, 8; Liver, 9; Lung, 10; NS, 11; Ovary, 12; Pancreas, 13; Prostate, 14; Skin, 15; Stomach, 16; Thyroid, 17; Urinary_tract) |
| Top |
|
 |
| Top |
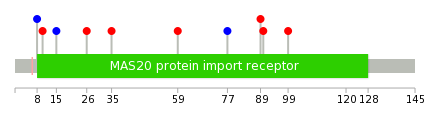
| Stat. for Non-Synonymous SNVs (# total SNVs=4) | (# total SNVs=1) |
 |  |
(# total SNVs=0) | (# total SNVs=0) |
| Top |
| * When you move the cursor on each content, you can see more deailed mutation information on the Tooltip. Those are primary_site,primary_histology,mutation(aa),pubmedID. |
| GRCh37 position | Mutation(aa) | Unique sampleID count |
| chr1:235283208-235283208 | p.D59N | 1 |
| chr1:235291927-235291927 | p.K35R | 1 |
| chr1:235291954-235291954 | p.R26H | 1 |
| chr1:235291986-235291986 | p.A15A | 1 |
| chr1:235292003-235292003 | p.A10T | 1 |
| chr1:235275430-235275431 | p.? | 1 |
| chr1:235292007-235292007 | p.I8I | 1 |
| chr1:235277103-235277103 | p.K125* | 1 |
| chr1:235277180-235277180 | p.V99E | 1 |
| chr1:235277208-235277208 | p.V90I | 1 |
| Top |
|
 |
| Point Mutation/ Tissue ID | 1 | 2 | 3 | 4 | 5 | 6 | 7 | 8 | 9 | 10 | 11 | 12 | 13 | 14 | 15 | 16 | 17 | 18 | 19 | 20 |
| # sample | 2 | 1 | 1 | 1 | 1 | |||||||||||||||
| # mutation | 2 | 1 | 1 | 1 | 1 | |||||||||||||||
| nonsynonymous SNV | 1 | 1 | 1 | |||||||||||||||||
| synonymous SNV | 1 | 1 | 1 |
| cf) Tissue ID; Tissue type (1; BLCA[Bladder Urothelial Carcinoma], 2; BRCA[Breast invasive carcinoma], 3; CESC[Cervical squamous cell carcinoma and endocervical adenocarcinoma], 4; COAD[Colon adenocarcinoma], 5; GBM[Glioblastoma multiforme], 6; Glioma Low Grade, 7; HNSC[Head and Neck squamous cell carcinoma], 8; KICH[Kidney Chromophobe], 9; KIRC[Kidney renal clear cell carcinoma], 10; KIRP[Kidney renal papillary cell carcinoma], 11; LAML[Acute Myeloid Leukemia], 12; LUAD[Lung adenocarcinoma], 13; LUSC[Lung squamous cell carcinoma], 14; OV[Ovarian serous cystadenocarcinoma ], 15; PAAD[Pancreatic adenocarcinoma], 16; PRAD[Prostate adenocarcinoma], 17; SKCM[Skin Cutaneous Melanoma], 18:STAD[Stomach adenocarcinoma], 19:THCA[Thyroid carcinoma], 20:UCEC[Uterine Corpus Endometrial Carcinoma]) |
| Top |
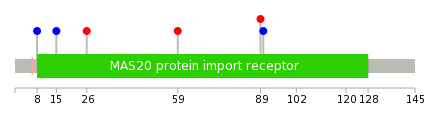
| * We represented just top 10 SNVs. When you move the cursor on each content, you can see more deailed mutation information on the Tooltip. Those are primary_site, primary_histology, mutation(aa), pubmedID. |
| Genomic Position | Mutation(aa) | Unique sampleID count |
| chr1:235277206 | p.V90V | 1 |
| chr1:235277211 | p.G89S | 1 |
| chr1:235283208 | p.D59N | 1 |
| chr1:235291954 | p.R26H | 1 |
| chr1:235291986 | p.A15A | 1 |
| chr1:235292007 | p.I8I | 1 |
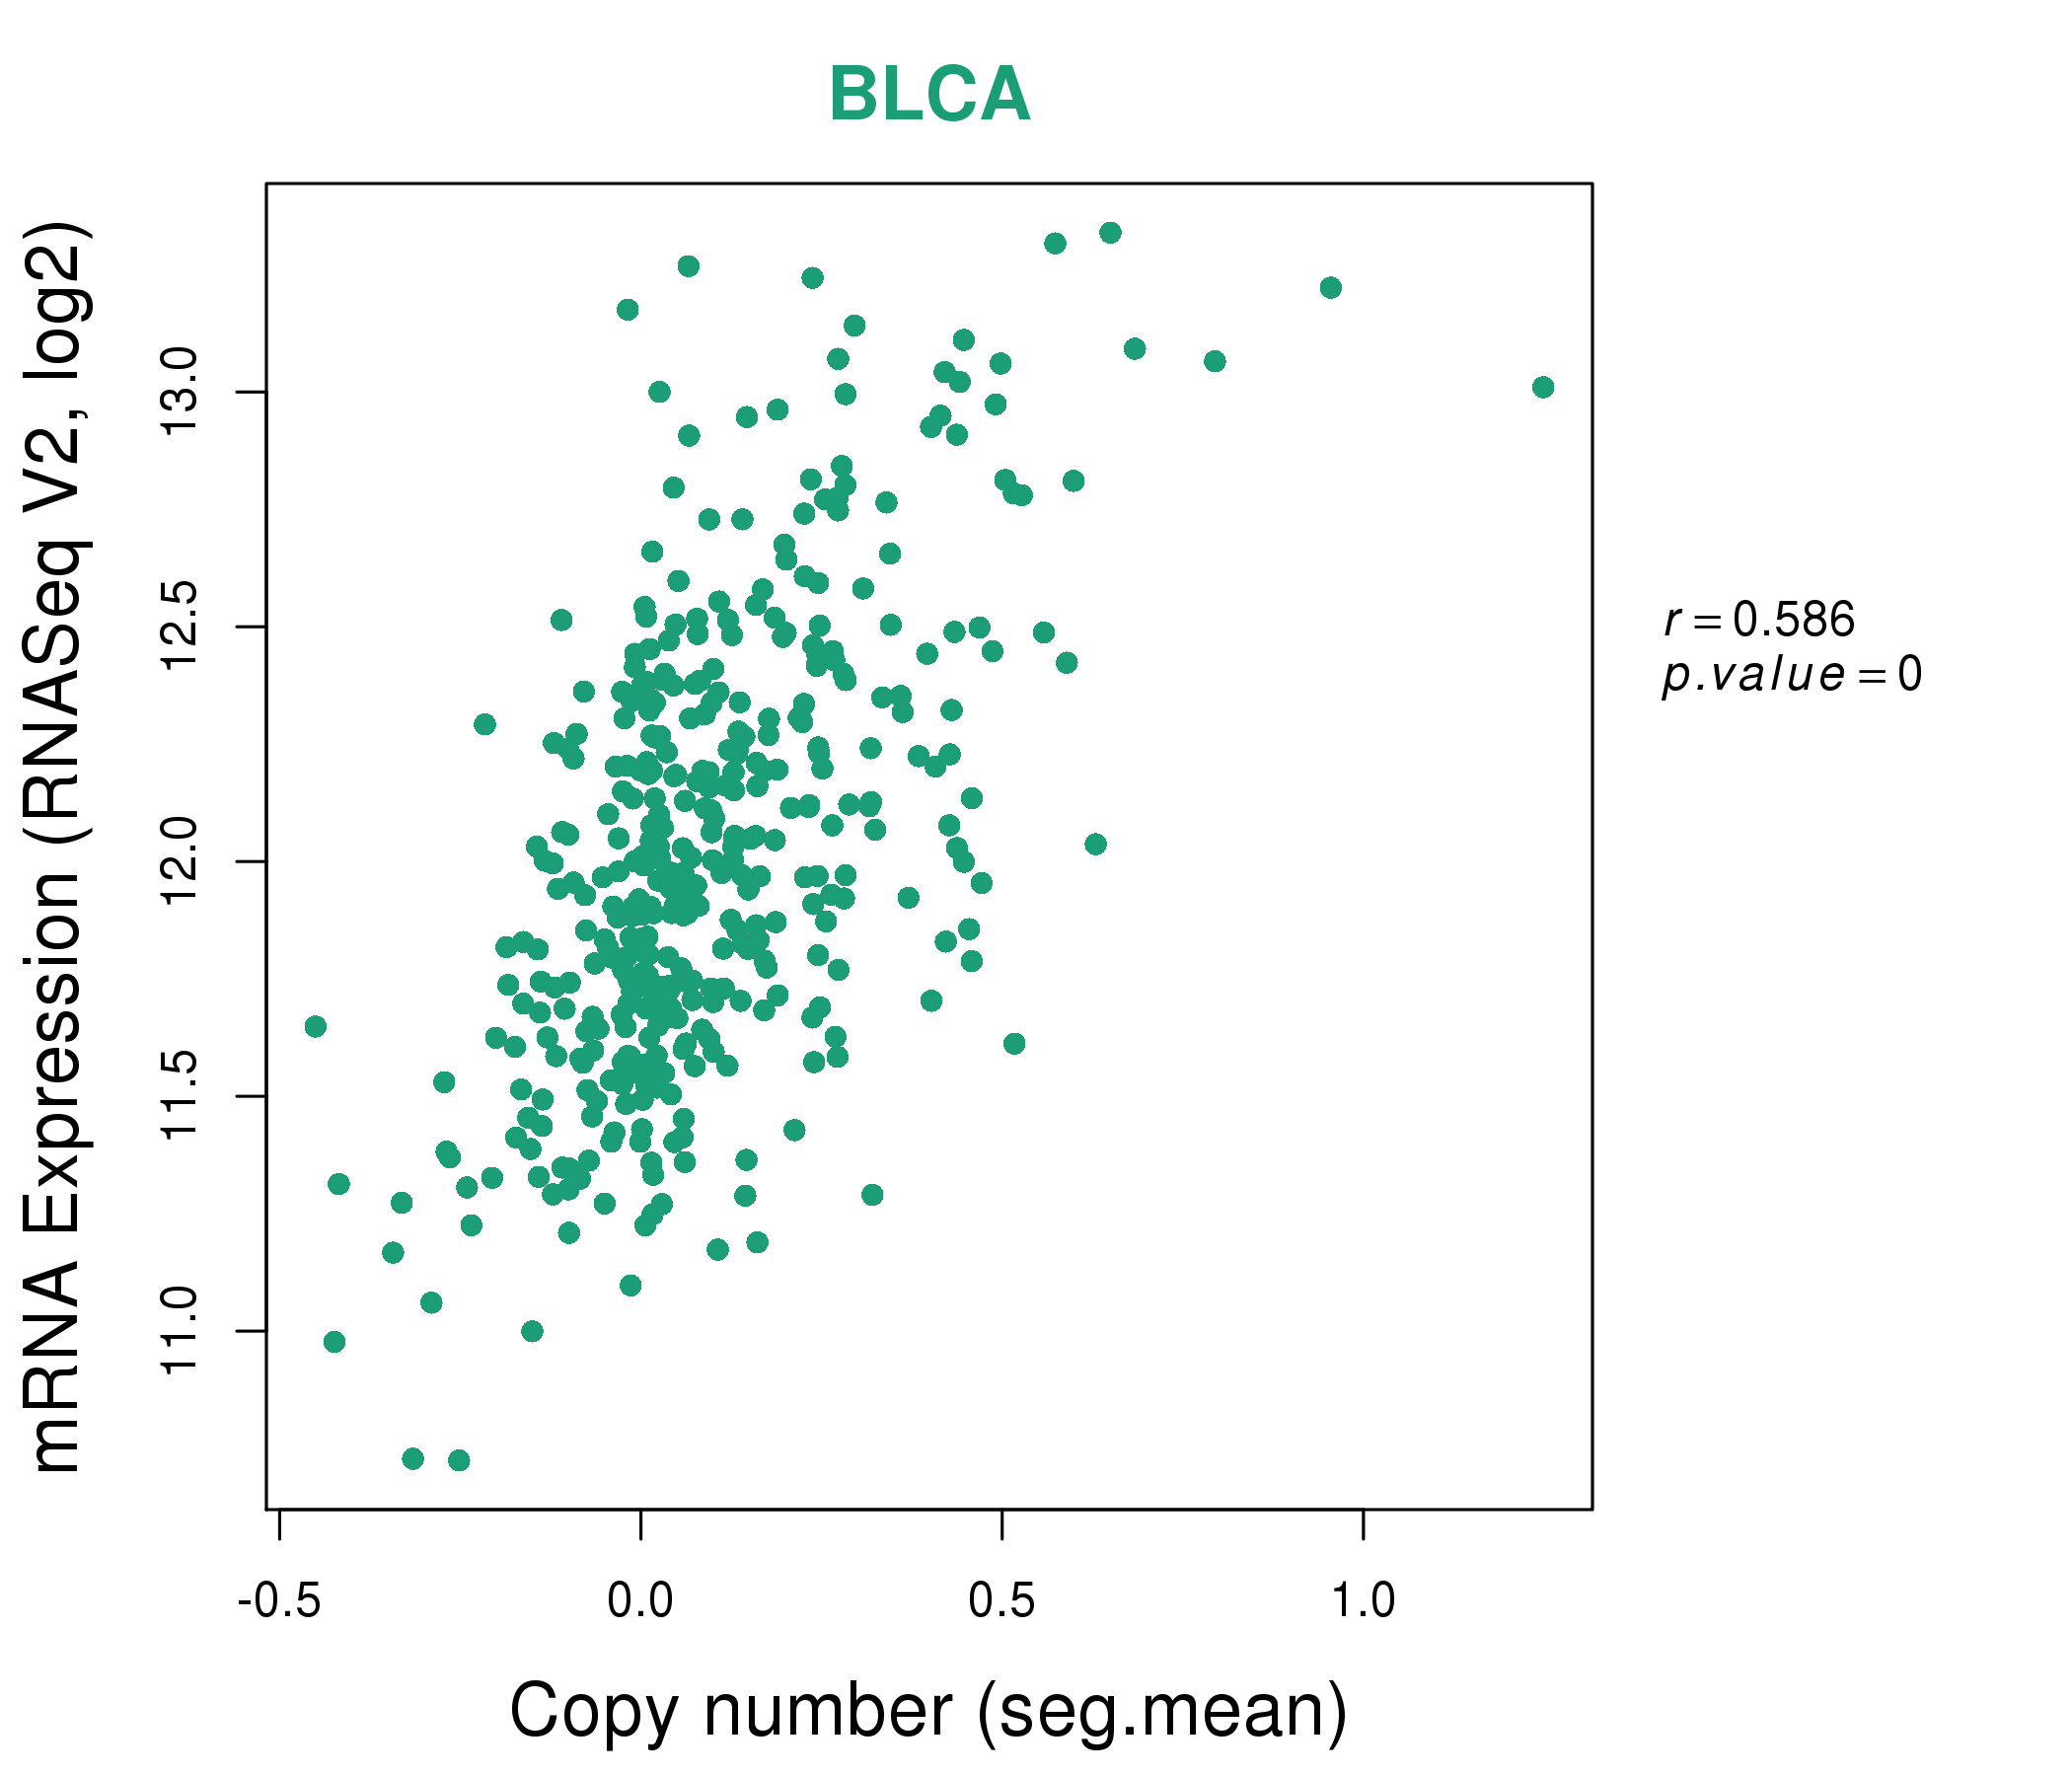
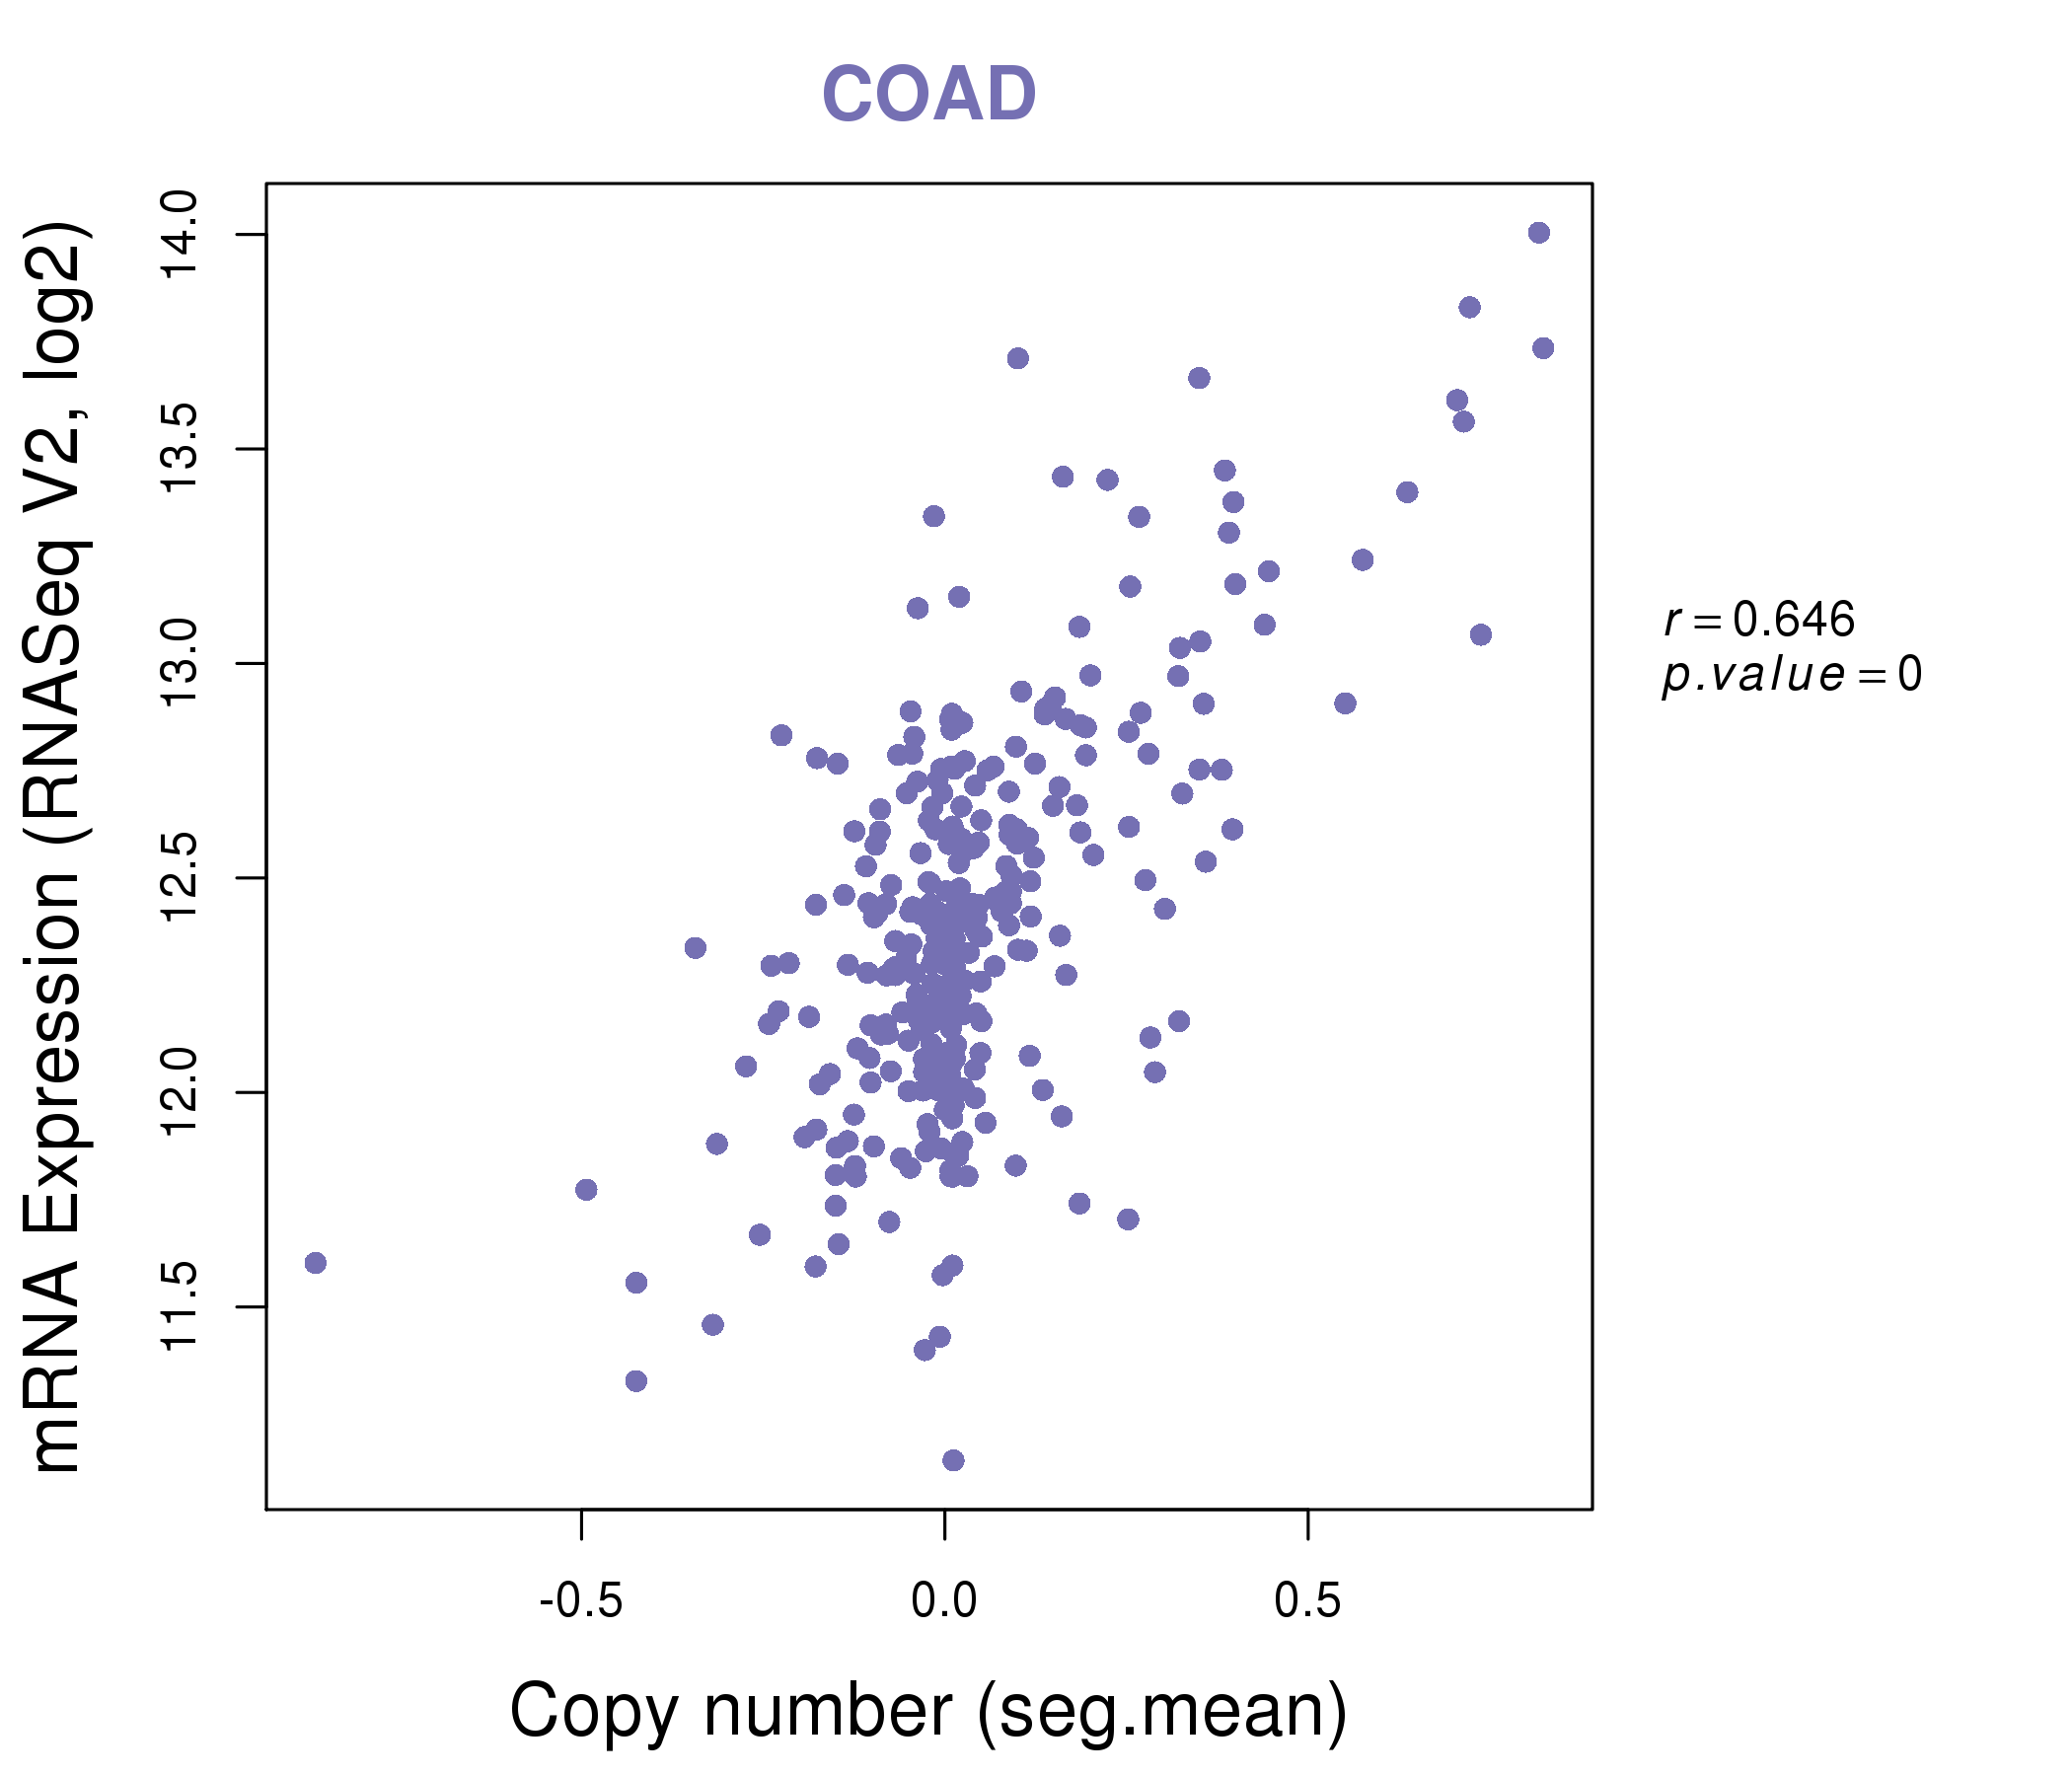
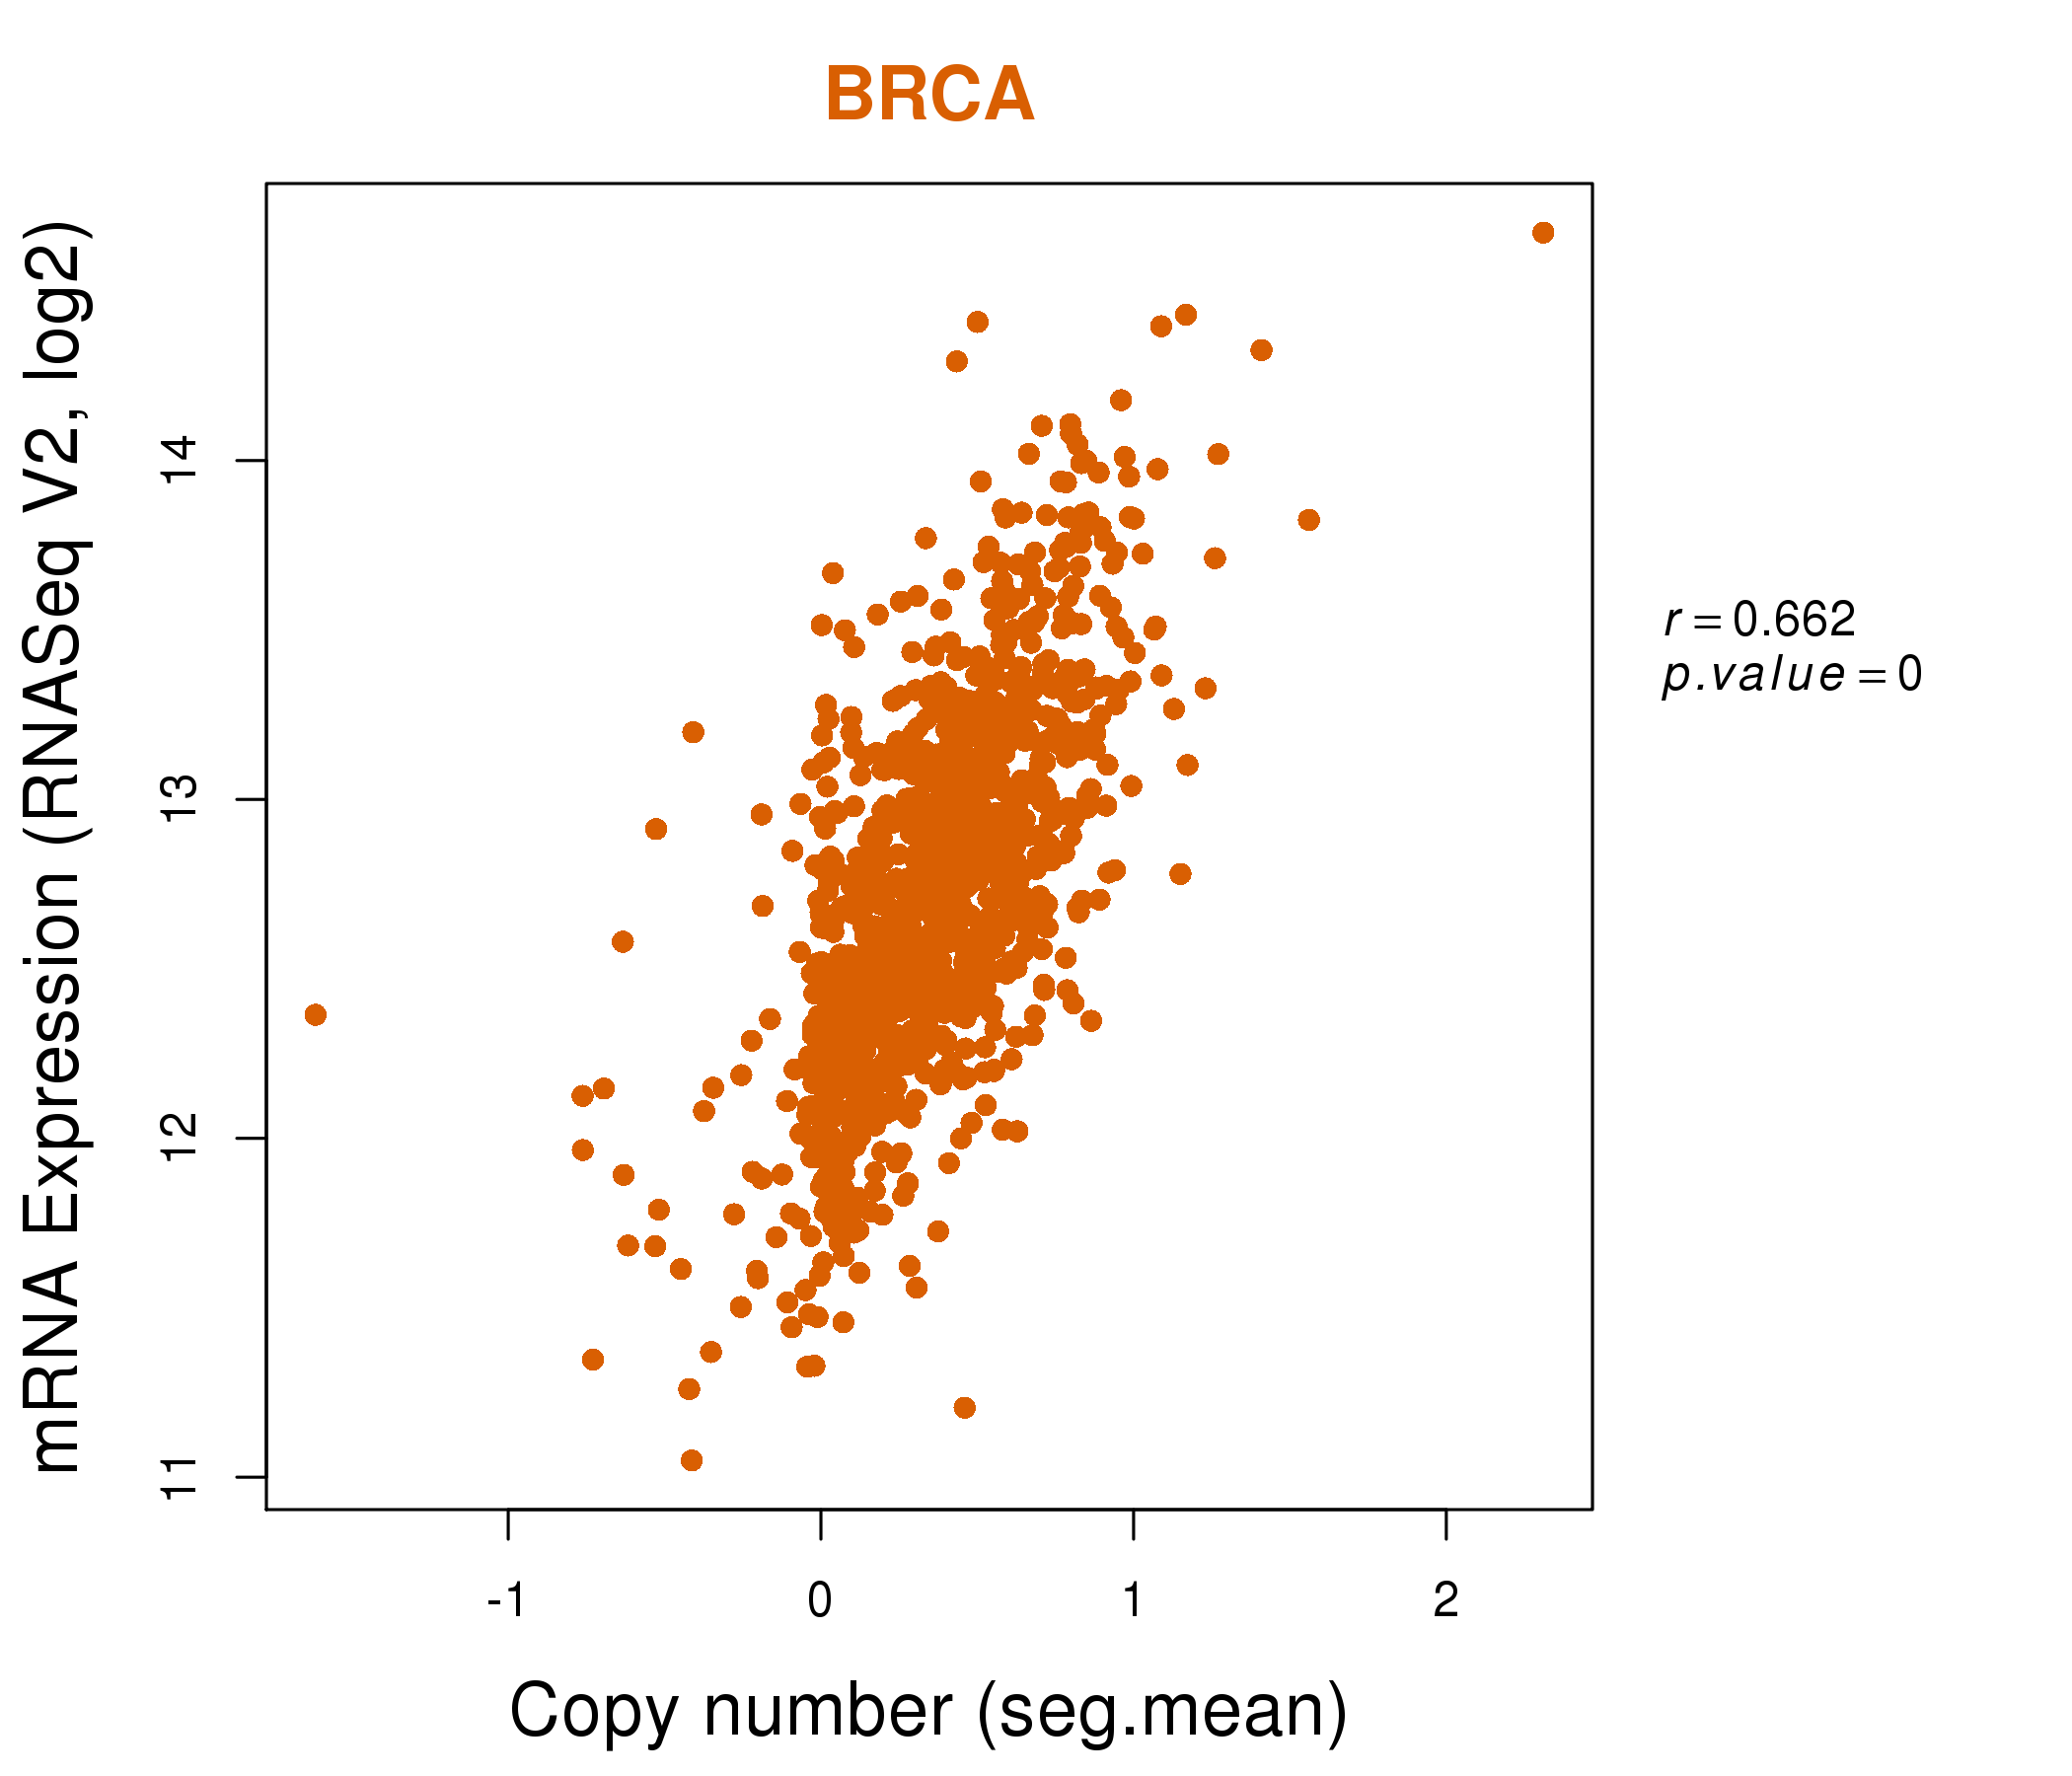
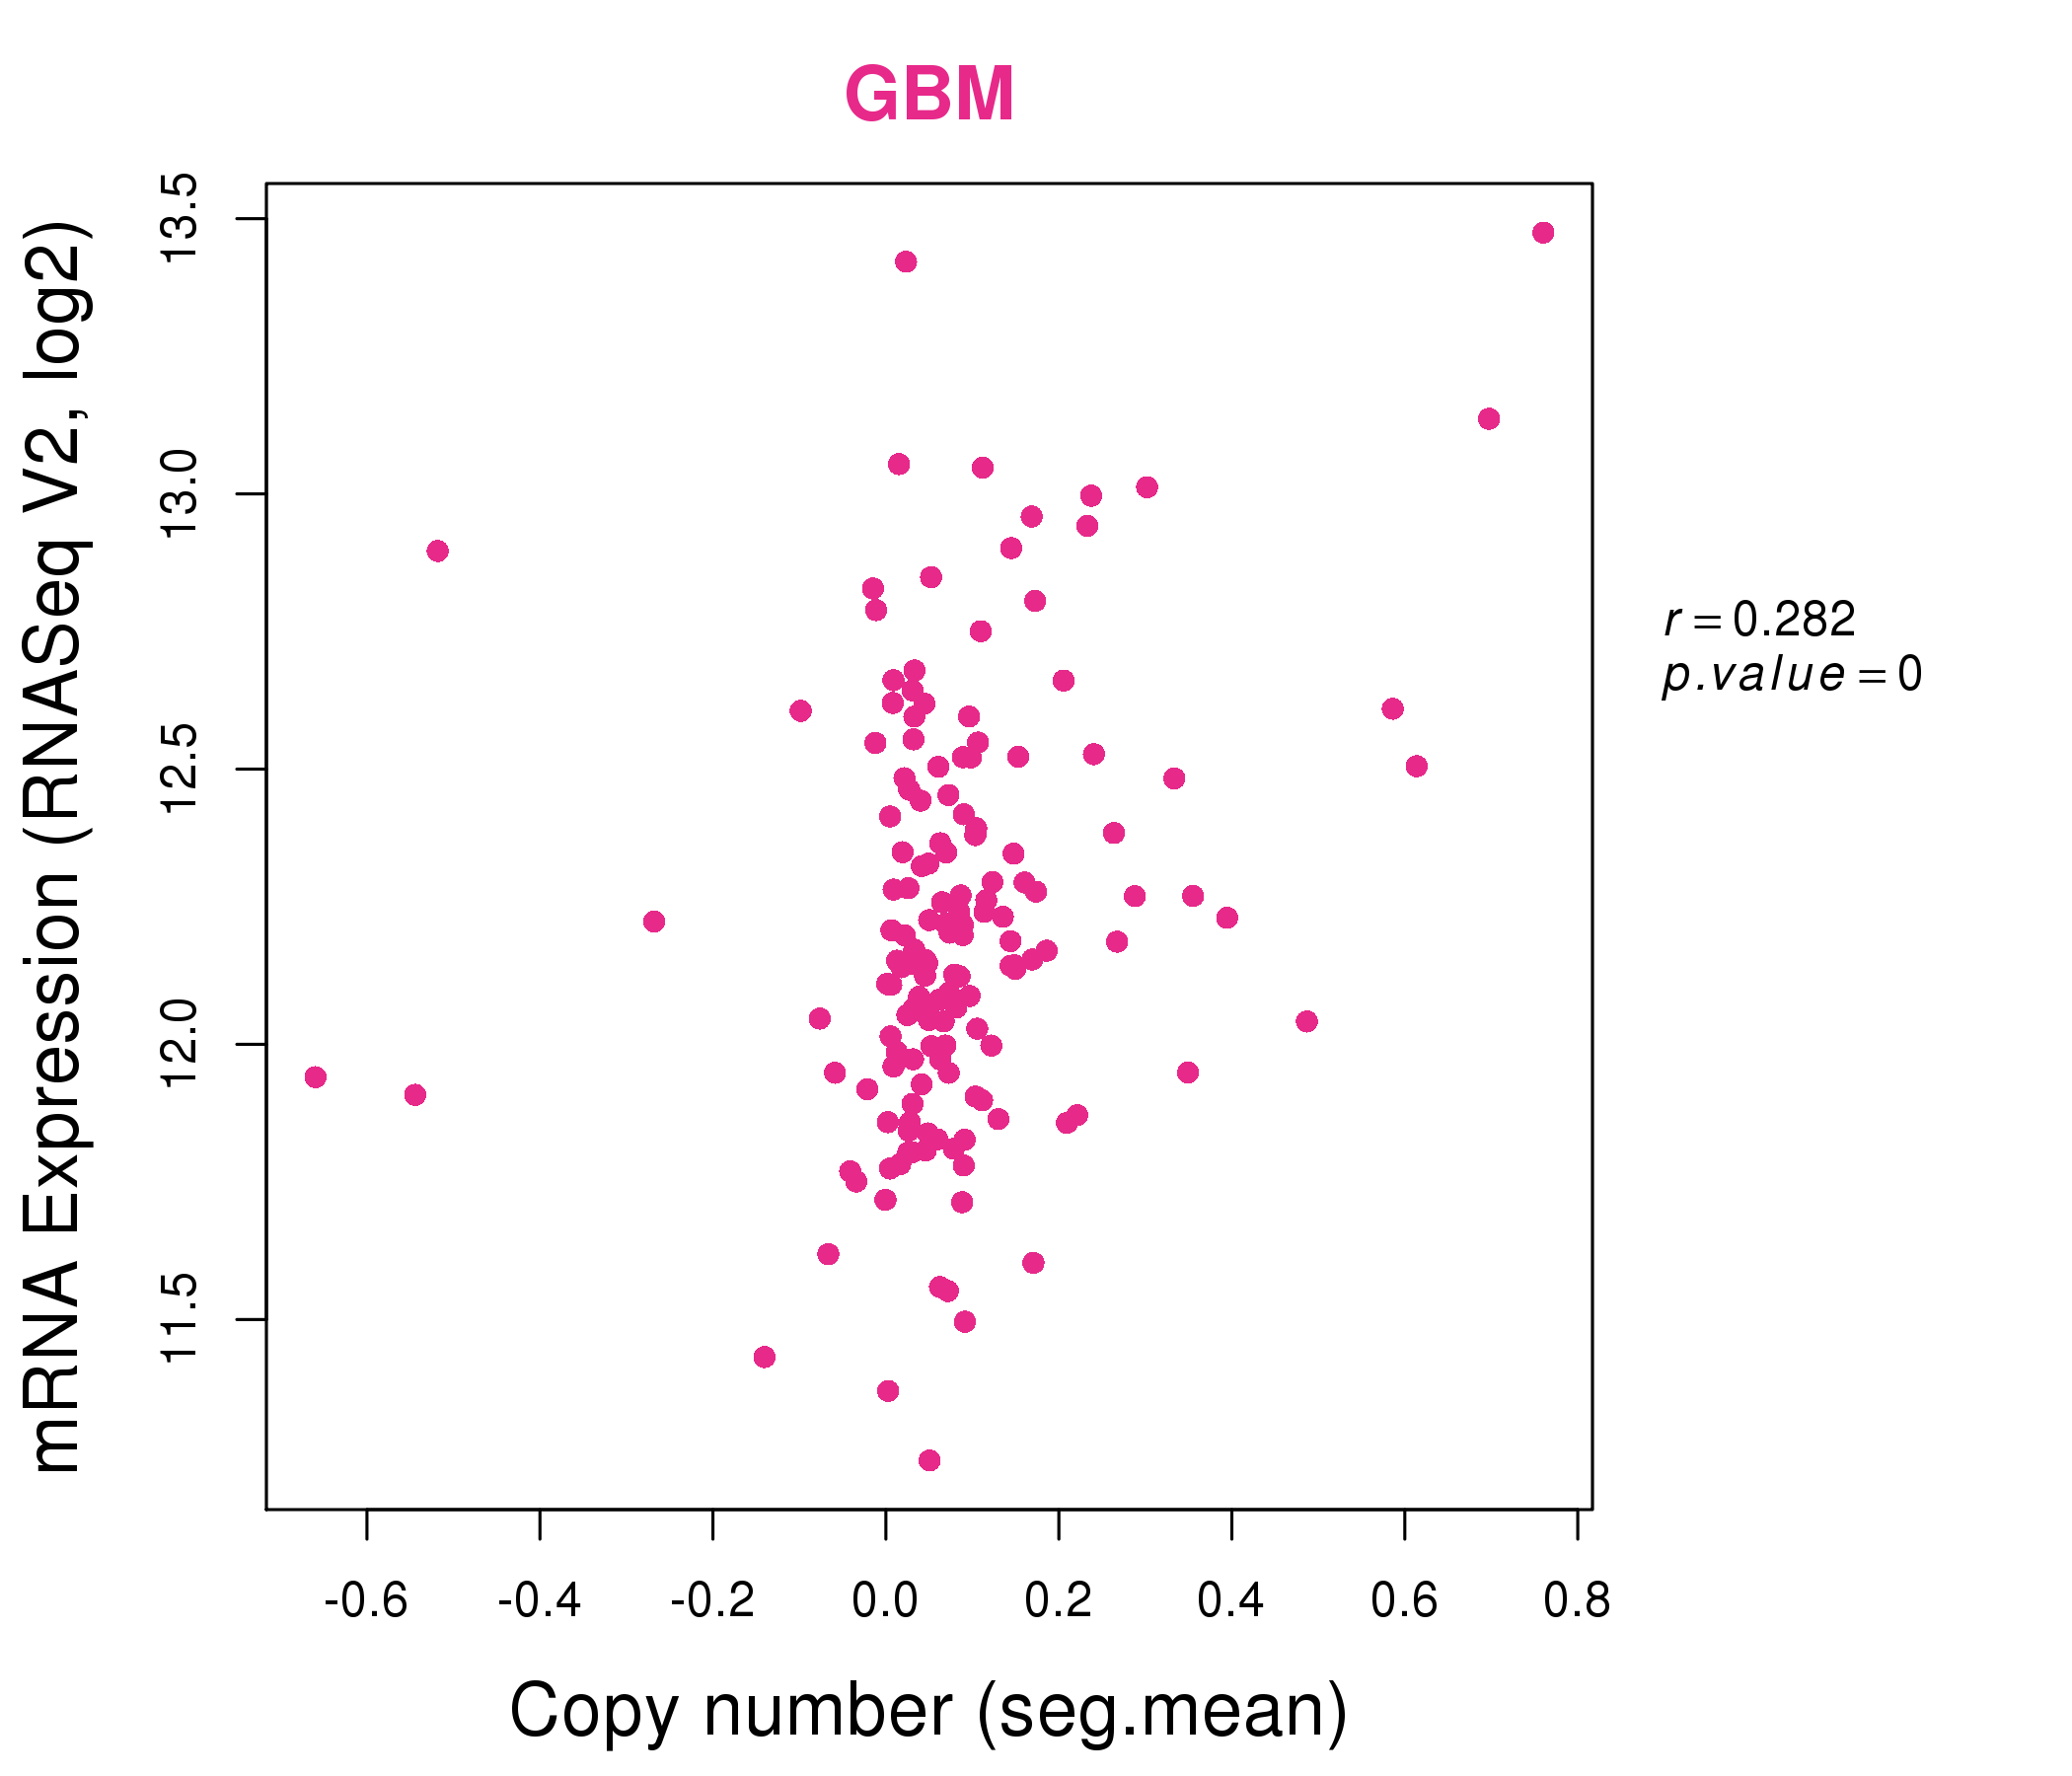
| * Copy number data were extracted from TCGA using R package TCGA-Assembler. The URLs of all public data files on TCGA DCC data server were gathered on Jan-05-2015. Function ProcessCNAData in TCGA-Assembler package was used to obtain gene-level copy number value which is calculated as the average copy number of the genomic region of a gene. |
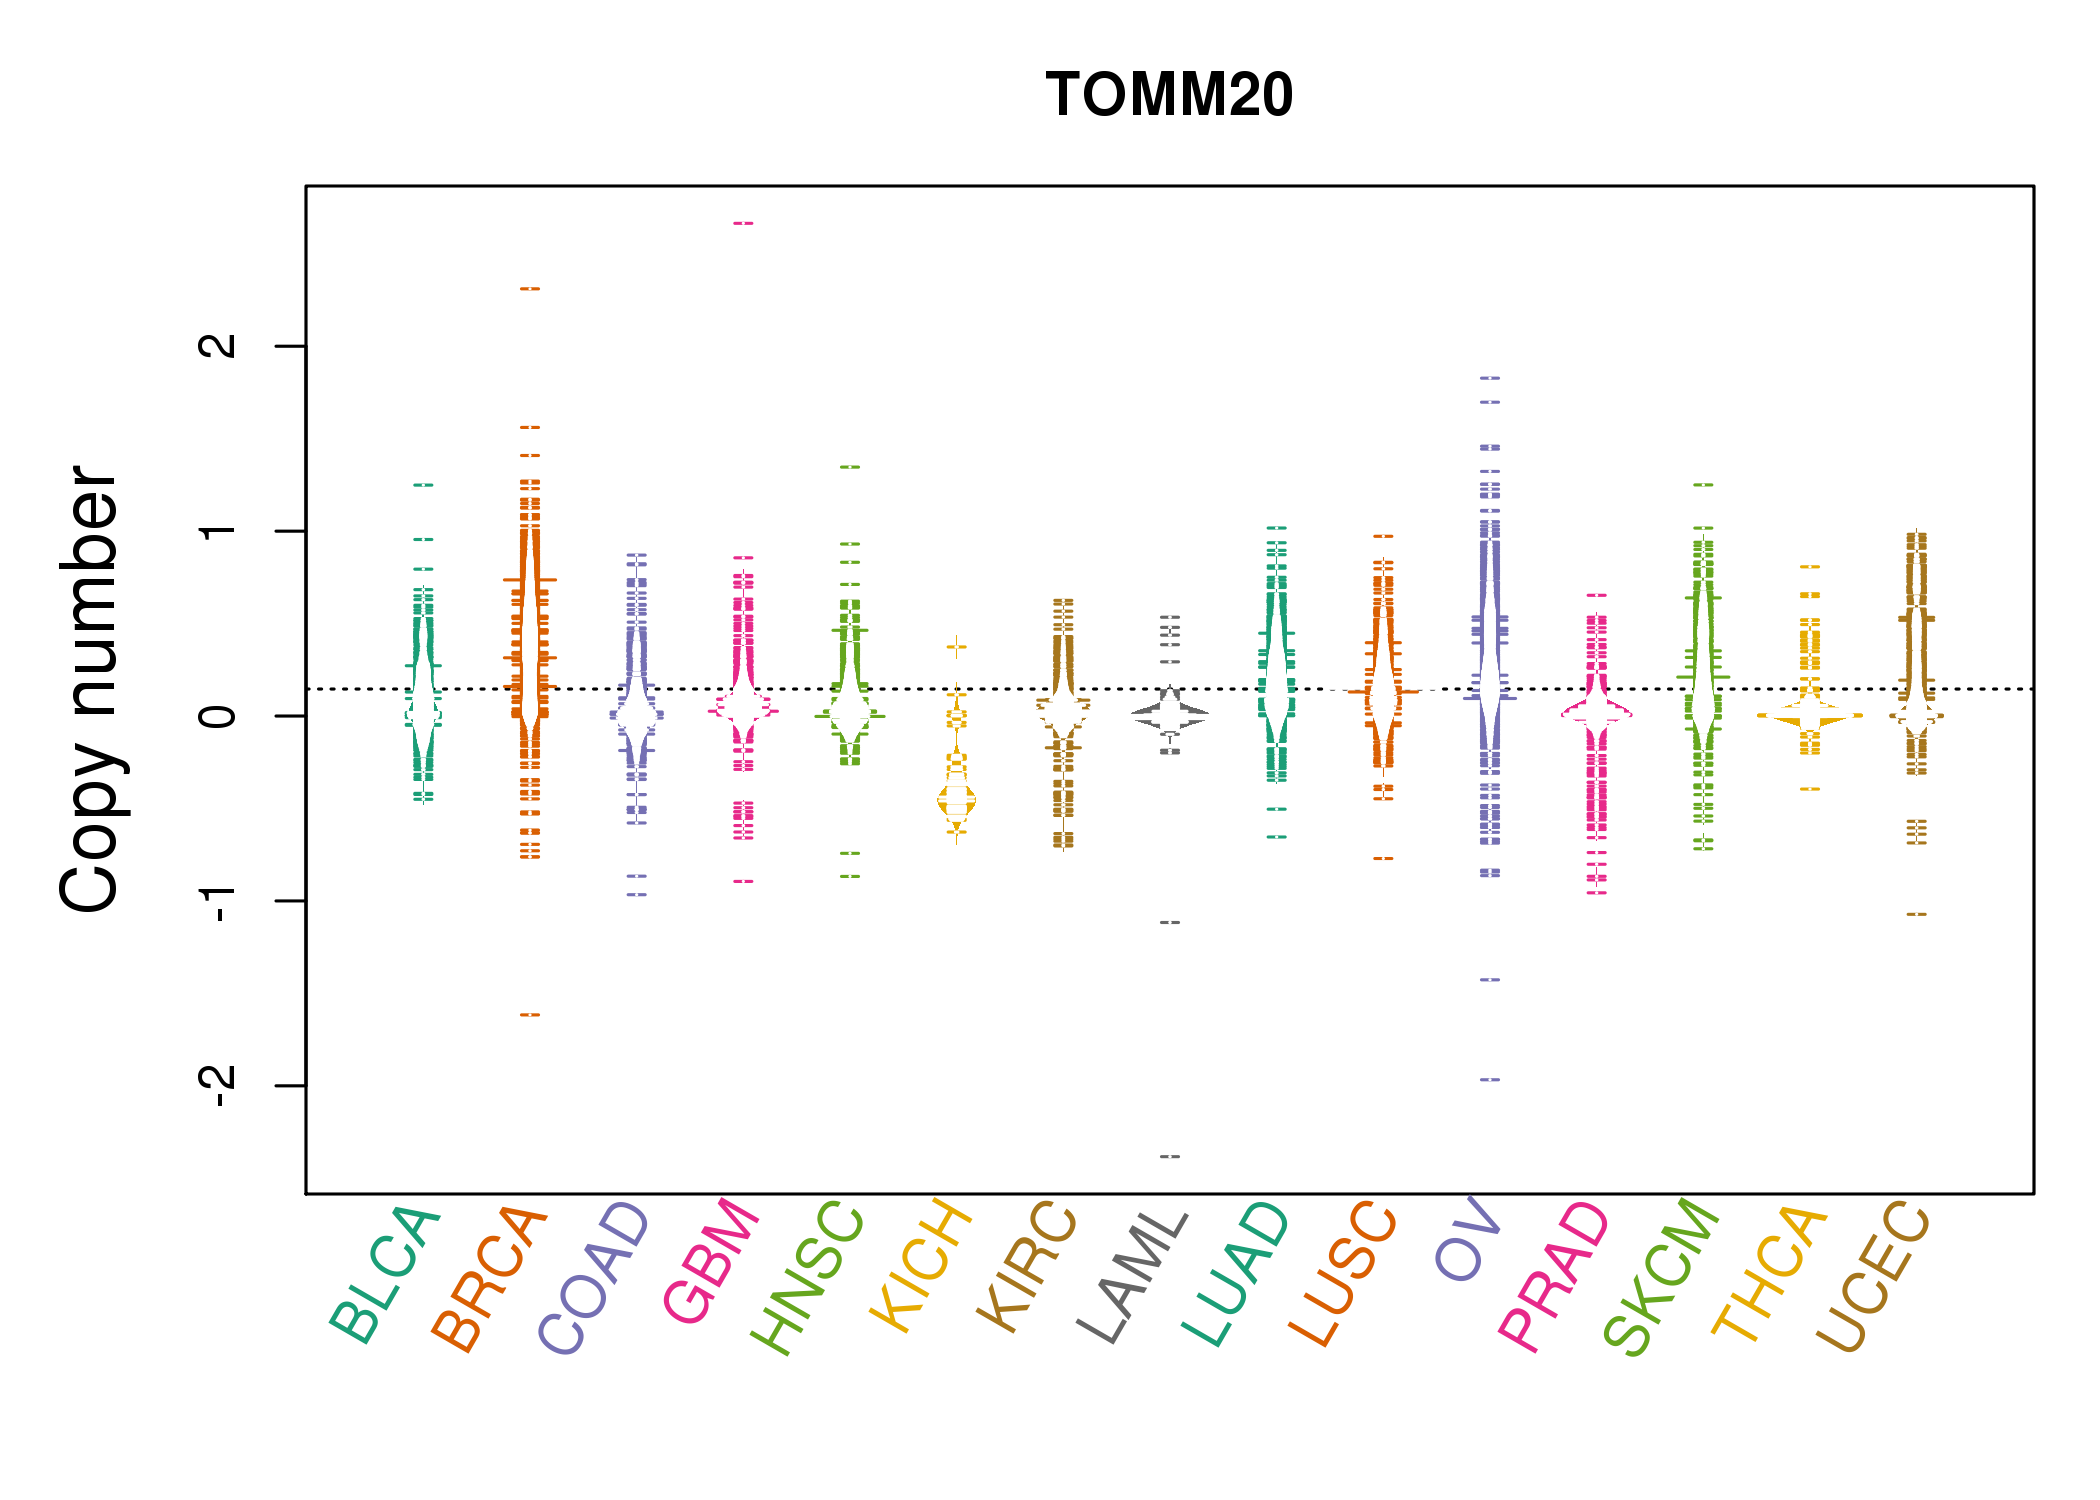 |
| cf) Tissue ID[Tissue type]: BLCA[Bladder Urothelial Carcinoma], BRCA[Breast invasive carcinoma], CESC[Cervical squamous cell carcinoma and endocervical adenocarcinoma], COAD[Colon adenocarcinoma], GBM[Glioblastoma multiforme], Glioma Low Grade, HNSC[Head and Neck squamous cell carcinoma], KICH[Kidney Chromophobe], KIRC[Kidney renal clear cell carcinoma], KIRP[Kidney renal papillary cell carcinoma], LAML[Acute Myeloid Leukemia], LUAD[Lung adenocarcinoma], LUSC[Lung squamous cell carcinoma], OV[Ovarian serous cystadenocarcinoma ], PAAD[Pancreatic adenocarcinoma], PRAD[Prostate adenocarcinoma], SKCM[Skin Cutaneous Melanoma], STAD[Stomach adenocarcinoma], THCA[Thyroid carcinoma], UCEC[Uterine Corpus Endometrial Carcinoma] |
| Top |
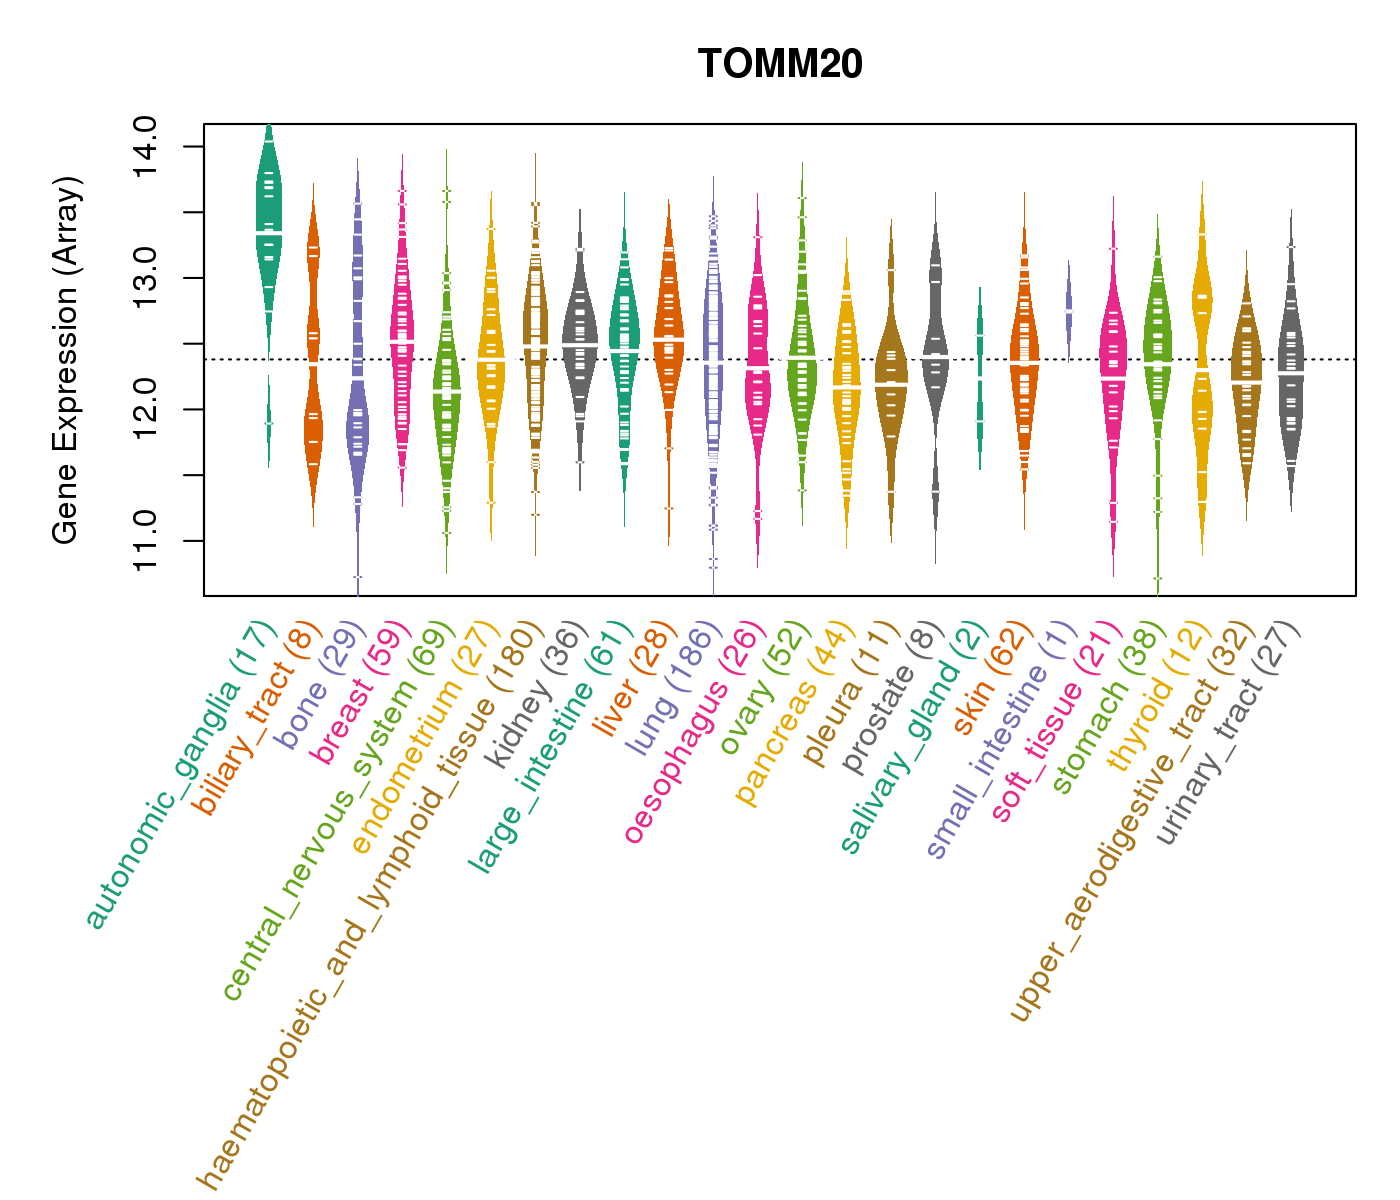
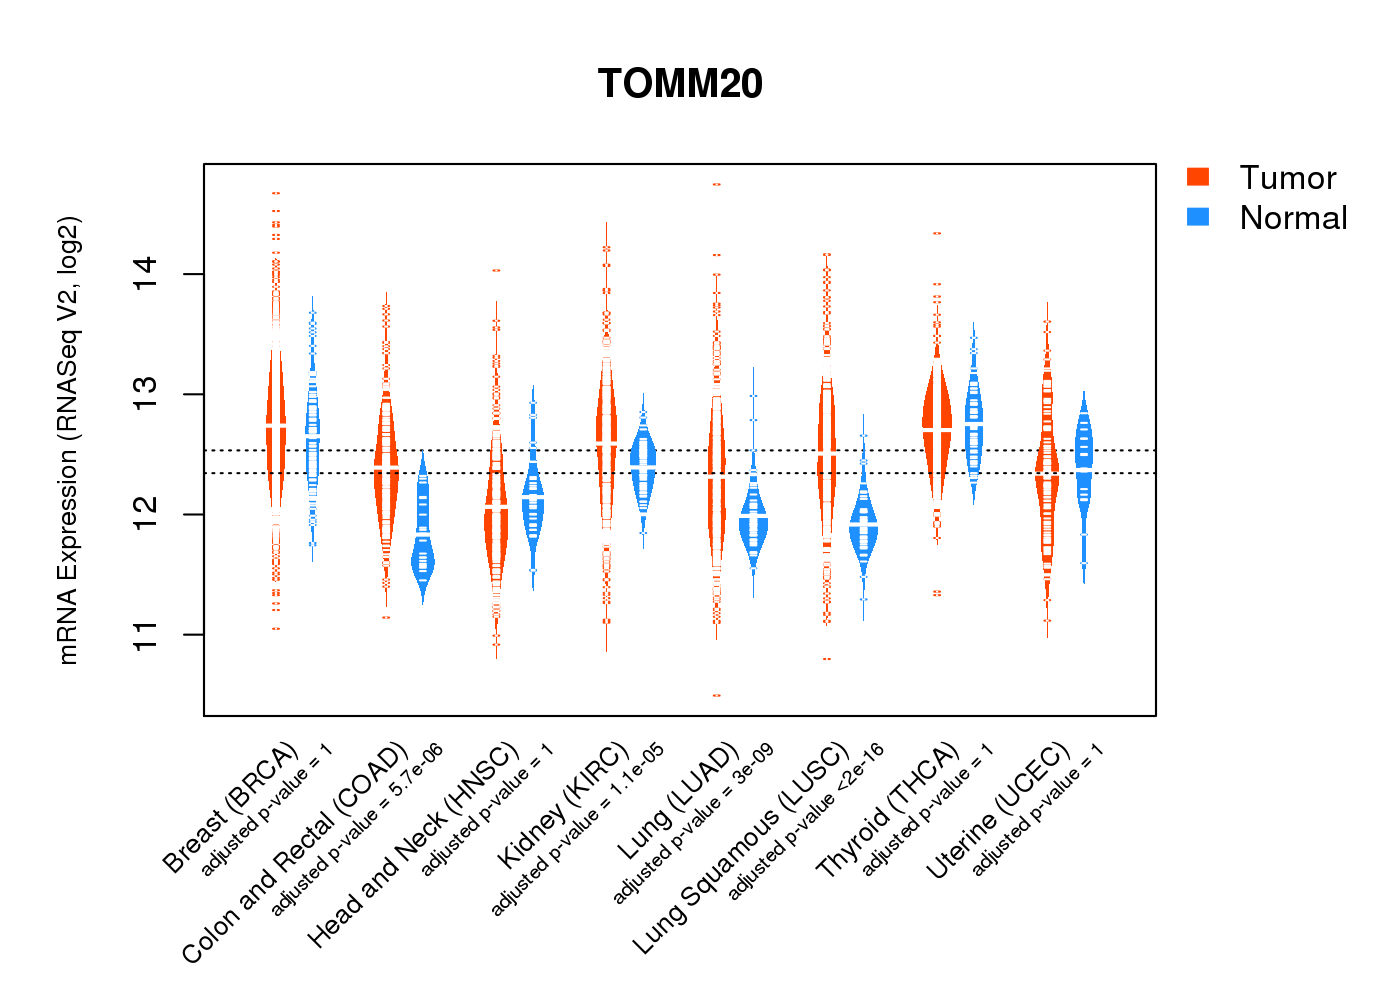
| Gene Expression for TOMM20 |
| * CCLE gene expression data were extracted from CCLE_Expression_Entrez_2012-10-18.res: Gene-centric RMA-normalized mRNA expression data. |
 |
| * Normalized gene expression data of RNASeqV2 was extracted from TCGA using R package TCGA-Assembler. The URLs of all public data files on TCGA DCC data server were gathered at Jan-05-2015. Only eight cancer types have enough normal control samples for differential expression analysis. (t test, adjusted p<0.05 (using Benjamini-Hochberg FDR)) |
 |
| Top |
| * This plots show the correlation between CNV and gene expression. |
: Open all plots for all cancer types
 |
|
 |
|
| Top |
| Gene-Gene Network Information |
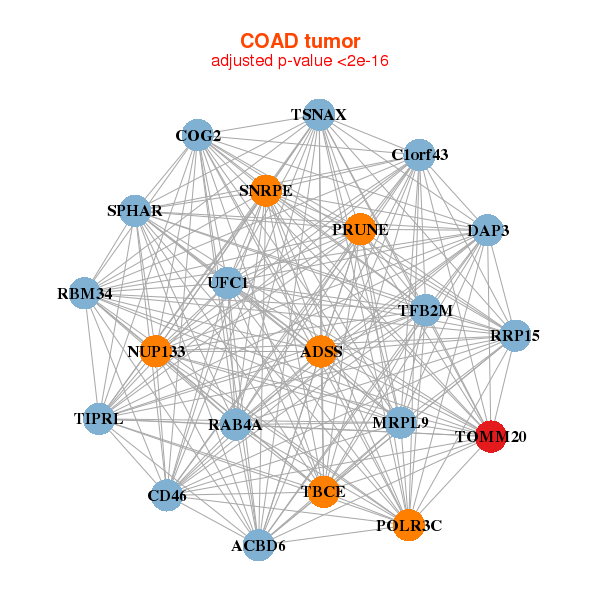
| * Co-Expression network figures were drawn using R package igraph. Only the top 20 genes with the highest correlations were shown. Red circle: input gene, orange circle: cell metabolism gene, sky circle: other gene |
: Open all plots for all cancer types
 |
|
| ABCB10,AHCTF1,ARID4B,B3GALNT2,DIEXF,FBXO28,GGPS1, GNPAT,HEATR1,HNRNPU,IRF2BP2,NUP133,RAB4A,RBM34, RRP15,TAF5L,TARBP1,TBCE,TFB2M,TOMM20,TSNAX | CCNB1IP1,EIF2A,EIF2S3,EIF3E,EIF3L,ELF5,METTL21B, KHDRBS1,KIT,METAP1,PABPC1,PDCD4,RBMX,RSL1D1, RSL24D1,SH3YL1,TIGD2,TMEM87A,TOMM20,ZCCHC7,ZNF277 |
 |
|
| ACBD6,ADSS,C1orf43,CD46,COG2,DAP3,MRPL9, NUP133,POLR3C,PRUNE,RAB4A,RBM34,RRP15,SNRPE, SPHAR,TBCE,TFB2M,TIPRL,TOMM20,TSNAX,UFC1 | C11orf1,ZFAS1,CCNB1IP1,CLNS1A,EEF1A1,EEF1A1P9,EIF2A, EIF3E,EIF3H,GAS5,NACA,RPL10,RPL10A,RPL14, RPL15,RPL32,RPL3,RPL5,RSL1D1,TATDN1,TOMM20 |

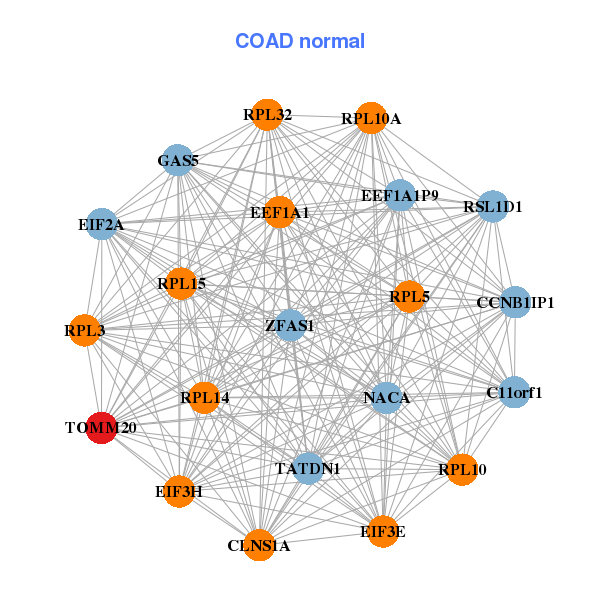
| * Co-Expression network figures were drawn using R package igraph. Only the top 20 genes with the highest correlations were shown. Red circle: input gene, orange circle: cell metabolism gene, sky circle: other gene |
: Open all plots for all cancer types
| Top |
: Open all interacting genes' information including KEGG pathway for all interacting genes from DAVID
| Top |
| Pharmacological Information for TOMM20 |
| There's no related Drug. |
| Top |
| Cross referenced IDs for TOMM20 |
| * We obtained these cross-references from Uniprot database. It covers 150 different DBs, 18 categories. http://www.uniprot.org/help/cross_references_section |
: Open all cross reference information
|
Copyright © 2016-Present - The Univsersity of Texas Health Science Center at Houston @ |