|
||||||||||||||||||||
| |
| Phenotypic Information (metabolism pathway, cancer, disease, phenome) |
| |
| |
| Gene-Gene Network Information: Co-Expression Network, Interacting Genes & KEGG |
| |
|


| Gene Summary for LCMT2 |
| Basic gene info. | Gene symbol | LCMT2 |
| Gene name | leucine carboxyl methyltransferase 2 | |
| Synonyms | PPM2|TYW4 | |
| Cytomap | UCSC genome browser: 15q15.3 | |
| Genomic location | chr15 :43619973-43622820 | |
| Type of gene | protein-coding | |
| RefGenes | NM_014793.4, | |
| Ensembl id | ENSG00000168806 | |
| Description | p21WAF1/CIP1 promoter-interacting proteintRNA wybutosine-synthesizing protein 4tRNA yW-synthesizing protein 4tRNA(Phe) (7-(3-amino-3-(methoxycarbonyl)propyl)wyosine(37)-N)-methoxycarbonyltransferasetRNA(Phe) (7-(3-amino-3-carboxypropyl)wyosine(37)-O)- | |
| Modification date | 20141207 | |
| dbXrefs | MIM : 611246 | |
| HGNC : HGNC | ||
| HPRD : 17267 | ||
| Protein | UniProt: go to UniProt's Cross Reference DB Table | |
| Expression | CleanEX: HS_LCMT2 | |
| BioGPS: 9836 | ||
| Gene Expression Atlas: ENSG00000168806 | ||
| The Human Protein Atlas: ENSG00000168806 | ||
| Pathway | NCI Pathway Interaction Database: LCMT2 | |
| KEGG: LCMT2 | ||
| REACTOME: LCMT2 | ||
| ConsensusPathDB | ||
| Pathway Commons: LCMT2 | ||
| Metabolism | MetaCyc: LCMT2 | |
| HUMANCyc: LCMT2 | ||
| Regulation | Ensembl's Regulation: ENSG00000168806 | |
| miRBase: chr15 :43,619,973-43,622,820 | ||
| TargetScan: NM_014793 | ||
| cisRED: ENSG00000168806 | ||
| Context | iHOP: LCMT2 | |
| cancer metabolism search in PubMed: LCMT2 | ||
| UCL Cancer Institute: LCMT2 | ||
| Assigned class in ccmGDB | C | |
| Top |
| Phenotypic Information for LCMT2(metabolism pathway, cancer, disease, phenome) |
| Cancer | CGAP: LCMT2 |
| Familial Cancer Database: LCMT2 | |
| * This gene is included in those cancer gene databases. |
|
|
|
|
|
| . | ||||||||||||||
Oncogene 1 | Significant driver gene in | |||||||||||||||||||
| cf) number; DB name 1 Oncogene; http://nar.oxfordjournals.org/content/35/suppl_1/D721.long, 2 Tumor Suppressor gene; https://bioinfo.uth.edu/TSGene/, 3 Cancer Gene Census; http://www.nature.com/nrc/journal/v4/n3/abs/nrc1299.html, 4 CancerGenes; http://nar.oxfordjournals.org/content/35/suppl_1/D721.long, 5 Network of Cancer Gene; http://ncg.kcl.ac.uk/index.php, 1Therapeutic Vulnerabilities in Cancer; http://cbio.mskcc.org/cancergenomics/statius/ |
| KEGG_HISTIDINE_METABOLISM KEGG_TYROSINE_METABOLISM KEGG_SELENOAMINO_ACID_METABOLISM | |
| OMIM | |
| Orphanet | |
| Disease | KEGG Disease: LCMT2 |
| MedGen: LCMT2 (Human Medical Genetics with Condition) | |
| ClinVar: LCMT2 | |
| Phenotype | MGI: LCMT2 (International Mouse Phenotyping Consortium) |
| PhenomicDB: LCMT2 | |
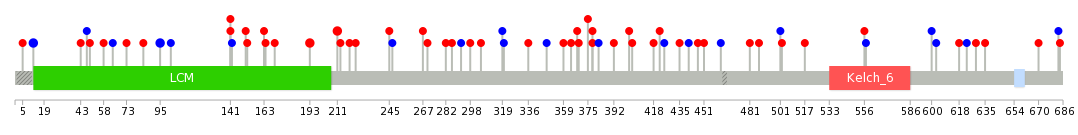
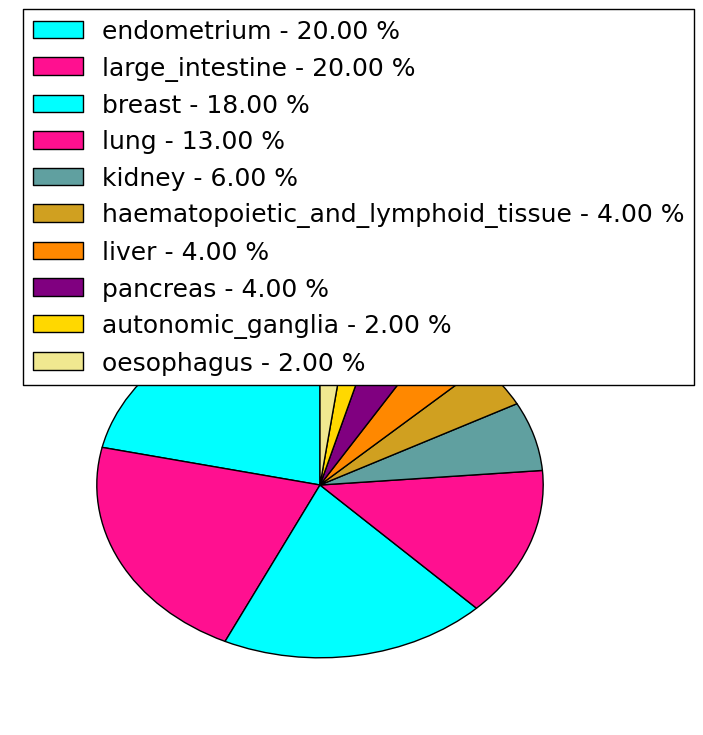
| Mutations for LCMT2 |
| * Under tables are showing count per each tissue to give us broad intuition about tissue specific mutation patterns.You can go to the detailed page for each mutation database's web site. |
| There's no structural variation information in COSMIC data for this gene. |
| * From mRNA Sanger sequences, Chitars2.0 arranged chimeric transcripts. This table shows LCMT2 related fusion information. |
| ID | Head Gene | Tail Gene | Accession | Gene_a | qStart_a | qEnd_a | Chromosome_a | tStart_a | tEnd_a | Gene_a | qStart_a | qEnd_a | Chromosome_a | tStart_a | tEnd_a |
| Top |
| There's no copy number variation information in COSMIC data for this gene. |
| Top |
|
 |
| Top |
| Stat. for Non-Synonymous SNVs (# total SNVs=43) | (# total SNVs=10) |
 |  |
(# total SNVs=3) | (# total SNVs=0) |
 |
| Top |
| * When you move the cursor on each content, you can see more deailed mutation information on the Tooltip. Those are primary_site,primary_histology,mutation(aa),pubmedID. |
| GRCh37 position | Mutation(aa) | Unique sampleID count |
| chr15:43621332-43621332 | p.F452fs*11 | 2 |
| chr15:43622652-43622652 | p.A12A | 2 |
| chr15:43622057-43622057 | p.P211S | 2 |
| chr15:43622403-43622403 | p.L95L | 2 |
| chr15:43622110-43622110 | p.Y193C | 2 |
| chr15:43620879-43620879 | p.G603G | 1 |
| chr15:43621681-43621681 | p.S336L | 1 |
| chr15:43622516-43622516 | p.V58I | 1 |
| chr15:43621302-43621302 | p.L462L | 1 |
| chr15:43621889-43621889 | p.G267C | 1 |
| Top |
|
 |
| Point Mutation/ Tissue ID | 1 | 2 | 3 | 4 | 5 | 6 | 7 | 8 | 9 | 10 | 11 | 12 | 13 | 14 | 15 | 16 | 17 | 18 | 19 | 20 |
| # sample | 2 | 3 | 3 | 5 | 4 | 5 | 4 | 1 | 9 | 7 | ||||||||||
| # mutation | 2 | 5 | 3 | 6 | 4 | 6 | 4 | 1 | 9 | 9 | ||||||||||
| nonsynonymous SNV | 2 | 5 | 3 | 6 | 3 | 5 | 2 | 6 | 7 | |||||||||||
| synonymous SNV | 1 | 1 | 2 | 1 | 3 | 2 |
| cf) Tissue ID; Tissue type (1; BLCA[Bladder Urothelial Carcinoma], 2; BRCA[Breast invasive carcinoma], 3; CESC[Cervical squamous cell carcinoma and endocervical adenocarcinoma], 4; COAD[Colon adenocarcinoma], 5; GBM[Glioblastoma multiforme], 6; Glioma Low Grade, 7; HNSC[Head and Neck squamous cell carcinoma], 8; KICH[Kidney Chromophobe], 9; KIRC[Kidney renal clear cell carcinoma], 10; KIRP[Kidney renal papillary cell carcinoma], 11; LAML[Acute Myeloid Leukemia], 12; LUAD[Lung adenocarcinoma], 13; LUSC[Lung squamous cell carcinoma], 14; OV[Ovarian serous cystadenocarcinoma ], 15; PAAD[Pancreatic adenocarcinoma], 16; PRAD[Prostate adenocarcinoma], 17; SKCM[Skin Cutaneous Melanoma], 18:STAD[Stomach adenocarcinoma], 19:THCA[Thyroid carcinoma], 20:UCEC[Uterine Corpus Endometrial Carcinoma]) |
| Top |
| * We represented just top 10 SNVs. When you move the cursor on each content, you can see more deailed mutation information on the Tooltip. Those are primary_site, primary_histology, mutation(aa), pubmedID. |
| Genomic Position | Mutation(aa) | Unique sampleID count |
| chr15:43621185 | p.L447I | 1 |
| chr15:43622318 | p.R286W | 1 |
| chr15:43621556 | p.Q73H | 1 |
| chr15:43621844 | p.L444S | 1 |
| chr15:43621247 | p.R285W | 1 |
| chr15:43622382 | p.R64R | 1 |
| chr15:43621583 | p.Q404H | 1 |
| chr15:43621880 | p.E282K | 1 |
| chr15:43621302 | p.V58I | 1 |
| chr15:43622436 | p.G402S | 1 |
| * Copy number data were extracted from TCGA using R package TCGA-Assembler. The URLs of all public data files on TCGA DCC data server were gathered on Jan-05-2015. Function ProcessCNAData in TCGA-Assembler package was used to obtain gene-level copy number value which is calculated as the average copy number of the genomic region of a gene. |
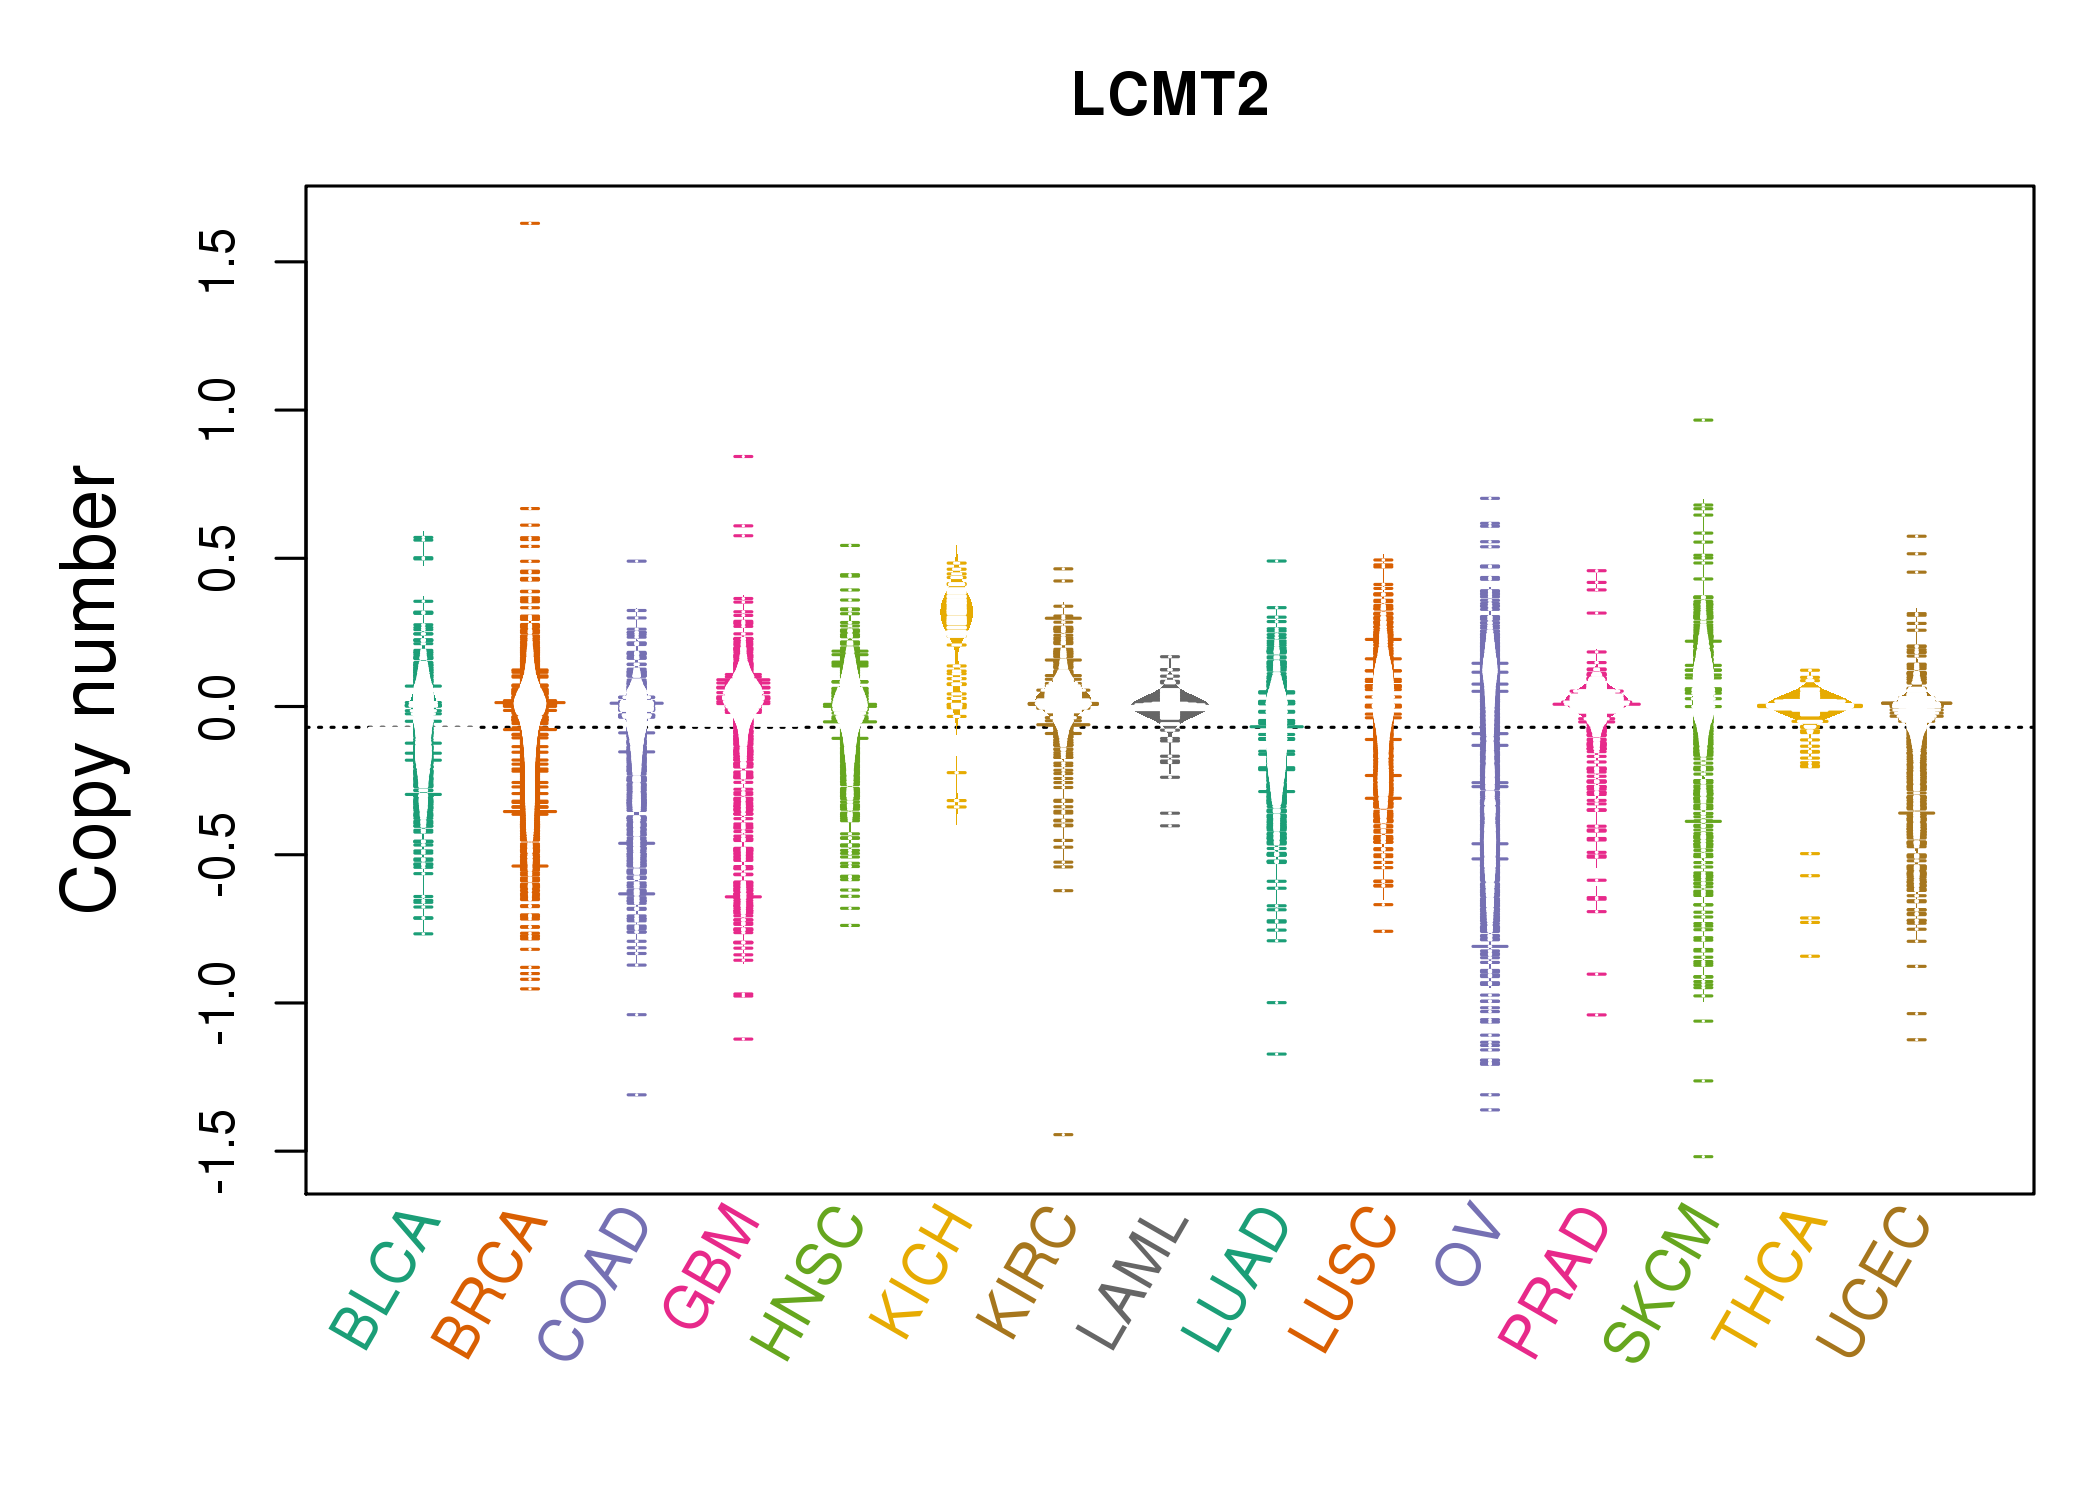 |
| cf) Tissue ID[Tissue type]: BLCA[Bladder Urothelial Carcinoma], BRCA[Breast invasive carcinoma], CESC[Cervical squamous cell carcinoma and endocervical adenocarcinoma], COAD[Colon adenocarcinoma], GBM[Glioblastoma multiforme], Glioma Low Grade, HNSC[Head and Neck squamous cell carcinoma], KICH[Kidney Chromophobe], KIRC[Kidney renal clear cell carcinoma], KIRP[Kidney renal papillary cell carcinoma], LAML[Acute Myeloid Leukemia], LUAD[Lung adenocarcinoma], LUSC[Lung squamous cell carcinoma], OV[Ovarian serous cystadenocarcinoma ], PAAD[Pancreatic adenocarcinoma], PRAD[Prostate adenocarcinoma], SKCM[Skin Cutaneous Melanoma], STAD[Stomach adenocarcinoma], THCA[Thyroid carcinoma], UCEC[Uterine Corpus Endometrial Carcinoma] |
| Top |
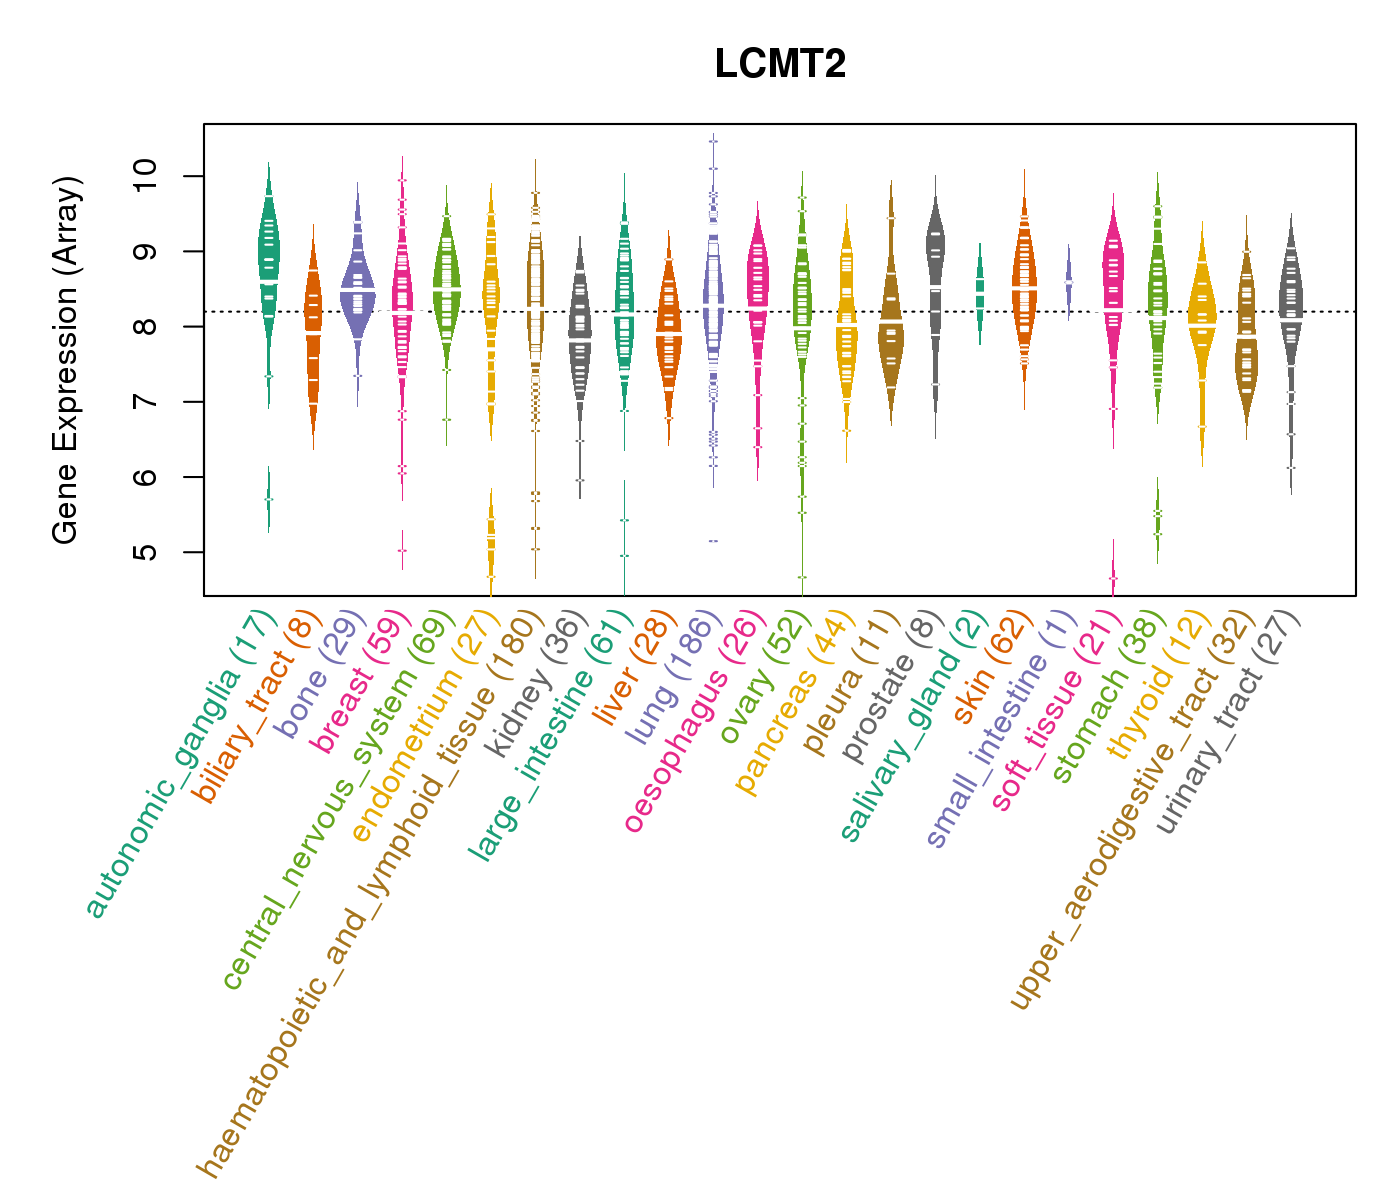
| Gene Expression for LCMT2 |
| * CCLE gene expression data were extracted from CCLE_Expression_Entrez_2012-10-18.res: Gene-centric RMA-normalized mRNA expression data. |
 |
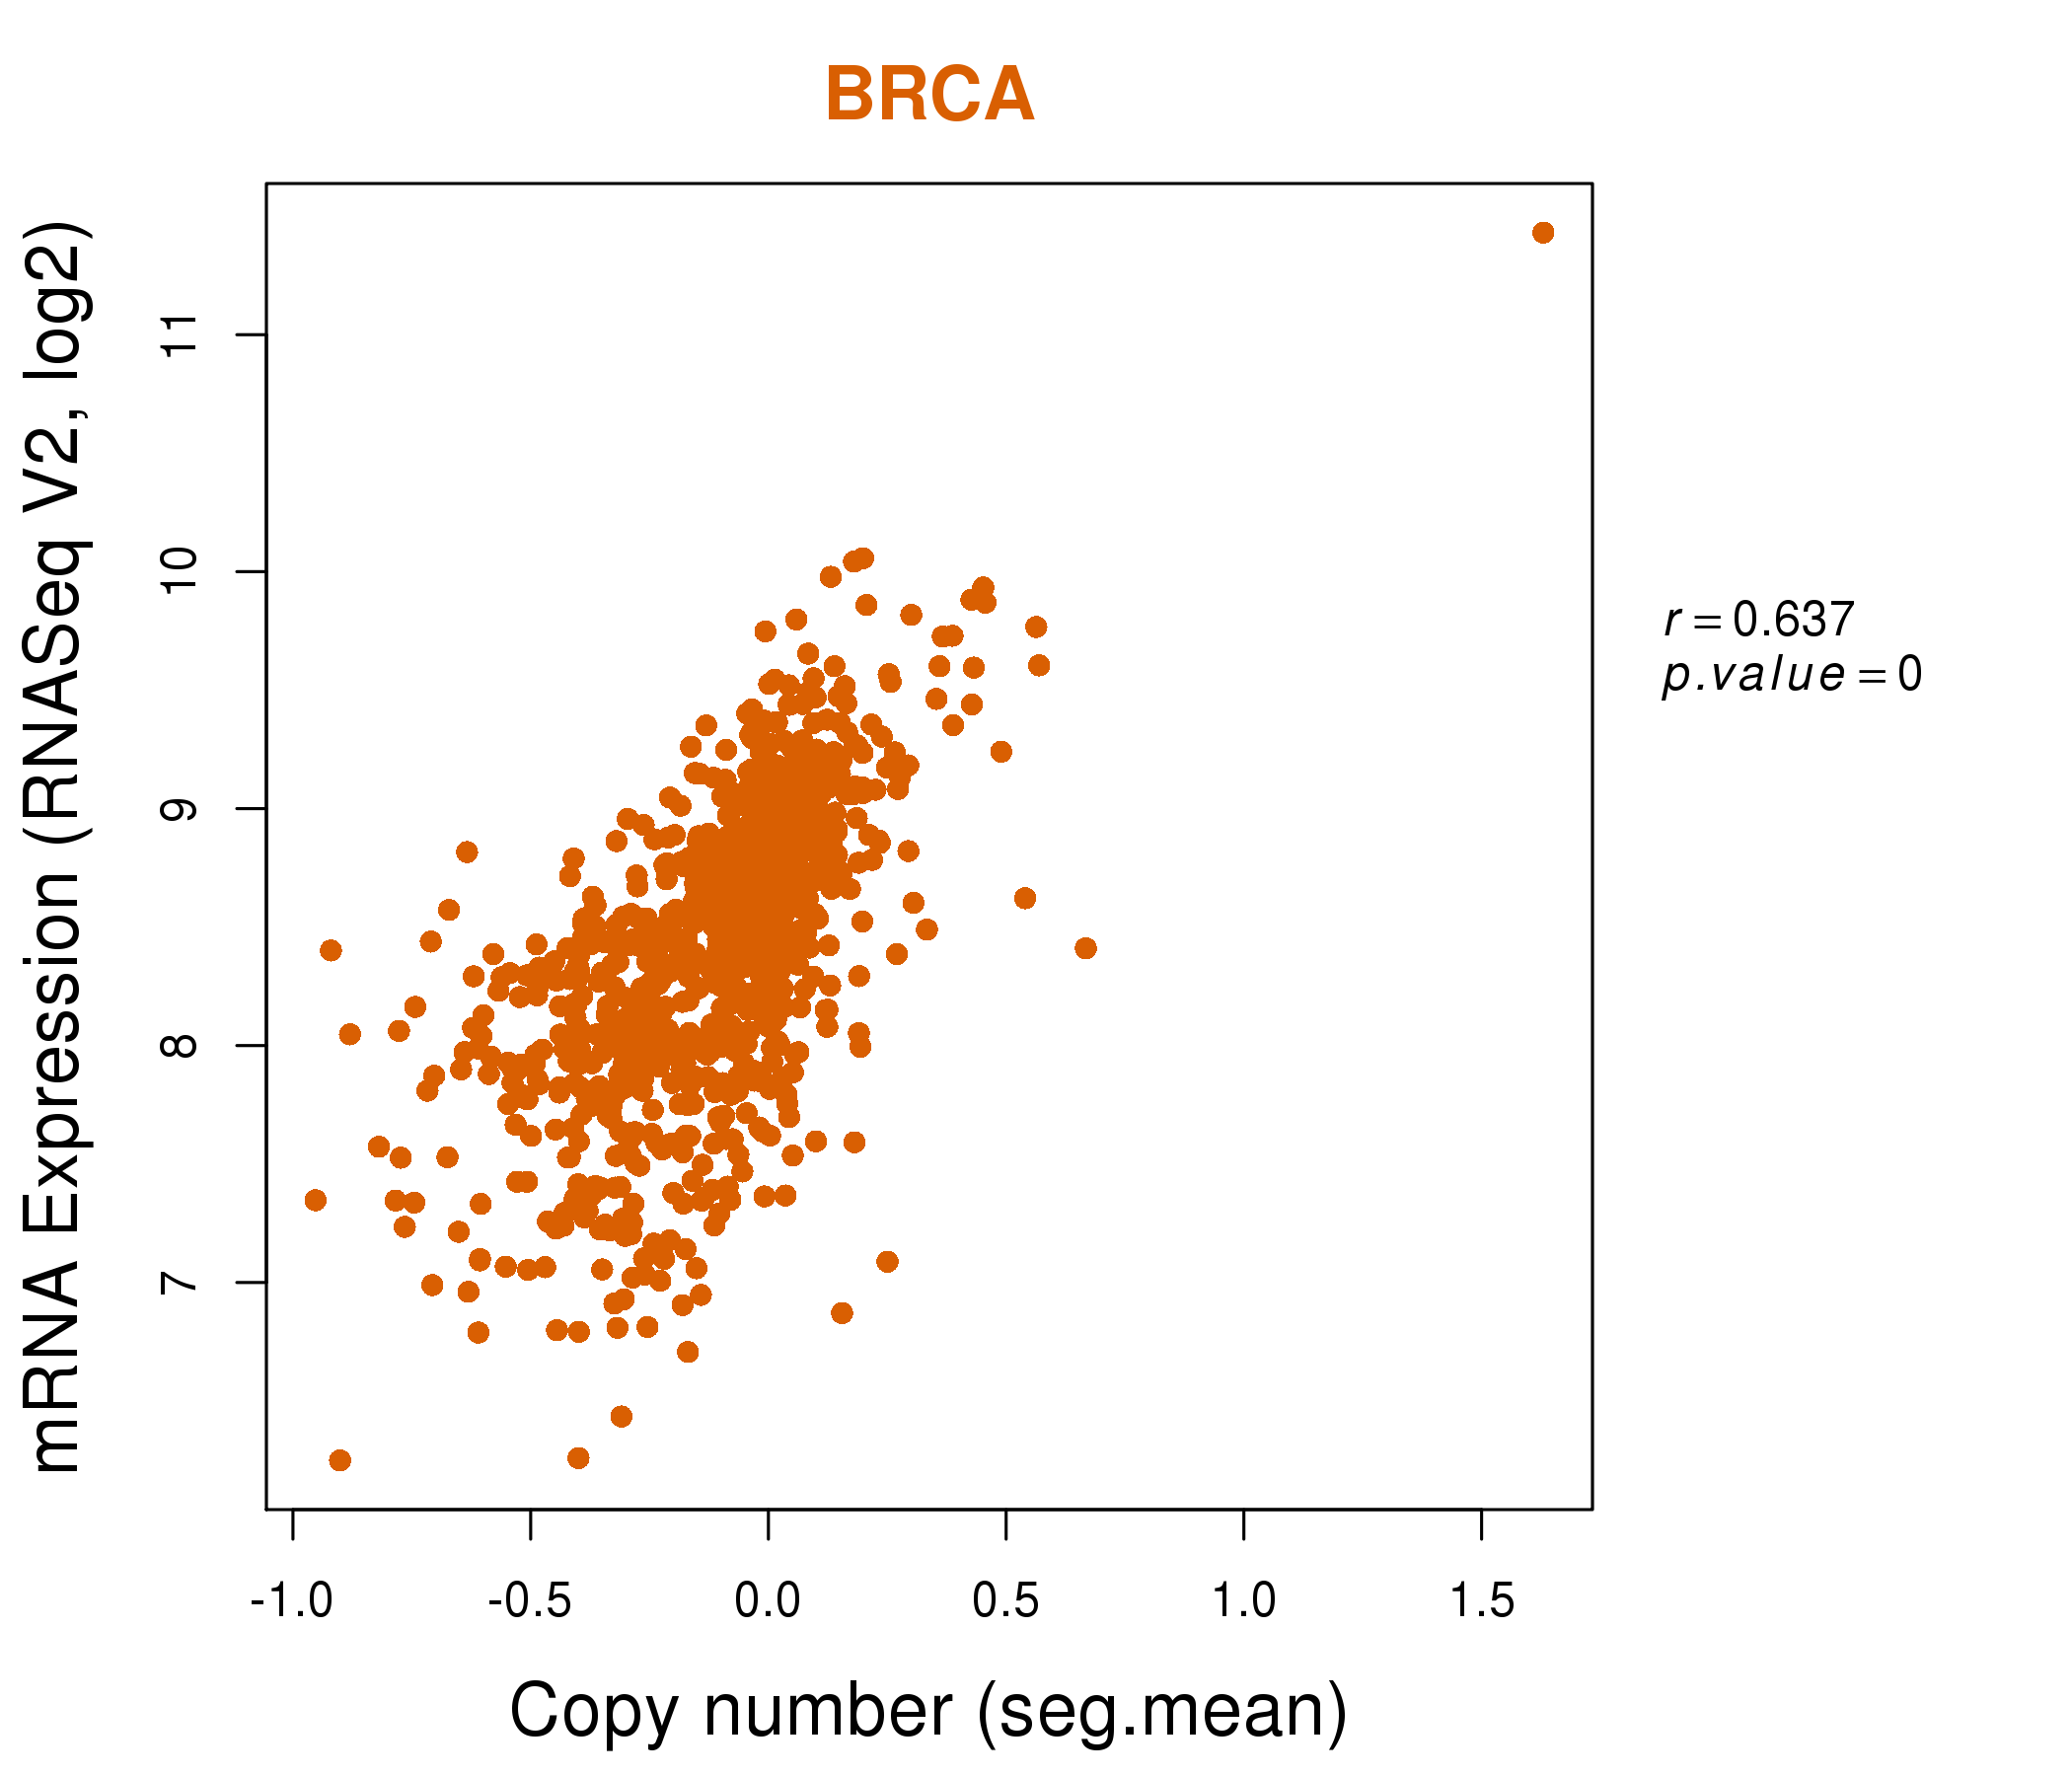
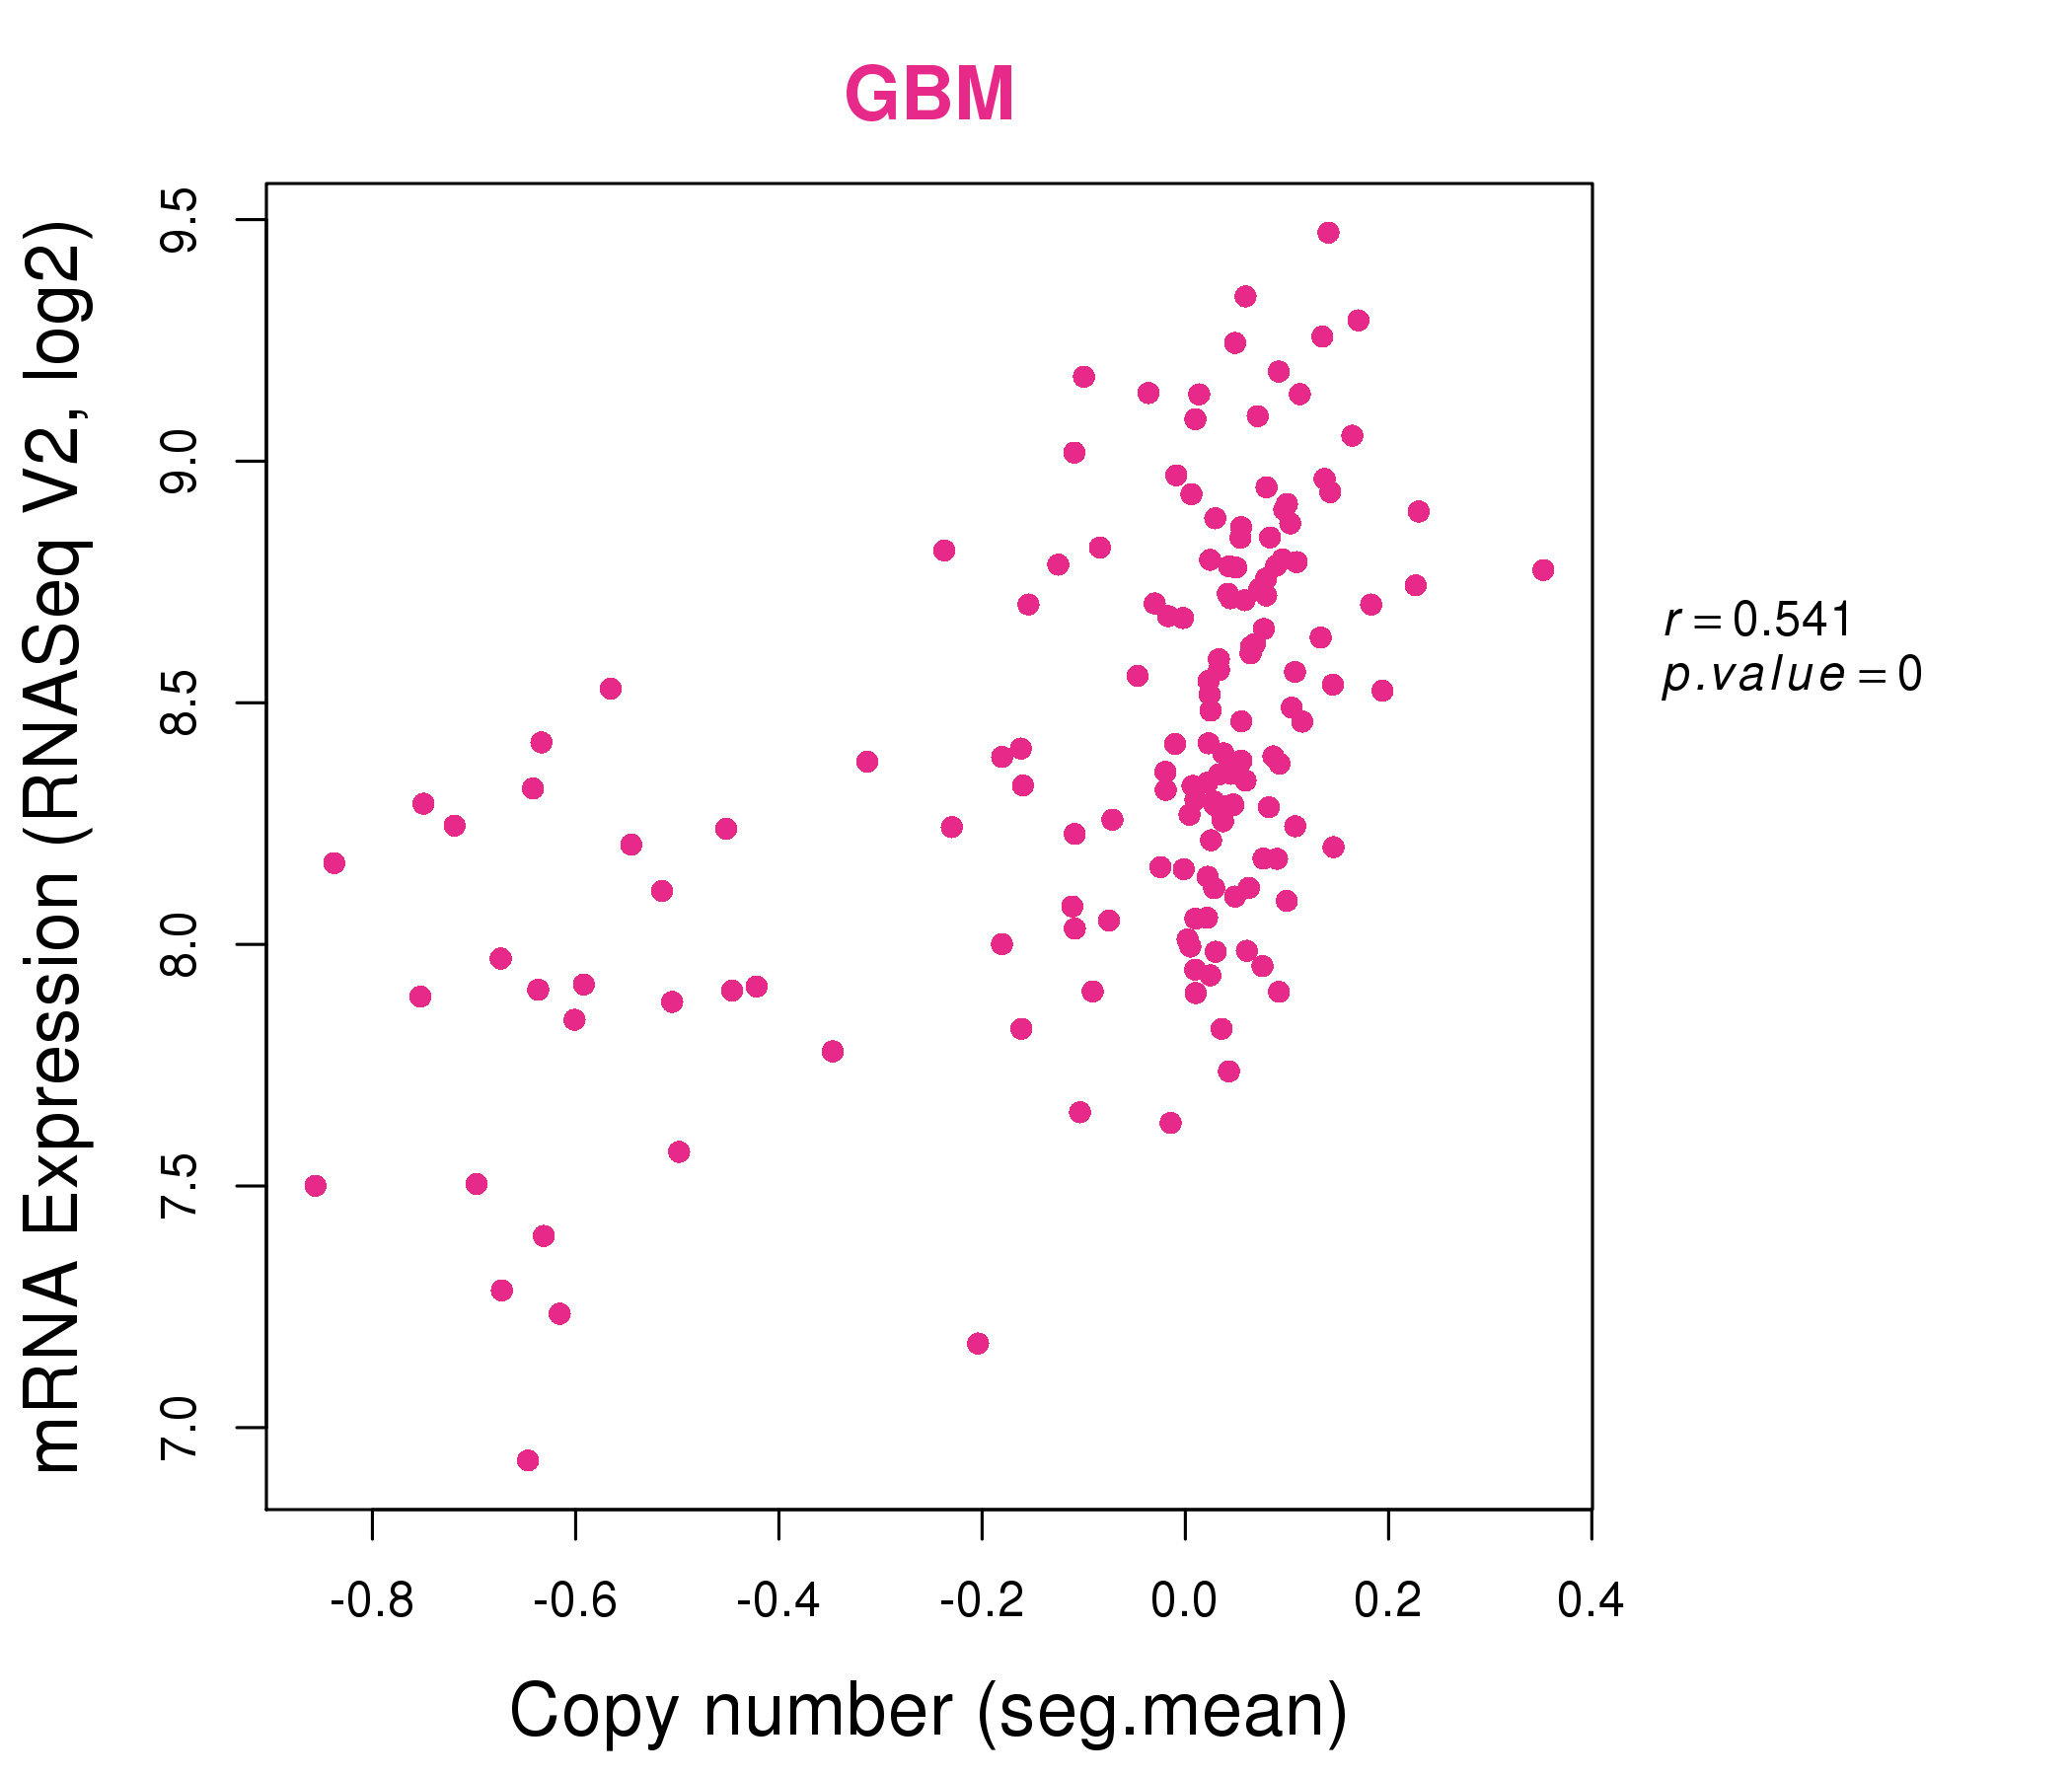
| * Normalized gene expression data of RNASeqV2 was extracted from TCGA using R package TCGA-Assembler. The URLs of all public data files on TCGA DCC data server were gathered at Jan-05-2015. Only eight cancer types have enough normal control samples for differential expression analysis. (t test, adjusted p<0.05 (using Benjamini-Hochberg FDR)) |
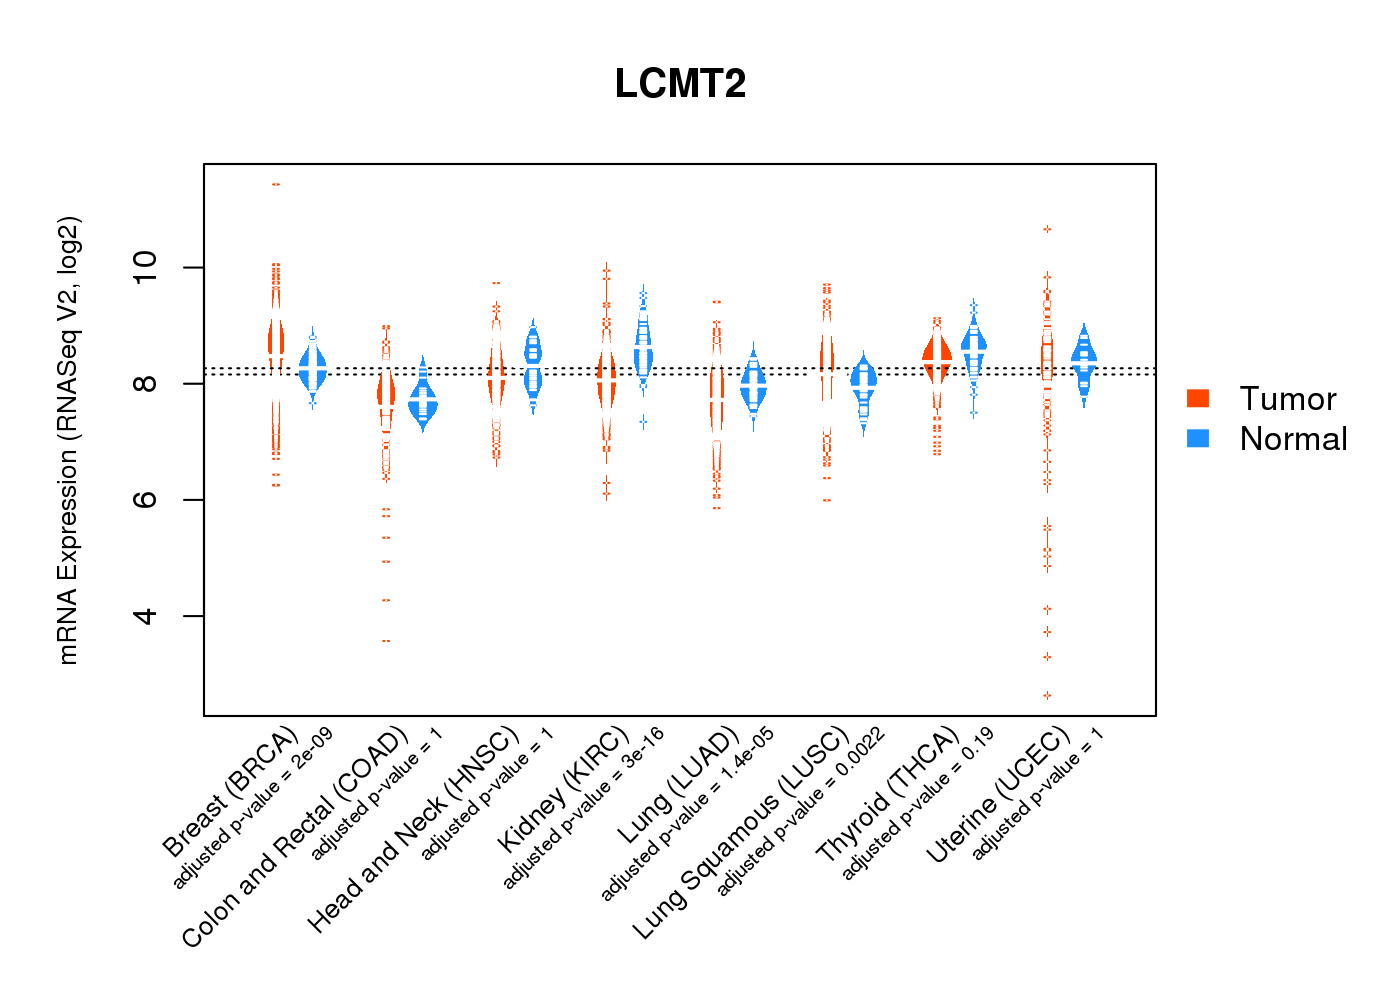 |
| Top |
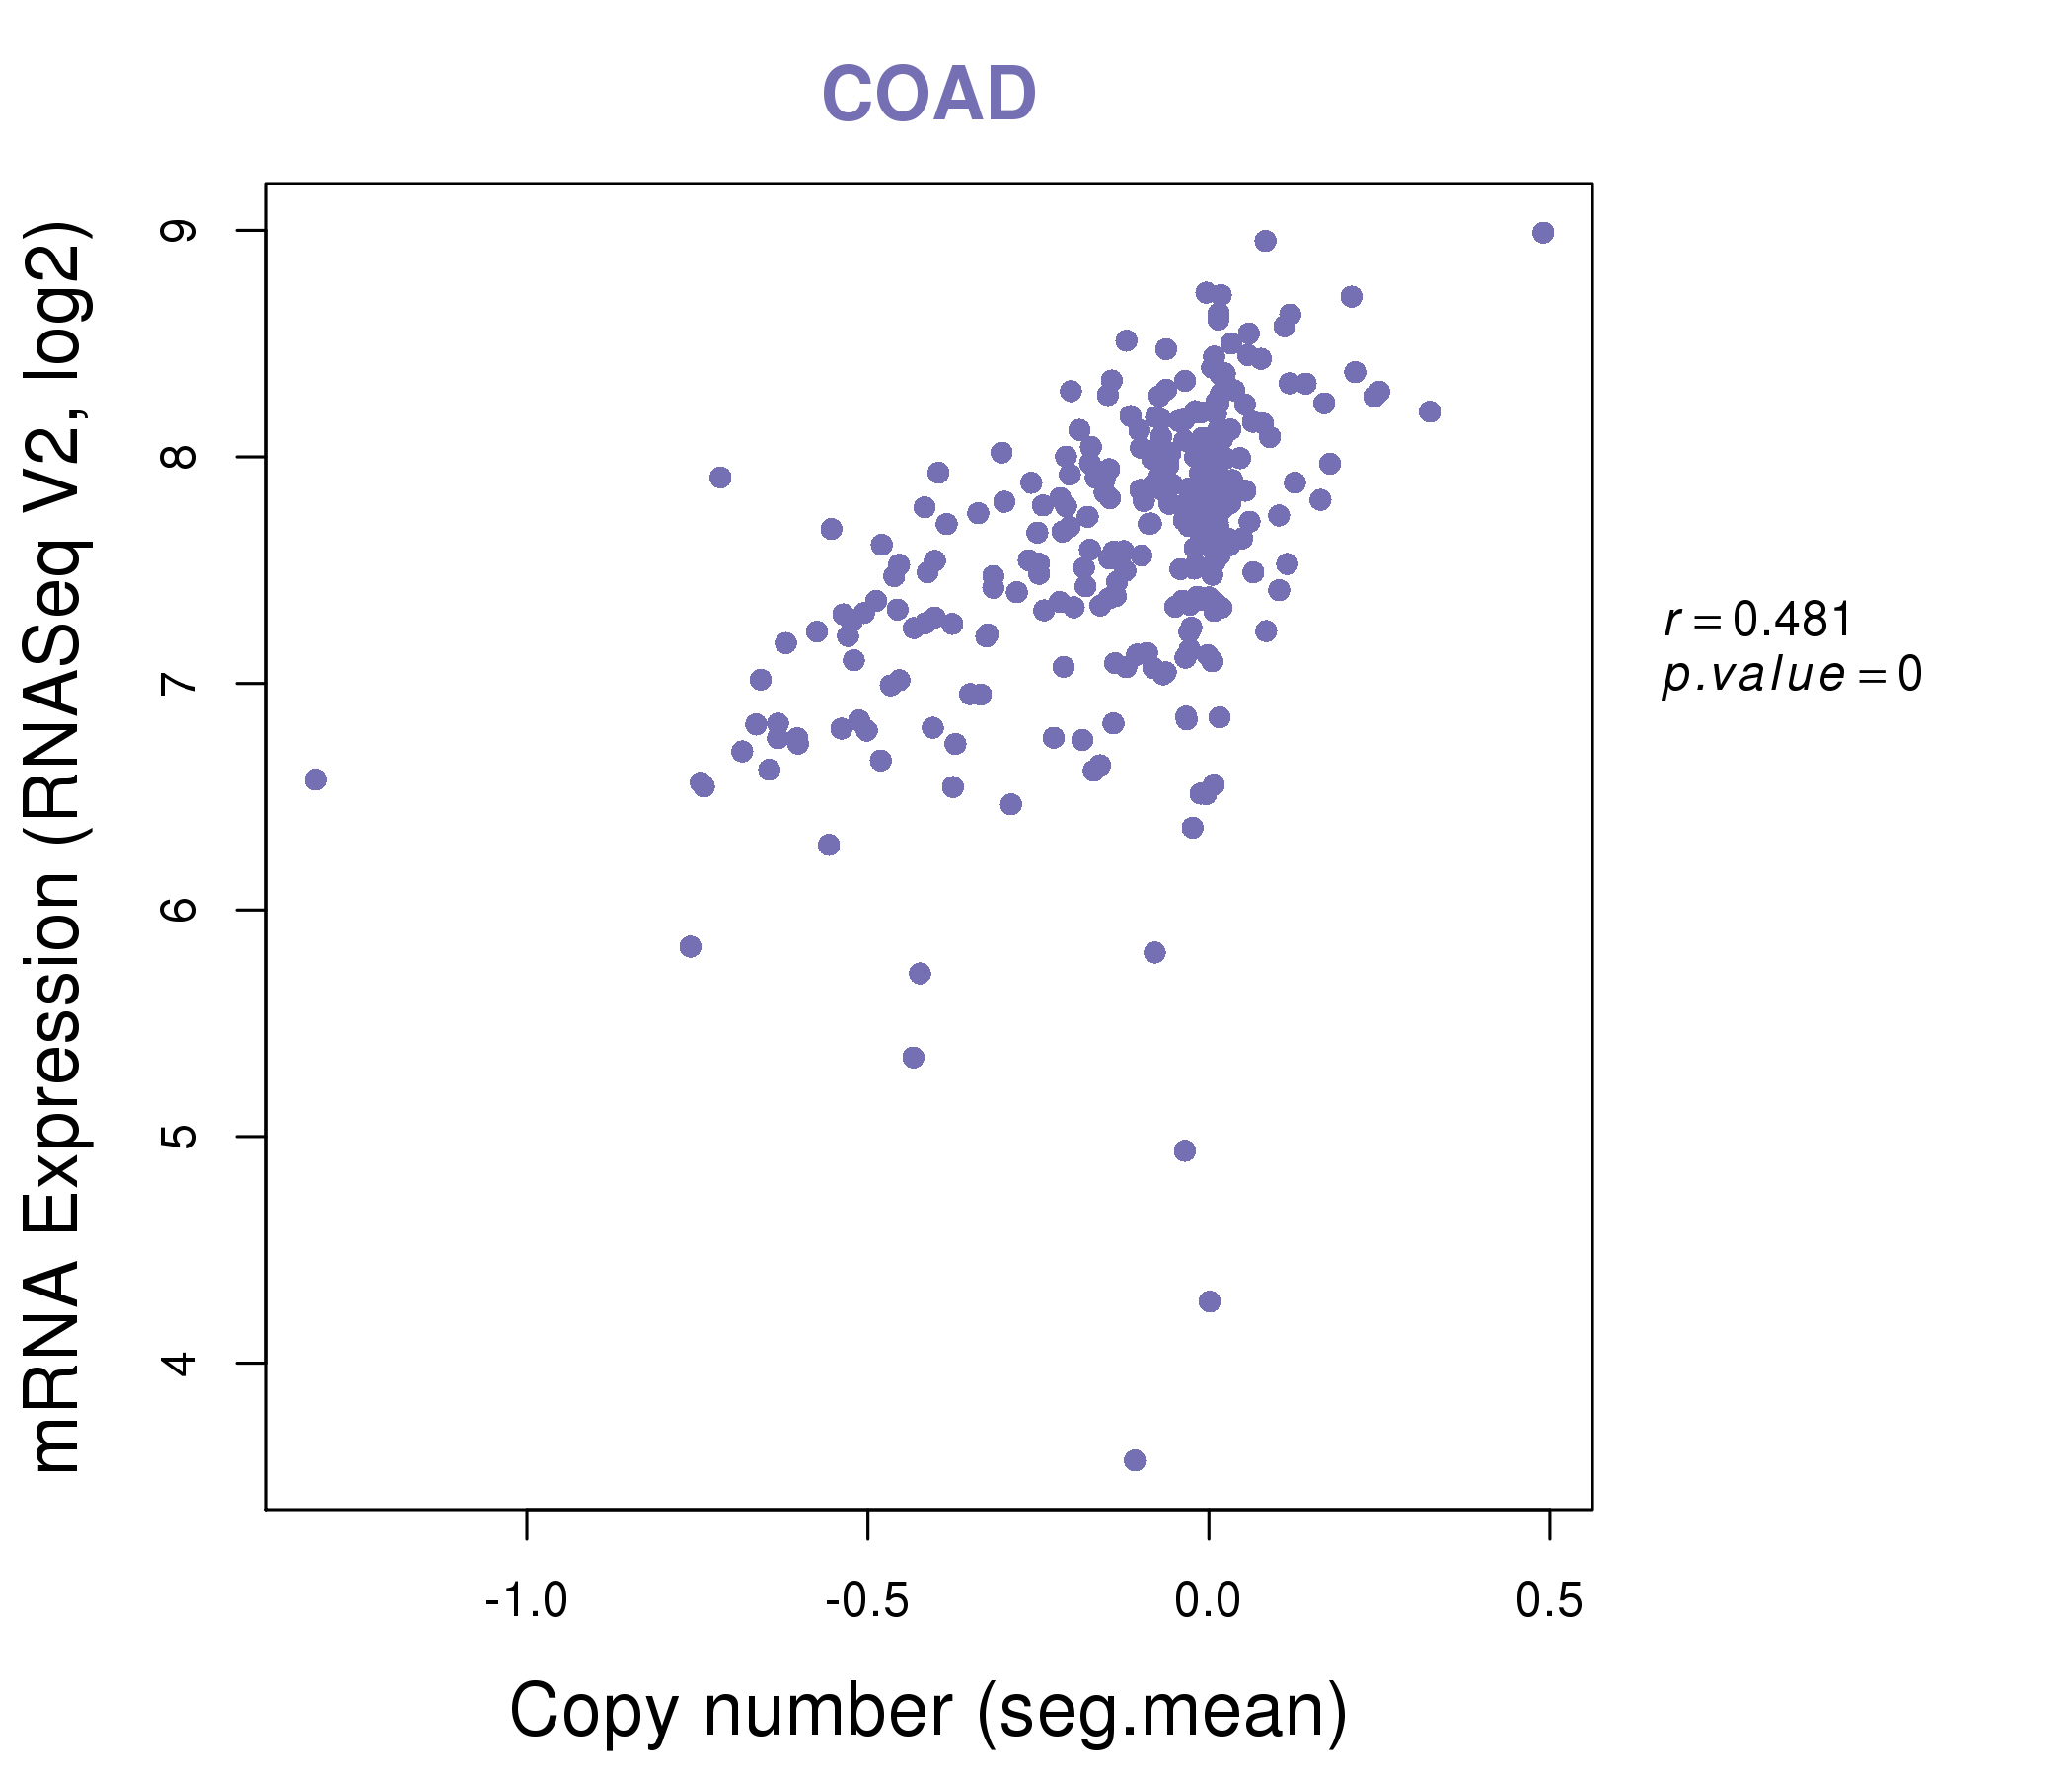
| * This plots show the correlation between CNV and gene expression. |
: Open all plots for all cancer types
 |
|
 |
|
| Top |
| Gene-Gene Network Information |
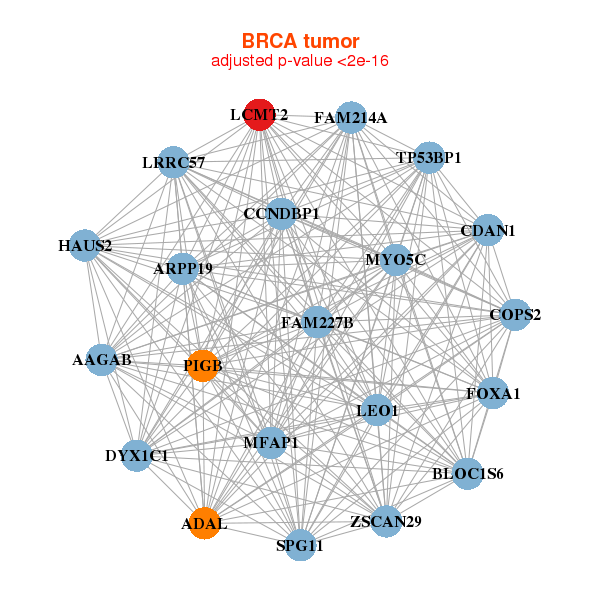
| * Co-Expression network figures were drawn using R package igraph. Only the top 20 genes with the highest correlations were shown. Red circle: input gene, orange circle: cell metabolism gene, sky circle: other gene |
: Open all plots for all cancer types
 |
| ||||
| AAGAB,ADAL,ARPP19,FAM227B,CCNDBP1,CDAN1,COPS2, DYX1C1,FOXA1,HAUS2,FAM214A,LCMT2,LEO1,LRRC57, MFAP1,MYO5C,PIGB,BLOC1S6,SPG11,TP53BP1,ZSCAN29 | AAGAB,ATP6V1G1,RHNO1,C14orf1,C14orf169,VWA9,C3orf14, CAMK2N1,HSBP1,LCMT2,LRRC42,MYCBP,OCIAD2,PPIL1, RDH11,SNRNP40,TMEM199,TP53RK,XBP1,YIPF1,ZBTB9 | ||||
 |
| ||||
| ADAL,BUB1B,KNSTRN,VWA9,EDC3,EIF3J,HAUS2, LCMT2,LRRC57,MFAP1,MRPL46,MTFMT,NDNL2,PDCD7, RPAP1,RPUSD2,RTF1,SNUPN,SPATA5L1,ZNF770,ZSCAN29 | AEN,ARID5A,ARL4C,BYSL,THEMIS2,DDX28,KIAA0040, LCMT2,MARS2,NCOA5,PDE4B,PHOSPHO1,RNF122,SERHL, SRSF2,SRSF6,SH3TC1,TRIM27,TRMT6,UTP15,ZNF131 |

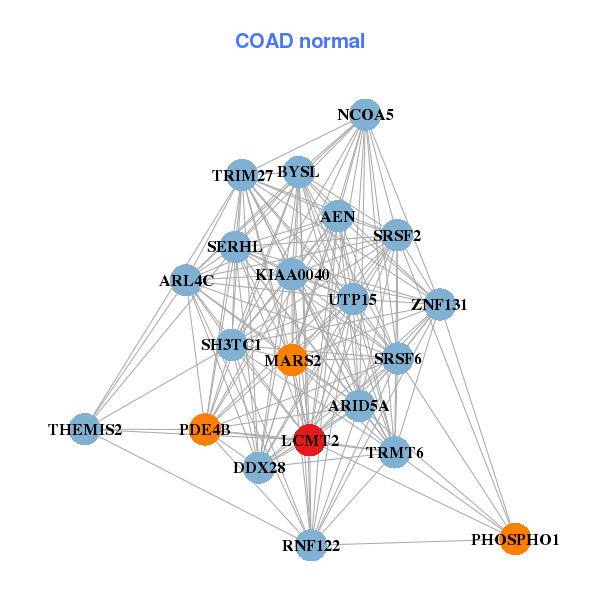
| * Co-Expression network figures were drawn using R package igraph. Only the top 20 genes with the highest correlations were shown. Red circle: input gene, orange circle: cell metabolism gene, sky circle: other gene |
: Open all plots for all cancer types
| Top |
: Open all interacting genes' information including KEGG pathway for all interacting genes from DAVID
| Top |
| Pharmacological Information for LCMT2 |
| DB Category | DB Name | DB's ID and Url link |
| * Gene Centered Interaction Network. |
 |
| * Drug Centered Interaction Network. |
| DrugBank ID | Target Name | Drug Groups | Generic Name | Drug Centered Network | Drug Structure |
| DB00149 | leucine carboxyl methyltransferase 2 | approved; nutraceutical | L-Leucine | 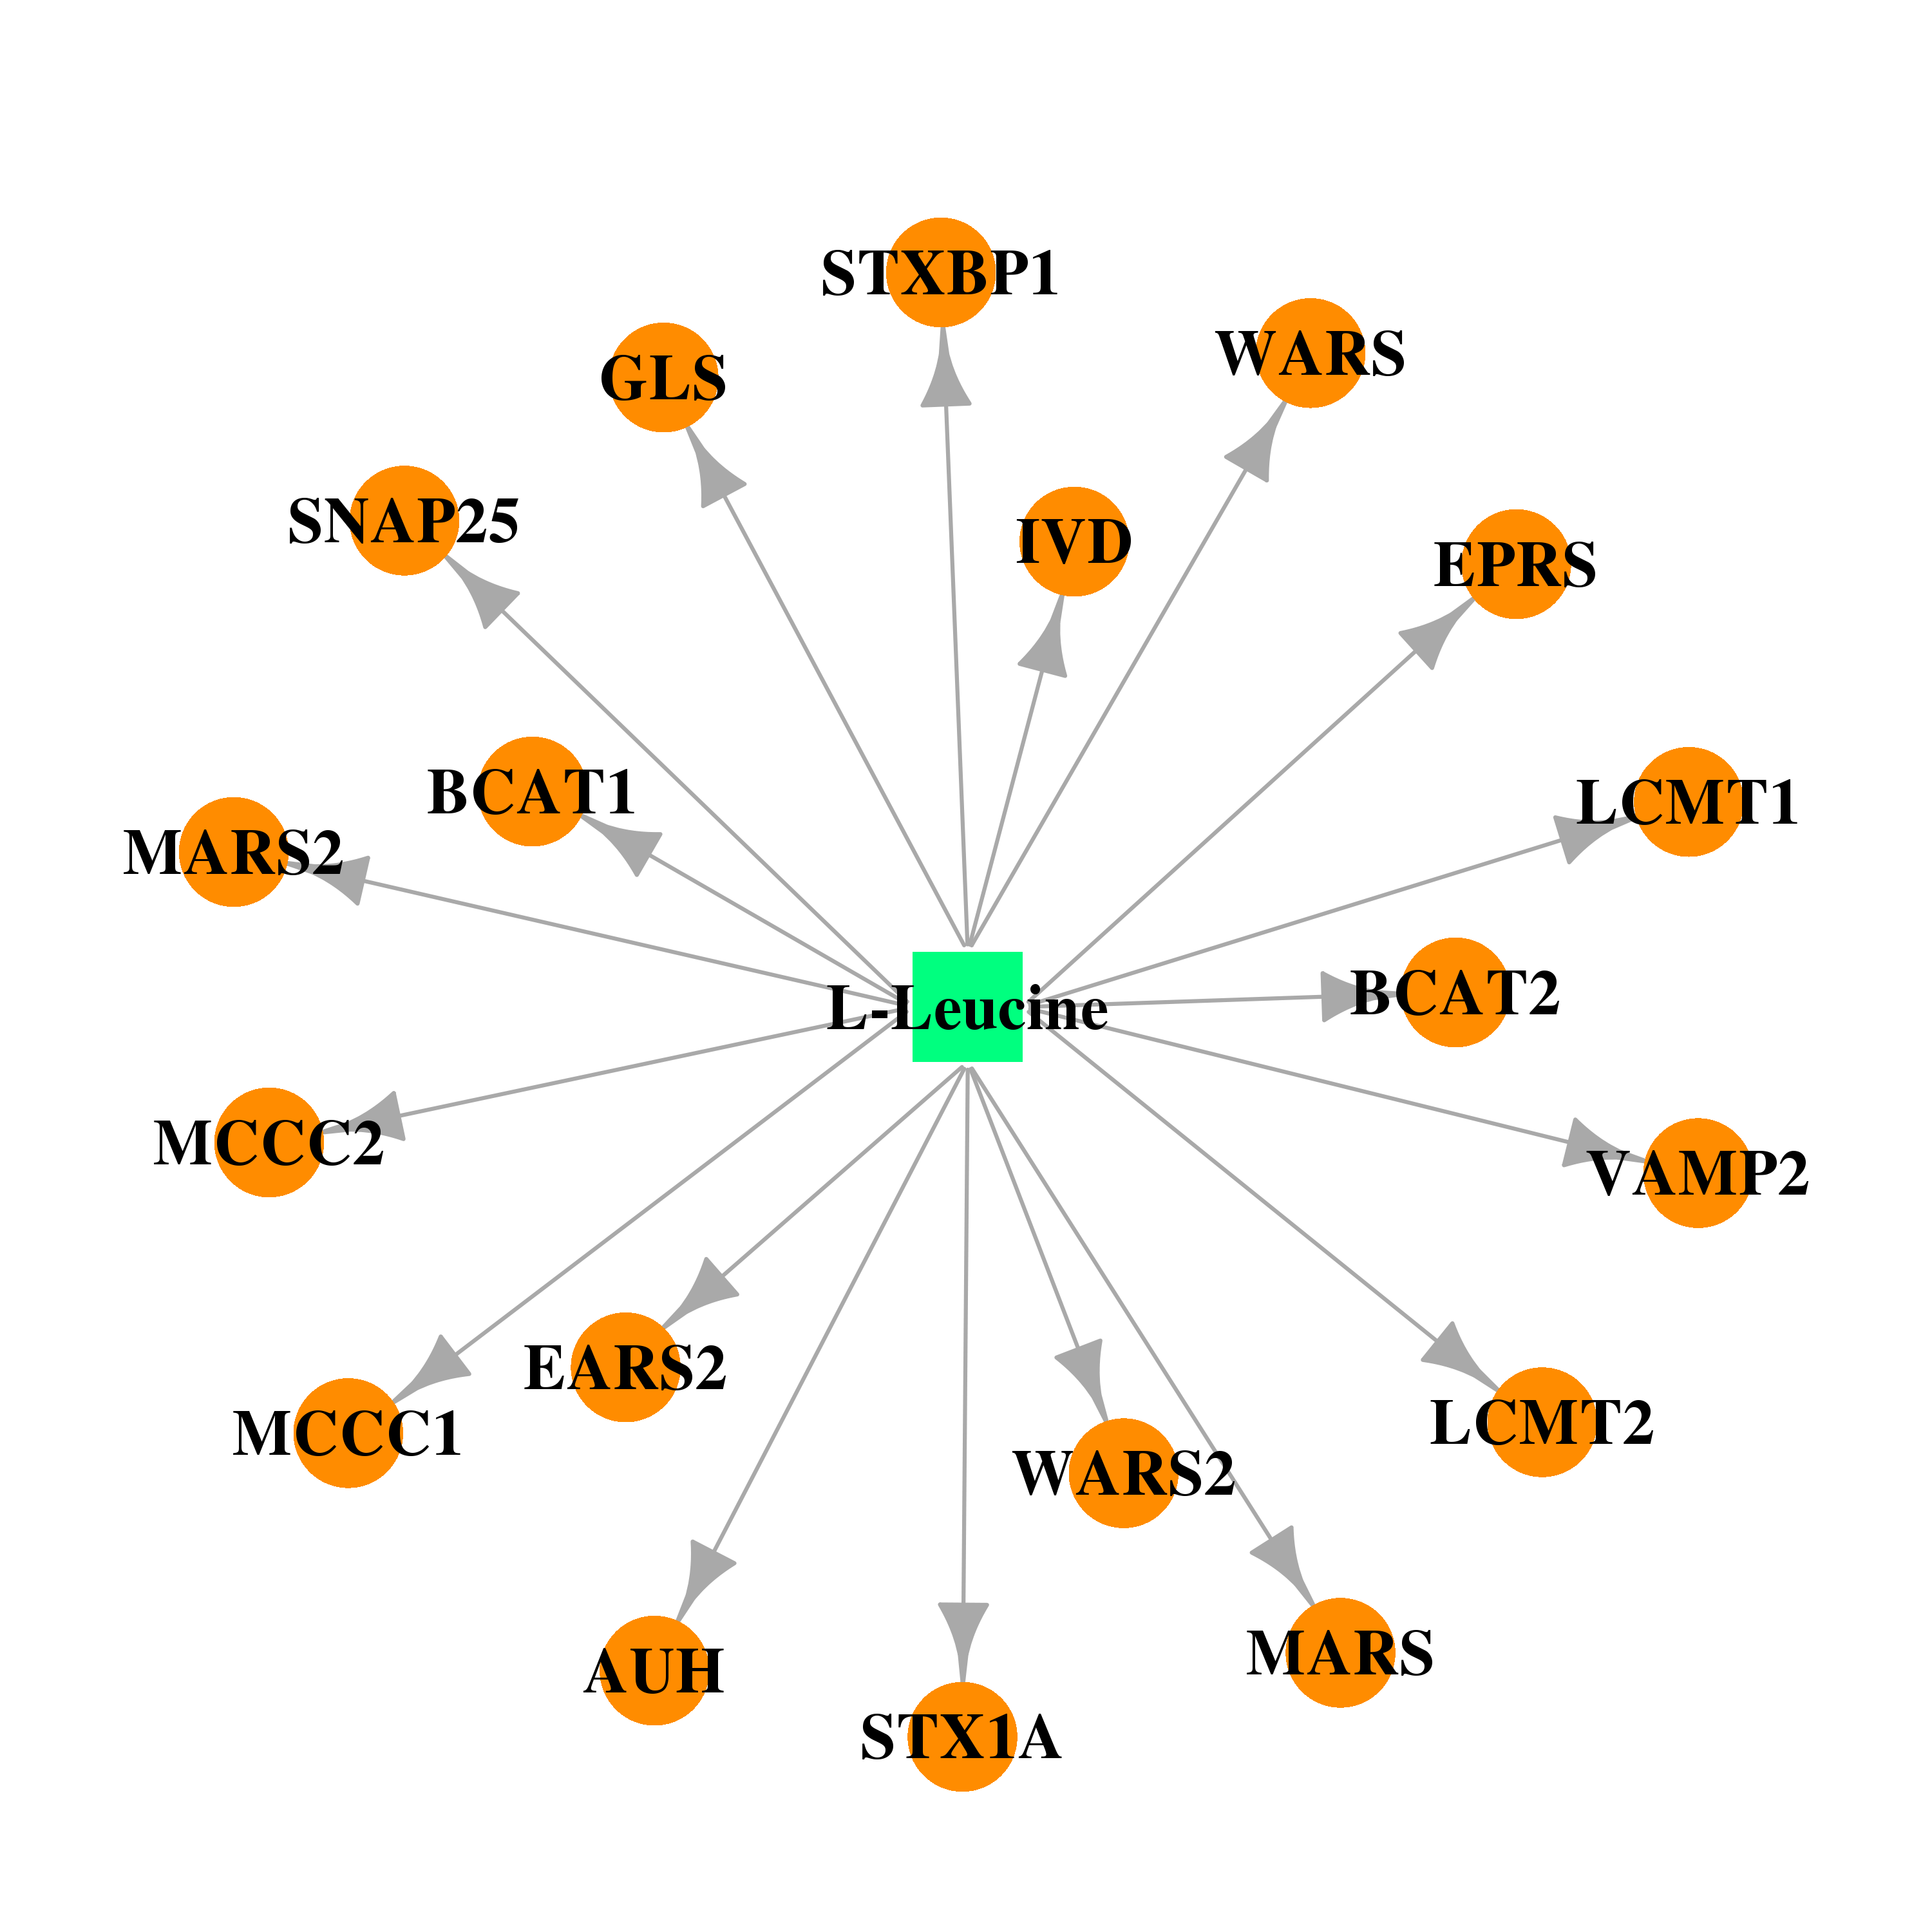 |  |
| Top |
| Cross referenced IDs for LCMT2 |
| * We obtained these cross-references from Uniprot database. It covers 150 different DBs, 18 categories. http://www.uniprot.org/help/cross_references_section |
: Open all cross reference information
|
Copyright © 2016-Present - The Univsersity of Texas Health Science Center at Houston @ |