|
||||||||||||||||||||
| |
| Phenotypic Information (metabolism pathway, cancer, disease, phenome) |
| |
| |
| Gene-Gene Network Information: Co-Expression Network, Interacting Genes & KEGG |
| |
|


| Gene Summary for PSMD6 |
| Basic gene info. | Gene symbol | PSMD6 |
| Gene name | proteasome (prosome, macropain) 26S subunit, non-ATPase, 6 | |
| Synonyms | Rpn7|S10|SGA-113M|p42A|p44S10 | |
| Cytomap | UCSC genome browser: 3p14.1 | |
| Genomic location | chr3 :63996230-64009120 | |
| Type of gene | protein-coding | |
| RefGenes | NM_001271779.1, NM_001271780.1,NM_001271781.1,NM_014814.2, | |
| Ensembl id | ENSG00000163636 | |
| Description | 26S proteasome non-ATPase regulatory subunit 6breast cancer-associated protein SGA-113Mphosphonoformate immuno-associated protein 4proteasome regulatory particle subunit p44S10 | |
| Modification date | 20141207 | |
| dbXrefs | HGNC : HGNC | |
| Ensembl : ENSG00000163636 | ||
| HPRD : 18370 | ||
| Vega : OTTHUMG00000158765 | ||
| Protein | UniProt: Q15008 go to UniProt's Cross Reference DB Table | |
| Expression | CleanEX: HS_PSMD6 | |
| BioGPS: 9861 | ||
| Gene Expression Atlas: ENSG00000163636 | ||
| The Human Protein Atlas: ENSG00000163636 | ||
| Pathway | NCI Pathway Interaction Database: PSMD6 | |
| KEGG: PSMD6 | ||
| REACTOME: PSMD6 | ||
| ConsensusPathDB | ||
| Pathway Commons: PSMD6 | ||
| Metabolism | MetaCyc: PSMD6 | |
| HUMANCyc: PSMD6 | ||
| Regulation | Ensembl's Regulation: ENSG00000163636 | |
| miRBase: chr3 :63,996,230-64,009,120 | ||
| TargetScan: NM_001271779 | ||
| cisRED: ENSG00000163636 | ||
| Context | iHOP: PSMD6 | |
| cancer metabolism search in PubMed: PSMD6 | ||
| UCL Cancer Institute: PSMD6 | ||
| Assigned class in ccmGDB | B - This gene belongs to cancer gene. | |
| Top |
| Phenotypic Information for PSMD6(metabolism pathway, cancer, disease, phenome) |
| Cancer | CGAP: PSMD6 |
| Familial Cancer Database: PSMD6 | |
| * This gene is included in those cancer gene databases. |
|
|
|
|
|
| . | ||||||||||||||
Oncogene 1 | Significant driver gene in | |||||||||||||||||||
| cf) number; DB name 1 Oncogene; http://nar.oxfordjournals.org/content/35/suppl_1/D721.long, 2 Tumor Suppressor gene; https://bioinfo.uth.edu/TSGene/, 3 Cancer Gene Census; http://www.nature.com/nrc/journal/v4/n3/abs/nrc1299.html, 4 CancerGenes; http://nar.oxfordjournals.org/content/35/suppl_1/D721.long, 5 Network of Cancer Gene; http://ncg.kcl.ac.uk/index.php, 1Therapeutic Vulnerabilities in Cancer; http://cbio.mskcc.org/cancergenomics/statius/ |
| REACTOME_METABOLISM_OF_AMINO_ACIDS_AND_DERIVATIVES REACTOME_METABOLISM_OF_MRNA REACTOME_METABOLISM_OF_RNA | |
| OMIM | |
| Orphanet | |
| Disease | KEGG Disease: PSMD6 |
| MedGen: PSMD6 (Human Medical Genetics with Condition) | |
| ClinVar: PSMD6 | |
| Phenotype | MGI: PSMD6 (International Mouse Phenotyping Consortium) |
| PhenomicDB: PSMD6 | |
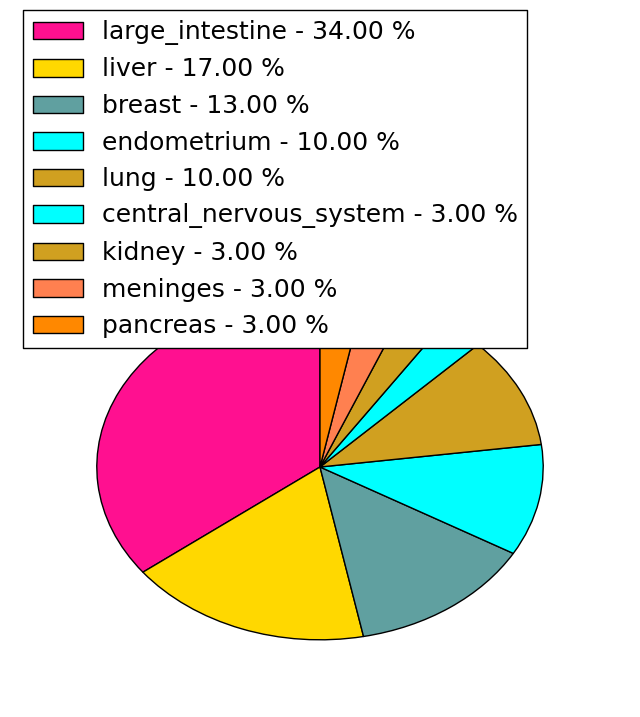
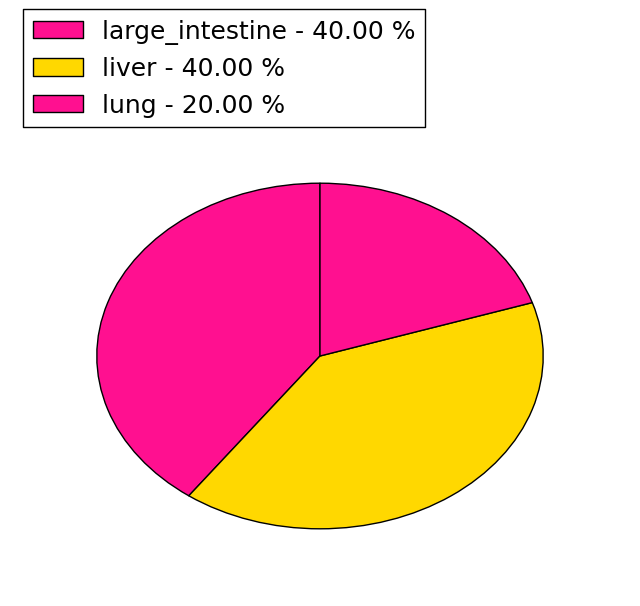
| Mutations for PSMD6 |
| * Under tables are showing count per each tissue to give us broad intuition about tissue specific mutation patterns.You can go to the detailed page for each mutation database's web site. |
| There's no structural variation information in COSMIC data for this gene. |
| * From mRNA Sanger sequences, Chitars2.0 arranged chimeric transcripts. This table shows PSMD6 related fusion information. |
| ID | Head Gene | Tail Gene | Accession | Gene_a | qStart_a | qEnd_a | Chromosome_a | tStart_a | tEnd_a | Gene_a | qStart_a | qEnd_a | Chromosome_a | tStart_a | tEnd_a |
| DA942713 | PSMD6 | 1 | 281 | 3 | 64008050 | 64009080 | EIF3A | 273 | 582 | 10 | 120802239 | 120809487 | |
| CD626170 | PSMD6 | 3 | 471 | 3 | 64005007 | 64009108 | ZNF646 | 471 | 693 | 16 | 31088783 | 31089005 | |
| CD626167 | ZNF646 | 13 | 240 | 16 | 31088783 | 31089010 | PSMD6 | 240 | 541 | 3 | 64008056 | 64009108 | |
| CD626168 | PSMD6 | 3 | 472 | 3 | 64005007 | 64009108 | ZNF646 | 472 | 680 | 16 | 31088783 | 31088997 | |
| CD626169 | ZNF646 | 13 | 240 | 16 | 31088783 | 31089010 | PSMD6 | 240 | 699 | 3 | 64005019 | 64009108 | |
| CD626166 | PSMD6 | 15 | 484 | 3 | 64005007 | 64009108 | ZNF646 | 484 | 670 | 16 | 31088783 | 31088971 | |
| Top |
| There's no copy number variation information in COSMIC data for this gene. |
| Top |
|
 |
| Top |
| Stat. for Non-Synonymous SNVs (# total SNVs=29) | (# total SNVs=5) |
 |  |
(# total SNVs=0) | (# total SNVs=0) |
| Top |
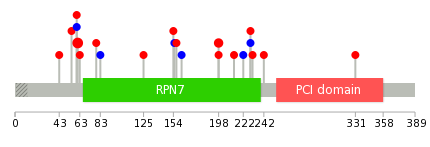
| * When you move the cursor on each content, you can see more deailed mutation information on the Tooltip. Those are primary_site,primary_histology,mutation(aa),pubmedID. |
| GRCh37 position | Mutation(aa) | Unique sampleID count |
| chr3:64008049-64008049 | p.E99G | 4 |
| chr3:63996436-63996436 | p.D360N | 2 |
| chr3:64005033-64005033 | p.R146R | 2 |
| chr3:64009039-64009039 | p.I19M | 2 |
| chr3:64004505-64004505 | p.L236F | 2 |
| chr3:64004514-64004514 | p.R233G | 2 |
| chr3:64008050-64008050 | p.E99K | 2 |
| chr3:64004282-64004282 | p.Q273H | 2 |
| chr3:64008103-64008103 | p.L81S | 1 |
| chr3:63996409-63996409 | p.T369P | 1 |
| Top |
|
 |
| Point Mutation/ Tissue ID | 1 | 2 | 3 | 4 | 5 | 6 | 7 | 8 | 9 | 10 | 11 | 12 | 13 | 14 | 15 | 16 | 17 | 18 | 19 | 20 |
| # sample | 2 | 12 | 1 | 2 | 1 | 1 | 1 | 3 | 3 | |||||||||||
| # mutation | 2 | 7 | 1 | 2 | 1 | 1 | 1 | 3 | 3 | |||||||||||
| nonsynonymous SNV | 2 | 5 | 1 | 2 | 1 | 2 | 3 | |||||||||||||
| synonymous SNV | 3 | 1 | 1 | 1 |
| cf) Tissue ID; Tissue type (1; BLCA[Bladder Urothelial Carcinoma], 2; BRCA[Breast invasive carcinoma], 3; CESC[Cervical squamous cell carcinoma and endocervical adenocarcinoma], 4; COAD[Colon adenocarcinoma], 5; GBM[Glioblastoma multiforme], 6; Glioma Low Grade, 7; HNSC[Head and Neck squamous cell carcinoma], 8; KICH[Kidney Chromophobe], 9; KIRC[Kidney renal clear cell carcinoma], 10; KIRP[Kidney renal papillary cell carcinoma], 11; LAML[Acute Myeloid Leukemia], 12; LUAD[Lung adenocarcinoma], 13; LUSC[Lung squamous cell carcinoma], 14; OV[Ovarian serous cystadenocarcinoma ], 15; PAAD[Pancreatic adenocarcinoma], 16; PRAD[Prostate adenocarcinoma], 17; SKCM[Skin Cutaneous Melanoma], 18:STAD[Stomach adenocarcinoma], 19:THCA[Thyroid carcinoma], 20:UCEC[Uterine Corpus Endometrial Carcinoma]) |
| Top |
| * We represented just top 10 SNVs. When you move the cursor on each content, you can see more deailed mutation information on the Tooltip. Those are primary_site, primary_histology, mutation(aa), pubmedID. |
| Genomic Position | Mutation(aa) | Unique sampleID count |
| chr3:64008049 | p.E61G,PSMD6 | 4 |
| chr3:64004505 | p.L198F,PSMD6 | 3 |
| chr3:64008051 | p.S60R,PSMD6 | 2 |
| chr3:64004632 | p.L83L,PSMD6 | 1 |
| chr3:63996409 | p.K79N,PSMD6 | 1 |
| chr3:64004637 | p.R63C,PSMD6 | 1 |
| chr3:63999270 | p.T331P,PSMD6 | 1 |
| chr3:64004980 | p.Q242H,PSMD6 | 1 |
| chr3:64004295 | p.K55N,PSMD6 | 1 |
| chr3:64005106 | p.S231F,PSMD6 | 1 |
| * Copy number data were extracted from TCGA using R package TCGA-Assembler. The URLs of all public data files on TCGA DCC data server were gathered on Jan-05-2015. Function ProcessCNAData in TCGA-Assembler package was used to obtain gene-level copy number value which is calculated as the average copy number of the genomic region of a gene. |
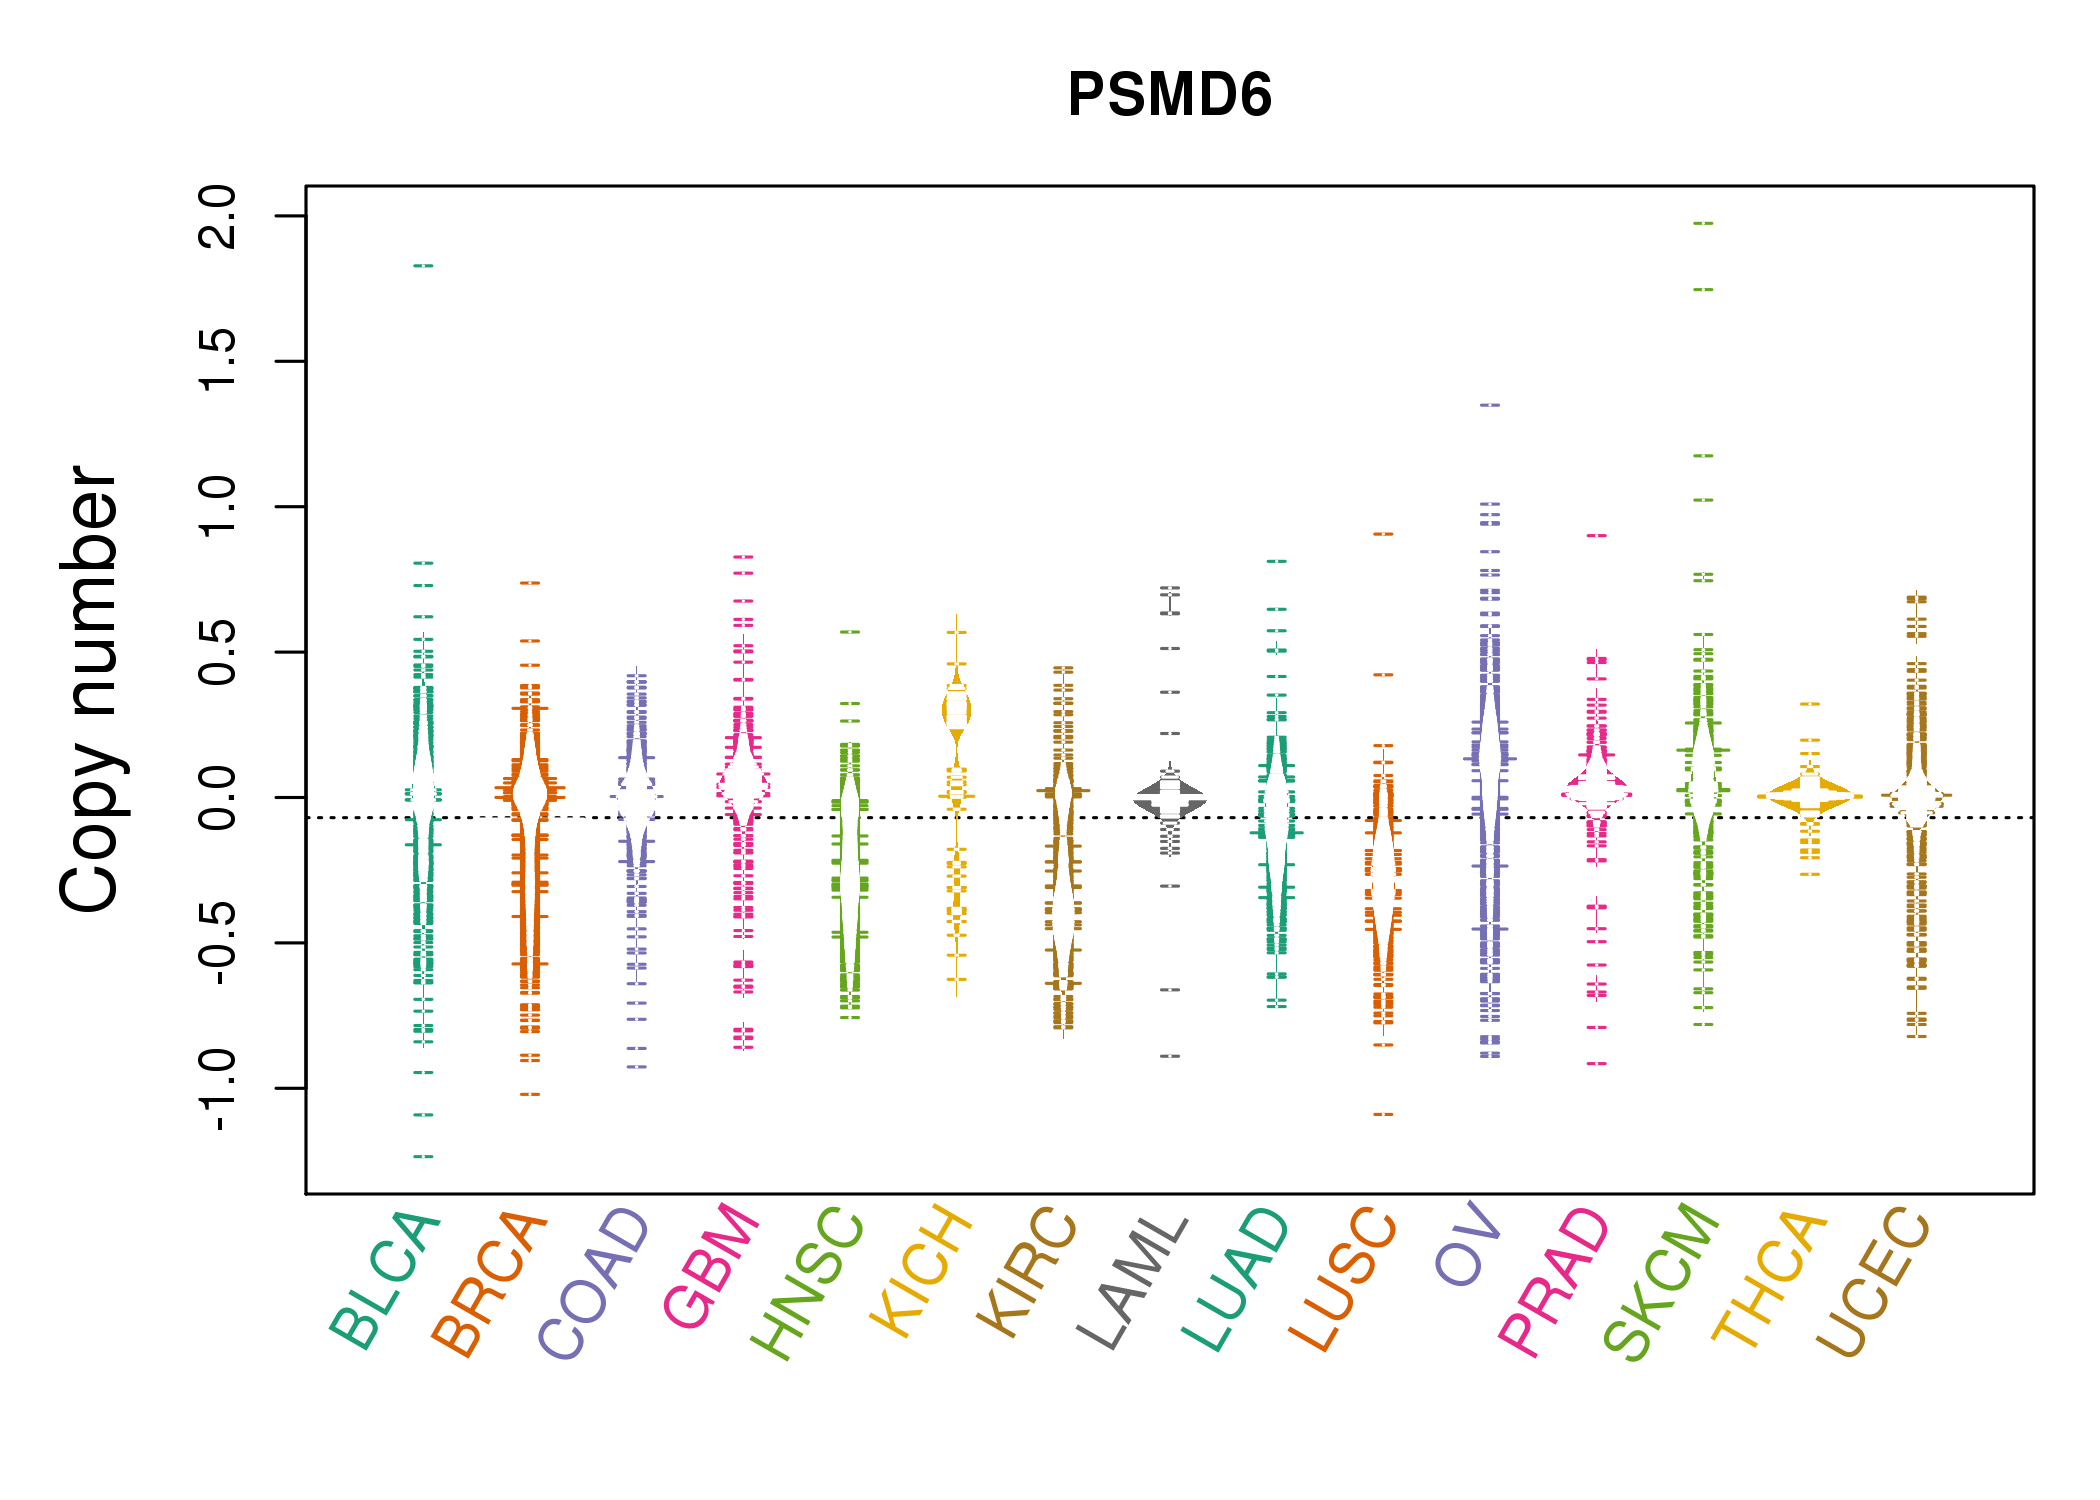 |
| cf) Tissue ID[Tissue type]: BLCA[Bladder Urothelial Carcinoma], BRCA[Breast invasive carcinoma], CESC[Cervical squamous cell carcinoma and endocervical adenocarcinoma], COAD[Colon adenocarcinoma], GBM[Glioblastoma multiforme], Glioma Low Grade, HNSC[Head and Neck squamous cell carcinoma], KICH[Kidney Chromophobe], KIRC[Kidney renal clear cell carcinoma], KIRP[Kidney renal papillary cell carcinoma], LAML[Acute Myeloid Leukemia], LUAD[Lung adenocarcinoma], LUSC[Lung squamous cell carcinoma], OV[Ovarian serous cystadenocarcinoma ], PAAD[Pancreatic adenocarcinoma], PRAD[Prostate adenocarcinoma], SKCM[Skin Cutaneous Melanoma], STAD[Stomach adenocarcinoma], THCA[Thyroid carcinoma], UCEC[Uterine Corpus Endometrial Carcinoma] |
| Top |
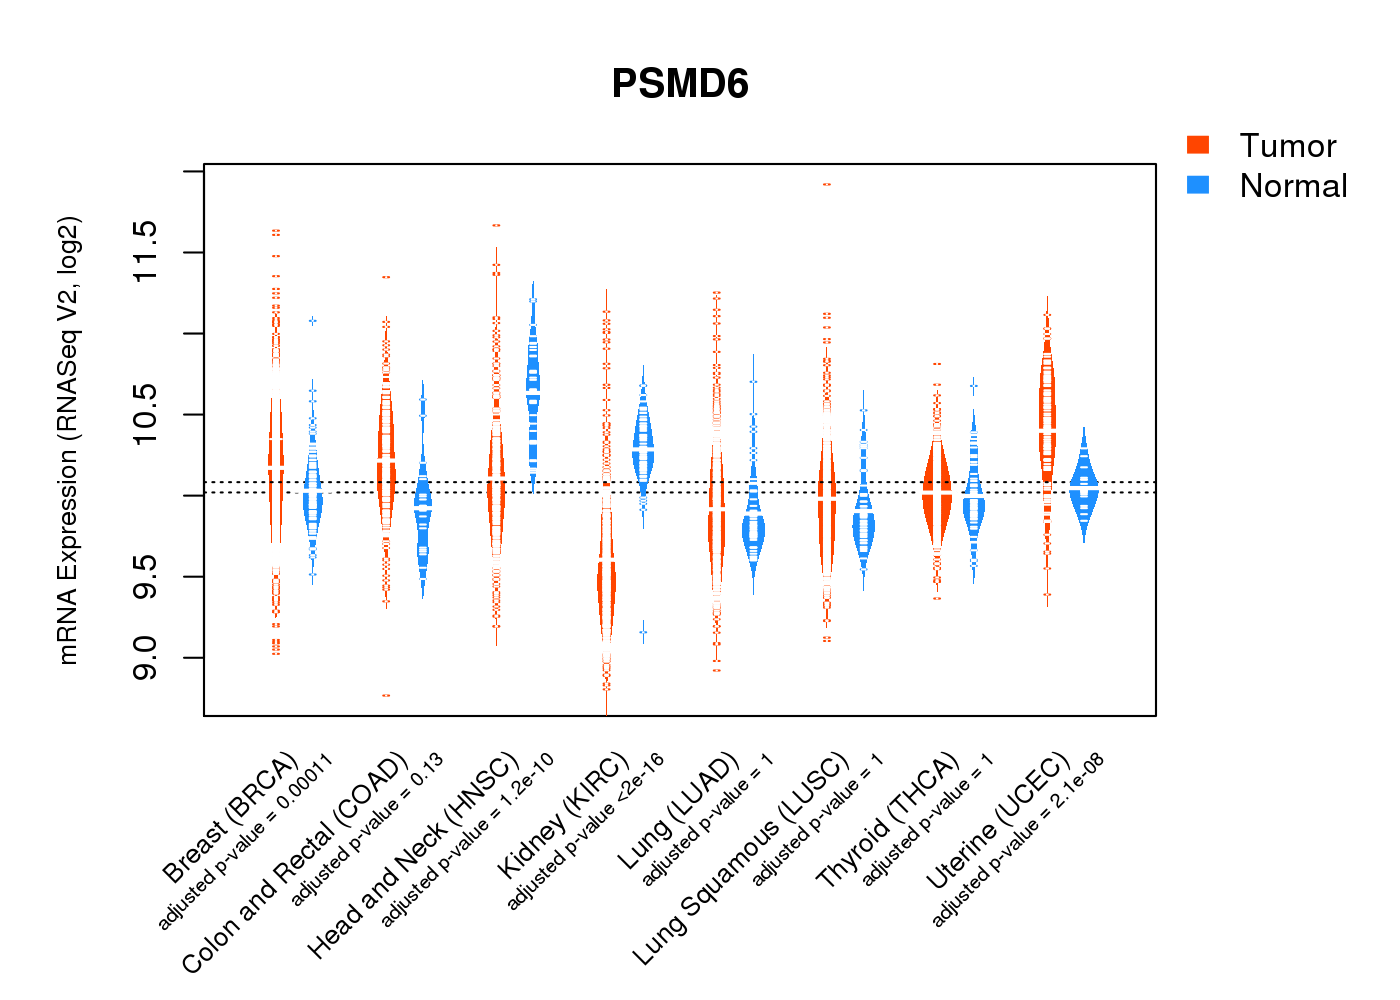
| Gene Expression for PSMD6 |
| * CCLE gene expression data were extracted from CCLE_Expression_Entrez_2012-10-18.res: Gene-centric RMA-normalized mRNA expression data. |
 |
| * Normalized gene expression data of RNASeqV2 was extracted from TCGA using R package TCGA-Assembler. The URLs of all public data files on TCGA DCC data server were gathered at Jan-05-2015. Only eight cancer types have enough normal control samples for differential expression analysis. (t test, adjusted p<0.05 (using Benjamini-Hochberg FDR)) |
 |
| Top |
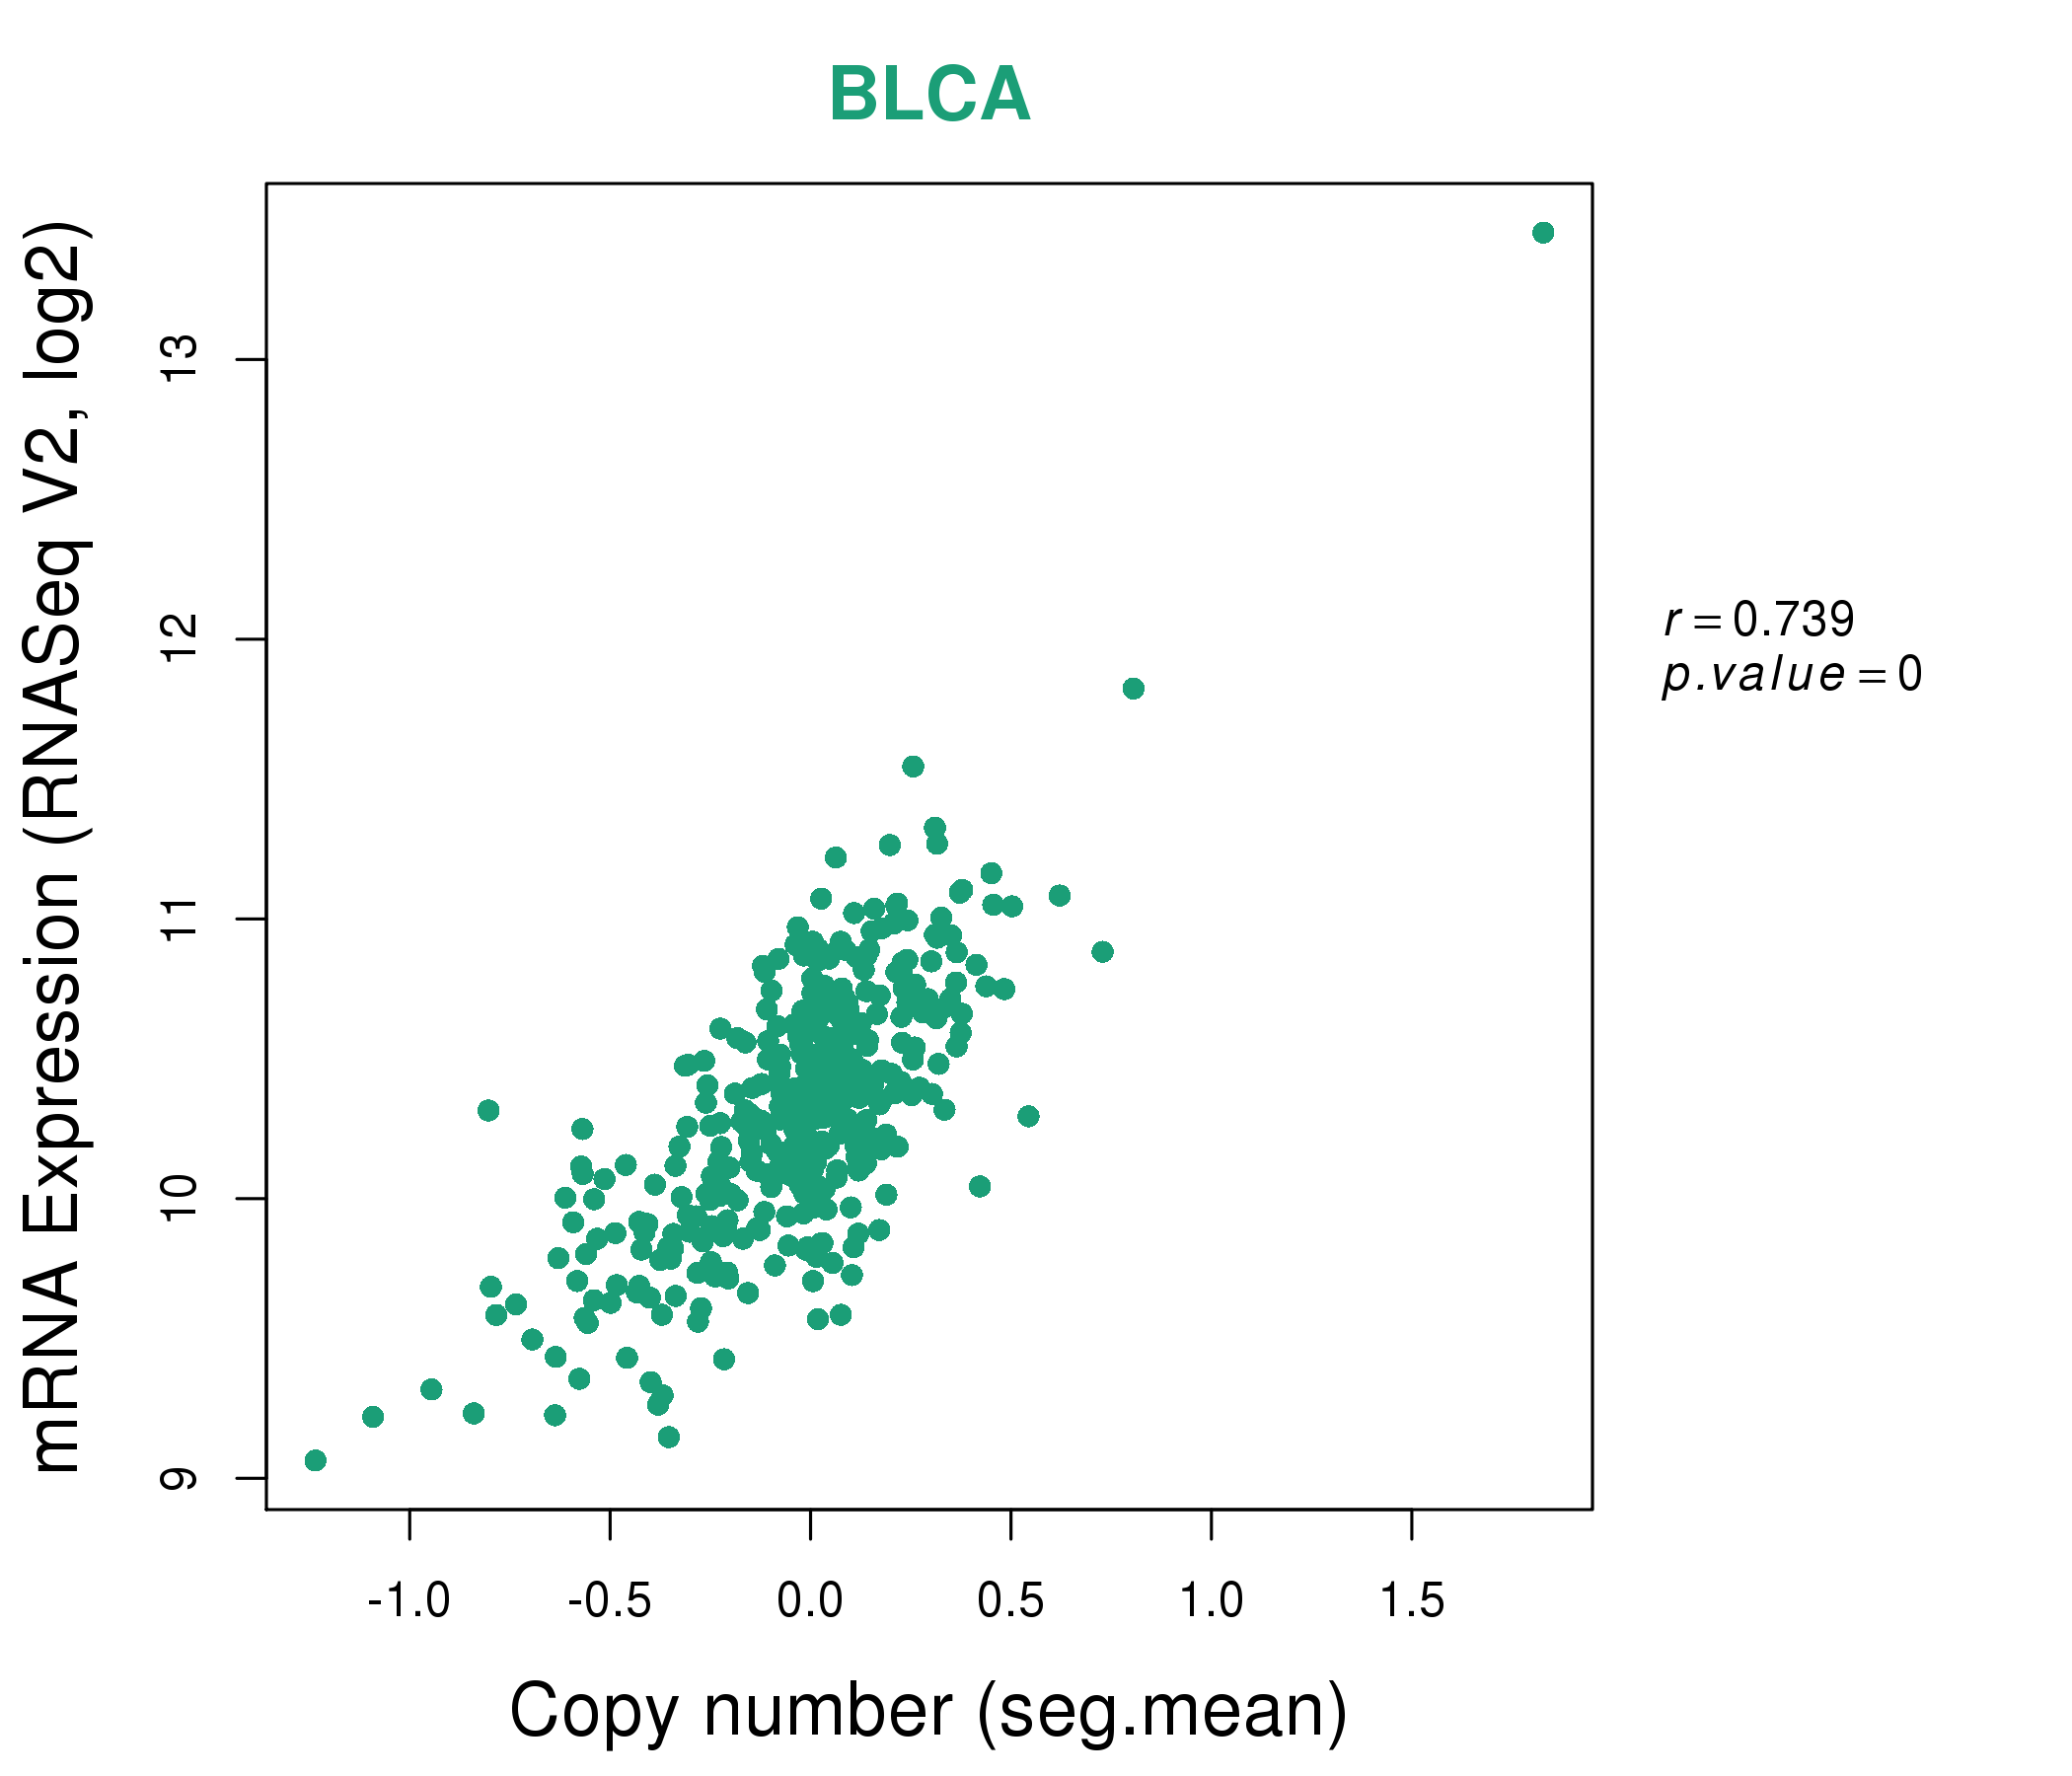
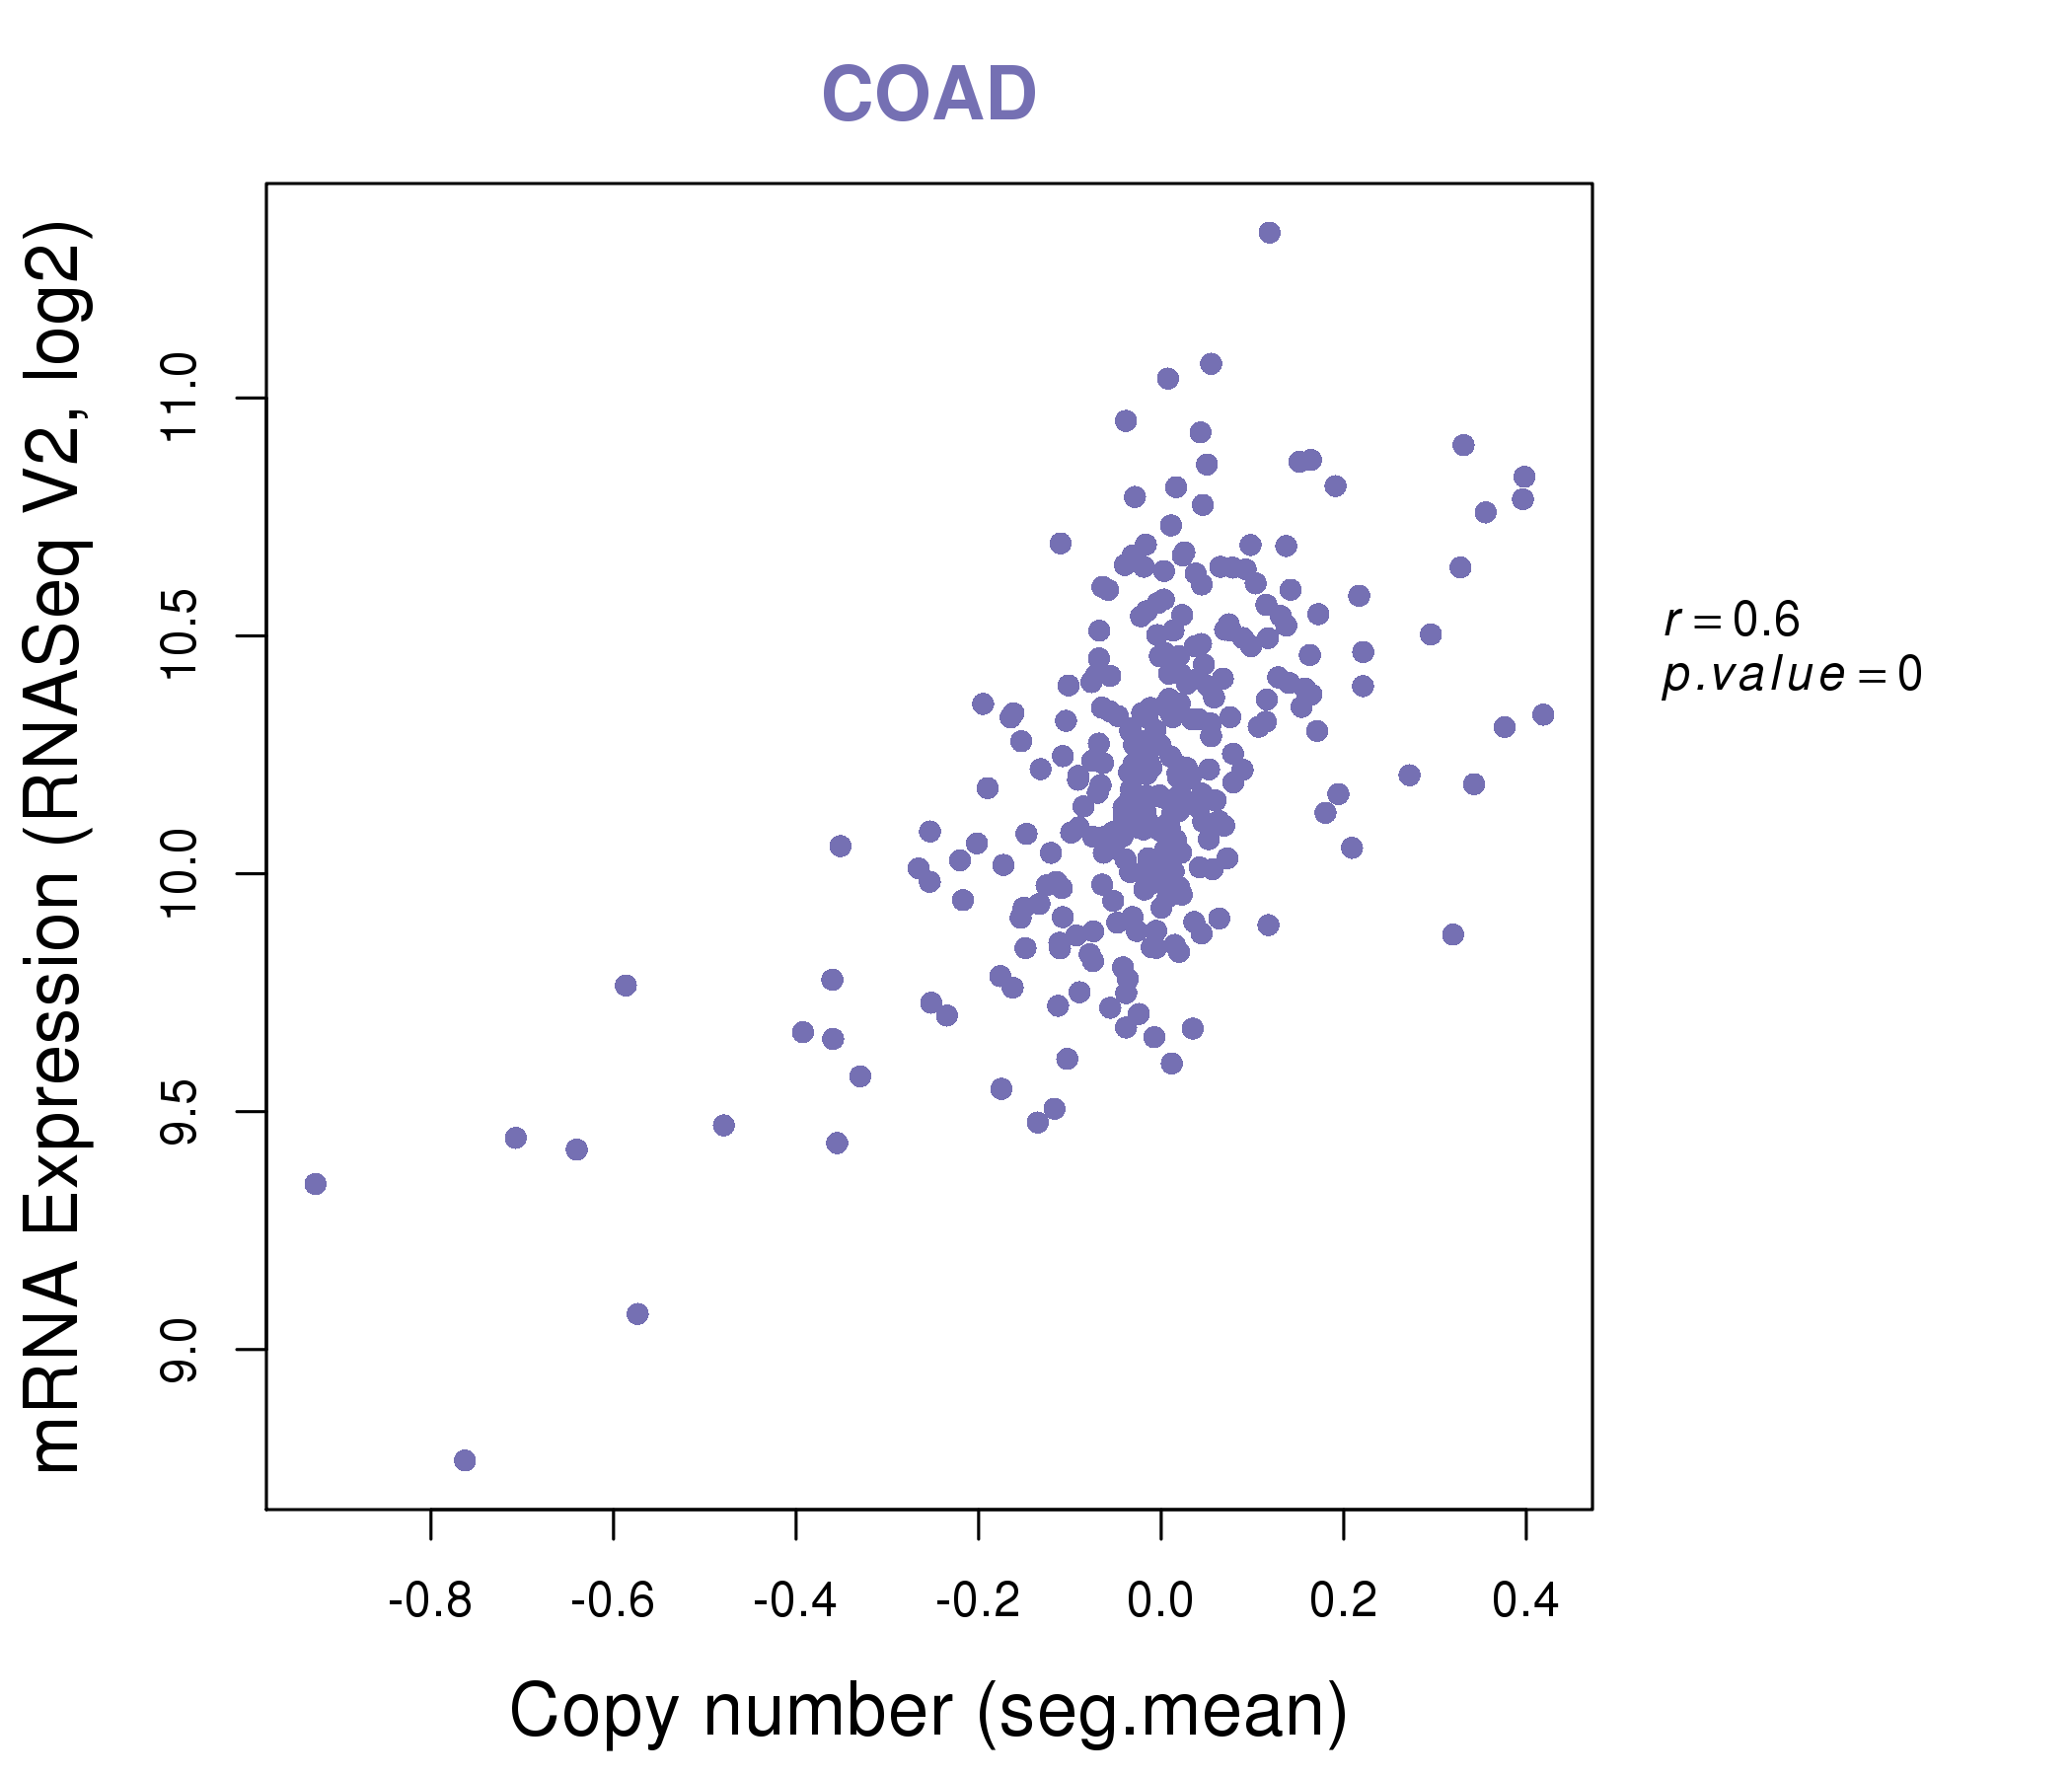
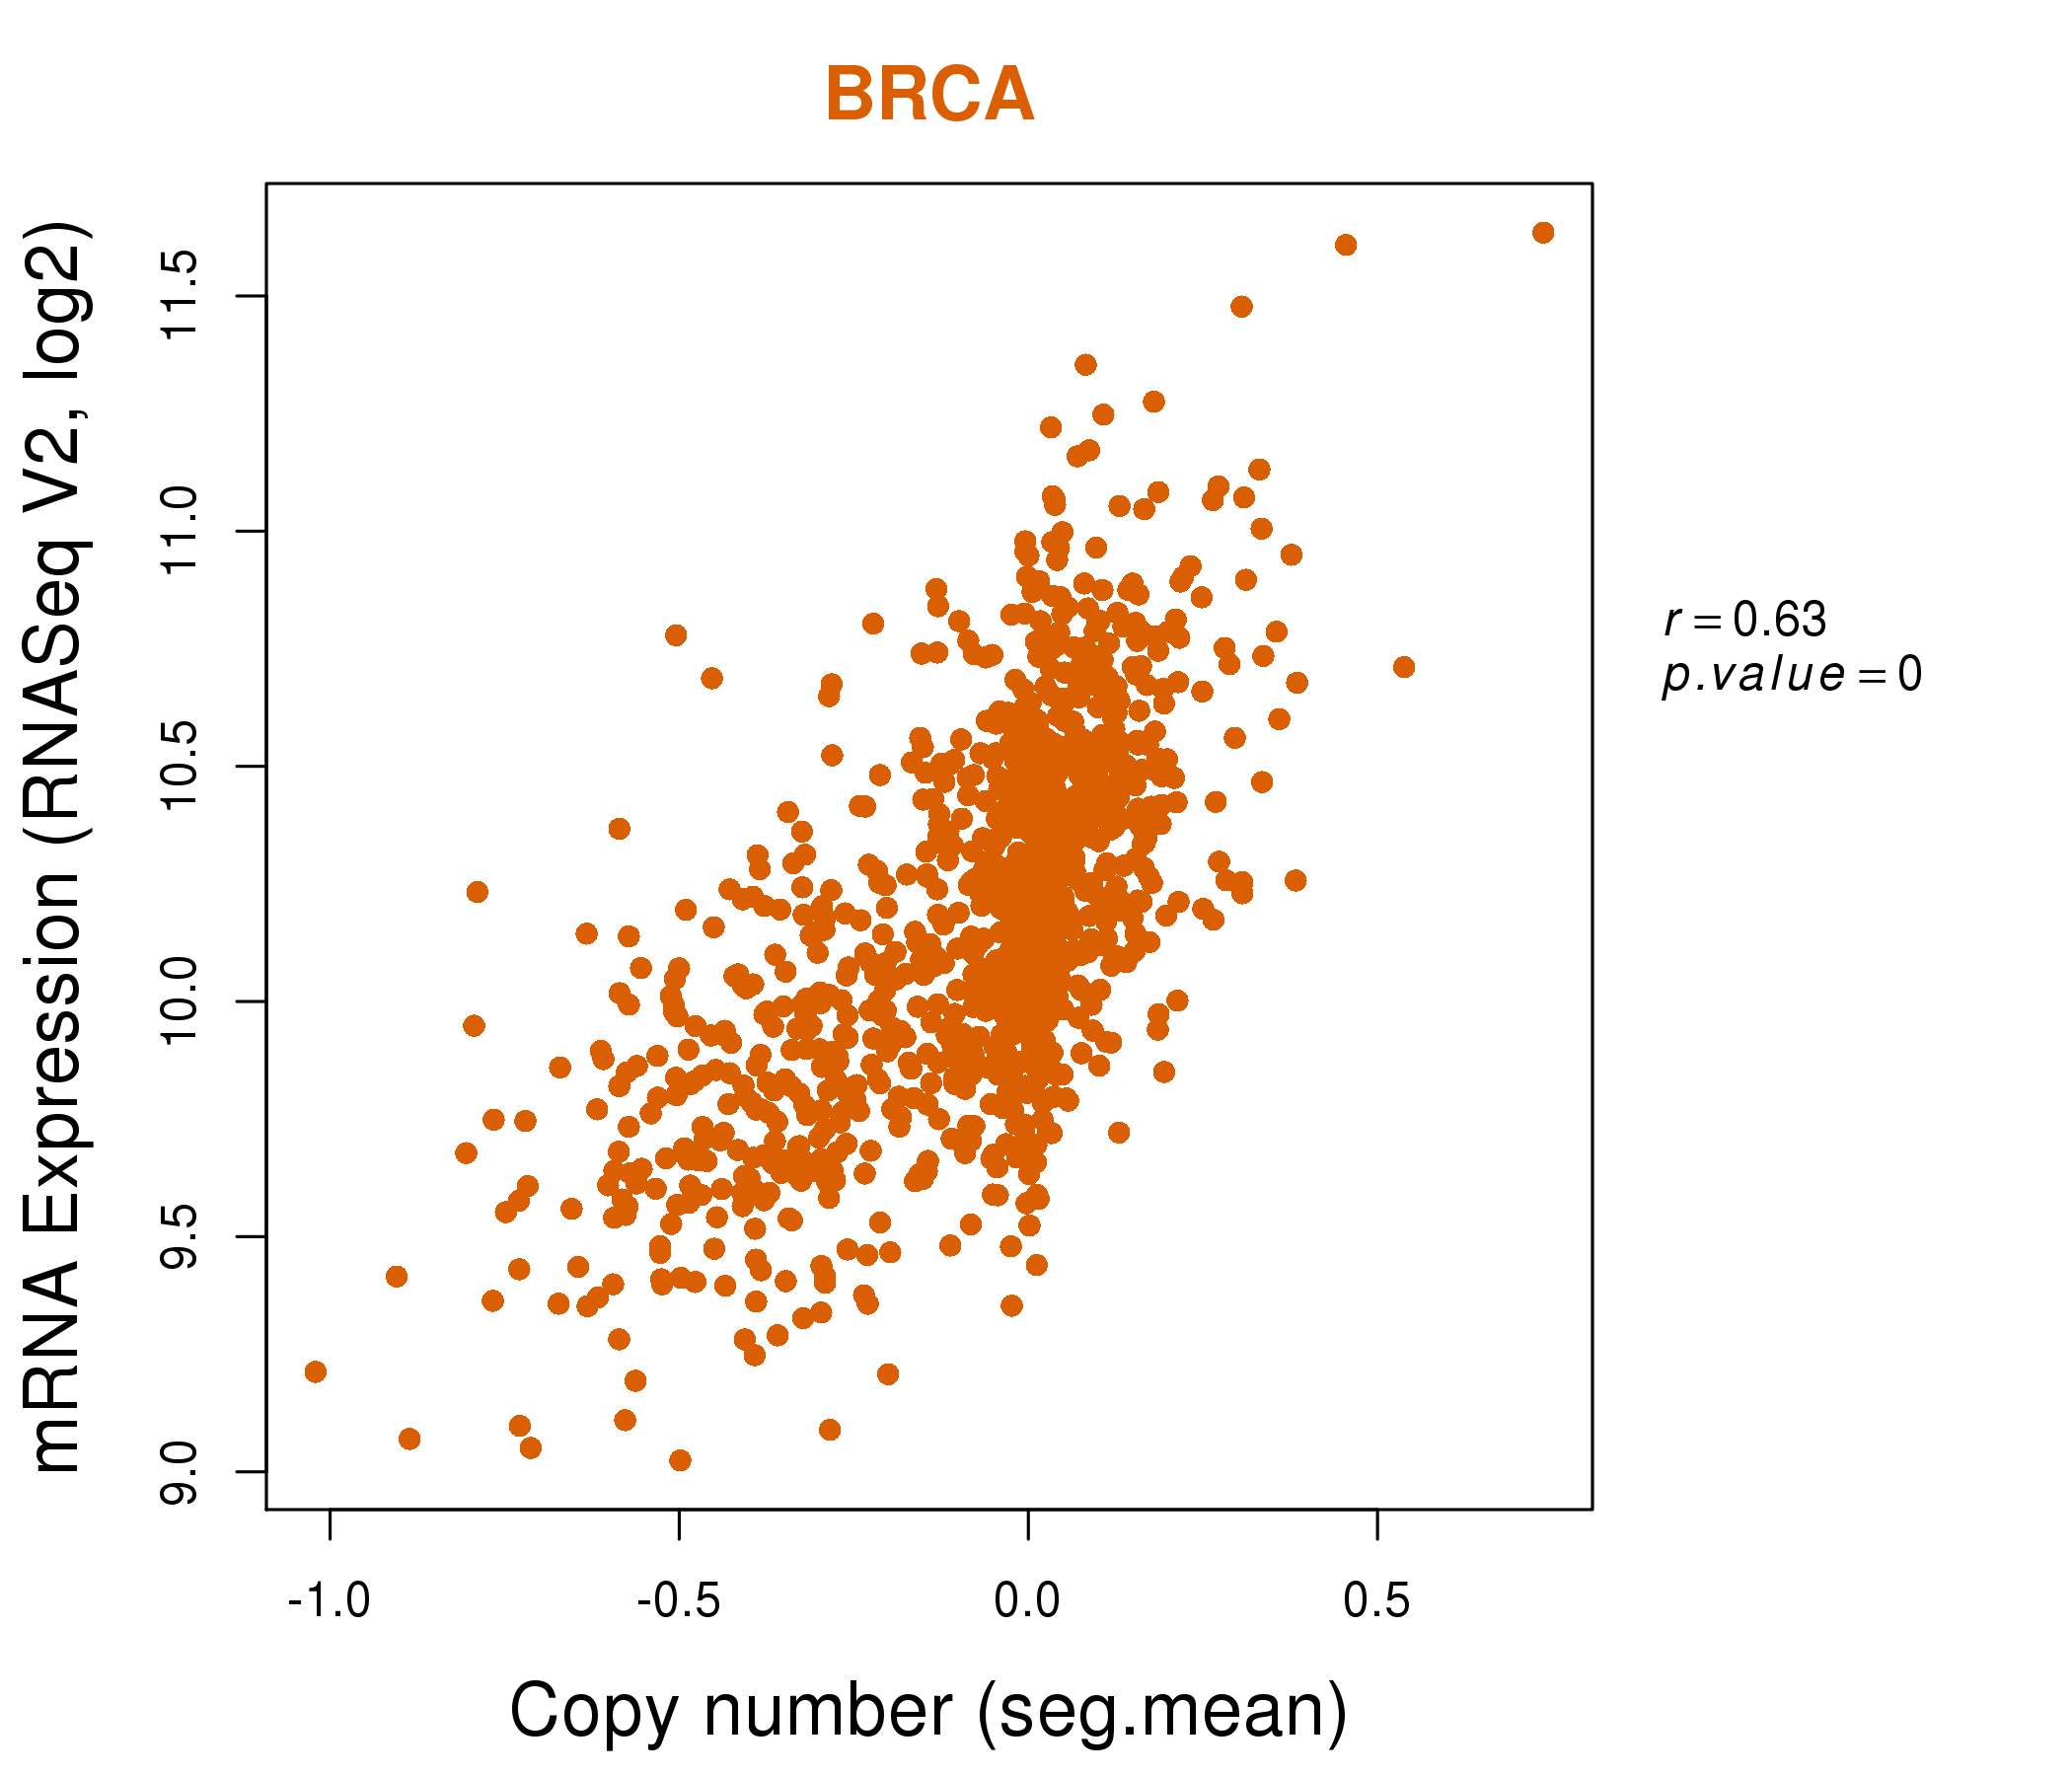
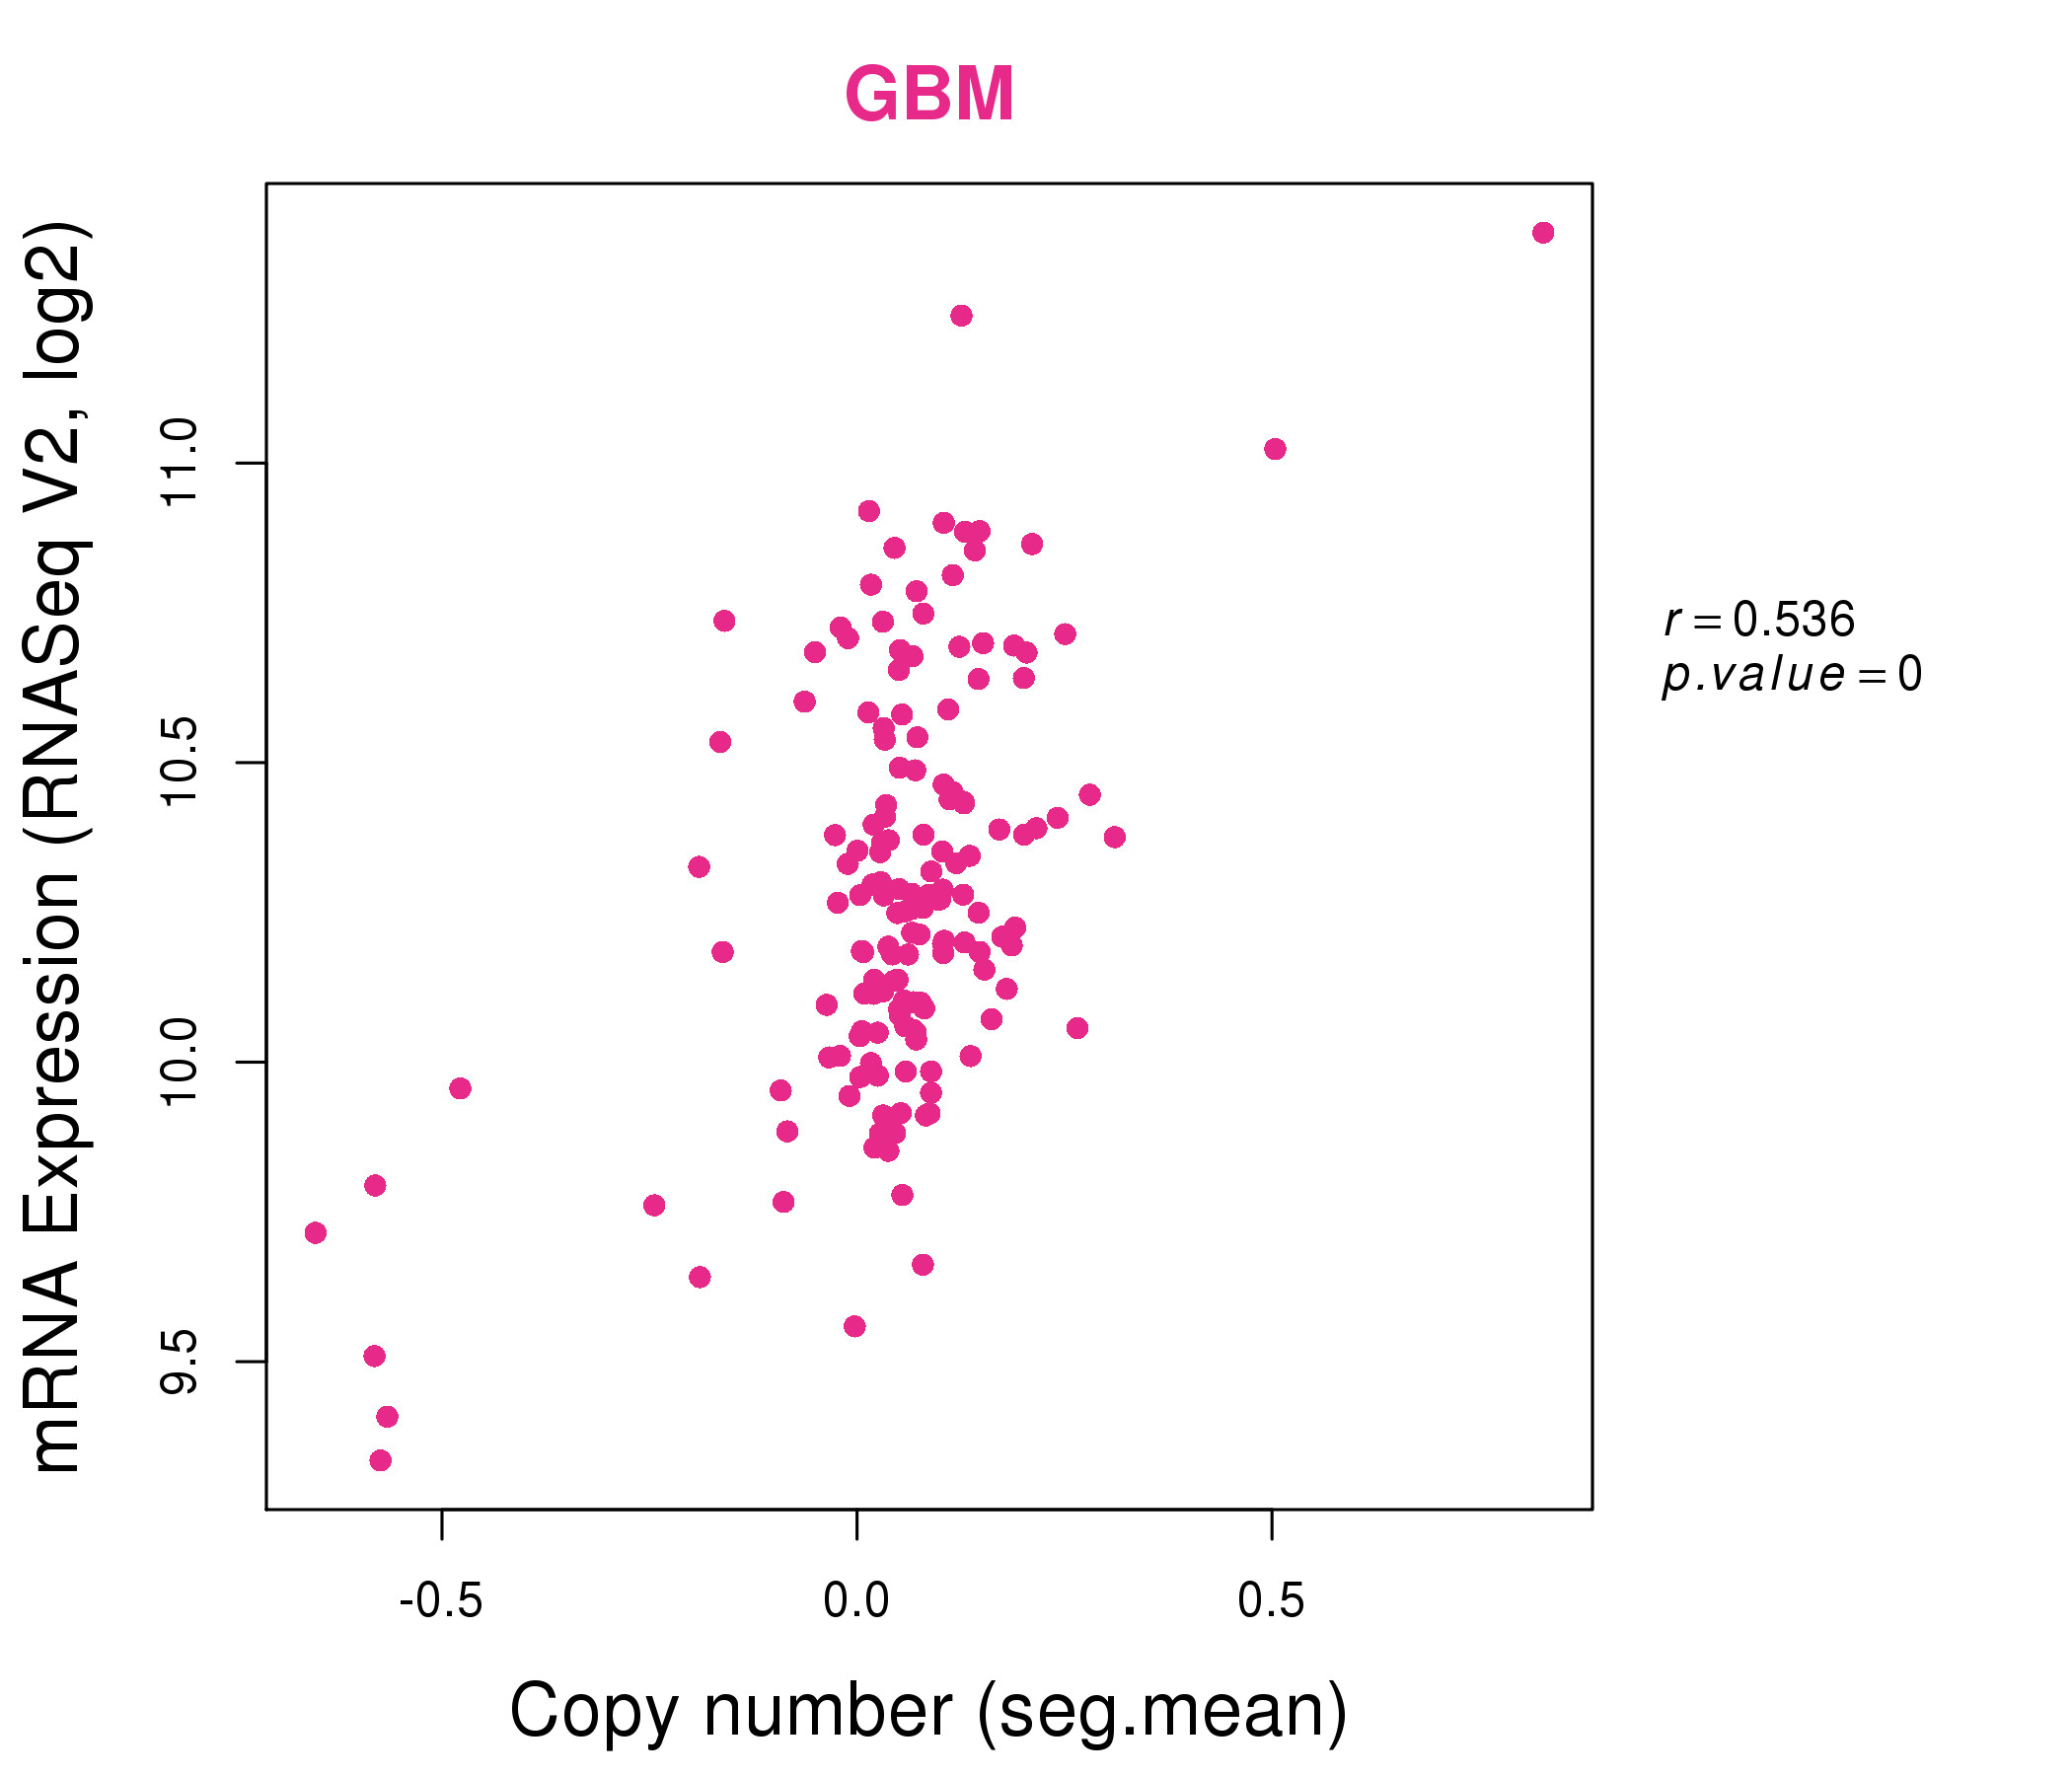
| * This plots show the correlation between CNV and gene expression. |
: Open all plots for all cancer types
 |
|
 |
|
| Top |
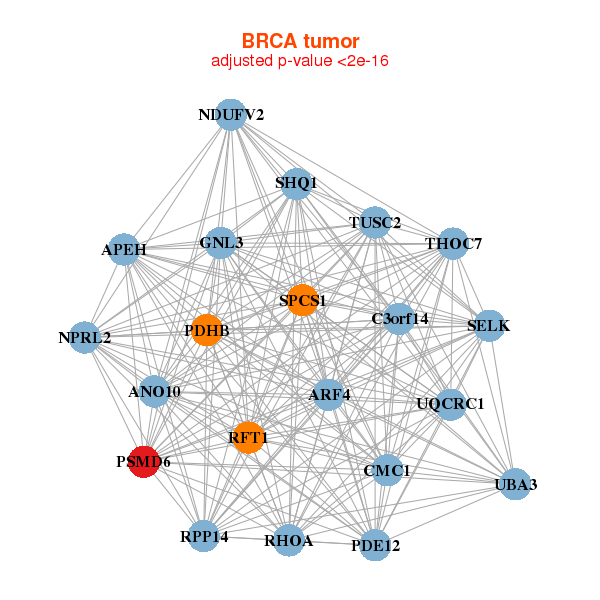
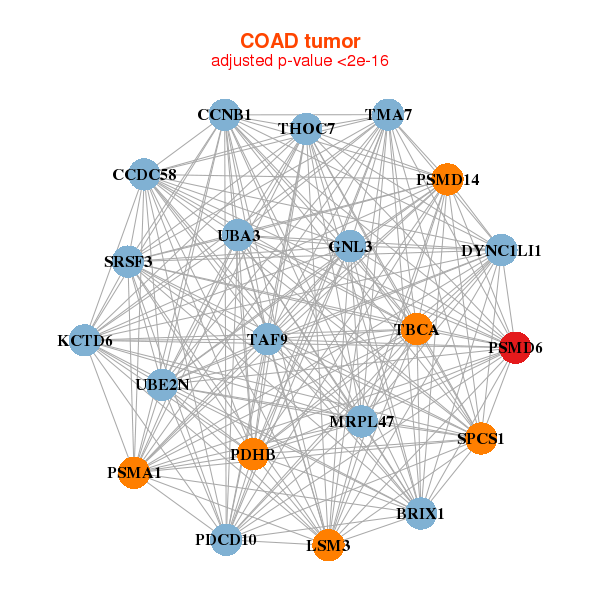
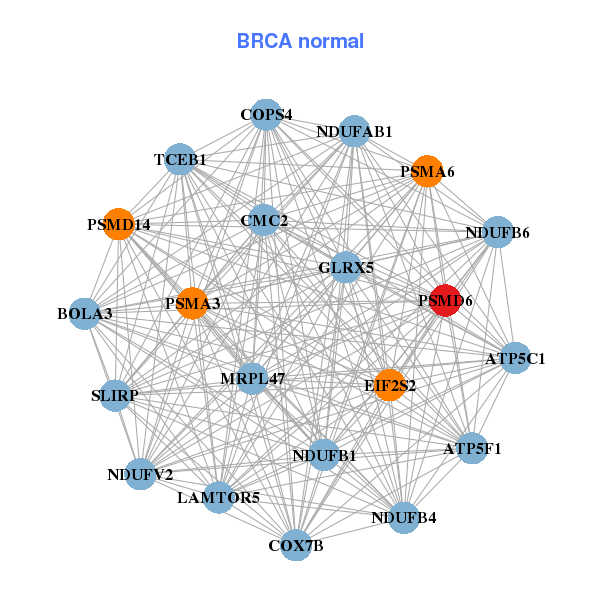
| Gene-Gene Network Information |
| * Co-Expression network figures were drawn using R package igraph. Only the top 20 genes with the highest correlations were shown. Red circle: input gene, orange circle: cell metabolism gene, sky circle: other gene |
: Open all plots for all cancer types
 |
|
| ANO10,APEH,ARF4,C3orf14,CMC1,GNL3,NDUFV2, NPRL2,PDE12,PDHB,PSMD6,RFT1,RHOA,RPP14, SELK,SHQ1,SPCS1,THOC7,TUSC2,UBA3,UQCRC1 | ATP5C1,ATP5F1,BOLA3,SLIRP,CMC2,COPS4,COX7B, EIF2S2,GLRX5,LAMTOR5,MRPL47,NDUFAB1,NDUFB1,NDUFB4, NDUFB6,NDUFV2,PSMA3,PSMA6,PSMD14,PSMD6,TCEB1 |
 |
|
| BRIX1,CCDC58,TMA7,CCNB1,DYNC1LI1,GNL3,KCTD6, LSM3,MRPL47,PDCD10,PDHB,PSMA1,PSMD14,PSMD6, SRSF3,SPCS1,TAF9,TBCA,THOC7,UBA3,UBE2N | MCMBP,COPS4,EIF2B3,EIF2S1,HAT1,MAGOHB,MORF4L2, MRPS10,PPIL1,PSMC2,PSMD14,PSMD6,PSMD7,RAN, SNRPB2,SSBP1,TCEB1,TIMM17A,TOMM5,UBE2N,VBP1 |
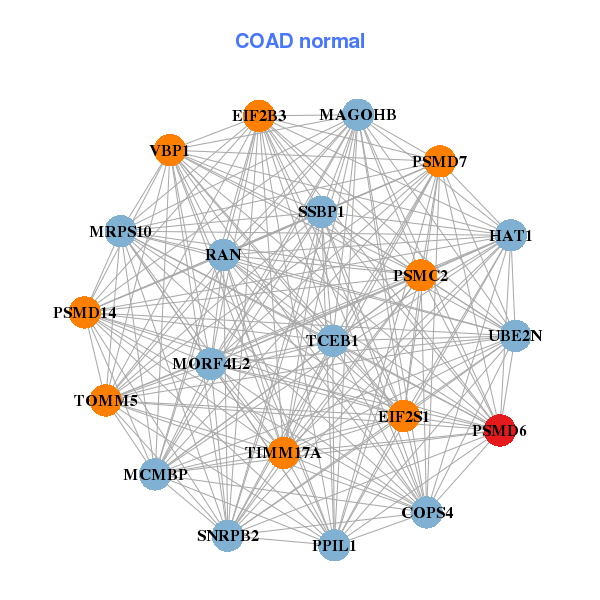
| * Co-Expression network figures were drawn using R package igraph. Only the top 20 genes with the highest correlations were shown. Red circle: input gene, orange circle: cell metabolism gene, sky circle: other gene |
: Open all plots for all cancer types
| Top |
: Open all interacting genes' information including KEGG pathway for all interacting genes from DAVID
| Top |
| Pharmacological Information for PSMD6 |
| There's no related Drug. |
| Top |
| Cross referenced IDs for PSMD6 |
| * We obtained these cross-references from Uniprot database. It covers 150 different DBs, 18 categories. http://www.uniprot.org/help/cross_references_section |
: Open all cross reference information
|
Copyright © 2016-Present - The Univsersity of Texas Health Science Center at Houston @ |