|
||||||||||||||||||||||||||||||||||||||||||||||||||||||||||||||||||||||||||||||||||||||||||||||||||||||||||||||||||||||||||||||||||||||||||||||||||||||||||||||||||||||||||||||||||||||||||||||||||||||||||||||||||||||||||||||||||||||||||||||||||||||||||||||||||||||||||||||||||||||||||||||||||||||||||||||||||||||||||
| |
| Phenotypic Information (metabolism pathway, cancer, disease, phenome) |
| |
| |
| Gene-Gene Network Information: Co-Expression Network, Interacting Genes & KEGG |
| |
|


| Gene Summary for POM121 |
| Basic gene info. | Gene symbol | POM121 |
| Gene name | POM121 transmembrane nucleoporin | |
| Synonyms | P145|POM121A | |
| Cytomap | UCSC genome browser: 7q11.23 | |
| Genomic location | chr7 :72361471-72418843 | |
| Type of gene | protein-coding | |
| RefGenes | NM_001257190.2, NM_172020.4, | |
| Ensembl id | ENSG00000262122 | |
| Description | POM121 membrane glycoproteinnuclear envelope pore membrane protein POM 121nuclear envelope pore membrane protein POM 121Anuclear pore membrane protein 121 kDanucleoporin Nup121 | |
| Modification date | 20141207 | |
| dbXrefs | MIM : 615753 | |
| HGNC : HGNC | ||
| Ensembl : ENSG00000196313 | ||
| HPRD : 11448 | ||
| Vega : OTTHUMG00000023527 | ||
| Protein | UniProt: Q96HA1 go to UniProt's Cross Reference DB Table | |
| Expression | CleanEX: HS_POM121 | |
| BioGPS: 9883 | ||
| Gene Expression Atlas: ENSG00000262122 | ||
| The Human Protein Atlas: ENSG00000262122 | ||
| Pathway | NCI Pathway Interaction Database: POM121 | |
| KEGG: POM121 | ||
| REACTOME: POM121 | ||
| ConsensusPathDB | ||
| Pathway Commons: POM121 | ||
| Metabolism | MetaCyc: POM121 | |
| HUMANCyc: POM121 | ||
| Regulation | Ensembl's Regulation: ENSG00000262122 | |
| miRBase: chr7 :72,361,471-72,418,843 | ||
| TargetScan: NM_001257190 | ||
| cisRED: ENSG00000262122 | ||
| Context | iHOP: POM121 | |
| cancer metabolism search in PubMed: POM121 | ||
| UCL Cancer Institute: POM121 | ||
| Assigned class in ccmGDB | B - This gene belongs to cancer gene. | |
| Top |
| Phenotypic Information for POM121(metabolism pathway, cancer, disease, phenome) |
| Cancer | CGAP: POM121 |
| Familial Cancer Database: POM121 | |
| * This gene is included in those cancer gene databases. |
|
|
|
|
|
| . | ||||||||||||||||||||||||||||||||||||||||||||||||||||||||||||||||||||||||||||||||||||||||||||||||||||||||||||||||||||||||||||||||||||||||||||||||||||||||||||||||||||||||||||||||||||||||||||||||||||||||||||||||||||||||||||||||||||||||||||||||||||||||||||||||||||||||||||||||||||||||||||||||||||||||||||||||||||
Oncogene 1 | Significant driver gene in | |||||||||||||||||||||||||||||||||||||||||||||||||||||||||||||||||||||||||||||||||||||||||||||||||||||||||||||||||||||||||||||||||||||||||||||||||||||||||||||||||||||||||||||||||||||||||||||||||||||||||||||||||||||||||||||||||||||||||||||||||||||||||||||||||||||||||||||||||||||||||||||||||||||||||||||||||||||||||
| cf) number; DB name 1 Oncogene; http://nar.oxfordjournals.org/content/35/suppl_1/D721.long, 2 Tumor Suppressor gene; https://bioinfo.uth.edu/TSGene/, 3 Cancer Gene Census; http://www.nature.com/nrc/journal/v4/n3/abs/nrc1299.html, 4 CancerGenes; http://nar.oxfordjournals.org/content/35/suppl_1/D721.long, 5 Network of Cancer Gene; http://ncg.kcl.ac.uk/index.php, 1Therapeutic Vulnerabilities in Cancer; http://cbio.mskcc.org/cancergenomics/statius/ |
| REACTOME_METABOLISM_OF_NON_CODING_RNA REACTOME_METABOLISM_OF_RNA REACTOME_METABOLISM_OF_CARBOHYDRATES | |
| OMIM | 615753; gene. 615753; gene. |
| Orphanet | |
| Disease | KEGG Disease: POM121 |
| MedGen: POM121 (Human Medical Genetics with Condition) | |
| ClinVar: POM121 | |
| Phenotype | MGI: POM121 (International Mouse Phenotyping Consortium) |
| PhenomicDB: POM121 | |
| Mutations for POM121 |
| * Under tables are showing count per each tissue to give us broad intuition about tissue specific mutation patterns.You can go to the detailed page for each mutation database's web site. |
| - Statistics for Tissue and Mutation type | Top |
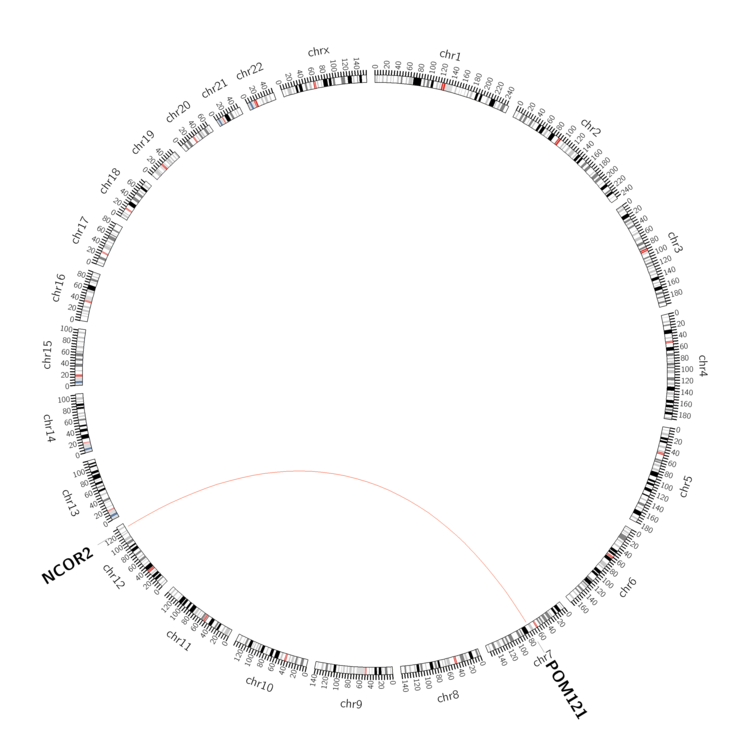 |
| - For Inter-chromosomal Variations |
| * Inter-chromosomal variantions includes 'interchromosomal amplicon to amplicon', 'interchromosomal amplicon to non-amplified dna', 'interchromosomal insertion', 'Interchromosomal unknown type'. |
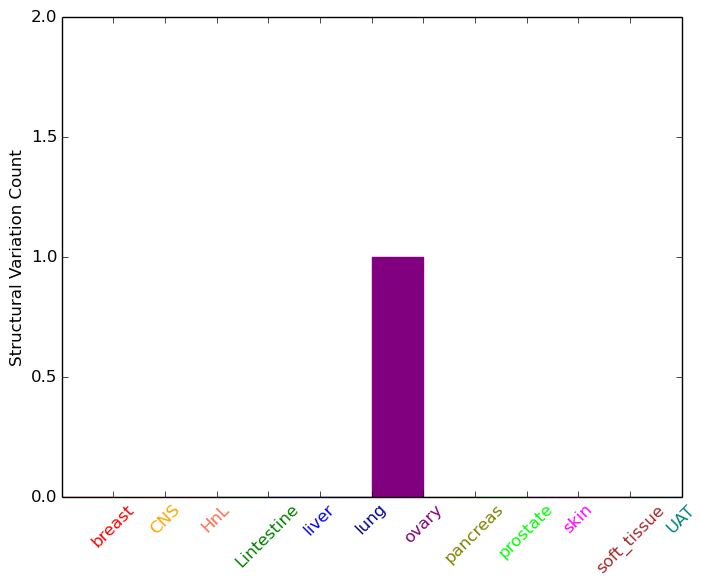 |
| - For Intra-chromosomal Variations |
| There's no intra-chromosomal structural variation. |
| Sample | Symbol_a | Chr_a | Start_a | End_a | Symbol_b | Chr_b | Start_b | End_b |
| ovary | POM121 | chr7 | 72393148 | 72393168 | NCOR2 | chr12 | 124842957 | 124842977 |
| cf) Tissue number; Tissue name (1;Breast, 2;Central_nervous_system, 3;Haematopoietic_and_lymphoid_tissue, 4;Large_intestine, 5;Liver, 6;Lung, 7;Ovary, 8;Pancreas, 9;Prostate, 10;Skin, 11;Soft_tissue, 12;Upper_aerodigestive_tract) |
| * From mRNA Sanger sequences, Chitars2.0 arranged chimeric transcripts. This table shows POM121 related fusion information. |
| ID | Head Gene | Tail Gene | Accession | Gene_a | qStart_a | qEnd_a | Chromosome_a | tStart_a | tEnd_a | Gene_a | qStart_a | qEnd_a | Chromosome_a | tStart_a | tEnd_a |
| BF528396 | TAPBPL | 1 | 454 | 12 | 6574056 | 6579811 | POM121 | 455 | 790 | 7 | 72419941 | 72420735 | |
| BM715257 | POM121 | 1 | 358 | 7 | 72383860 | 72384217 | POM121 | 358 | 611 | 7 | 72385037 | 72385290 | |
| Top |
| Mutation type/ Tissue ID | brca | cns | cerv | endome | haematopo | kidn | Lintest | liver | lung | ns | ovary | pancre | prost | skin | stoma | thyro | urina | |||
| Total # sample | 1 | |||||||||||||||||||
| GAIN (# sample) | 1 | |||||||||||||||||||
| LOSS (# sample) |
| cf) Tissue ID; Tissue type (1; Breast, 2; Central_nervous_system, 3; Cervix, 4; Endometrium, 5; Haematopoietic_and_lymphoid_tissue, 6; Kidney, 7; Large_intestine, 8; Liver, 9; Lung, 10; NS, 11; Ovary, 12; Pancreas, 13; Prostate, 14; Skin, 15; Stomach, 16; Thyroid, 17; Urinary_tract) |
| Top |
|
 |
| Top |
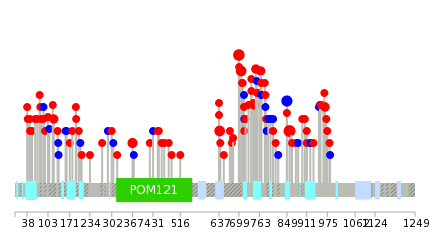
| Stat. for Non-Synonymous SNVs (# total SNVs=58) | (# total SNVs=20) |
 |  |
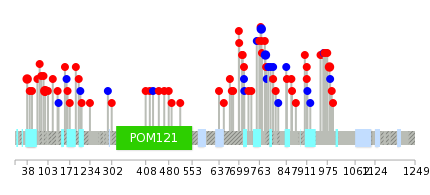
(# total SNVs=1) | (# total SNVs=3) |
 |  |
| Top |
| * When you move the cursor on each content, you can see more deailed mutation information on the Tooltip. Those are primary_site,primary_histology,mutation(aa),pubmedID. |
| GRCh37 position | Mutation(aa) | Unique sampleID count |
| chr7:72413896-72413896 | p.T857A | 7 |
| chr7:72413423-72413423 | p.P699L | 6 |
| chr7:72413874-72413874 | p.N849N | 5 |
| chr7:72413443-72413443 | p.A706T | 4 |
| chr7:72413243-72413243 | p.H639P | 4 |
| chr7:72412427-72412427 | p.S367N | 3 |
| chr7:72416721-72416721 | p.P968Q | 2 |
| chr7:72413539-72413539 | p.P738T | 2 |
| chr7:72413673-72413673 | p.F782L | 2 |
| chr7:72400531-72400531 | p.N121S | 2 |
| Top |
|
 |
| Point Mutation/ Tissue ID | 1 | 2 | 3 | 4 | 5 | 6 | 7 | 8 | 9 | 10 | 11 | 12 | 13 | 14 | 15 | 16 | 17 | 18 | 19 | 20 |
| # sample | 4 | 3 | 2 | 8 | 3 | 4 | 2 | 2 | 3 | 6 | 2 | 1 | 11 | 9 | 1 | 16 | ||||
| # mutation | 4 | 3 | 2 | 7 | 3 | 4 | 2 | 2 | 3 | 6 | 2 | 1 | 14 | 10 | 1 | 20 | ||||
| nonsynonymous SNV | 3 | 3 | 1 | 6 | 2 | 1 | 2 | 1 | 3 | 4 | 2 | 1 | 12 | 8 | 1 | 13 | ||||
| synonymous SNV | 1 | 1 | 1 | 1 | 3 | 1 | 2 | 2 | 2 | 7 |
| cf) Tissue ID; Tissue type (1; BLCA[Bladder Urothelial Carcinoma], 2; BRCA[Breast invasive carcinoma], 3; CESC[Cervical squamous cell carcinoma and endocervical adenocarcinoma], 4; COAD[Colon adenocarcinoma], 5; GBM[Glioblastoma multiforme], 6; Glioma Low Grade, 7; HNSC[Head and Neck squamous cell carcinoma], 8; KICH[Kidney Chromophobe], 9; KIRC[Kidney renal clear cell carcinoma], 10; KIRP[Kidney renal papillary cell carcinoma], 11; LAML[Acute Myeloid Leukemia], 12; LUAD[Lung adenocarcinoma], 13; LUSC[Lung squamous cell carcinoma], 14; OV[Ovarian serous cystadenocarcinoma ], 15; PAAD[Pancreatic adenocarcinoma], 16; PRAD[Prostate adenocarcinoma], 17; SKCM[Skin Cutaneous Melanoma], 18:STAD[Stomach adenocarcinoma], 19:THCA[Thyroid carcinoma], 20:UCEC[Uterine Corpus Endometrial Carcinoma]) |
| Top |
| * We represented just top 10 SNVs. When you move the cursor on each content, you can see more deailed mutation information on the Tooltip. Those are primary_site, primary_histology, mutation(aa), pubmedID. |
| Genomic Position | Mutation(aa) | Unique sampleID count |
| chr7:72398976 | p.N94S,POM121 | 3 |
| chr7:72413634 | p.R982H | 2 |
| chr7:72413673 | p.A38T,POM121 | 2 |
| chr7:72397386 | p.T769T,POM121 | 2 |
| chr7:72416763 | p.F782F,POM121 | 2 |
| chr7:72413721 | p.G700R,POM121 | 1 |
| chr7:72412589 | p.A784T,POM121 | 1 |
| chr7:72414058 | p.T913T,POM121 | 1 |
| chr7:72397482 | p.G82D,POM121 | 1 |
| chr7:72413369 | p.S290S,POM121 | 1 |
| * Copy number data were extracted from TCGA using R package TCGA-Assembler. The URLs of all public data files on TCGA DCC data server were gathered on Jan-05-2015. Function ProcessCNAData in TCGA-Assembler package was used to obtain gene-level copy number value which is calculated as the average copy number of the genomic region of a gene. |
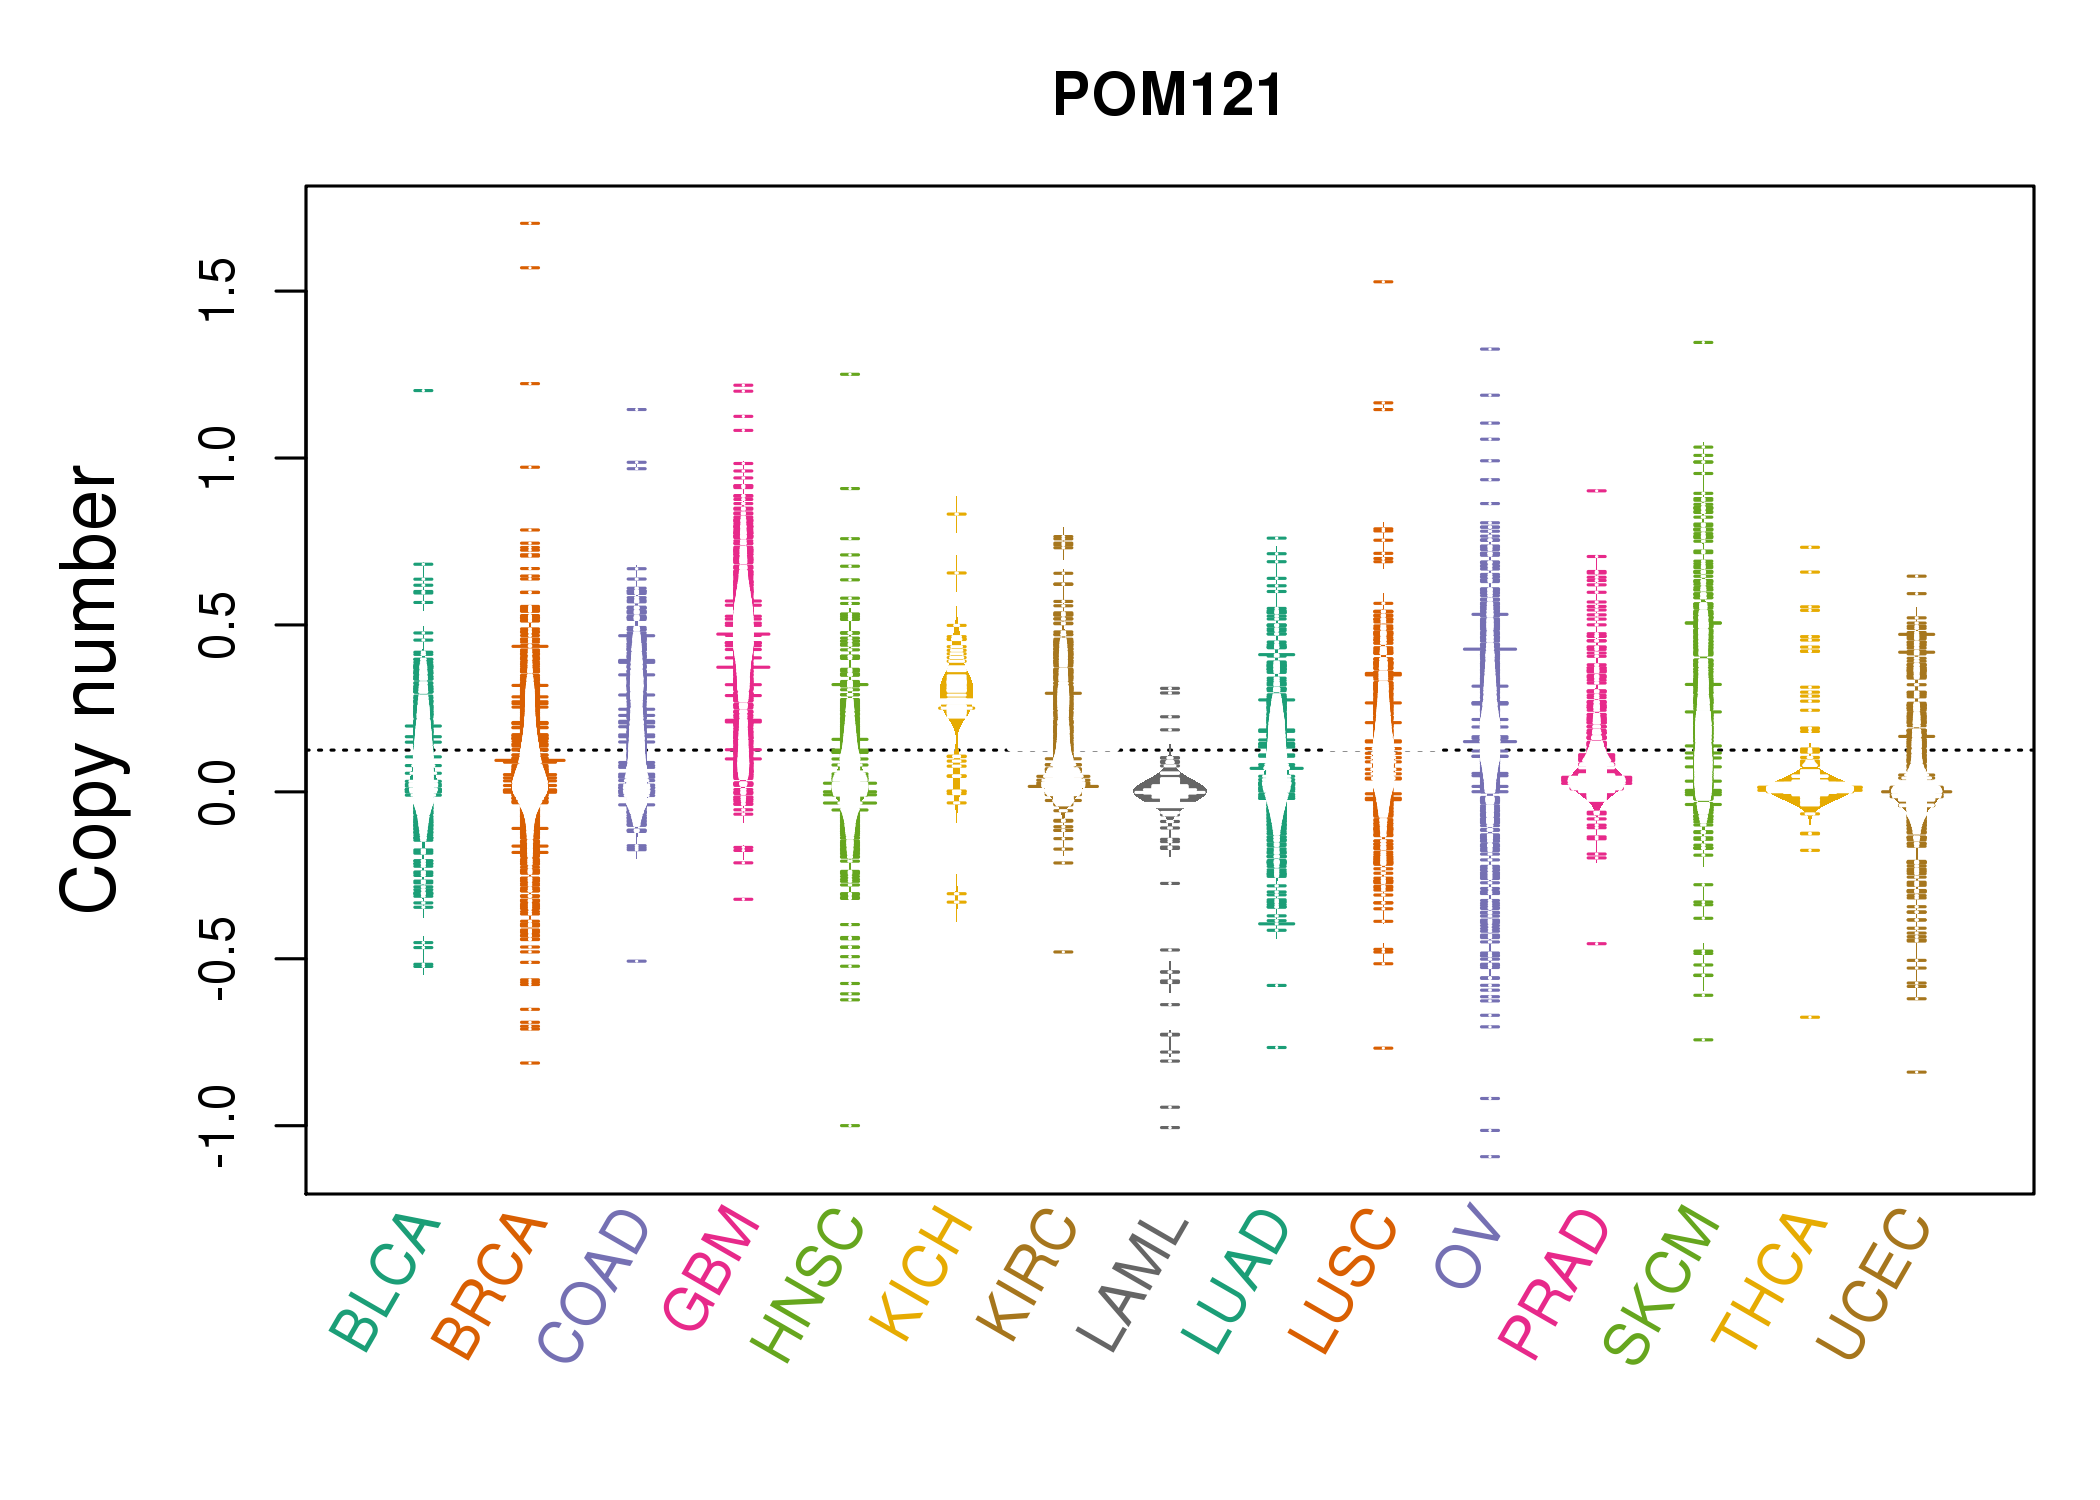 |
| cf) Tissue ID[Tissue type]: BLCA[Bladder Urothelial Carcinoma], BRCA[Breast invasive carcinoma], CESC[Cervical squamous cell carcinoma and endocervical adenocarcinoma], COAD[Colon adenocarcinoma], GBM[Glioblastoma multiforme], Glioma Low Grade, HNSC[Head and Neck squamous cell carcinoma], KICH[Kidney Chromophobe], KIRC[Kidney renal clear cell carcinoma], KIRP[Kidney renal papillary cell carcinoma], LAML[Acute Myeloid Leukemia], LUAD[Lung adenocarcinoma], LUSC[Lung squamous cell carcinoma], OV[Ovarian serous cystadenocarcinoma ], PAAD[Pancreatic adenocarcinoma], PRAD[Prostate adenocarcinoma], SKCM[Skin Cutaneous Melanoma], STAD[Stomach adenocarcinoma], THCA[Thyroid carcinoma], UCEC[Uterine Corpus Endometrial Carcinoma] |
| Top |
| Gene Expression for POM121 |
| * CCLE gene expression data were extracted from CCLE_Expression_Entrez_2012-10-18.res: Gene-centric RMA-normalized mRNA expression data. |
 |
| * Normalized gene expression data of RNASeqV2 was extracted from TCGA using R package TCGA-Assembler. The URLs of all public data files on TCGA DCC data server were gathered at Jan-05-2015. Only eight cancer types have enough normal control samples for differential expression analysis. (t test, adjusted p<0.05 (using Benjamini-Hochberg FDR)) |
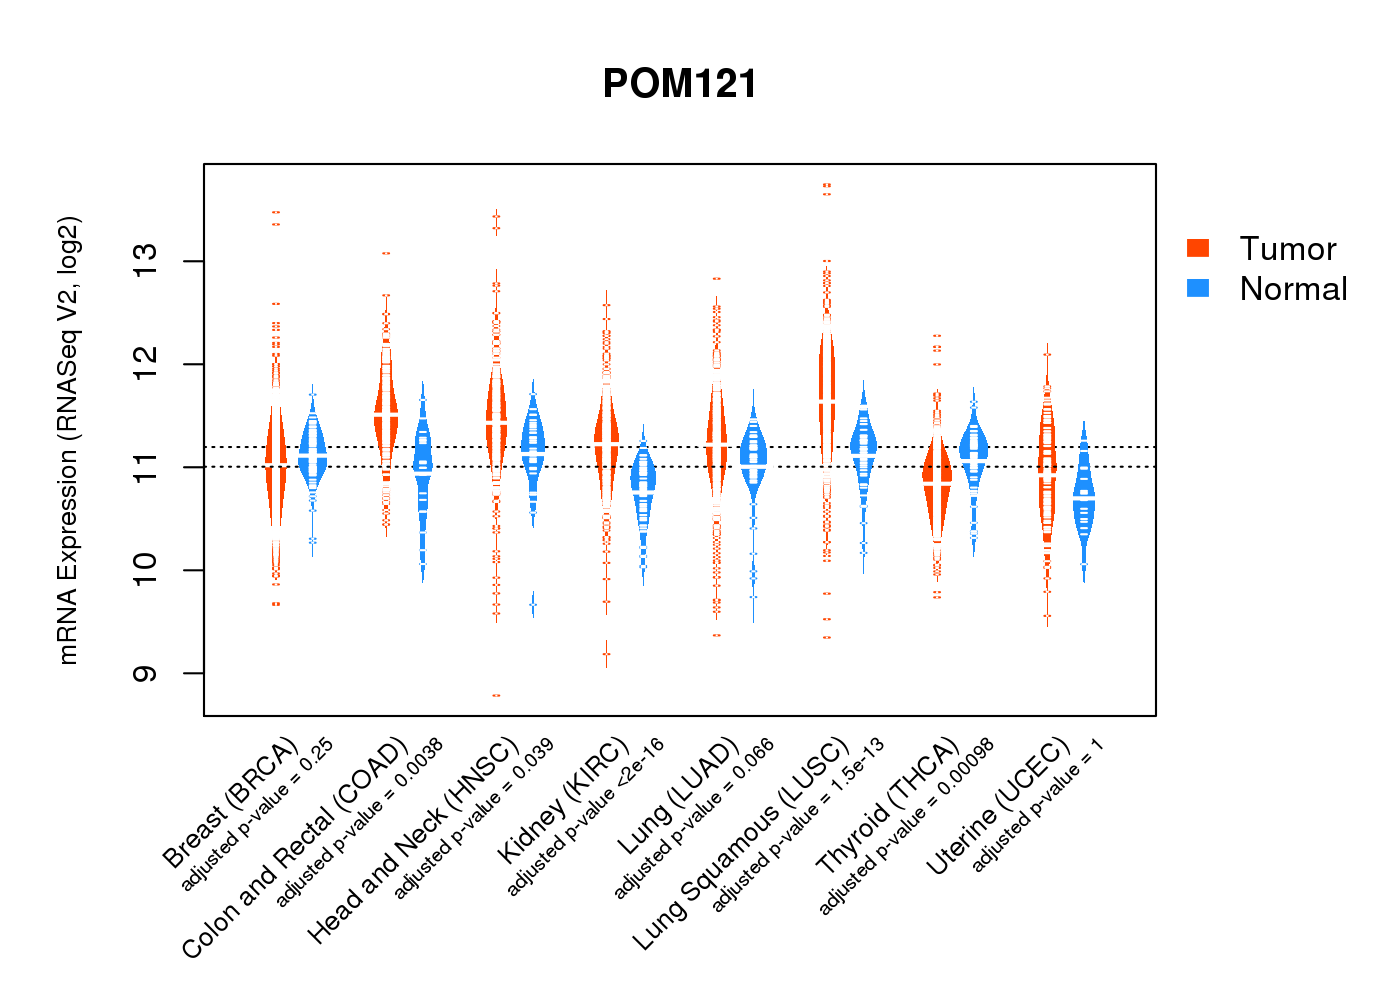 |
| Top |
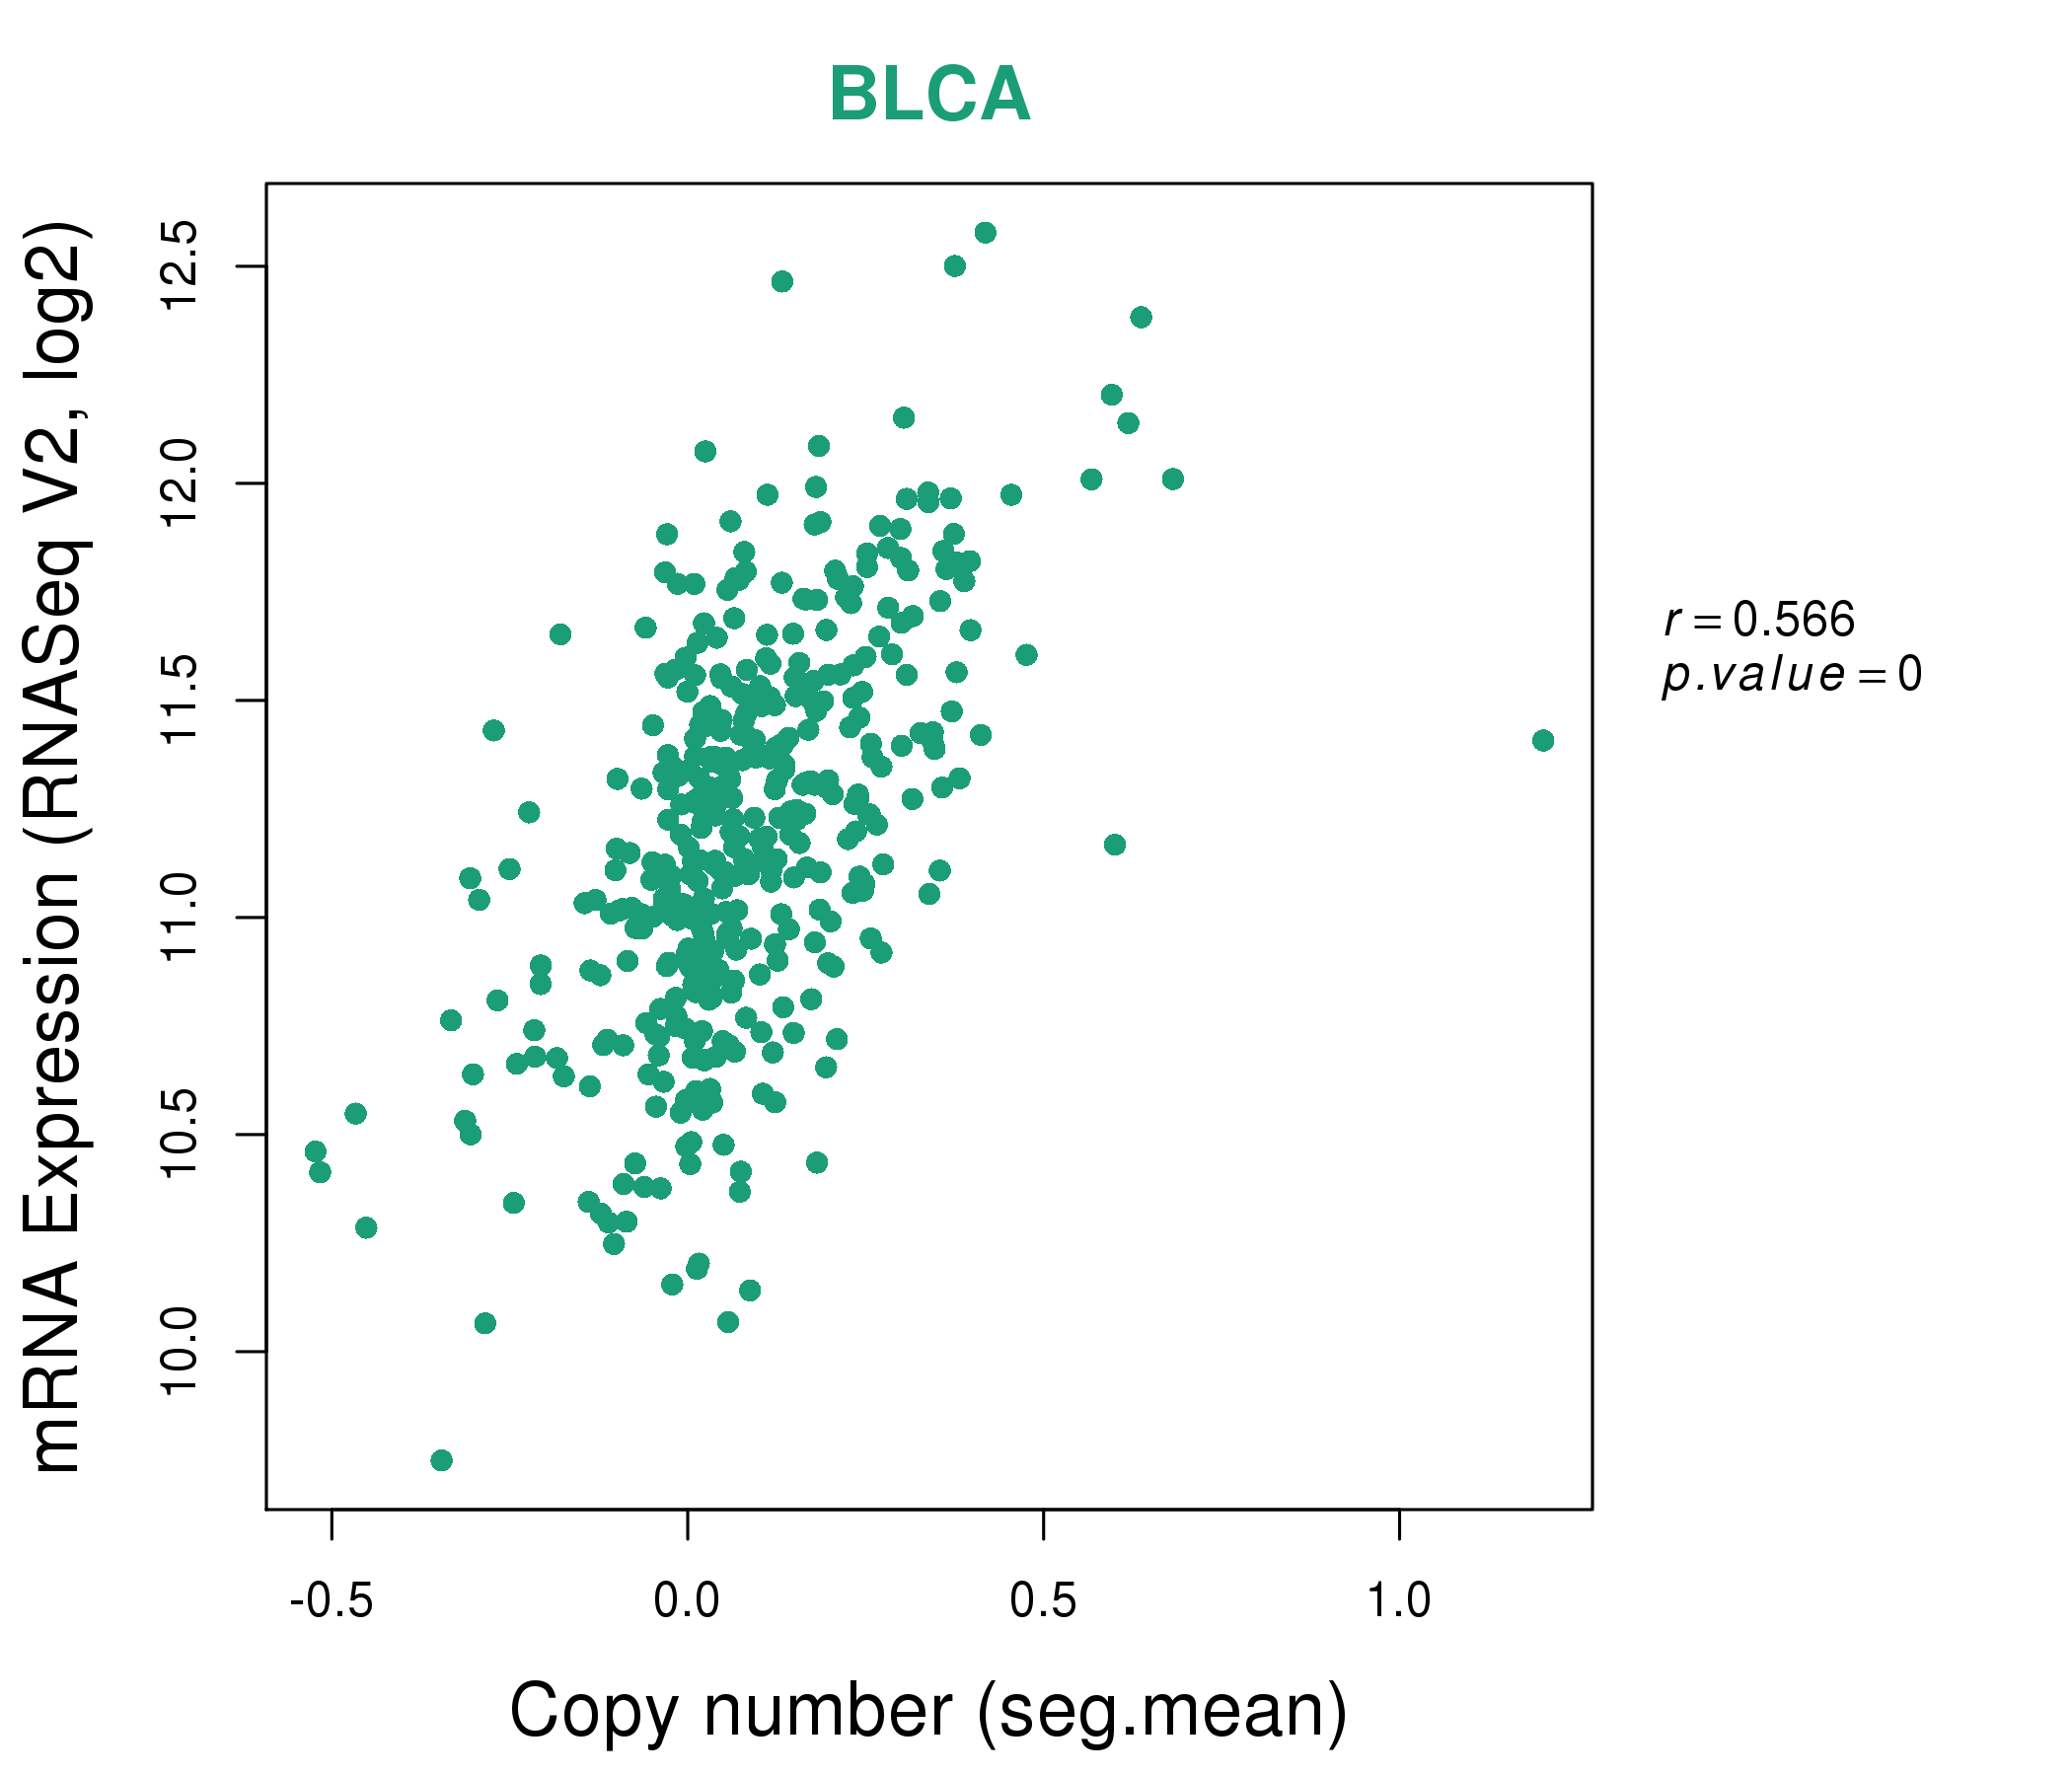
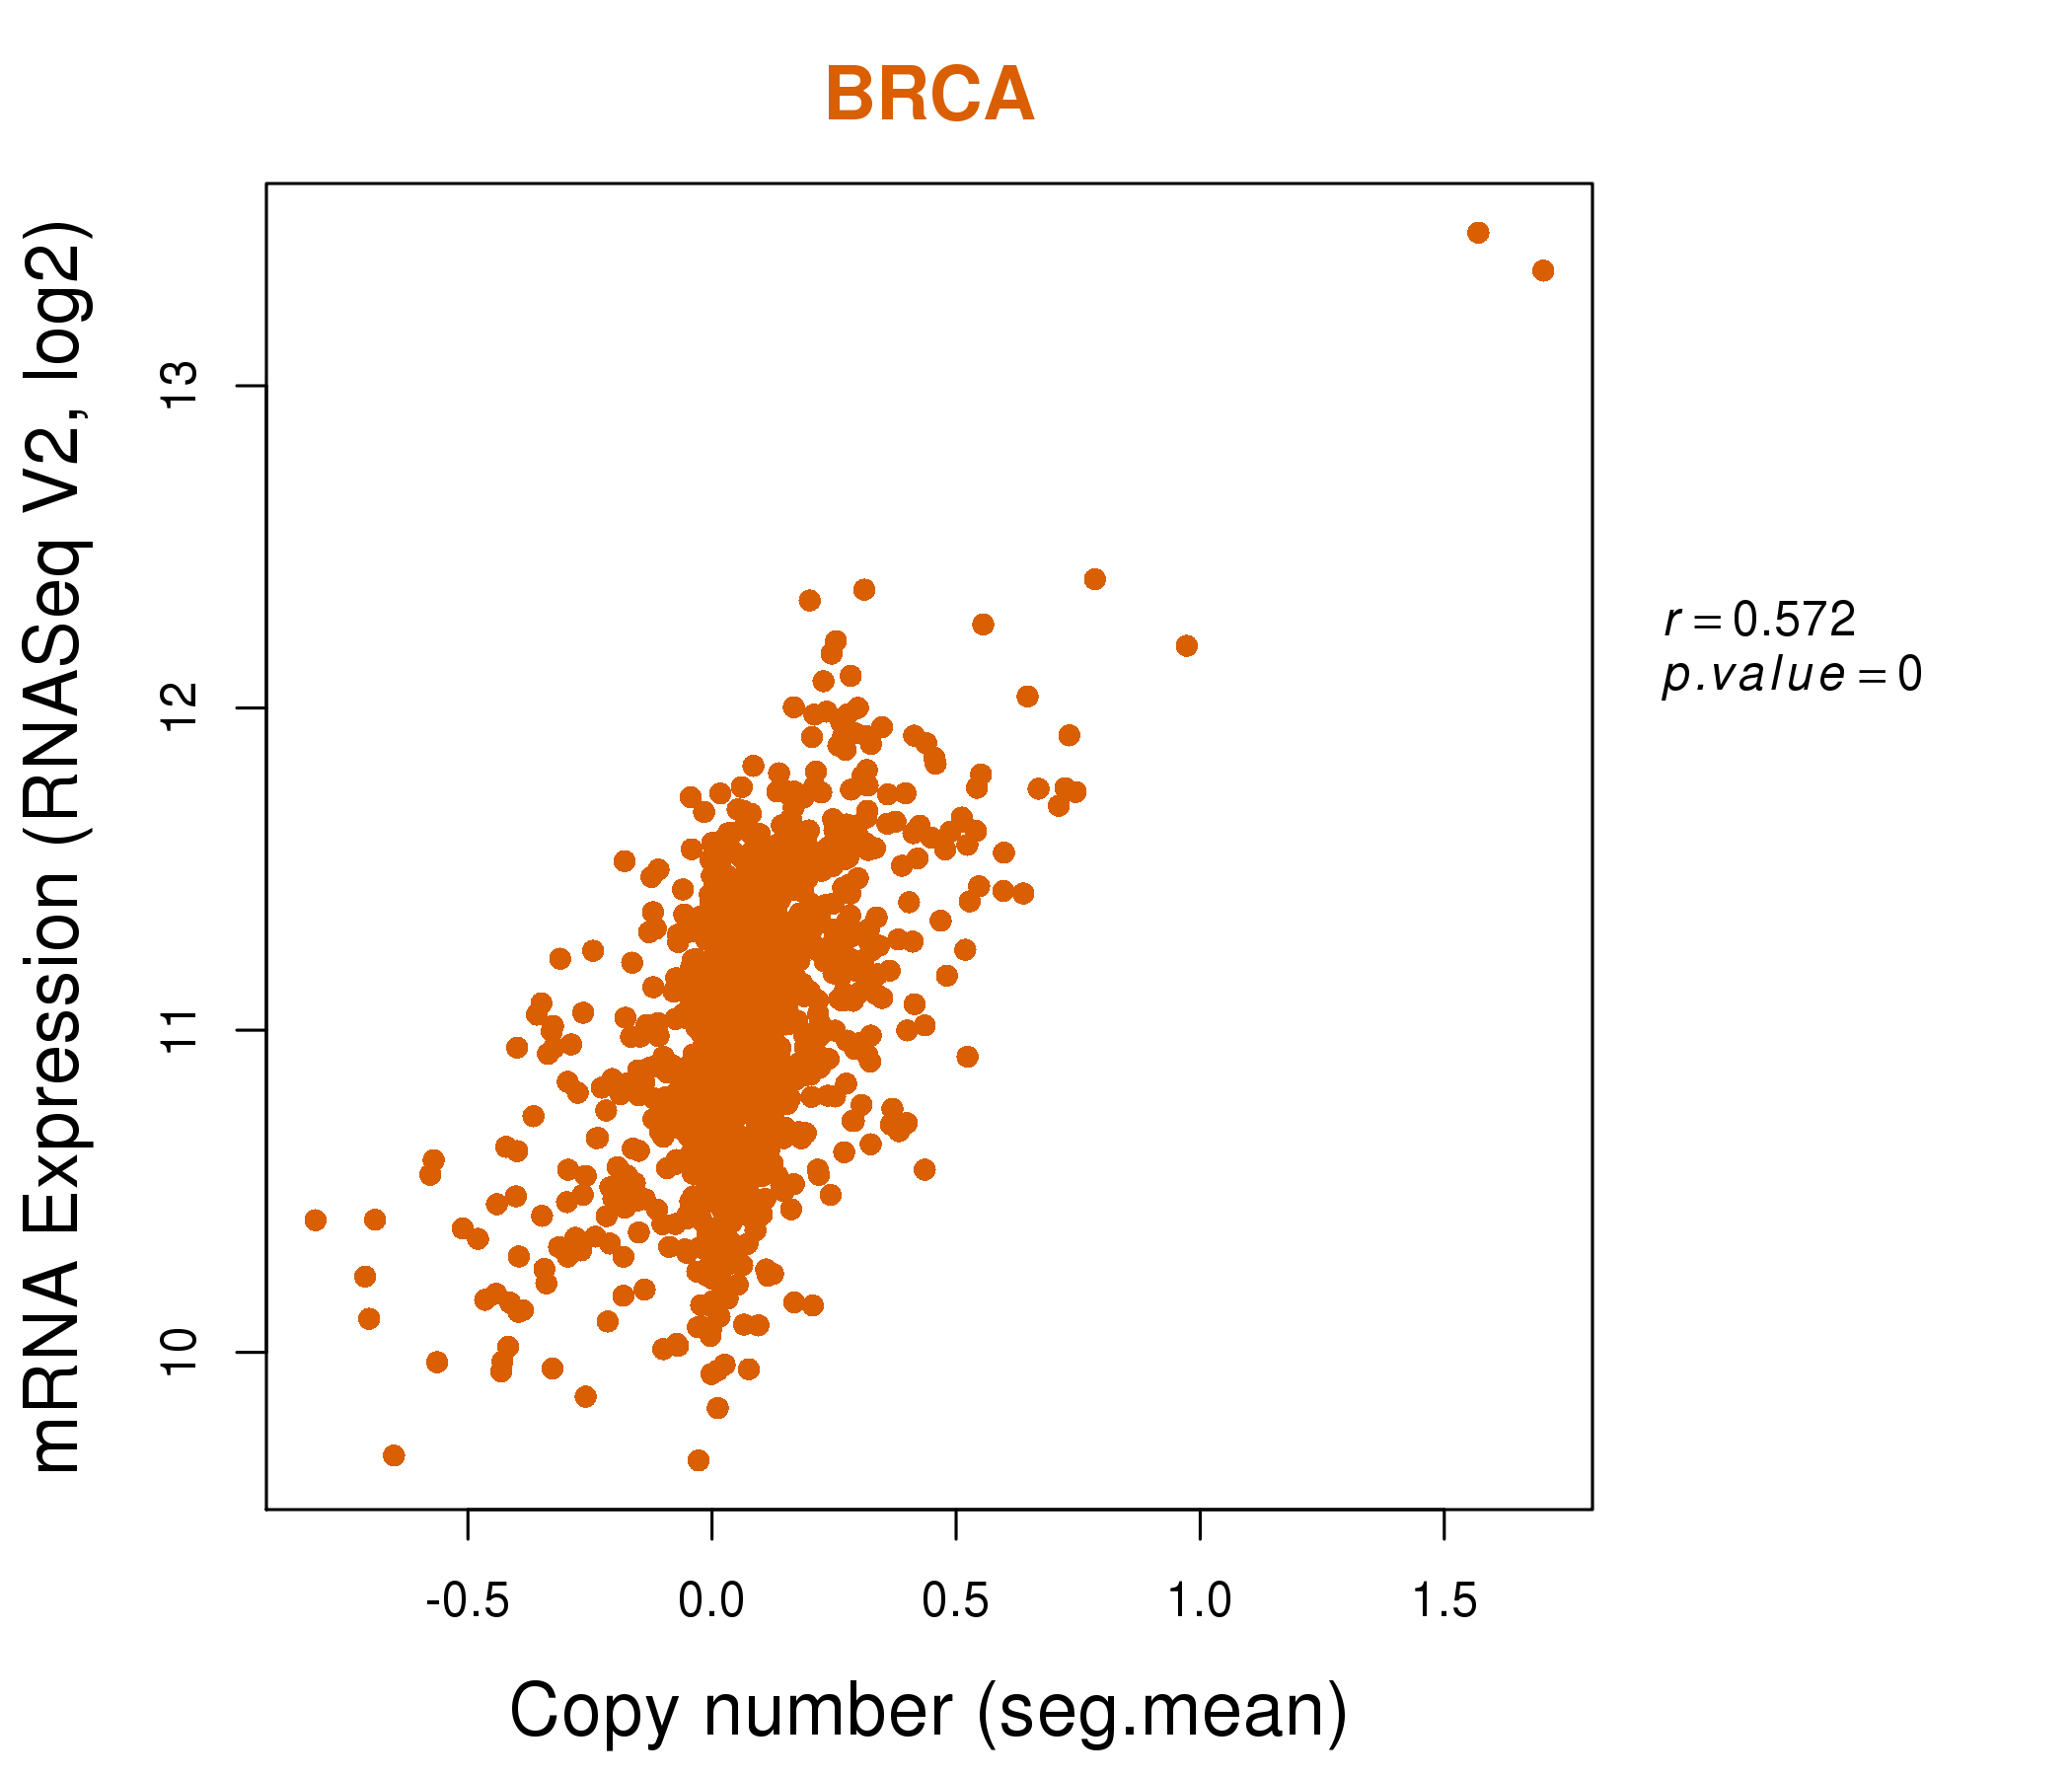
| * This plots show the correlation between CNV and gene expression. |
: Open all plots for all cancer types
 |
|
 |
|

| Top |
| Gene-Gene Network Information |
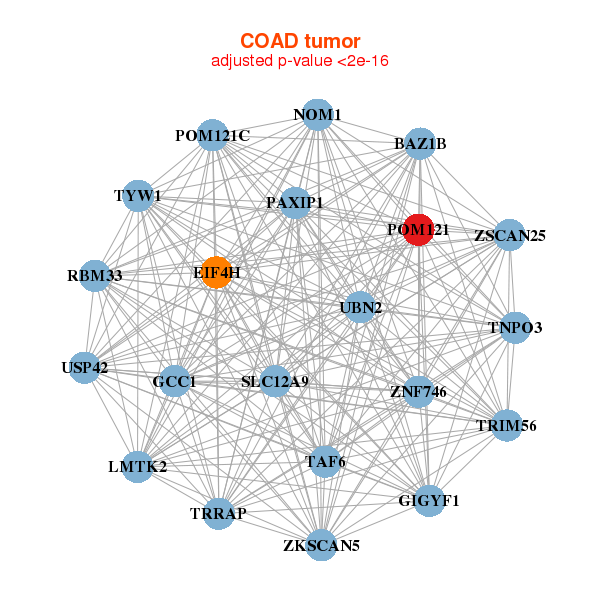
| * Co-Expression network figures were drawn using R package igraph. Only the top 20 genes with the highest correlations were shown. Red circle: input gene, orange circle: cell metabolism gene, sky circle: other gene |
: Open all plots for all cancer types
 |
|
| PRRC2A,BAZ1B,BLM,DNMT1,EIF4H,GTF2I,HCFC1, KCTD7,LMTK2,NUP205,POM121,POM121C,RBM33,SBDSP1, STAG3L1,STAG3L2,STAG3L3,TRRAP,XRCC2,ZC3HAV1L,ZSCAN25 | ASXL1,BAZ2A,HECTD4,DNAH1,DNHD1,EP300,LINC01000, HPS4,INTS3,MED12,NBPF9,NKTR,NUP214,POM121, POM121C,RAD54L2,RBM33,SETD5,SPEN,SRRM2,USP49 |
 |
|
| BAZ1B,EIF4H,GCC1,GIGYF1,LMTK2,NOM1,PAXIP1, POM121,POM121C,RBM33,SLC12A9,TAF6,TNPO3,TRIM56, TRRAP,TYW1,UBN2,USP42,ZKSCAN5,ZSCAN25,ZNF746 | ANKRD11,ATXN2L,BRPF1,CHERP,GCN1L1,KIAA0355,MDN1, KMT2B___KMT2D,MYBBP1A,NUP214,POM121,POM121C,SAFB2,SNAPC4, SRRM2,SYMPK,TUBGCP6,USP36,UTRN,ZMIZ2,ZNF142 |
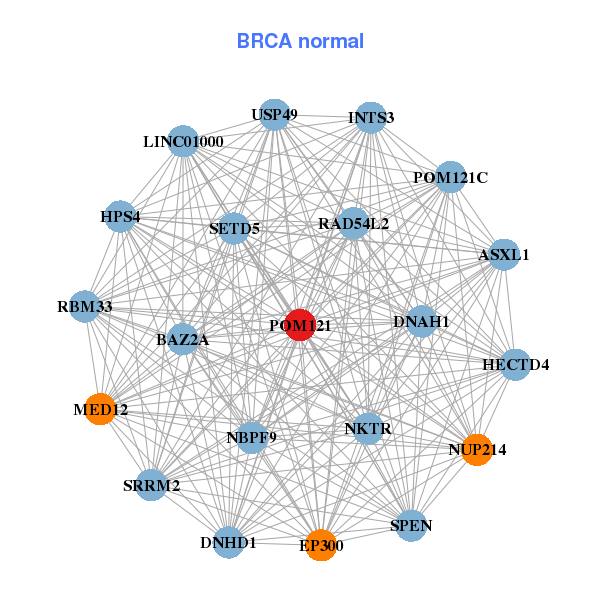
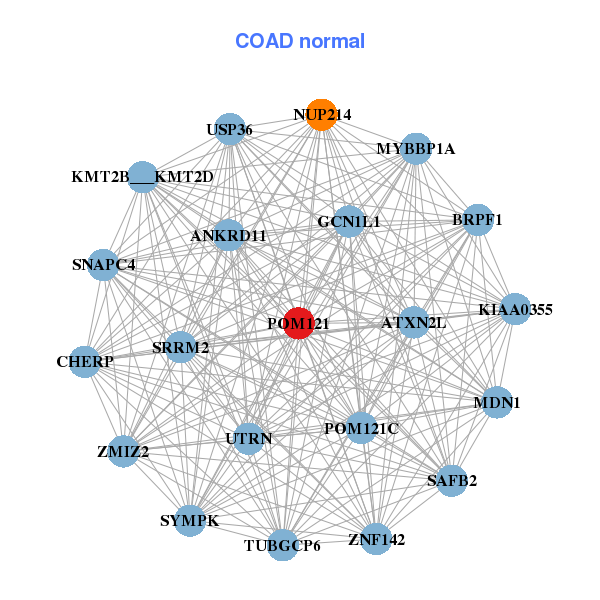
| * Co-Expression network figures were drawn using R package igraph. Only the top 20 genes with the highest correlations were shown. Red circle: input gene, orange circle: cell metabolism gene, sky circle: other gene |
: Open all plots for all cancer types
| Top |
: Open all interacting genes' information including KEGG pathway for all interacting genes from DAVID
| Top |
| Pharmacological Information for POM121 |
| There's no related Drug. |
| Top |
| Cross referenced IDs for POM121 |
| * We obtained these cross-references from Uniprot database. It covers 150 different DBs, 18 categories. http://www.uniprot.org/help/cross_references_section |
: Open all cross reference information
|
Copyright © 2016-Present - The Univsersity of Texas Health Science Center at Houston @ |