|
||||||||||||||||||||||||||||||||||||||||||||||||||||||||||||||||||||||||||||||||||||||||||||||||||||||||||||||||||||||||||||||||||||||||||||||||||||||||||||||||||||||||||||||||||||||||||||||||||||||||||||||||||||||||||||||||||||||||||||||||||||||||||||||||||||||||||||||||||||||||||||||||||||||||||||||||||||||||||
| |
| Phenotypic Information (metabolism pathway, cancer, disease, phenome) |
| |
| |
| Gene-Gene Network Information: Co-Expression Network, Interacting Genes & KEGG |
| |
|


| Gene Summary for LPGAT1 |
| Top |
| Phenotypic Information for LPGAT1(metabolism pathway, cancer, disease, phenome) |
| Cancer | CGAP: LPGAT1 |
| Familial Cancer Database: LPGAT1 | |
| * This gene is included in those cancer gene databases. |
|
|
|
|
|
|
| ||||||||||||||||||||||||||||||||||||||||||||||||||||||||||||||||||||||||||||||||||||||||||||||||||||||||||||||||||||||||||||||||||||||||||||||||||||||||||||||||||||||||||||||||||||||||||||||||||||||||||||||||||||||||||||||||||||||||||||||||||||||||||||||||||||||||||||||||||||||||||||||||||||||||||||||||||||
Oncogene 1 | Significant driver gene in | |||||||||||||||||||||||||||||||||||||||||||||||||||||||||||||||||||||||||||||||||||||||||||||||||||||||||||||||||||||||||||||||||||||||||||||||||||||||||||||||||||||||||||||||||||||||||||||||||||||||||||||||||||||||||||||||||||||||||||||||||||||||||||||||||||||||||||||||||||||||||||||||||||||||||||||||||||||||||
| cf) number; DB name 1 Oncogene; http://nar.oxfordjournals.org/content/35/suppl_1/D721.long, 2 Tumor Suppressor gene; https://bioinfo.uth.edu/TSGene/, 3 Cancer Gene Census; http://www.nature.com/nrc/journal/v4/n3/abs/nrc1299.html, 4 CancerGenes; http://nar.oxfordjournals.org/content/35/suppl_1/D721.long, 5 Network of Cancer Gene; http://ncg.kcl.ac.uk/index.php, 1Therapeutic Vulnerabilities in Cancer; http://cbio.mskcc.org/cancergenomics/statius/ |
| KEGG_GLYCEROPHOSPHOLIPID_METABOLISM REACTOME_PHOSPHOLIPID_METABOLISM REACTOME_METABOLISM_OF_LIPIDS_AND_LIPOPROTEINS | |
| OMIM | |
| Orphanet | |
| Disease | KEGG Disease: LPGAT1 |
| MedGen: LPGAT1 (Human Medical Genetics with Condition) | |
| ClinVar: LPGAT1 | |
| Phenotype | MGI: LPGAT1 (International Mouse Phenotyping Consortium) |
| PhenomicDB: LPGAT1 | |
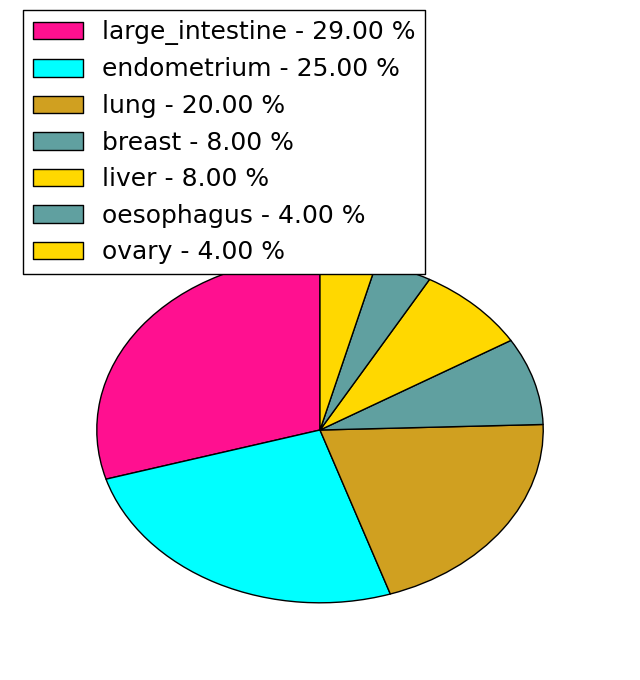
| Mutations for LPGAT1 |
| * Under tables are showing count per each tissue to give us broad intuition about tissue specific mutation patterns.You can go to the detailed page for each mutation database's web site. |
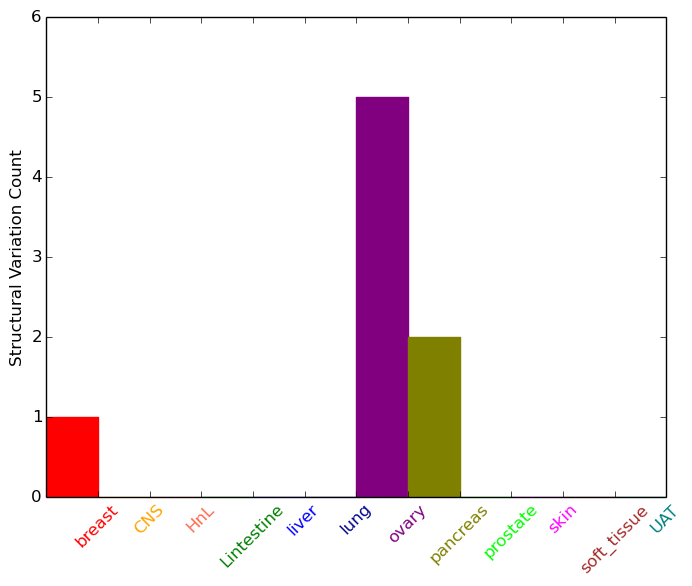
| - Statistics for Tissue and Mutation type | Top |
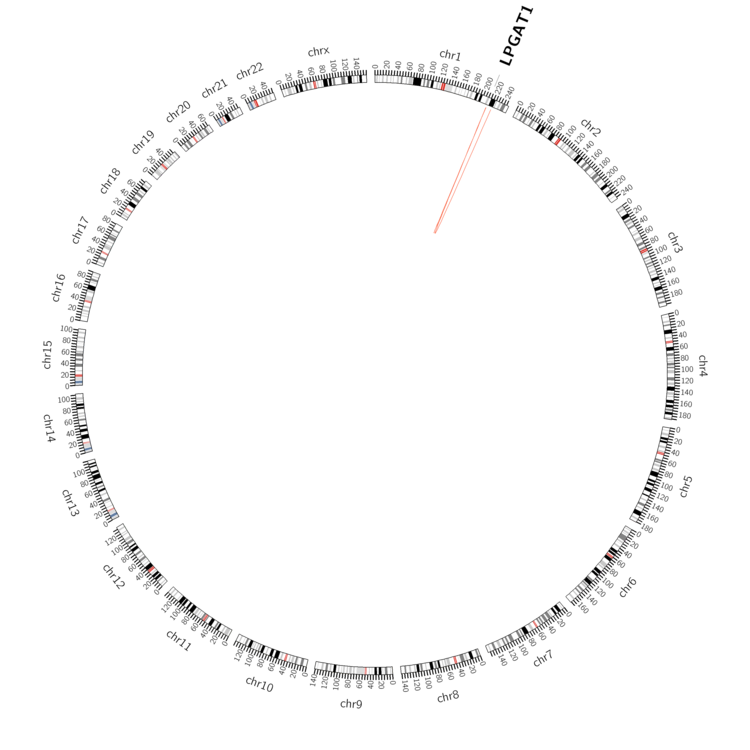 |
| - For Inter-chromosomal Variations |
| There's no inter-chromosomal structural variation. |
| - For Intra-chromosomal Variations |
| * Intra-chromosomal variantions includes 'intrachromosomal amplicon to amplicon', 'intrachromosomal amplicon to non-amplified dna', 'intrachromosomal deletion', 'intrachromosomal fold-back inversion', 'intrachromosomal inversion', 'intrachromosomal tandem duplication', 'Intrachromosomal unknown type', 'intrachromosomal with inverted orientation', 'intrachromosomal with non-inverted orientation'. |
 |
| Sample | Symbol_a | Chr_a | Start_a | End_a | Symbol_b | Chr_b | Start_b | End_b |
| breast | LPGAT1 | chr1 | 211917130 | 211917130 | LPGAT1 | chr1 | 211934321 | 211934321 |
| ovary | LPGAT1 | chr1 | 211930742 | 211930762 | chr1 | 211902349 | 211902369 | |
| ovary | LPGAT1 | chr1 | 211973826 | 211973846 | LPGAT1 | chr1 | 211974009 | 211974029 |
| ovary | LPGAT1 | chr1 | 211981807 | 211981827 | chr1 | 211879167 | 211879187 | |
| pancreas | LPGAT1 | chr1 | 211943519 | 211943539 | chr1 | 221720003 | 221720023 | |
| pancreas | LPGAT1 | chr1 | 211986010 | 211986030 | LPGAT1 | chr1 | 211985608 | 211985628 |
| cf) Tissue number; Tissue name (1;Breast, 2;Central_nervous_system, 3;Haematopoietic_and_lymphoid_tissue, 4;Large_intestine, 5;Liver, 6;Lung, 7;Ovary, 8;Pancreas, 9;Prostate, 10;Skin, 11;Soft_tissue, 12;Upper_aerodigestive_tract) |
| * From mRNA Sanger sequences, Chitars2.0 arranged chimeric transcripts. This table shows LPGAT1 related fusion information. |
| ID | Head Gene | Tail Gene | Accession | Gene_a | qStart_a | qEnd_a | Chromosome_a | tStart_a | tEnd_a | Gene_a | qStart_a | qEnd_a | Chromosome_a | tStart_a | tEnd_a |
| CB267058 | LPGAT1 | 1 | 87 | 1 | 211950561 | 211950646 | SIX1 | 83 | 263 | 14 | 61112817 | 61112995 | |
| BE936059 | CAMK2N1 | 10 | 401 | 1 | 20808994 | 20809386 | LPGAT1 | 401 | 574 | 1 | 211983165 | 211983484 | |
| AW948393 | LPGAT1 | 8 | 125 | 1 | 211972542 | 211972658 | PCSK7 | 122 | 195 | 11 | 117076940 | 117077012 | |
| Top |
| Mutation type/ Tissue ID | brca | cns | cerv | endome | haematopo | kidn | Lintest | liver | lung | ns | ovary | pancre | prost | skin | stoma | thyro | urina | |||
| Total # sample | 1 | 1 | ||||||||||||||||||
| GAIN (# sample) | 1 | 1 | ||||||||||||||||||
| LOSS (# sample) |
| cf) Tissue ID; Tissue type (1; Breast, 2; Central_nervous_system, 3; Cervix, 4; Endometrium, 5; Haematopoietic_and_lymphoid_tissue, 6; Kidney, 7; Large_intestine, 8; Liver, 9; Lung, 10; NS, 11; Ovary, 12; Pancreas, 13; Prostate, 14; Skin, 15; Stomach, 16; Thyroid, 17; Urinary_tract) |
| Top |
|
 |
| Top |
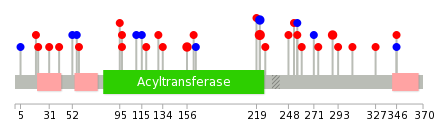
| Stat. for Non-Synonymous SNVs (# total SNVs=24) | (# total SNVs=7) |
 | 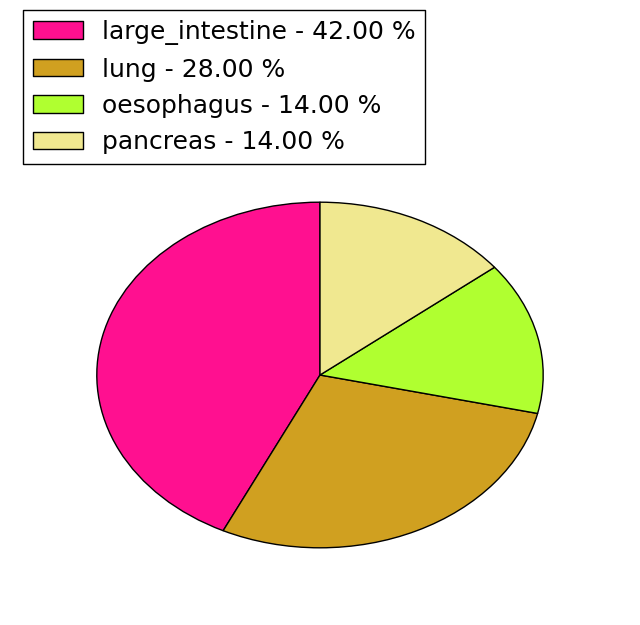 |
(# total SNVs=1) | (# total SNVs=1) |
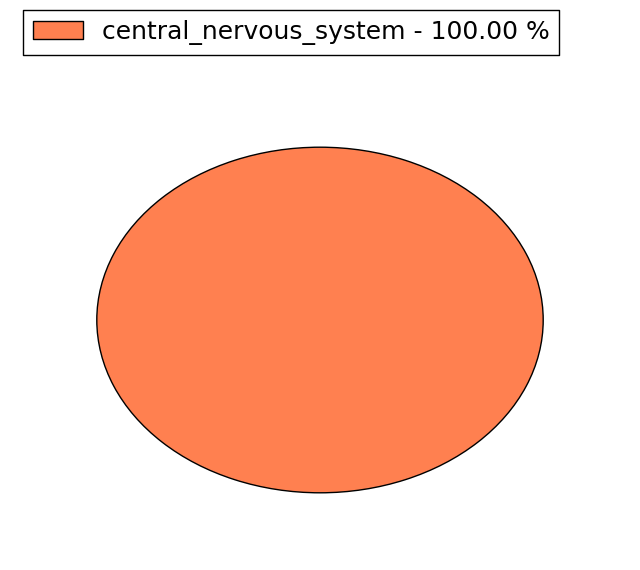 | 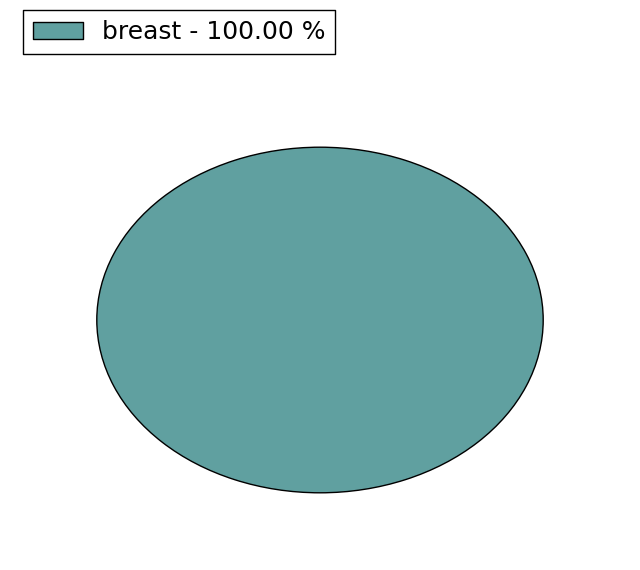 |
| Top |
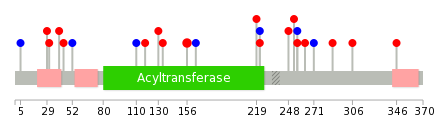
| * When you move the cursor on each content, you can see more deailed mutation information on the Tooltip. Those are primary_site,primary_histology,mutation(aa),pubmedID. |
| GRCh37 position | Mutation(aa) | Unique sampleID count |
| chr1:211956632-211956632 | p.L222L | 4 |
| chr1:211924401-211924401 | p.P288L | 2 |
| chr1:211956832-211956832 | p.R156C | 2 |
| chr1:211952357-211952357 | p.I253L | 1 |
| chr1:211961026-211961026 | p.Y134C | 1 |
| chr1:211923374-211923374 | p.K327R | 1 |
| chr1:212002483-212002483 | p.K52K | 1 |
| chr1:211952371-211952371 | p.G248D | 1 |
| chr1:211961039-211961039 | p.H130Y | 1 |
| chr1:211924348-211924348 | p.R306W | 1 |
| Top |
|
 |
| Point Mutation/ Tissue ID | 1 | 2 | 3 | 4 | 5 | 6 | 7 | 8 | 9 | 10 | 11 | 12 | 13 | 14 | 15 | 16 | 17 | 18 | 19 | 20 |
| # sample | 2 | 1 | 1 | 4 | 2 | 3 | 1 | 5 | 1 | 5 | ||||||||||
| # mutation | 2 | 1 | 1 | 4 | 2 | 3 | 1 | 5 | 1 | 5 | ||||||||||
| nonsynonymous SNV | 1 | 1 | 1 | 2 | 2 | 2 | 1 | 2 | 1 | 5 | ||||||||||
| synonymous SNV | 1 | 2 | 1 | 3 |
| cf) Tissue ID; Tissue type (1; BLCA[Bladder Urothelial Carcinoma], 2; BRCA[Breast invasive carcinoma], 3; CESC[Cervical squamous cell carcinoma and endocervical adenocarcinoma], 4; COAD[Colon adenocarcinoma], 5; GBM[Glioblastoma multiforme], 6; Glioma Low Grade, 7; HNSC[Head and Neck squamous cell carcinoma], 8; KICH[Kidney Chromophobe], 9; KIRC[Kidney renal clear cell carcinoma], 10; KIRP[Kidney renal papillary cell carcinoma], 11; LAML[Acute Myeloid Leukemia], 12; LUAD[Lung adenocarcinoma], 13; LUSC[Lung squamous cell carcinoma], 14; OV[Ovarian serous cystadenocarcinoma ], 15; PAAD[Pancreatic adenocarcinoma], 16; PRAD[Prostate adenocarcinoma], 17; SKCM[Skin Cutaneous Melanoma], 18:STAD[Stomach adenocarcinoma], 19:THCA[Thyroid carcinoma], 20:UCEC[Uterine Corpus Endometrial Carcinoma]) |
| Top |
| * We represented just top 10 SNVs. When you move the cursor on each content, you can see more deailed mutation information on the Tooltip. Those are primary_site, primary_histology, mutation(aa), pubmedID. |
| Genomic Position | Mutation(aa) | Unique sampleID count |
| chr1:211956832 | p.R156C | 2 |
| chr1:211956806 | p.R306W | 1 |
| chr1:212002626 | p.L110L | 1 |
| chr1:211924401 | p.P288L | 1 |
| chr1:211952301 | p.K52K | 1 |
| chr1:211961026 | p.I271I | 1 |
| chr1:211952327 | p.Q44H | 1 |
| chr1:211961039 | p.E263K | 1 |
| chr1:211952346 | p.V40E | 1 |
| chr1:211966418 | p.T256T | 1 |
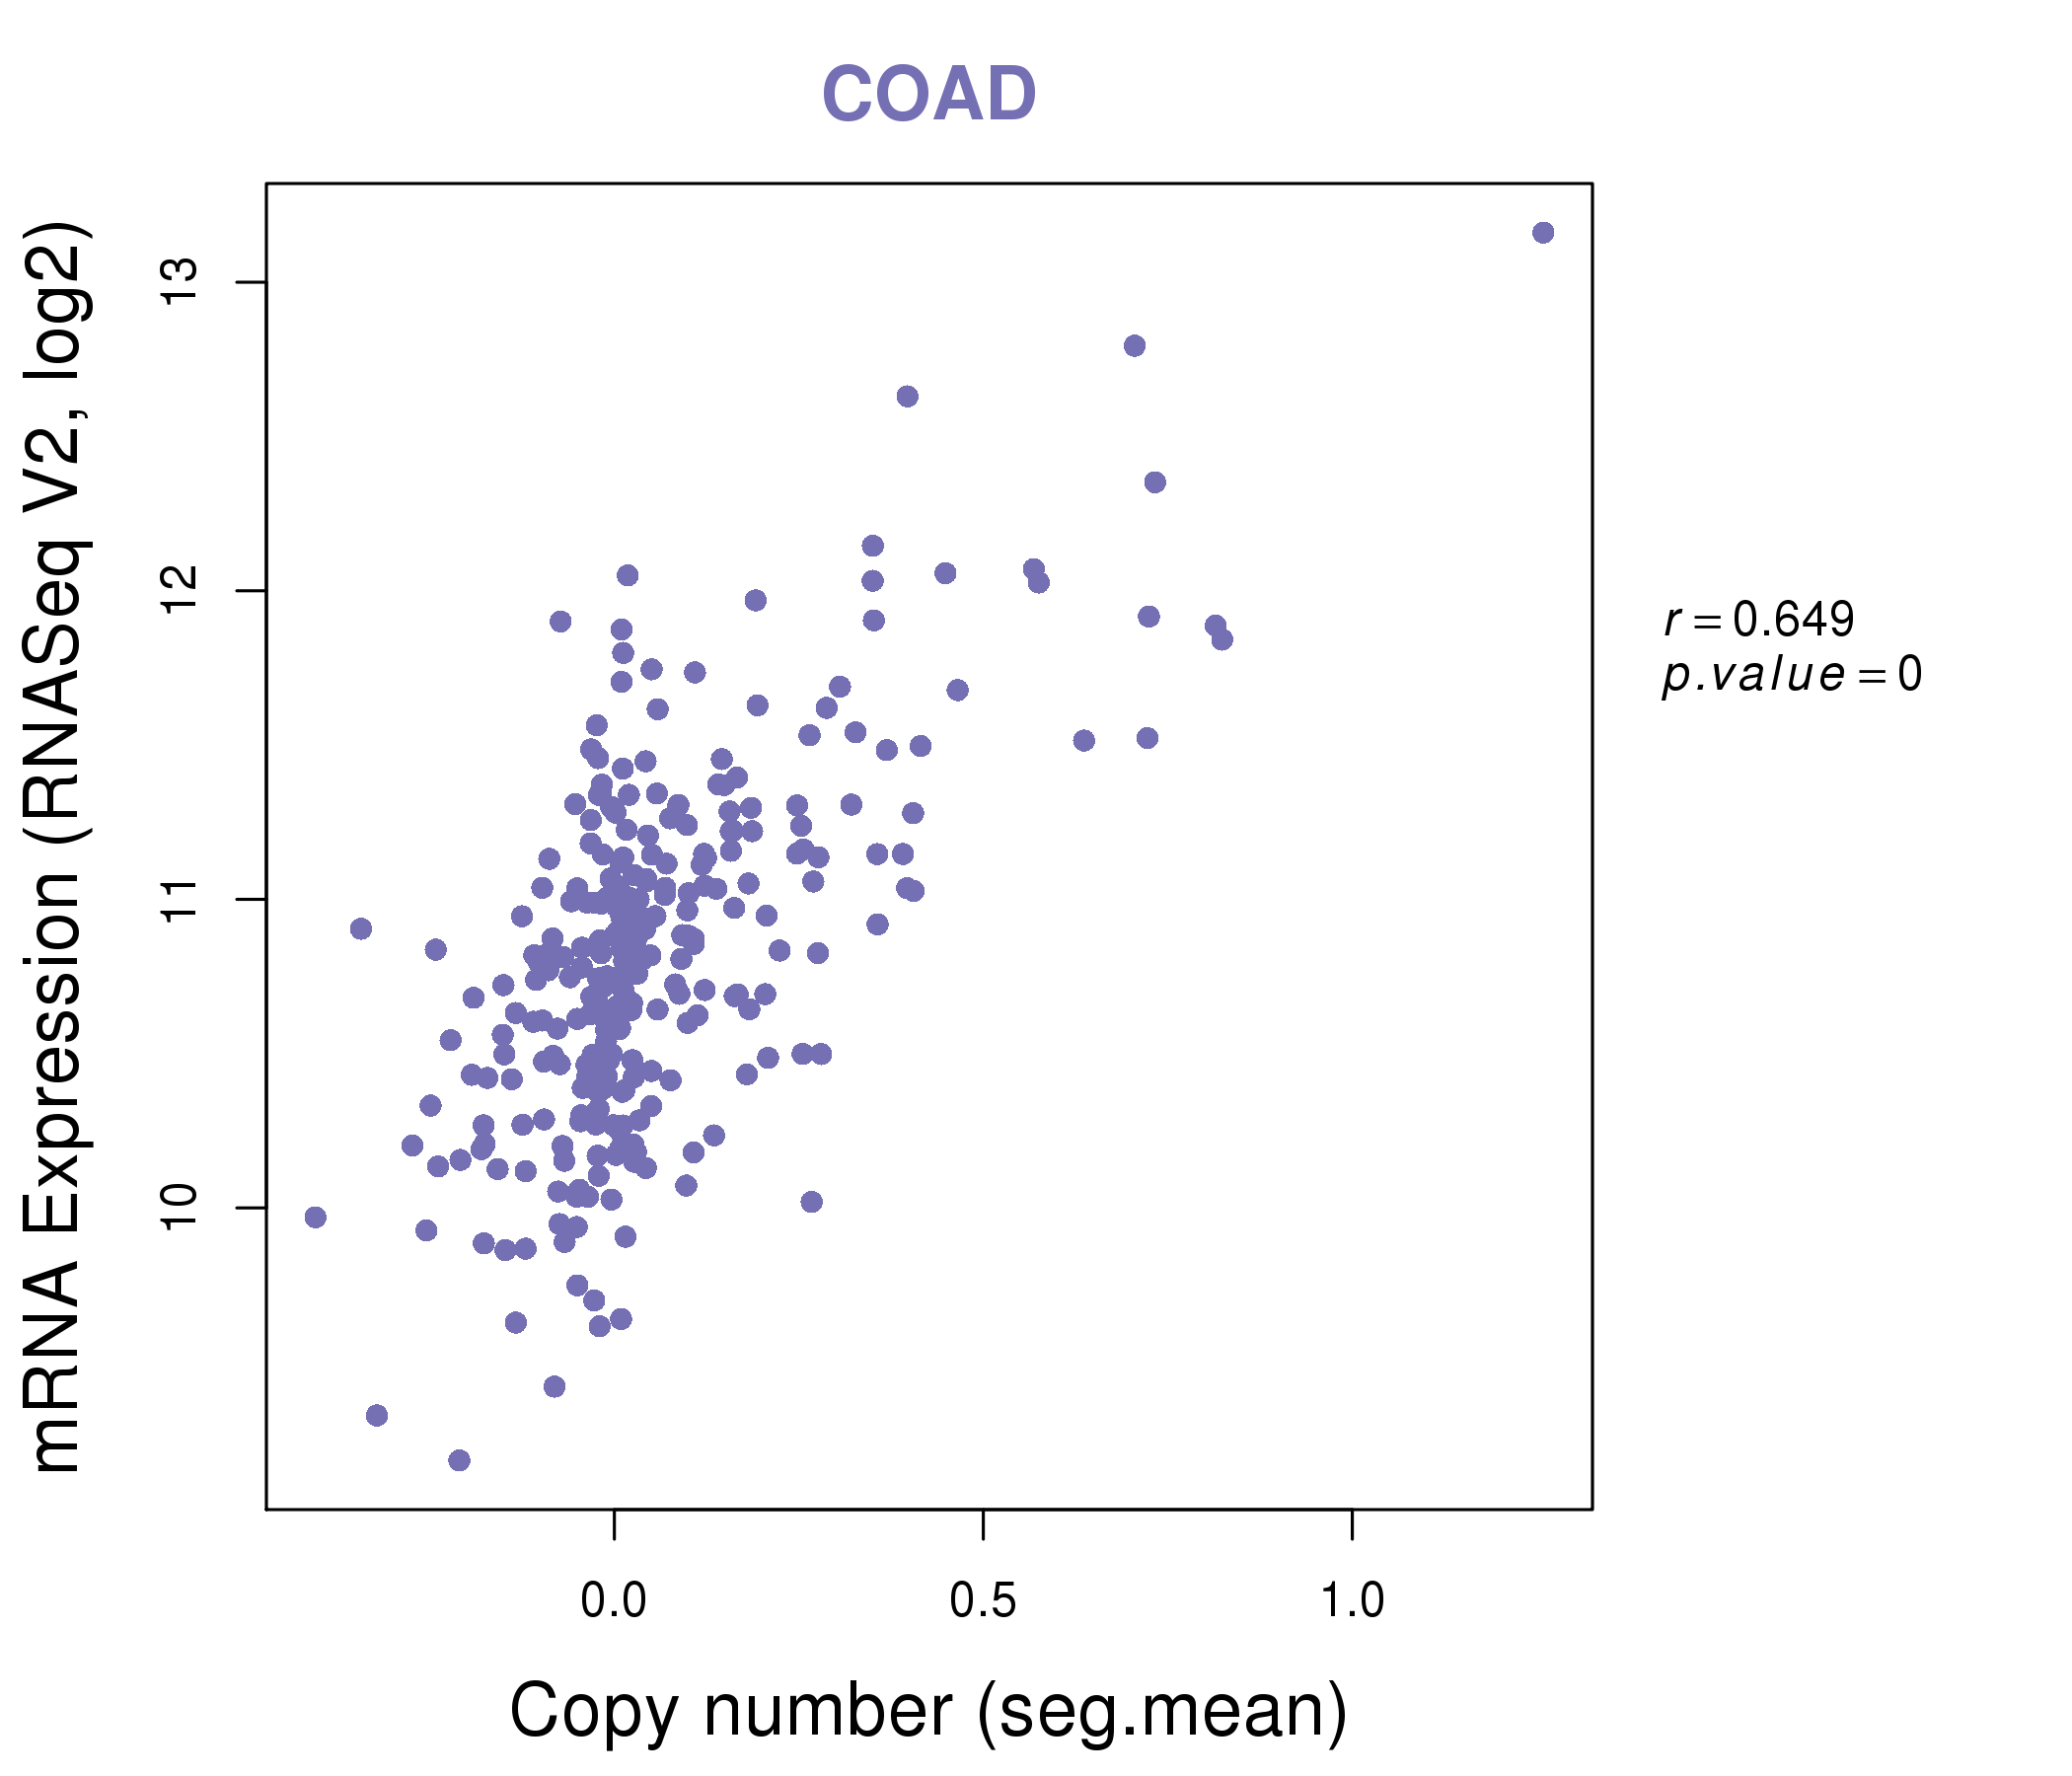
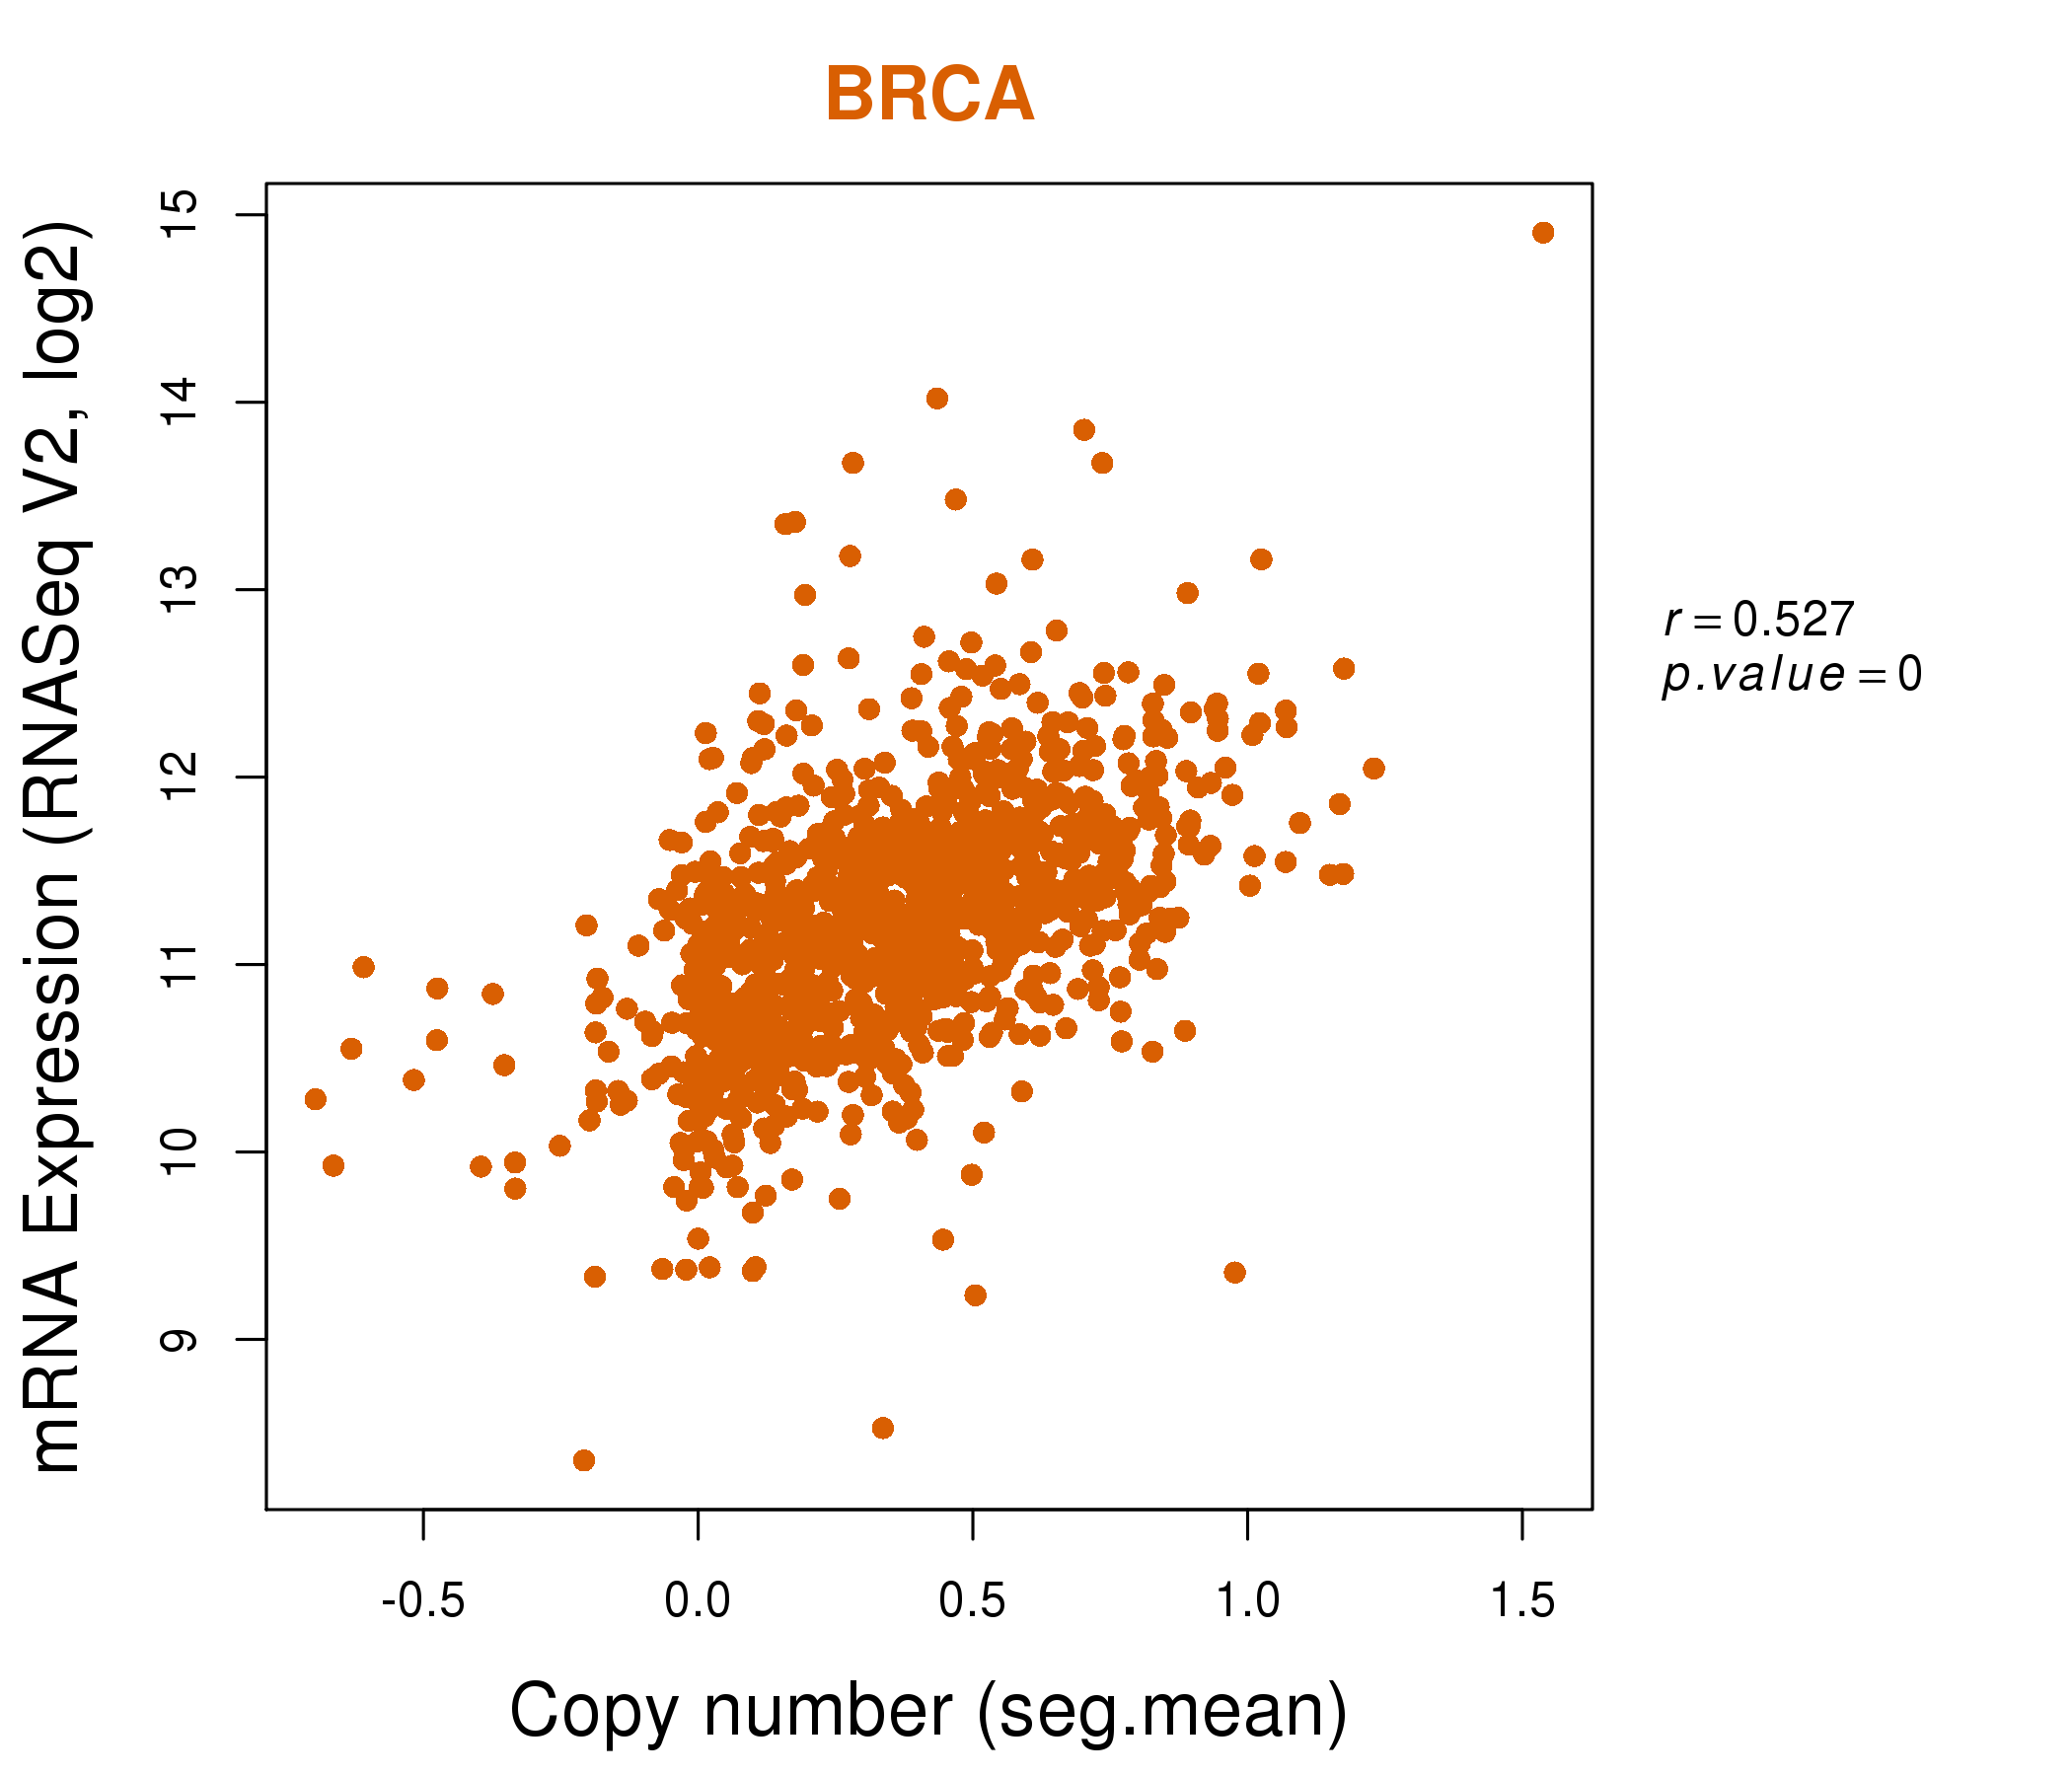
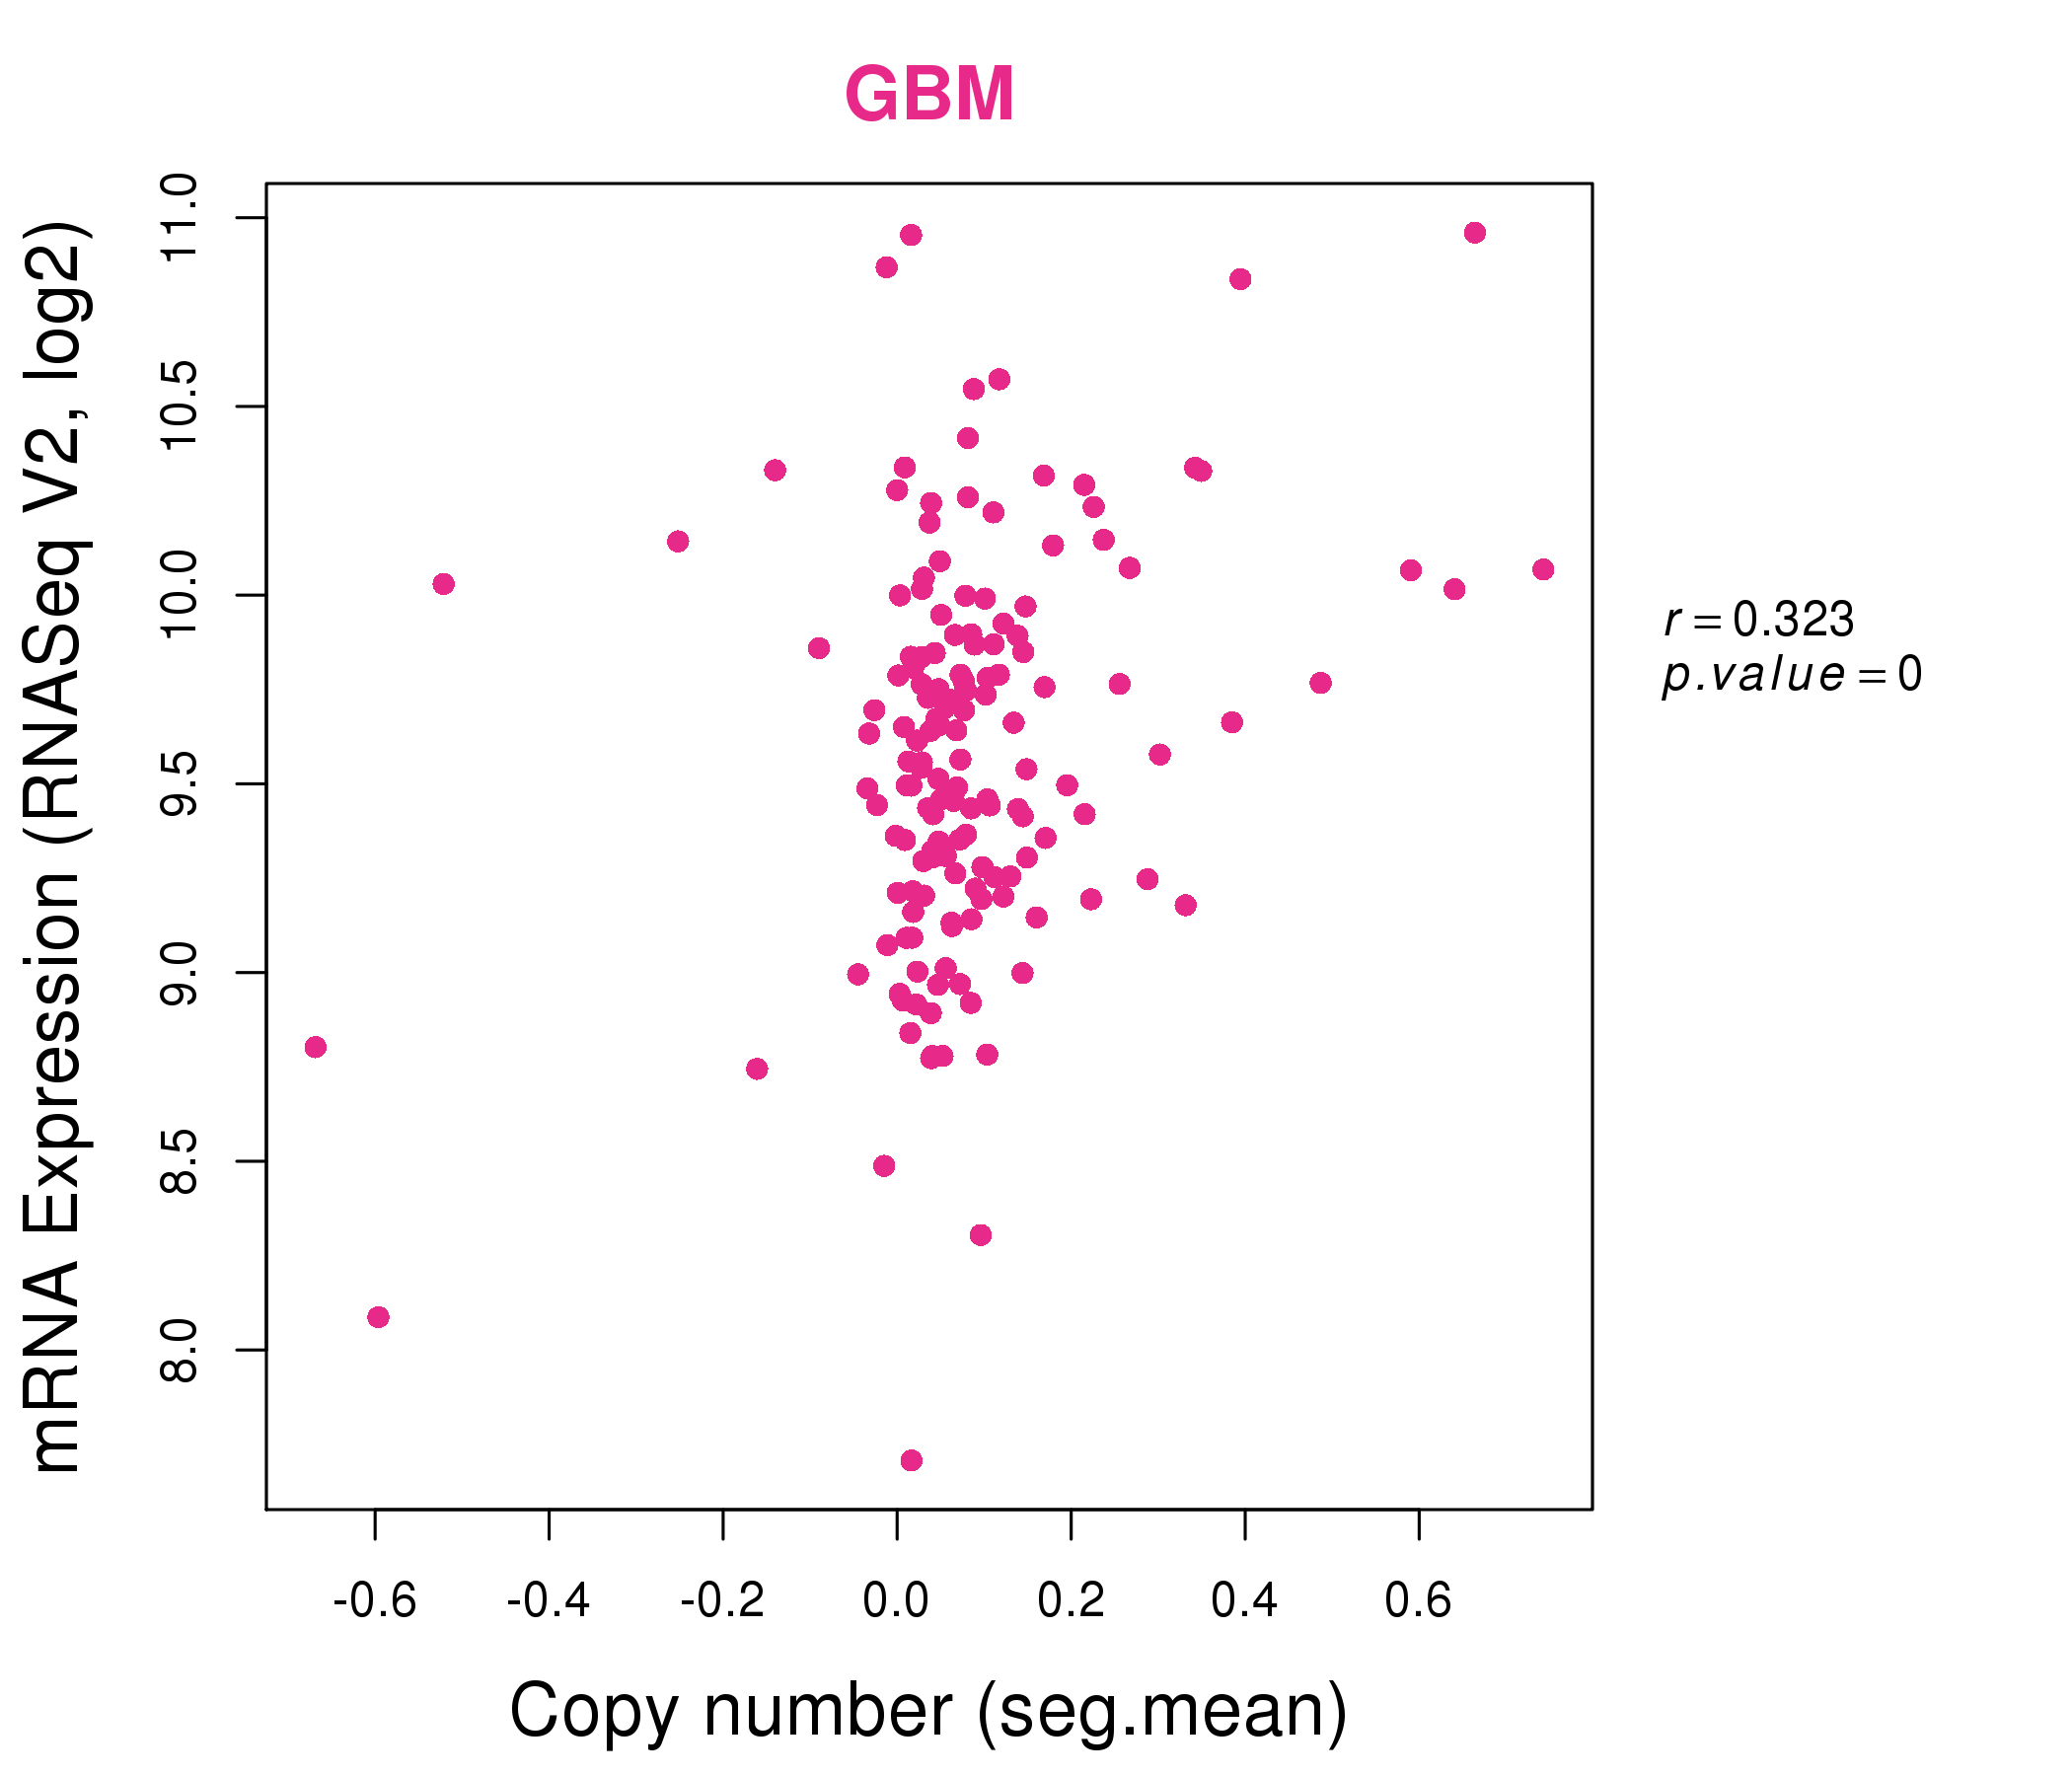
| * Copy number data were extracted from TCGA using R package TCGA-Assembler. The URLs of all public data files on TCGA DCC data server were gathered on Jan-05-2015. Function ProcessCNAData in TCGA-Assembler package was used to obtain gene-level copy number value which is calculated as the average copy number of the genomic region of a gene. |
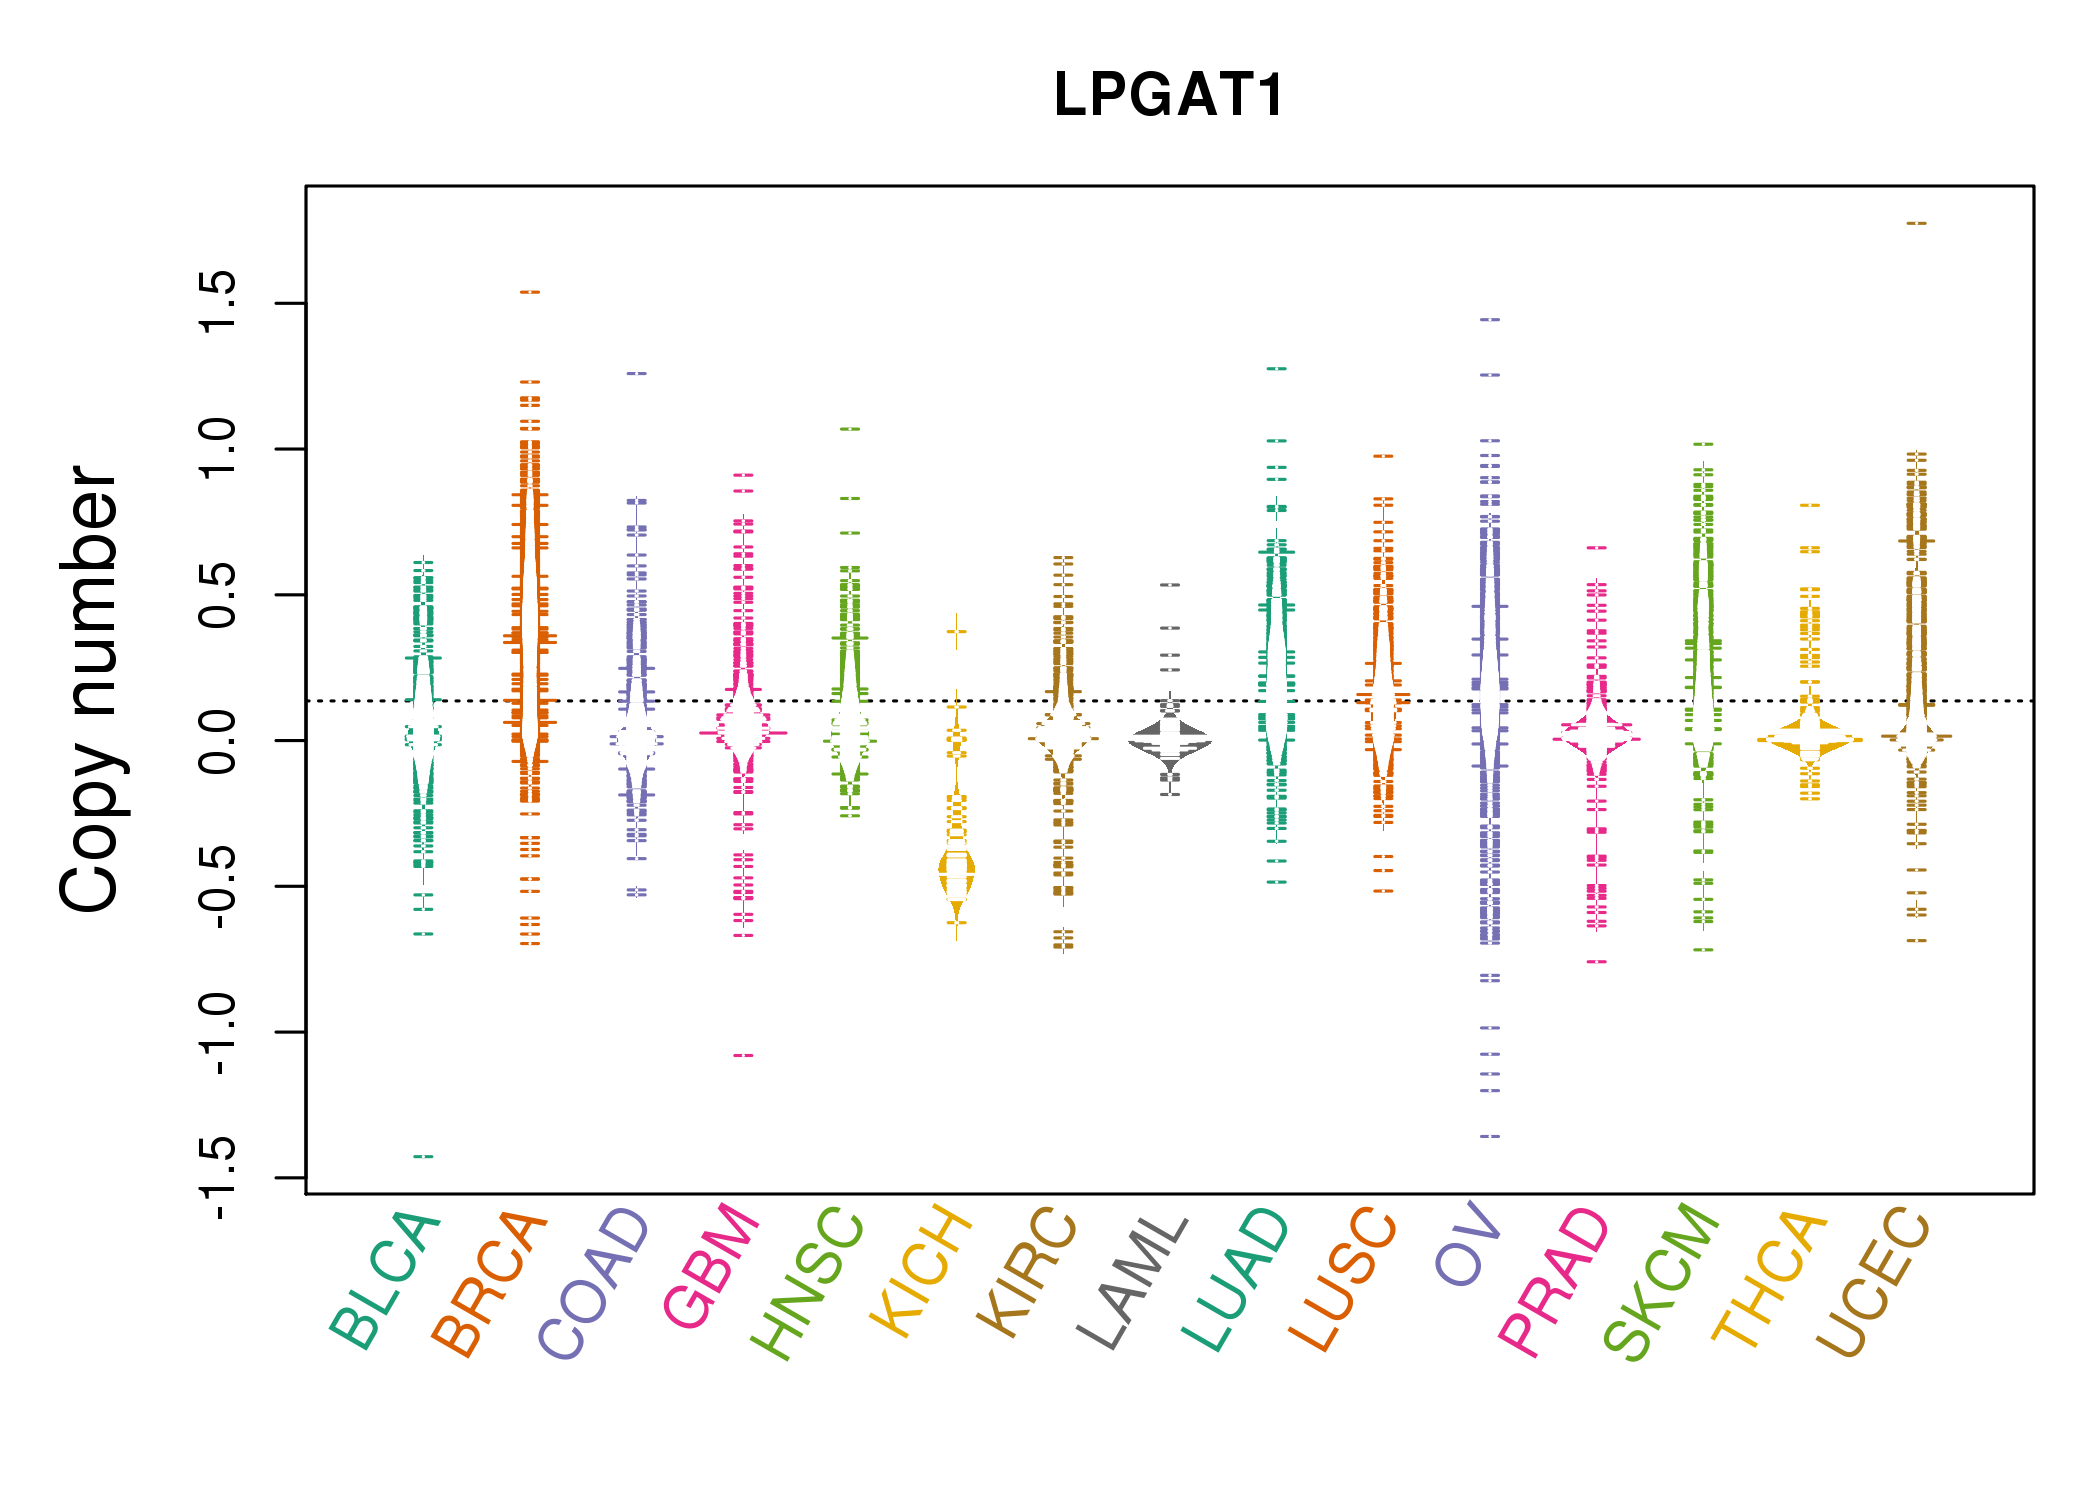 |
| cf) Tissue ID[Tissue type]: BLCA[Bladder Urothelial Carcinoma], BRCA[Breast invasive carcinoma], CESC[Cervical squamous cell carcinoma and endocervical adenocarcinoma], COAD[Colon adenocarcinoma], GBM[Glioblastoma multiforme], Glioma Low Grade, HNSC[Head and Neck squamous cell carcinoma], KICH[Kidney Chromophobe], KIRC[Kidney renal clear cell carcinoma], KIRP[Kidney renal papillary cell carcinoma], LAML[Acute Myeloid Leukemia], LUAD[Lung adenocarcinoma], LUSC[Lung squamous cell carcinoma], OV[Ovarian serous cystadenocarcinoma ], PAAD[Pancreatic adenocarcinoma], PRAD[Prostate adenocarcinoma], SKCM[Skin Cutaneous Melanoma], STAD[Stomach adenocarcinoma], THCA[Thyroid carcinoma], UCEC[Uterine Corpus Endometrial Carcinoma] |
| Top |
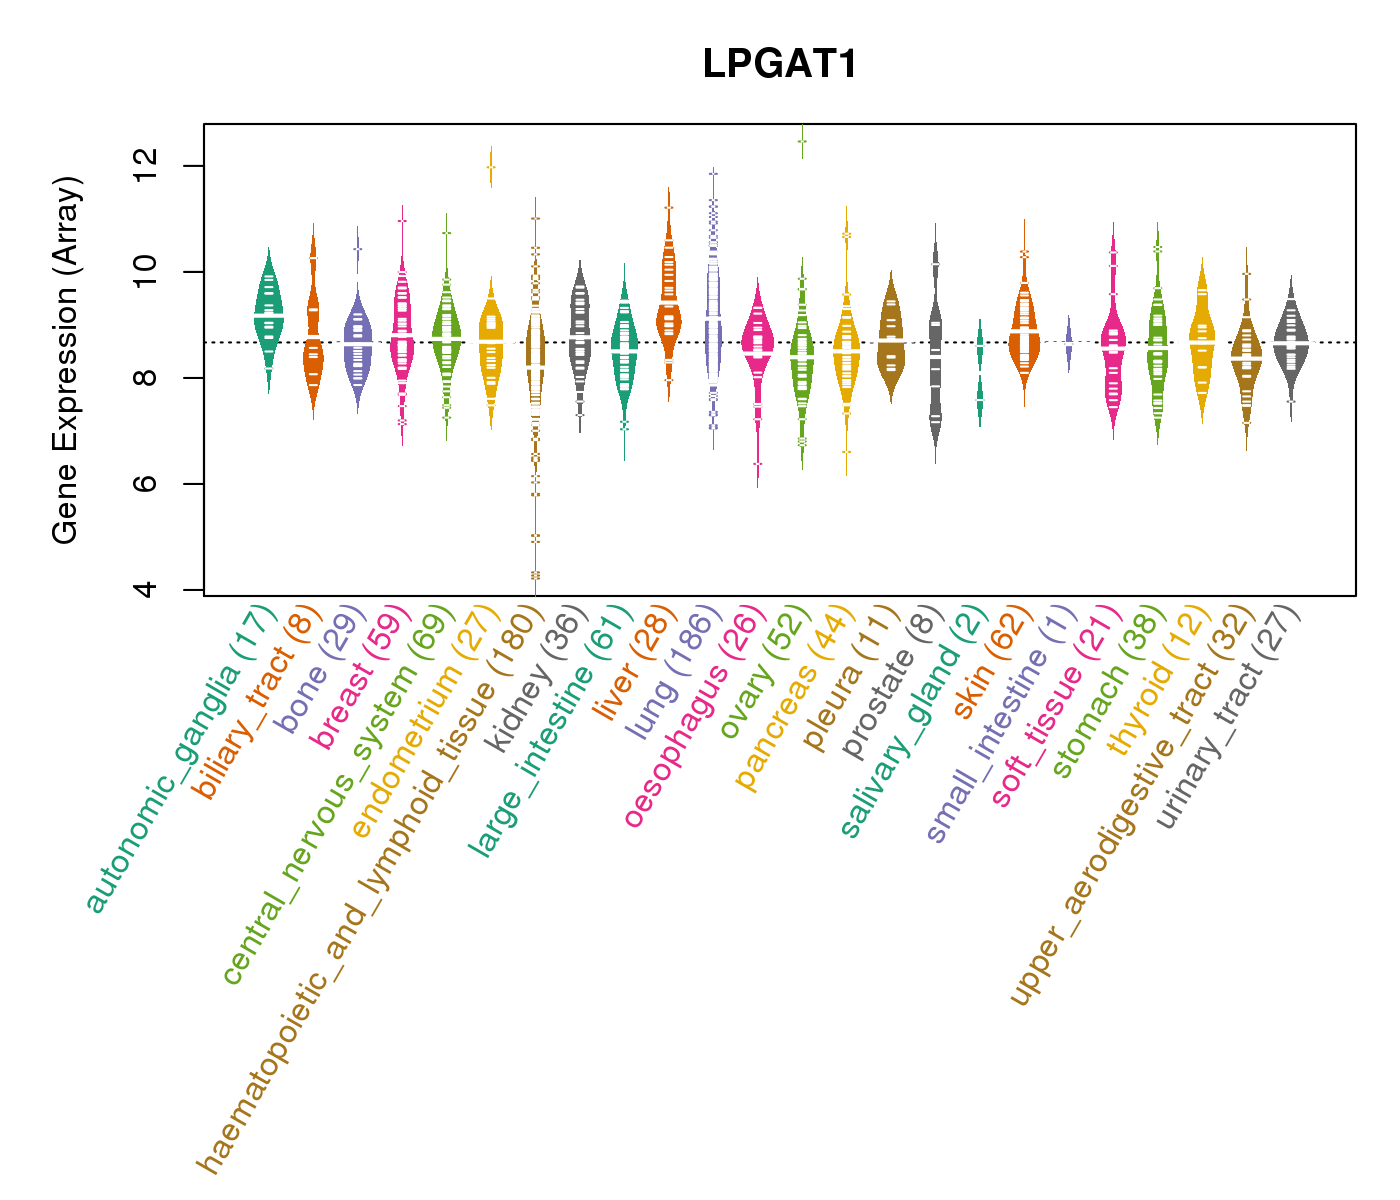
| Gene Expression for LPGAT1 |
| * CCLE gene expression data were extracted from CCLE_Expression_Entrez_2012-10-18.res: Gene-centric RMA-normalized mRNA expression data. |
 |
| * Normalized gene expression data of RNASeqV2 was extracted from TCGA using R package TCGA-Assembler. The URLs of all public data files on TCGA DCC data server were gathered at Jan-05-2015. Only eight cancer types have enough normal control samples for differential expression analysis. (t test, adjusted p<0.05 (using Benjamini-Hochberg FDR)) |
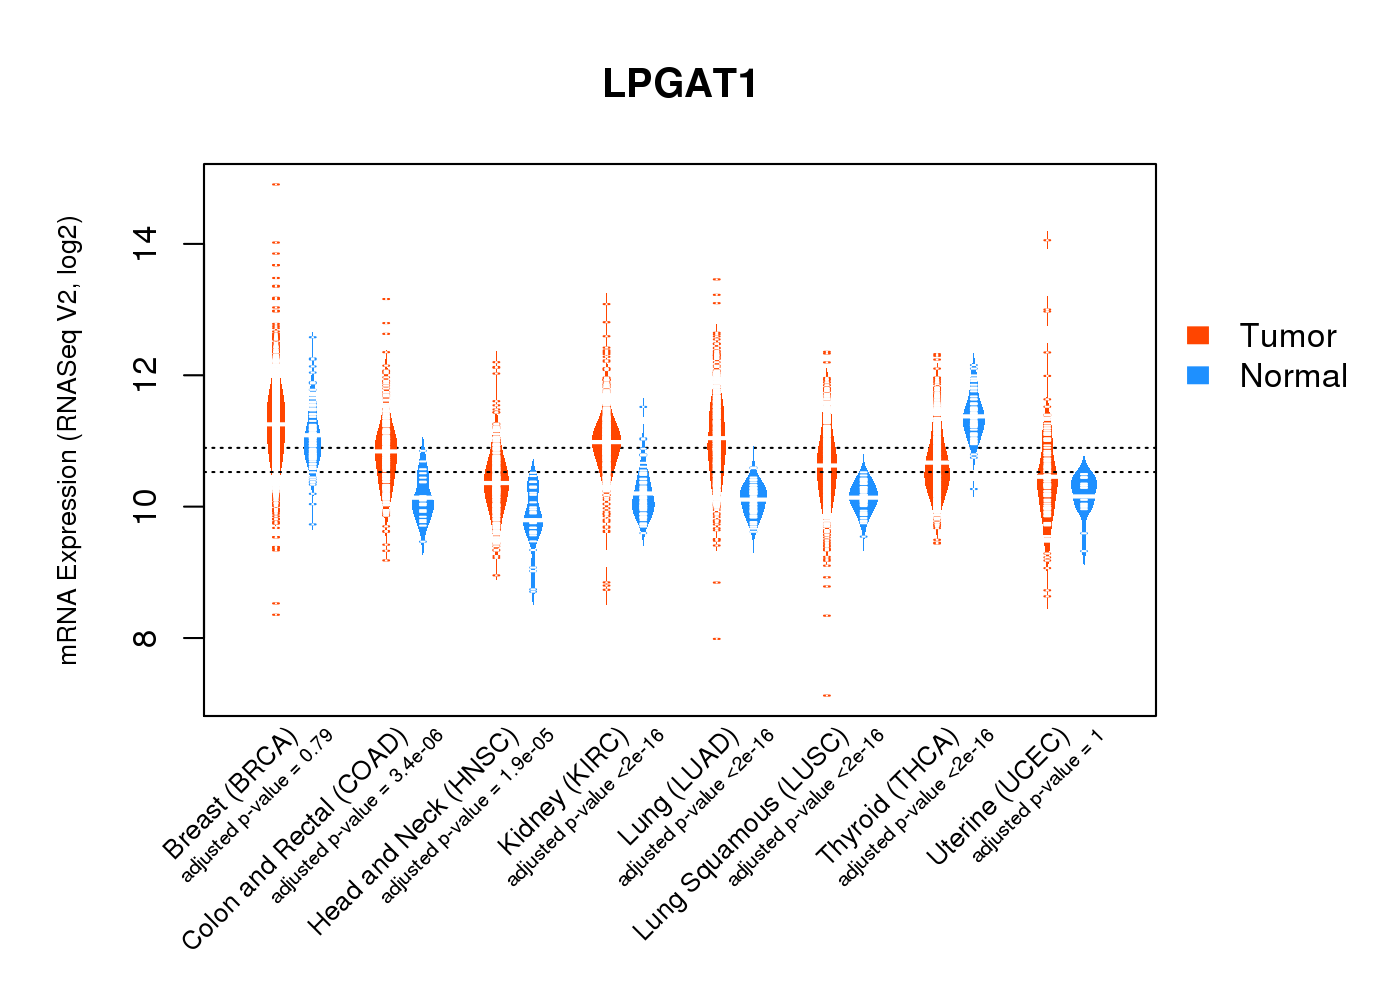 |
| Top |
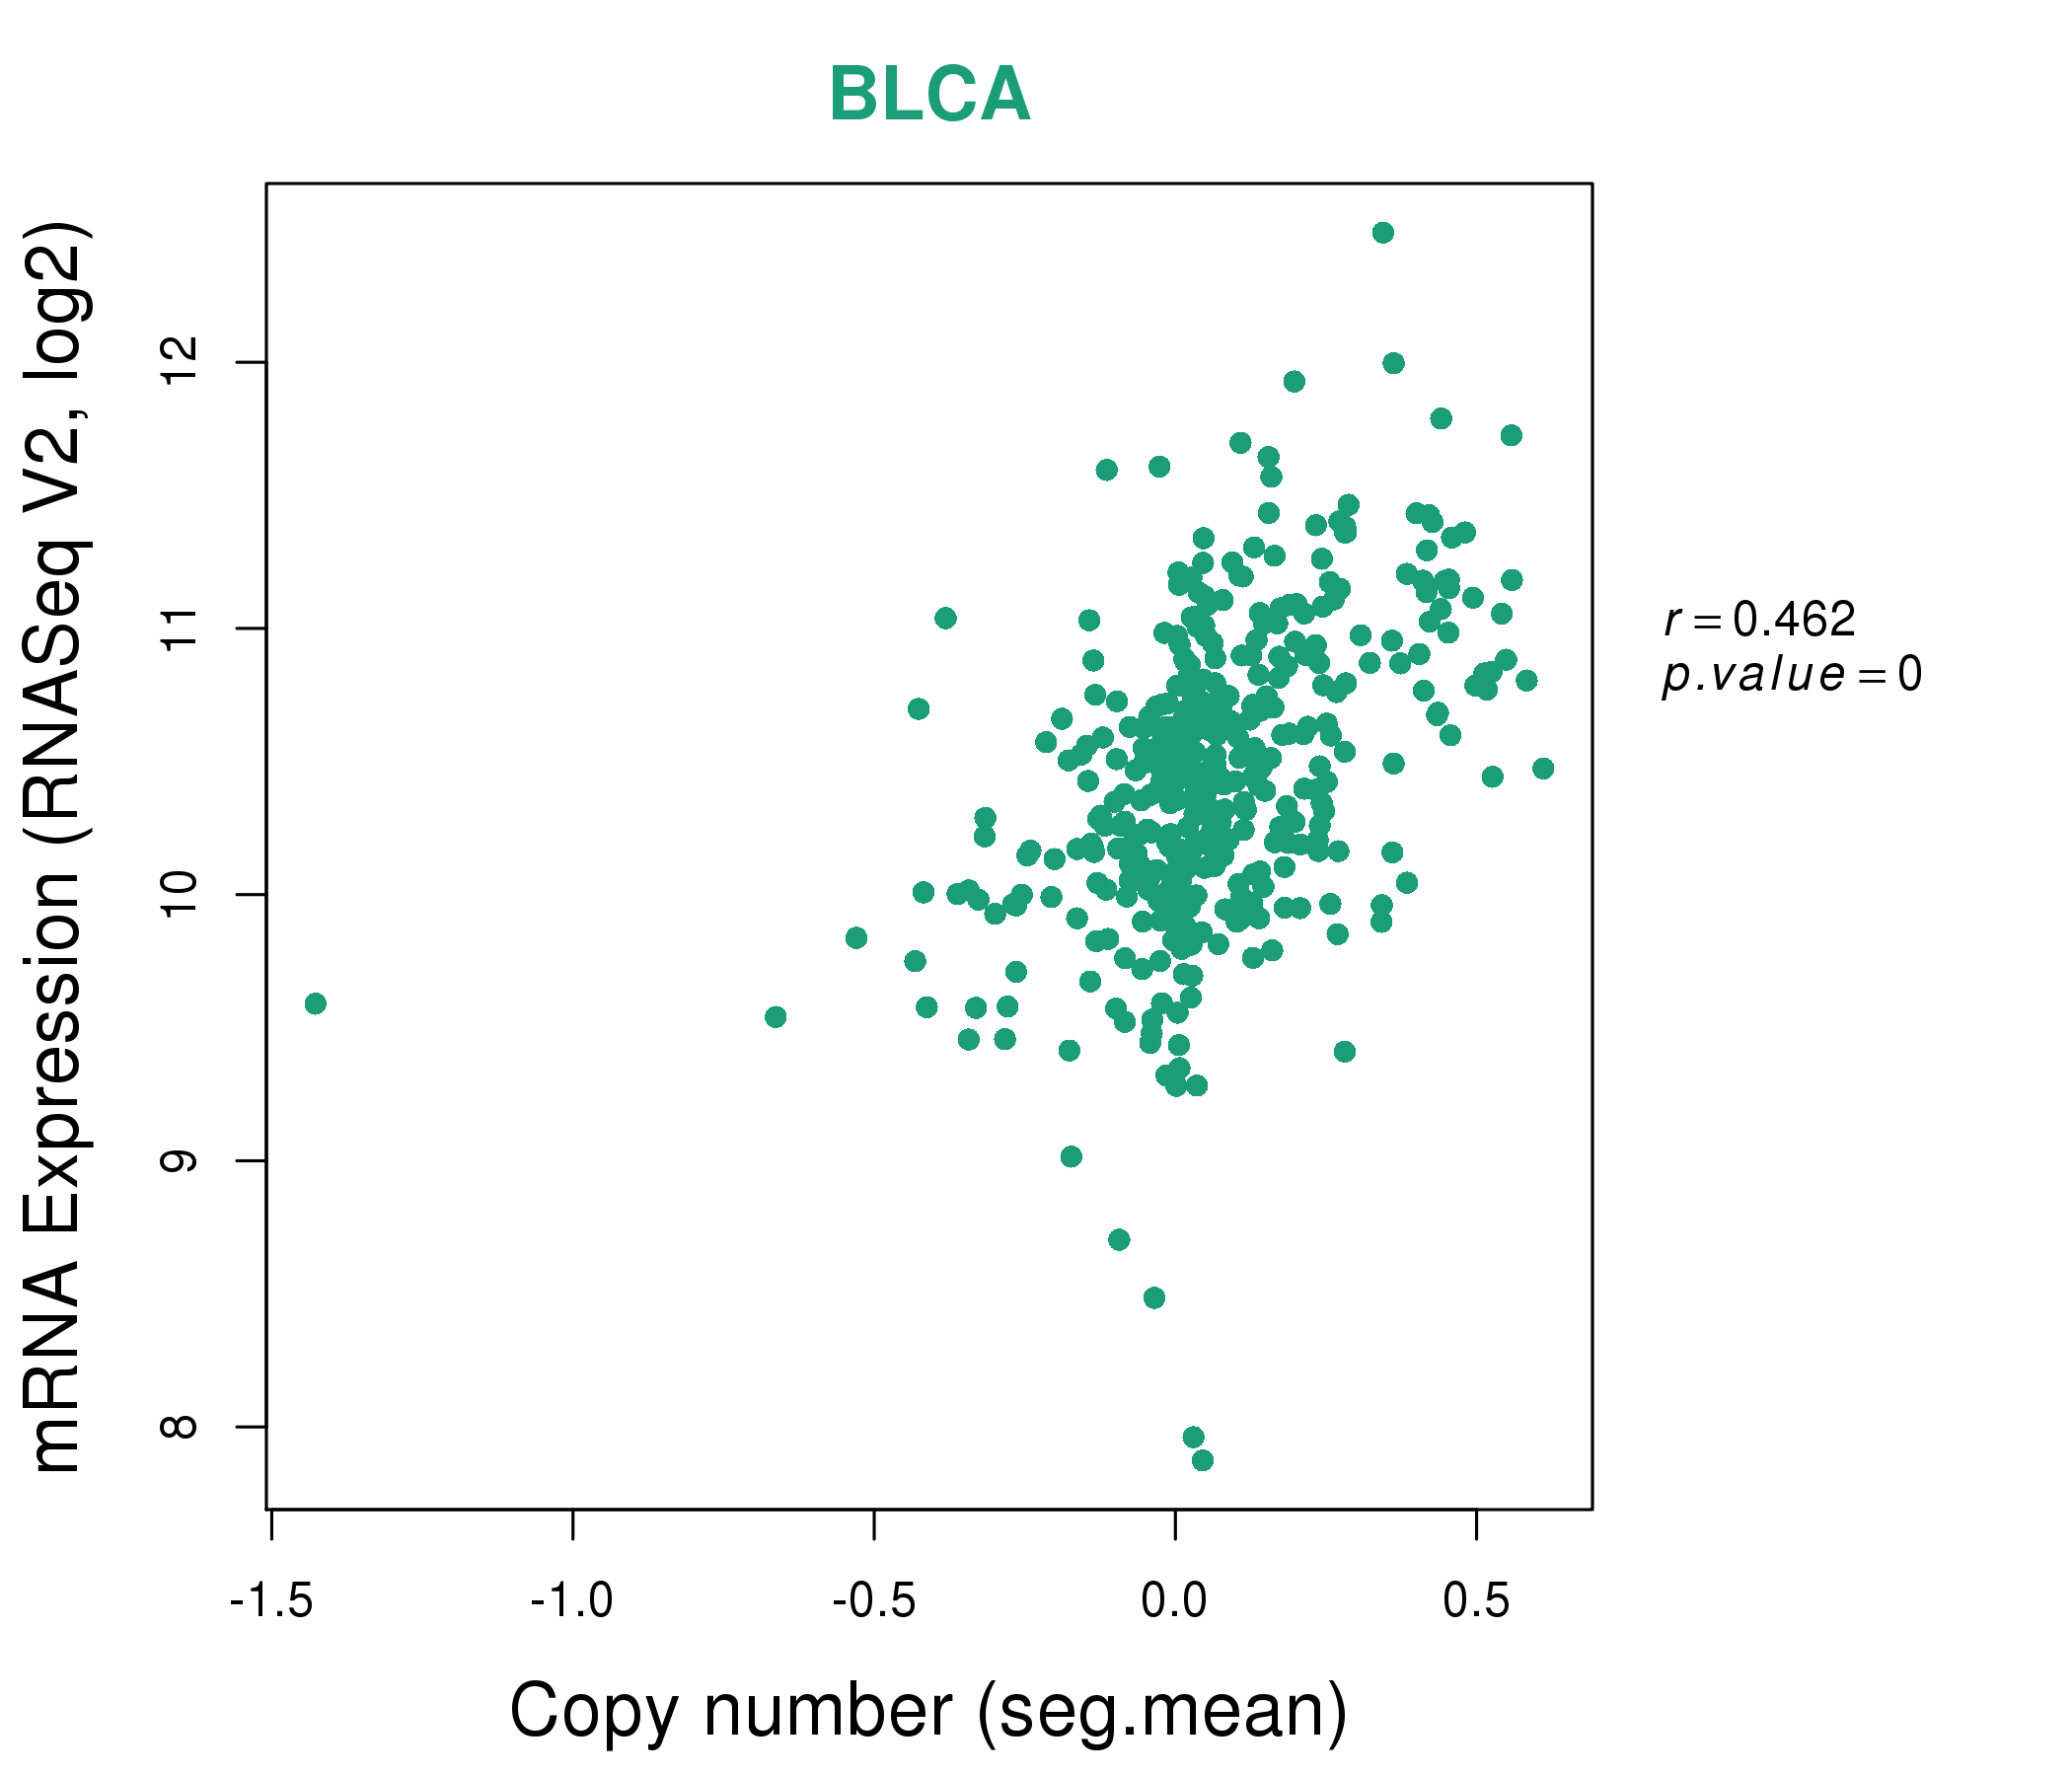
| * This plots show the correlation between CNV and gene expression. |
: Open all plots for all cancer types
 |
|
 |
|
| Top |
| Gene-Gene Network Information |
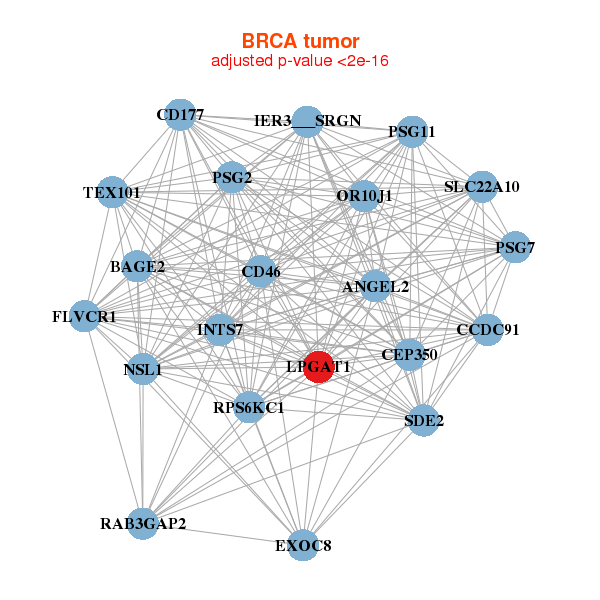
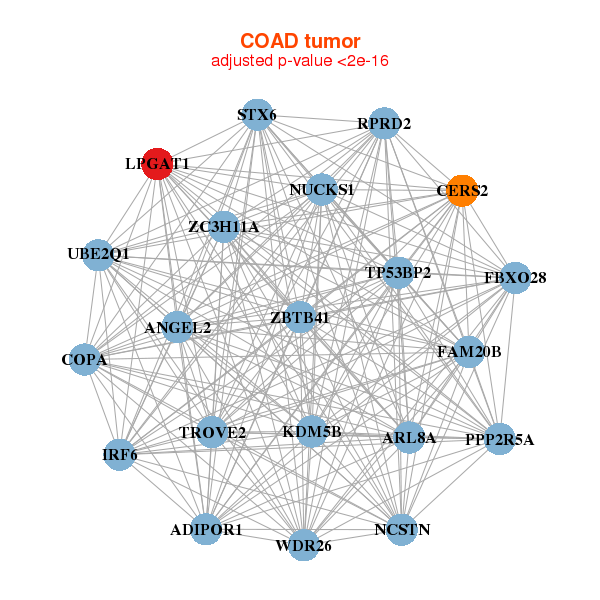
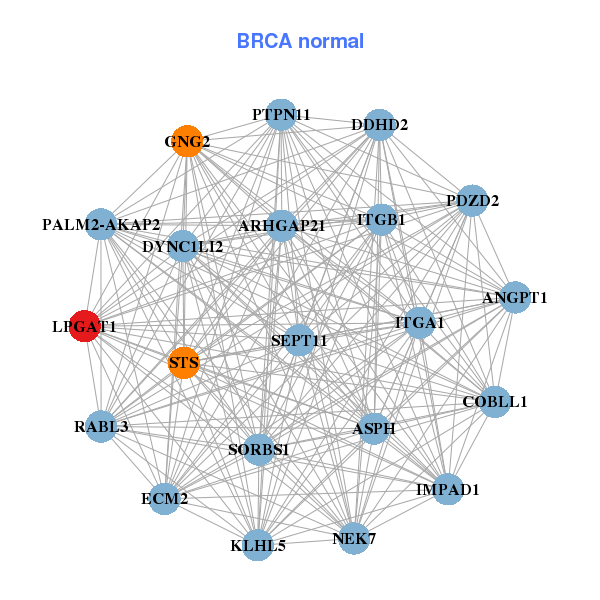
| * Co-Expression network figures were drawn using R package igraph. Only the top 20 genes with the highest correlations were shown. Red circle: input gene, orange circle: cell metabolism gene, sky circle: other gene |
: Open all plots for all cancer types
 |
|
| ANGEL2,BAGE2,SDE2,CCDC91,CD177,CD46,CEP350, EXOC8,FLVCR1,INTS7,LPGAT1,NSL1,OR10J1,IER3___SRGN, PSG11,PSG2,PSG7,RAB3GAP2,RPS6KC1,SLC22A10,TEX101 | ANGPT1,ARHGAP21,ASPH,COBLL1,DDHD2,DYNC1LI2,ECM2, GNG2,IMPAD1,ITGA1,ITGB1,KLHL5,LPGAT1,NEK7, PALM2-AKAP2,PDZD2,PTPN11,RABL3,SEPT11,SORBS1,STS |
 |
|
| ADIPOR1,ANGEL2,ARL8A,COPA,FAM20B,FBXO28,IRF6, KDM5B,CERS2,LPGAT1,NCSTN,NUCKS1,PPP2R5A,RPRD2, STX6,TP53BP2,TROVE2,UBE2Q1,WDR26,ZBTB41,ZC3H11A | ABCG8,CLDN2,DEFA5,DEFA6,DSG3,RMDN3,GALNT14, KHK,LPGAT1,LRAT,MTTP,NTS,PDZD7,REG3A, SEC14L2,SLC28A1,SLC2A5,SLC5A1,SLC6A20,TMEM229A,TNFSF15 |

| * Co-Expression network figures were drawn using R package igraph. Only the top 20 genes with the highest correlations were shown. Red circle: input gene, orange circle: cell metabolism gene, sky circle: other gene |
: Open all plots for all cancer types
| Top |
: Open all interacting genes' information including KEGG pathway for all interacting genes from DAVID
| Top |
| Pharmacological Information for LPGAT1 |
| There's no related Drug. |
| Top |
| Cross referenced IDs for LPGAT1 |
| * We obtained these cross-references from Uniprot database. It covers 150 different DBs, 18 categories. http://www.uniprot.org/help/cross_references_section |
: Open all cross reference information
|
Copyright © 2016-Present - The Univsersity of Texas Health Science Center at Houston @ |