|
||||||||||||||||||||||||||||||||||||||||||||||||||||||||||||||||||||||||||||||||||||||||||||||||||||||||||||||||||||||||||||||||||||||||||||||||||||||||||||||||||||||||||||||||||||||||||||||||||||||||||||||||||||||||||||||||||||||||||||||||||||||||||||||||||||||||||||||||||||||||||||||||||||||||||||||||||||||||||
| |
| Phenotypic Information (metabolism pathway, cancer, disease, phenome) |
| |
| |
| Gene-Gene Network Information: Co-Expression Network, Interacting Genes & KEGG |
| |
|


| Gene Summary for HS3ST2 |
| Basic gene info. | Gene symbol | HS3ST2 |
| Gene name | heparan sulfate (glucosamine) 3-O-sulfotransferase 2 | |
| Synonyms | 30ST2|3OST2 | |
| Cytomap | UCSC genome browser: 16p12 | |
| Genomic location | chr16 :22825859-22927659 | |
| Type of gene | protein-coding | |
| RefGenes | NM_006043.1, | |
| Ensembl id | ENSG00000122254 | |
| Description | 3-OST-2h3-OST-2heparan sulfate 3-O-sulfotransferase 2heparan sulfate D-glucosaminyl 3-O-sulfotransferase 2heparan sulfate glucosamine 3-O-sulfotransferase 2heparin-glucosamine 3-O-sulfotransferase | |
| Modification date | 20141207 | |
| dbXrefs | MIM : 604056 | |
| HGNC : HGNC | ||
| Ensembl : ENSG00000122254 | ||
| HPRD : 04957 | ||
| Vega : OTTHUMG00000094785 | ||
| Protein | UniProt: go to UniProt's Cross Reference DB Table | |
| Expression | CleanEX: HS_HS3ST2 | |
| BioGPS: 9956 | ||
| Gene Expression Atlas: ENSG00000122254 | ||
| The Human Protein Atlas: ENSG00000122254 | ||
| Pathway | NCI Pathway Interaction Database: HS3ST2 | |
| KEGG: HS3ST2 | ||
| REACTOME: HS3ST2 | ||
| ConsensusPathDB | ||
| Pathway Commons: HS3ST2 | ||
| Metabolism | MetaCyc: HS3ST2 | |
| HUMANCyc: HS3ST2 | ||
| Regulation | Ensembl's Regulation: ENSG00000122254 | |
| miRBase: chr16 :22,825,859-22,927,659 | ||
| TargetScan: NM_006043 | ||
| cisRED: ENSG00000122254 | ||
| Context | iHOP: HS3ST2 | |
| cancer metabolism search in PubMed: HS3ST2 | ||
| UCL Cancer Institute: HS3ST2 | ||
| Assigned class in ccmGDB | C | |
| Top |
| Phenotypic Information for HS3ST2(metabolism pathway, cancer, disease, phenome) |
| Cancer | CGAP: HS3ST2 |
| Familial Cancer Database: HS3ST2 | |
| * This gene is included in those cancer gene databases. |
|
|
|
|
|
| . | ||||||||||||||||||||||||||||||||||||||||||||||||||||||||||||||||||||||||||||||||||||||||||||||||||||||||||||||||||||||||||||||||||||||||||||||||||||||||||||||||||||||||||||||||||||||||||||||||||||||||||||||||||||||||||||||||||||||||||||||||||||||||||||||||||||||||||||||||||||||||||||||||||||||||||||||||||||
Oncogene 1 | Significant driver gene in | |||||||||||||||||||||||||||||||||||||||||||||||||||||||||||||||||||||||||||||||||||||||||||||||||||||||||||||||||||||||||||||||||||||||||||||||||||||||||||||||||||||||||||||||||||||||||||||||||||||||||||||||||||||||||||||||||||||||||||||||||||||||||||||||||||||||||||||||||||||||||||||||||||||||||||||||||||||||||
| cf) number; DB name 1 Oncogene; http://nar.oxfordjournals.org/content/35/suppl_1/D721.long, 2 Tumor Suppressor gene; https://bioinfo.uth.edu/TSGene/, 3 Cancer Gene Census; http://www.nature.com/nrc/journal/v4/n3/abs/nrc1299.html, 4 CancerGenes; http://nar.oxfordjournals.org/content/35/suppl_1/D721.long, 5 Network of Cancer Gene; http://ncg.kcl.ac.uk/index.php, 1Therapeutic Vulnerabilities in Cancer; http://cbio.mskcc.org/cancergenomics/statius/ |
| REACTOME_METABOLISM_OF_CARBOHYDRATES | |
| OMIM | |
| Orphanet | |
| Disease | KEGG Disease: HS3ST2 |
| MedGen: HS3ST2 (Human Medical Genetics with Condition) | |
| ClinVar: HS3ST2 | |
| Phenotype | MGI: HS3ST2 (International Mouse Phenotyping Consortium) |
| PhenomicDB: HS3ST2 | |
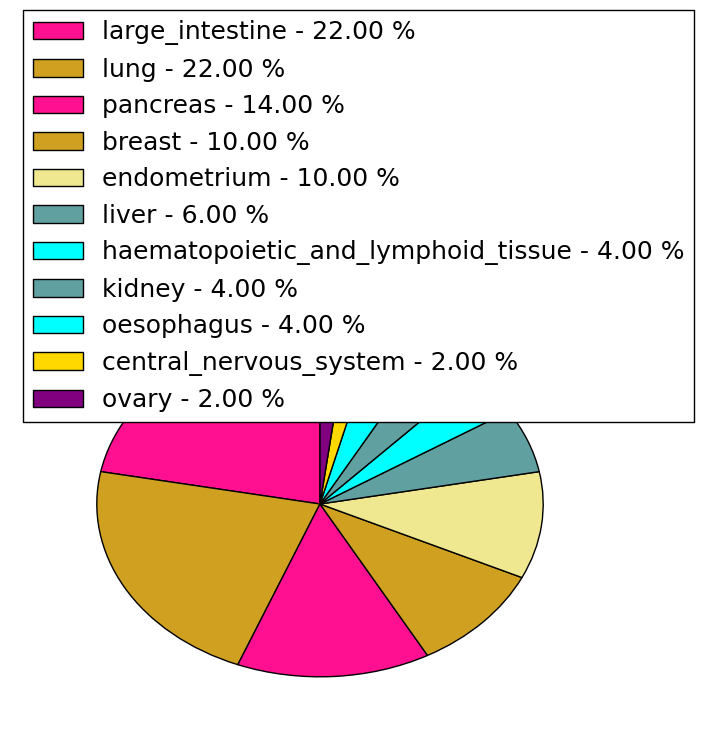
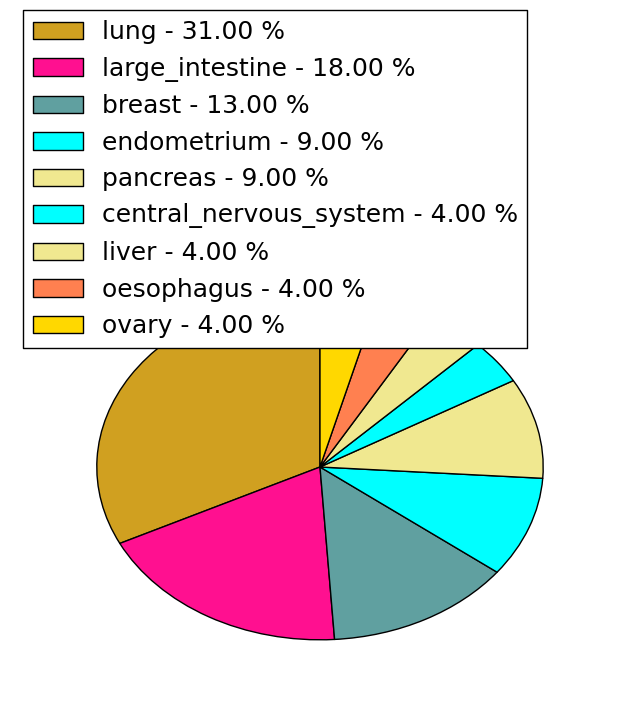
| Mutations for HS3ST2 |
| * Under tables are showing count per each tissue to give us broad intuition about tissue specific mutation patterns.You can go to the detailed page for each mutation database's web site. |
| - Statistics for Tissue and Mutation type | Top |
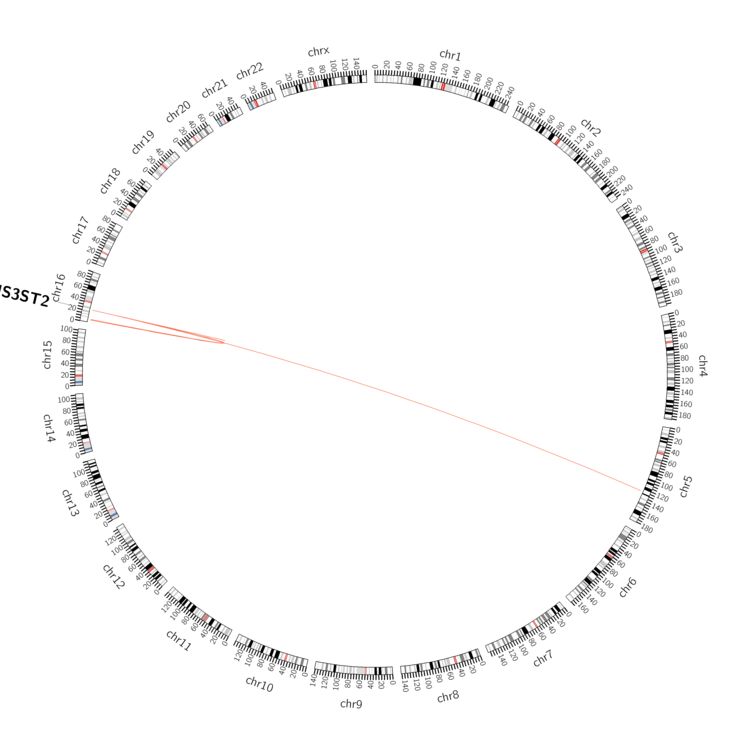 |
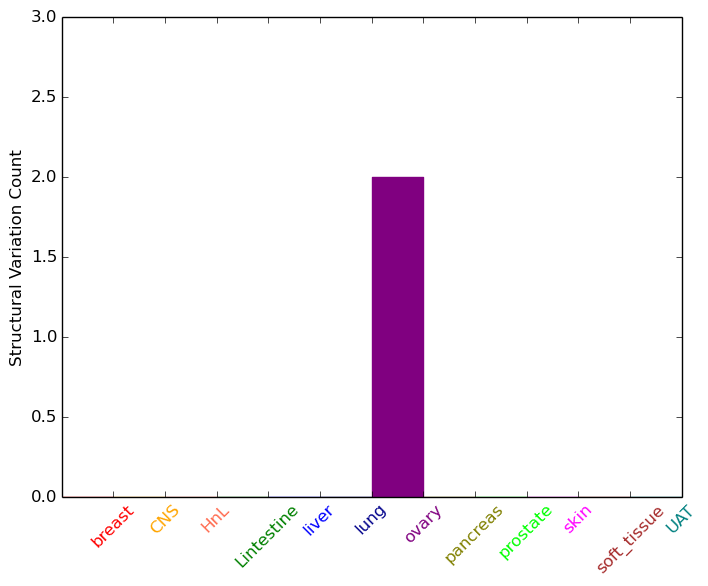
| - For Inter-chromosomal Variations |
| * Inter-chromosomal variantions includes 'interchromosomal amplicon to amplicon', 'interchromosomal amplicon to non-amplified dna', 'interchromosomal insertion', 'Interchromosomal unknown type'. |
 |
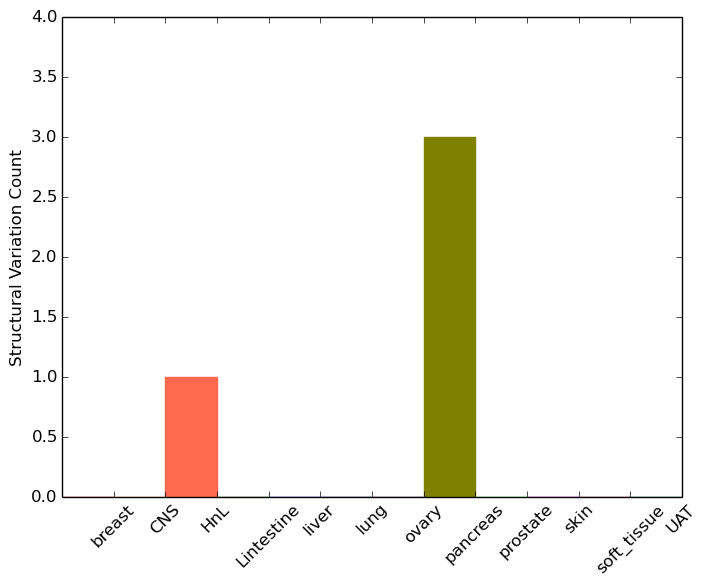
| - For Intra-chromosomal Variations |
| * Intra-chromosomal variantions includes 'intrachromosomal amplicon to amplicon', 'intrachromosomal amplicon to non-amplified dna', 'intrachromosomal deletion', 'intrachromosomal fold-back inversion', 'intrachromosomal inversion', 'intrachromosomal tandem duplication', 'Intrachromosomal unknown type', 'intrachromosomal with inverted orientation', 'intrachromosomal with non-inverted orientation'. |
 |
| Sample | Symbol_a | Chr_a | Start_a | End_a | Symbol_b | Chr_b | Start_b | End_b |
| haematopoietic_and_lymphoid_tissue | HS3ST2 | chr16 | 22904605 | 22904605 | HS3ST2 | chr16 | 22904605 | 22904605 |
| pancreas | HS3ST2 | chr16 | 22846927 | 22846947 | chr16 | 4224173 | 4224193 | |
| pancreas | HS3ST2 | chr16 | 22861630 | 22861650 | chr16 | 5373631 | 5373651 | |
| pancreas | HS3ST2 | chr16 | 22893967 | 22893987 | HS3ST2 | chr16 | 22896410 | 22896430 |
| cf) Tissue number; Tissue name (1;Breast, 2;Central_nervous_system, 3;Haematopoietic_and_lymphoid_tissue, 4;Large_intestine, 5;Liver, 6;Lung, 7;Ovary, 8;Pancreas, 9;Prostate, 10;Skin, 11;Soft_tissue, 12;Upper_aerodigestive_tract) |
| * From mRNA Sanger sequences, Chitars2.0 arranged chimeric transcripts. This table shows HS3ST2 related fusion information. |
| ID | Head Gene | Tail Gene | Accession | Gene_a | qStart_a | qEnd_a | Chromosome_a | tStart_a | tEnd_a | Gene_a | qStart_a | qEnd_a | Chromosome_a | tStart_a | tEnd_a |
| Top |
| Mutation type/ Tissue ID | brca | cns | cerv | endome | haematopo | kidn | Lintest | liver | lung | ns | ovary | pancre | prost | skin | stoma | thyro | urina | |||
| Total # sample | 1 | 1 | ||||||||||||||||||
| GAIN (# sample) | 1 | |||||||||||||||||||
| LOSS (# sample) | 1 |
| cf) Tissue ID; Tissue type (1; Breast, 2; Central_nervous_system, 3; Cervix, 4; Endometrium, 5; Haematopoietic_and_lymphoid_tissue, 6; Kidney, 7; Large_intestine, 8; Liver, 9; Lung, 10; NS, 11; Ovary, 12; Pancreas, 13; Prostate, 14; Skin, 15; Stomach, 16; Thyroid, 17; Urinary_tract) |
| Top |
|
 |
| Top |
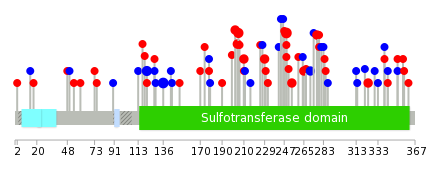
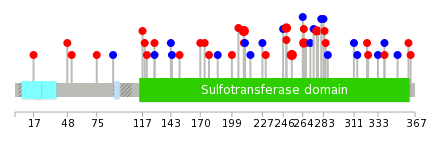
| Stat. for Non-Synonymous SNVs (# total SNVs=50) | (# total SNVs=22) |
 |  |
(# total SNVs=0) | (# total SNVs=0) |
| Top |
| * When you move the cursor on each content, you can see more deailed mutation information on the Tooltip. Those are primary_site,primary_histology,mutation(aa),pubmedID. |
| GRCh37 position | Mutation(aa) | Unique sampleID count |
| chr16:22926524-22926524 | p.R249C | 4 |
| chr16:22826339-22826339 | p.V136V | 4 |
| chr16:22926393-22926393 | p.R205Q | 3 |
| chr16:22826294-22826294 | p.G121G | 3 |
| chr16:22926818-22926818 | p.E347* | 2 |
| chr16:22926605-22926605 | p.R276* | 2 |
| chr16:22926525-22926525 | p.R249L | 2 |
| chr16:22926609-22926609 | p.L277H | 2 |
| chr16:22926750-22926750 | p.R324Q | 2 |
| chr16:22926383-22926383 | p.V202M | 2 |
| Top |
|
 |
| Point Mutation/ Tissue ID | 1 | 2 | 3 | 4 | 5 | 6 | 7 | 8 | 9 | 10 | 11 | 12 | 13 | 14 | 15 | 16 | 17 | 18 | 19 | 20 |
| # sample | 1 | 4 | 8 | 1 | 1 | 1 | 1 | 8 | 2 | 2 | 1 | 10 | 11 | 1 | 6 | |||||
| # mutation | 1 | 4 | 8 | 1 | 1 | 1 | 1 | 8 | 2 | 2 | 1 | 11 | 10 | 1 | 6 | |||||
| nonsynonymous SNV | 2 | 5 | 1 | 1 | 1 | 6 | 2 | 1 | 1 | 5 | 8 | 1 | 4 | |||||||
| synonymous SNV | 1 | 2 | 3 | 1 | 2 | 1 | 6 | 2 | 2 |
| cf) Tissue ID; Tissue type (1; BLCA[Bladder Urothelial Carcinoma], 2; BRCA[Breast invasive carcinoma], 3; CESC[Cervical squamous cell carcinoma and endocervical adenocarcinoma], 4; COAD[Colon adenocarcinoma], 5; GBM[Glioblastoma multiforme], 6; Glioma Low Grade, 7; HNSC[Head and Neck squamous cell carcinoma], 8; KICH[Kidney Chromophobe], 9; KIRC[Kidney renal clear cell carcinoma], 10; KIRP[Kidney renal papillary cell carcinoma], 11; LAML[Acute Myeloid Leukemia], 12; LUAD[Lung adenocarcinoma], 13; LUSC[Lung squamous cell carcinoma], 14; OV[Ovarian serous cystadenocarcinoma ], 15; PAAD[Pancreatic adenocarcinoma], 16; PRAD[Prostate adenocarcinoma], 17; SKCM[Skin Cutaneous Melanoma], 18:STAD[Stomach adenocarcinoma], 19:THCA[Thyroid carcinoma], 20:UCEC[Uterine Corpus Endometrial Carcinoma]) |
| Top |
| * We represented just top 10 SNVs. When you move the cursor on each content, you can see more deailed mutation information on the Tooltip. Those are primary_site, primary_histology, mutation(aa), pubmedID. |
| Genomic Position | Mutation(aa) | Unique sampleID count |
| chr16:22926539 | p.V254M | 3 |
| chr16:22926408 | p.R210H | 3 |
| chr16:22926524 | p.R249C | 2 |
| chr16:22926572 | p.P265S | 2 |
| chr16:22926609 | p.L277H | 2 |
| chr16:22926300 | p.T216T | 1 |
| chr16:22926778 | p.G283G | 1 |
| chr16:22926517 | p.I119V | 1 |
| chr16:22926611 | p.T227T | 1 |
| chr16:22826201 | p.E284K | 1 |
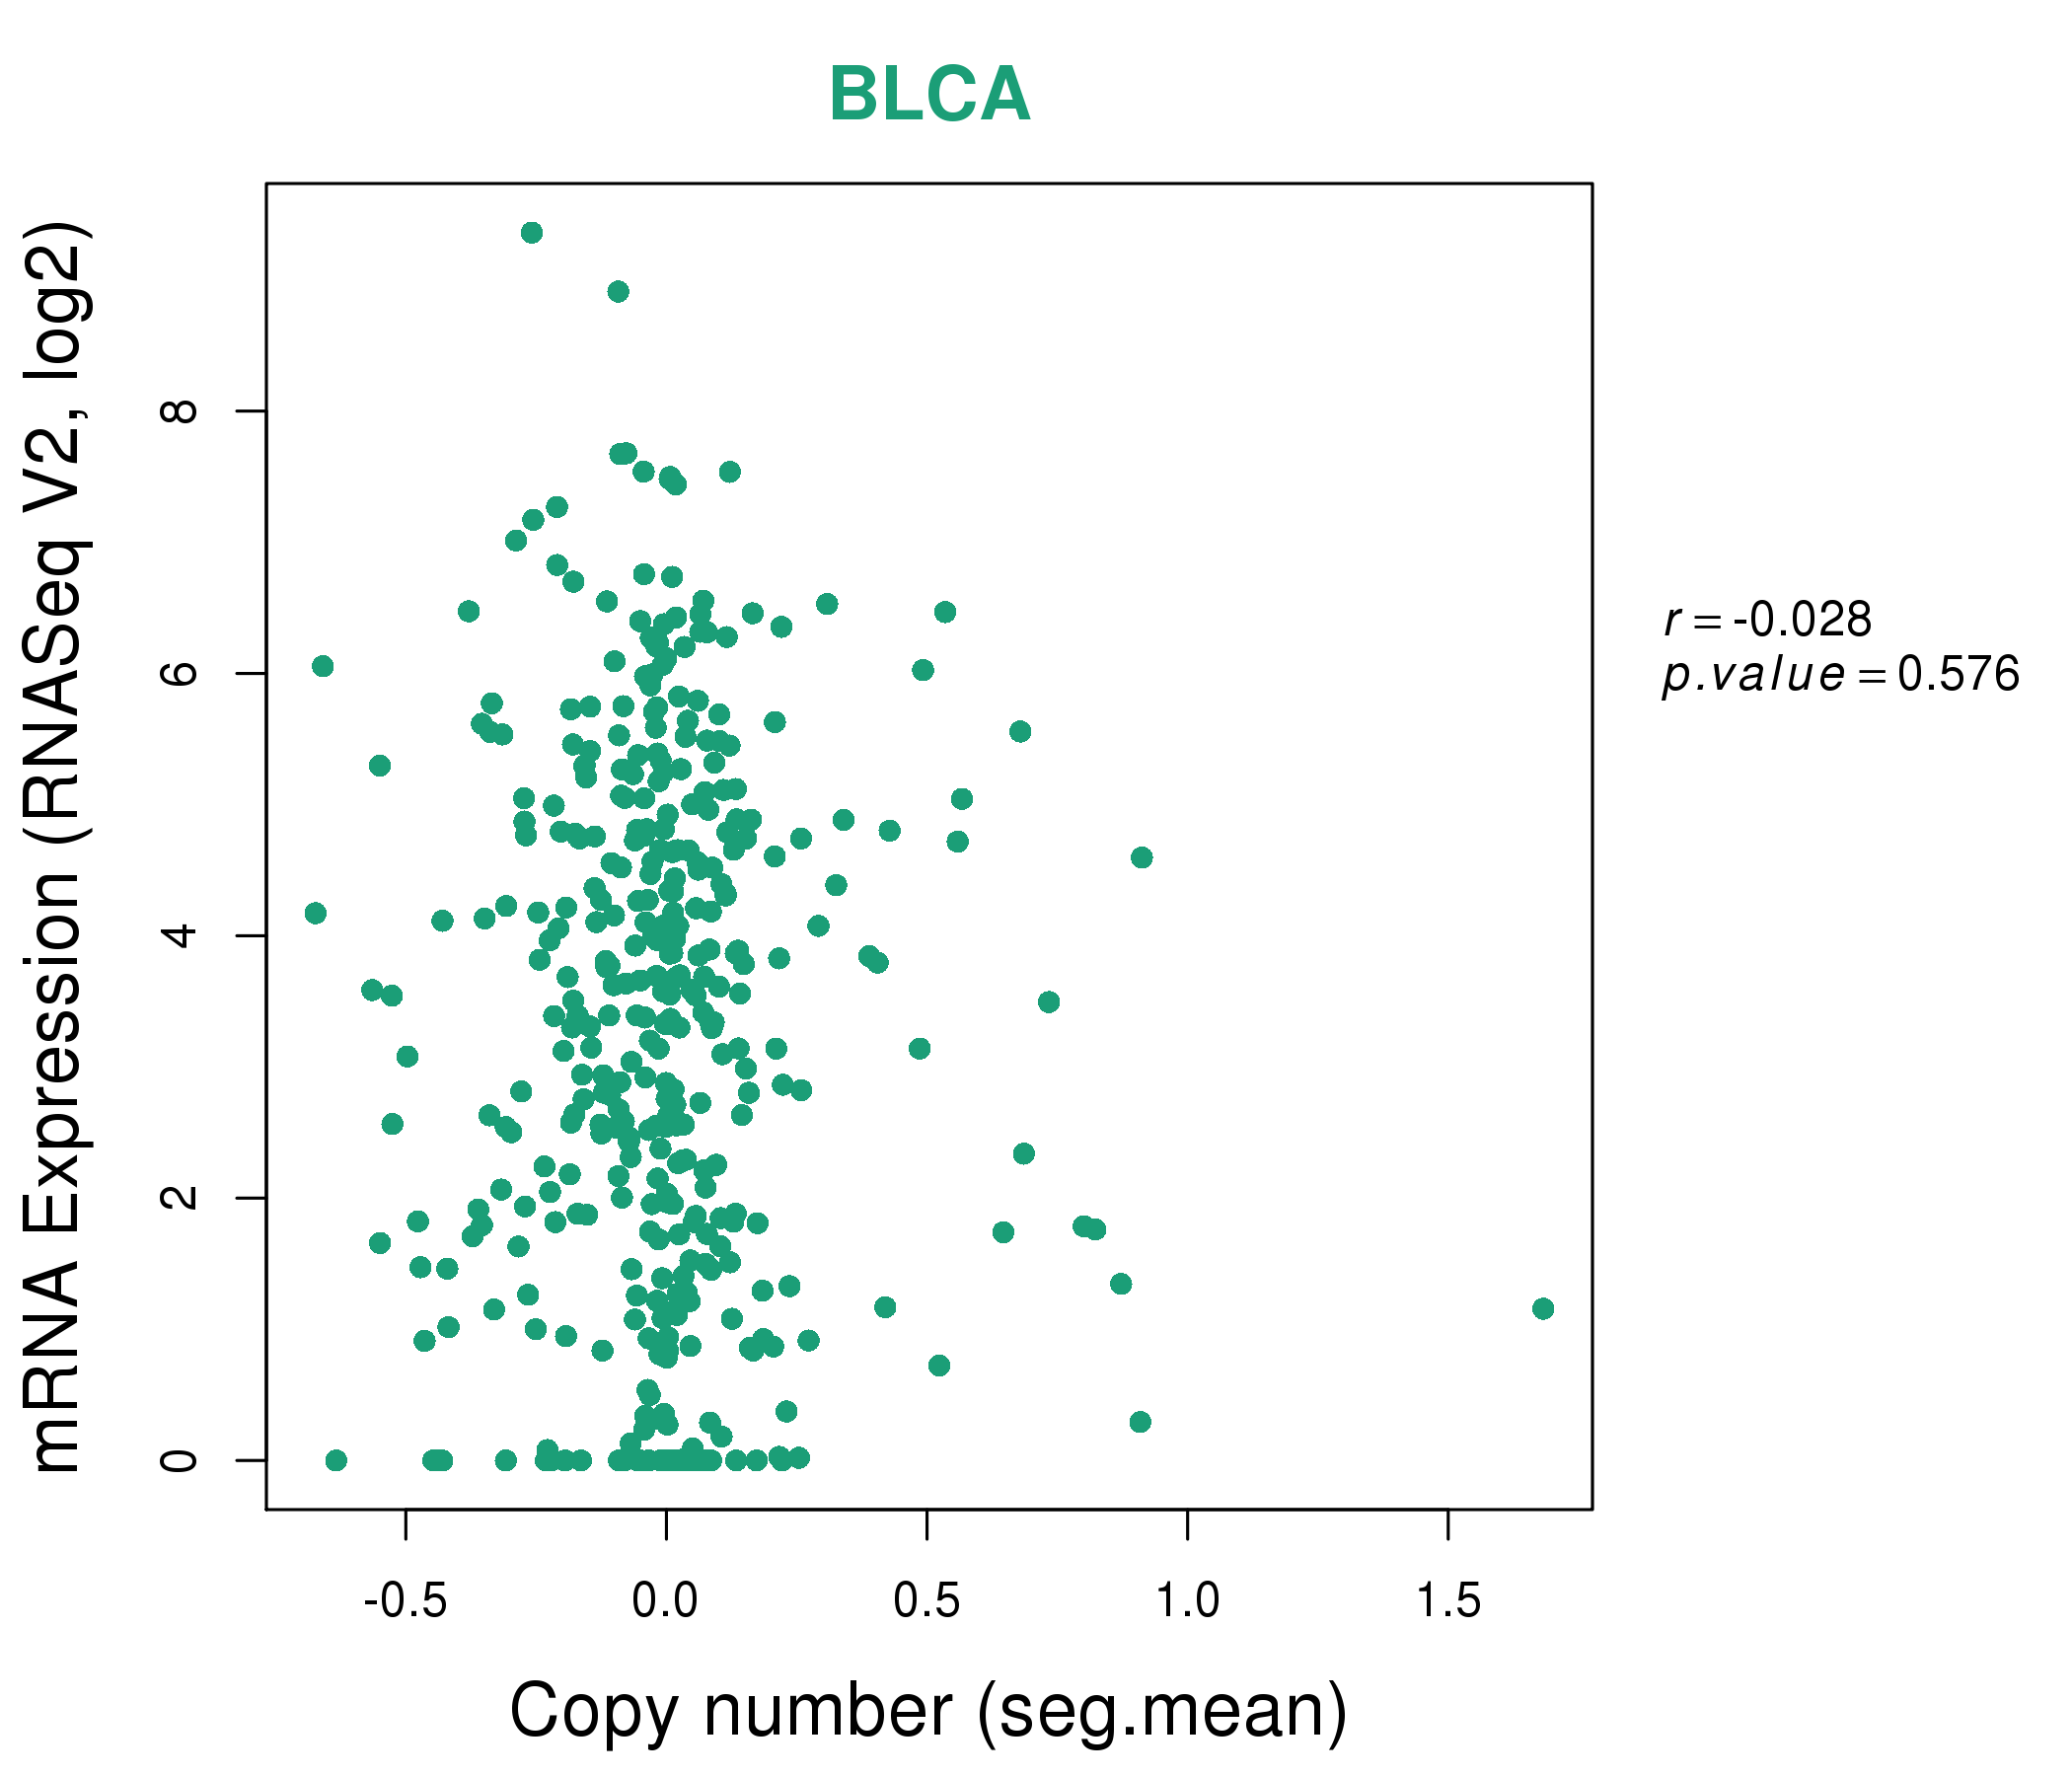
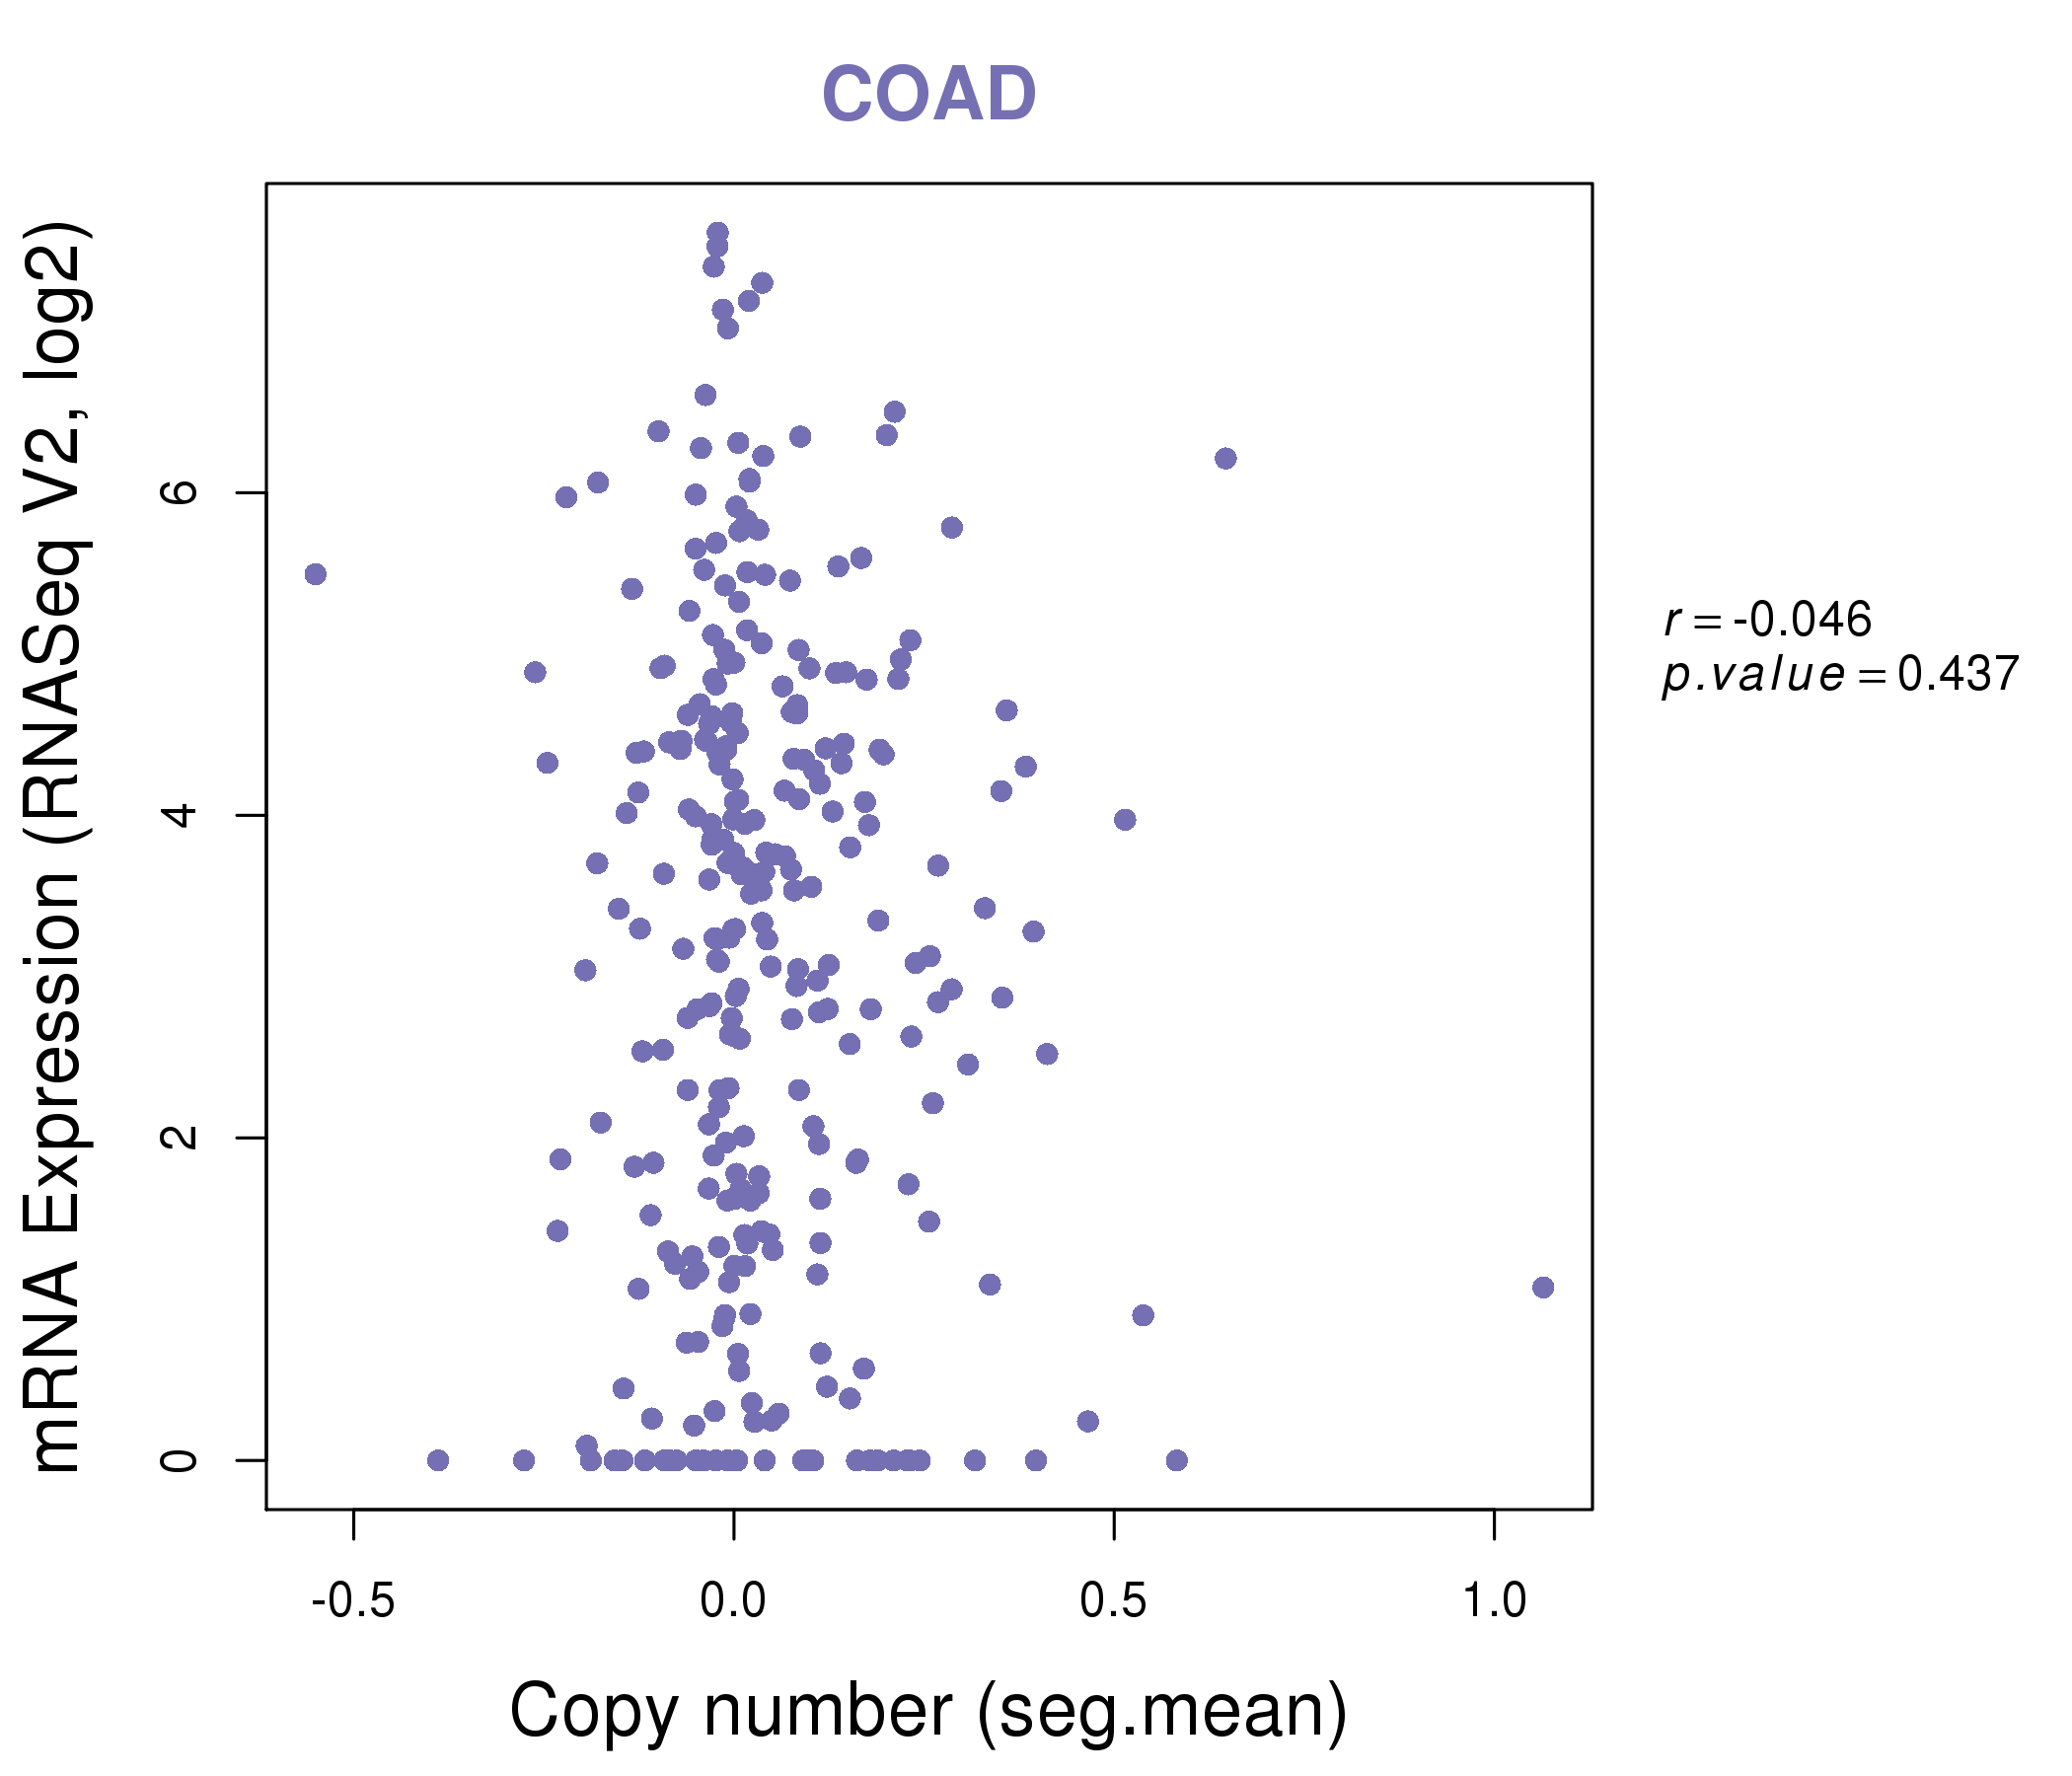
| * Copy number data were extracted from TCGA using R package TCGA-Assembler. The URLs of all public data files on TCGA DCC data server were gathered on Jan-05-2015. Function ProcessCNAData in TCGA-Assembler package was used to obtain gene-level copy number value which is calculated as the average copy number of the genomic region of a gene. |
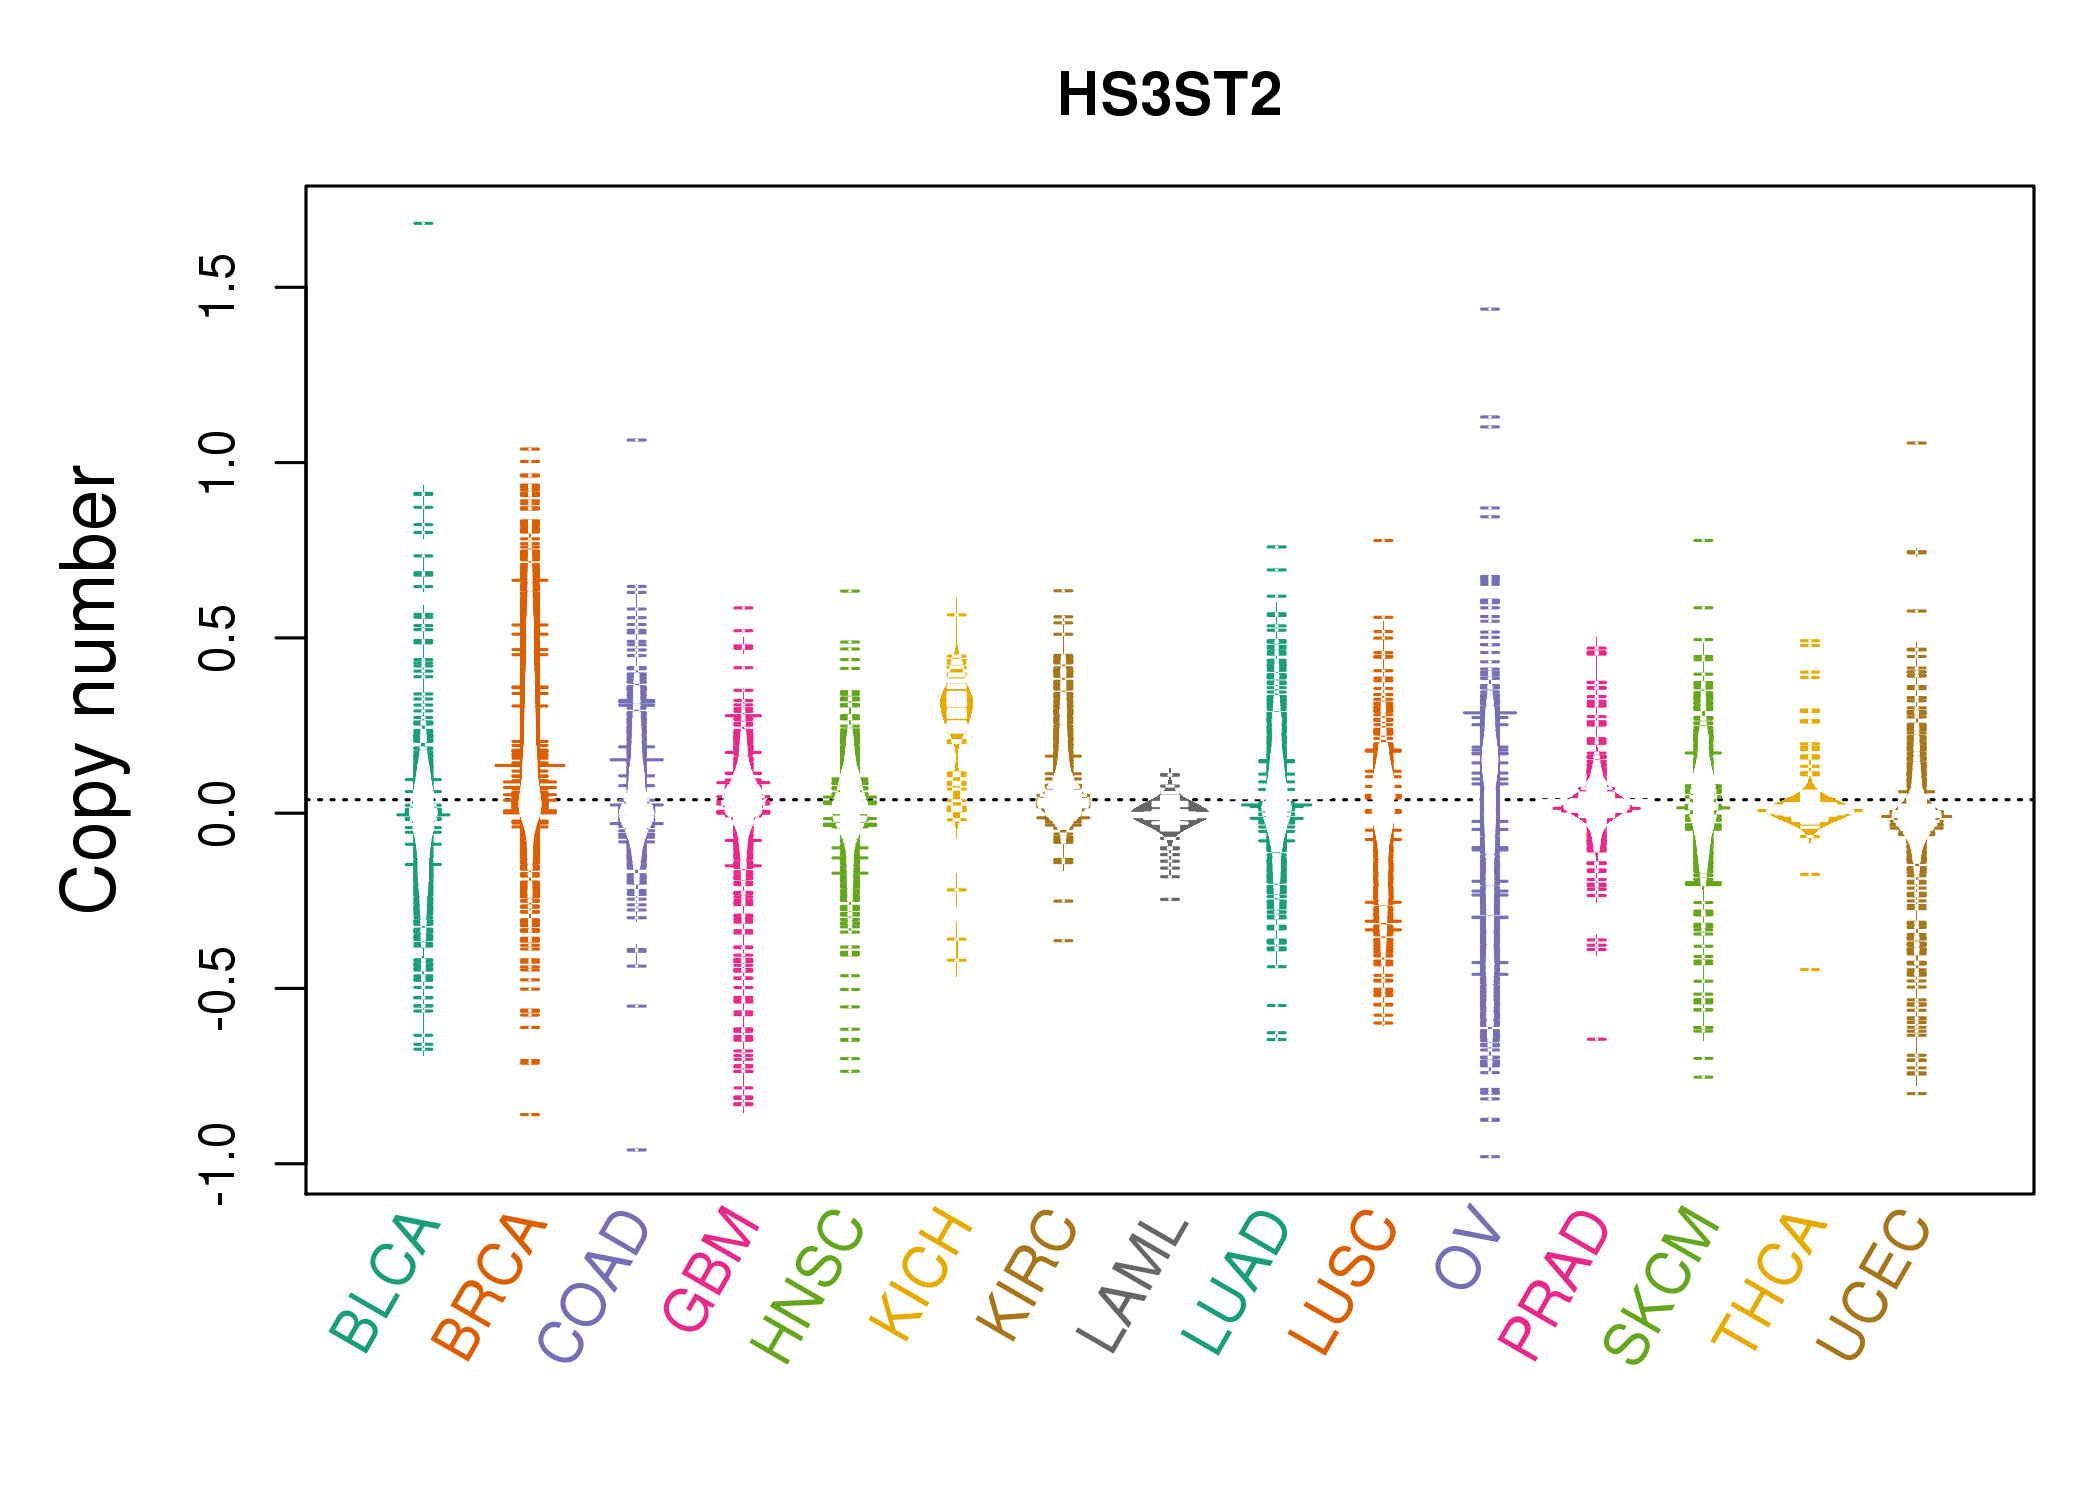 |
| cf) Tissue ID[Tissue type]: BLCA[Bladder Urothelial Carcinoma], BRCA[Breast invasive carcinoma], CESC[Cervical squamous cell carcinoma and endocervical adenocarcinoma], COAD[Colon adenocarcinoma], GBM[Glioblastoma multiforme], Glioma Low Grade, HNSC[Head and Neck squamous cell carcinoma], KICH[Kidney Chromophobe], KIRC[Kidney renal clear cell carcinoma], KIRP[Kidney renal papillary cell carcinoma], LAML[Acute Myeloid Leukemia], LUAD[Lung adenocarcinoma], LUSC[Lung squamous cell carcinoma], OV[Ovarian serous cystadenocarcinoma ], PAAD[Pancreatic adenocarcinoma], PRAD[Prostate adenocarcinoma], SKCM[Skin Cutaneous Melanoma], STAD[Stomach adenocarcinoma], THCA[Thyroid carcinoma], UCEC[Uterine Corpus Endometrial Carcinoma] |
| Top |
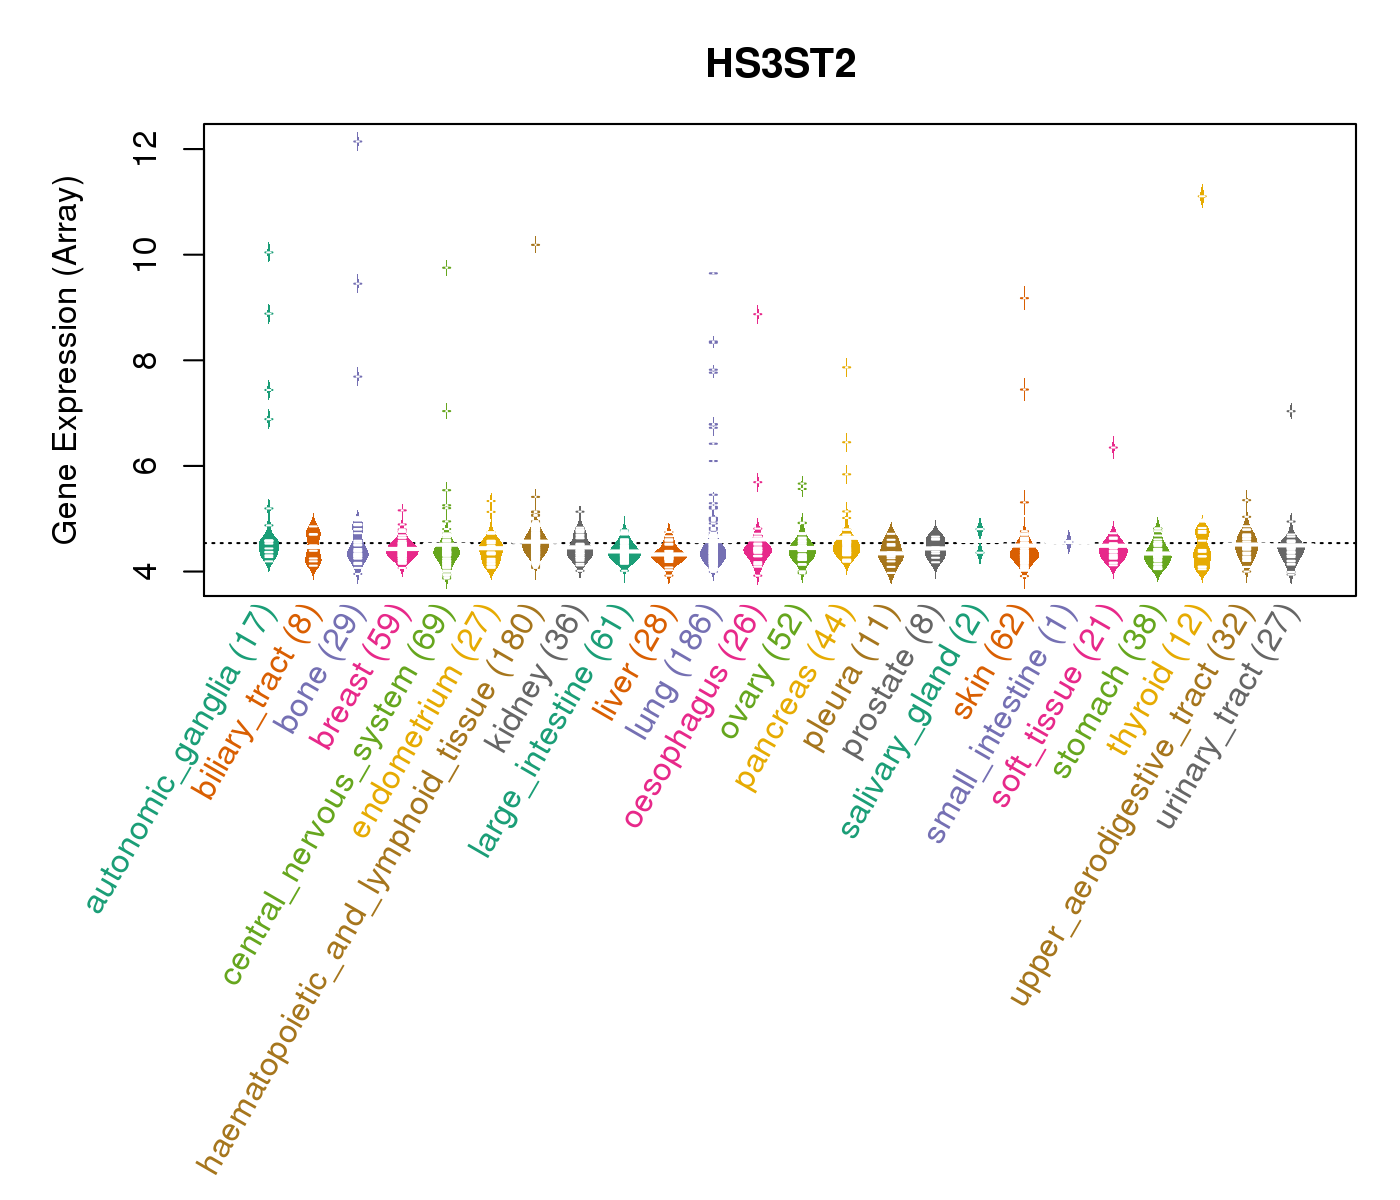
| Gene Expression for HS3ST2 |
| * CCLE gene expression data were extracted from CCLE_Expression_Entrez_2012-10-18.res: Gene-centric RMA-normalized mRNA expression data. |
 |
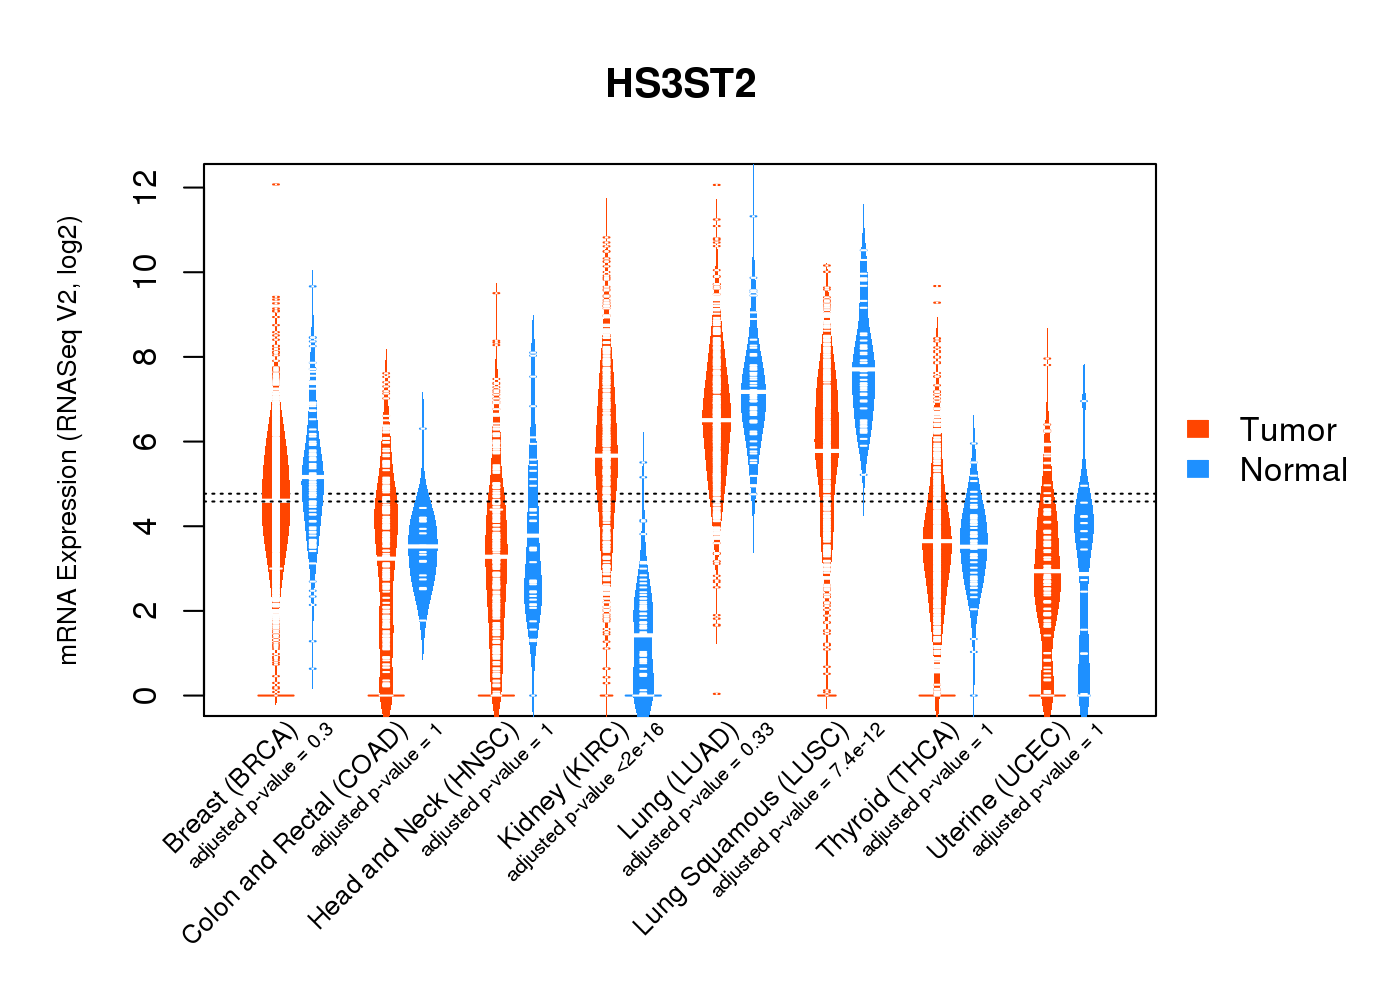
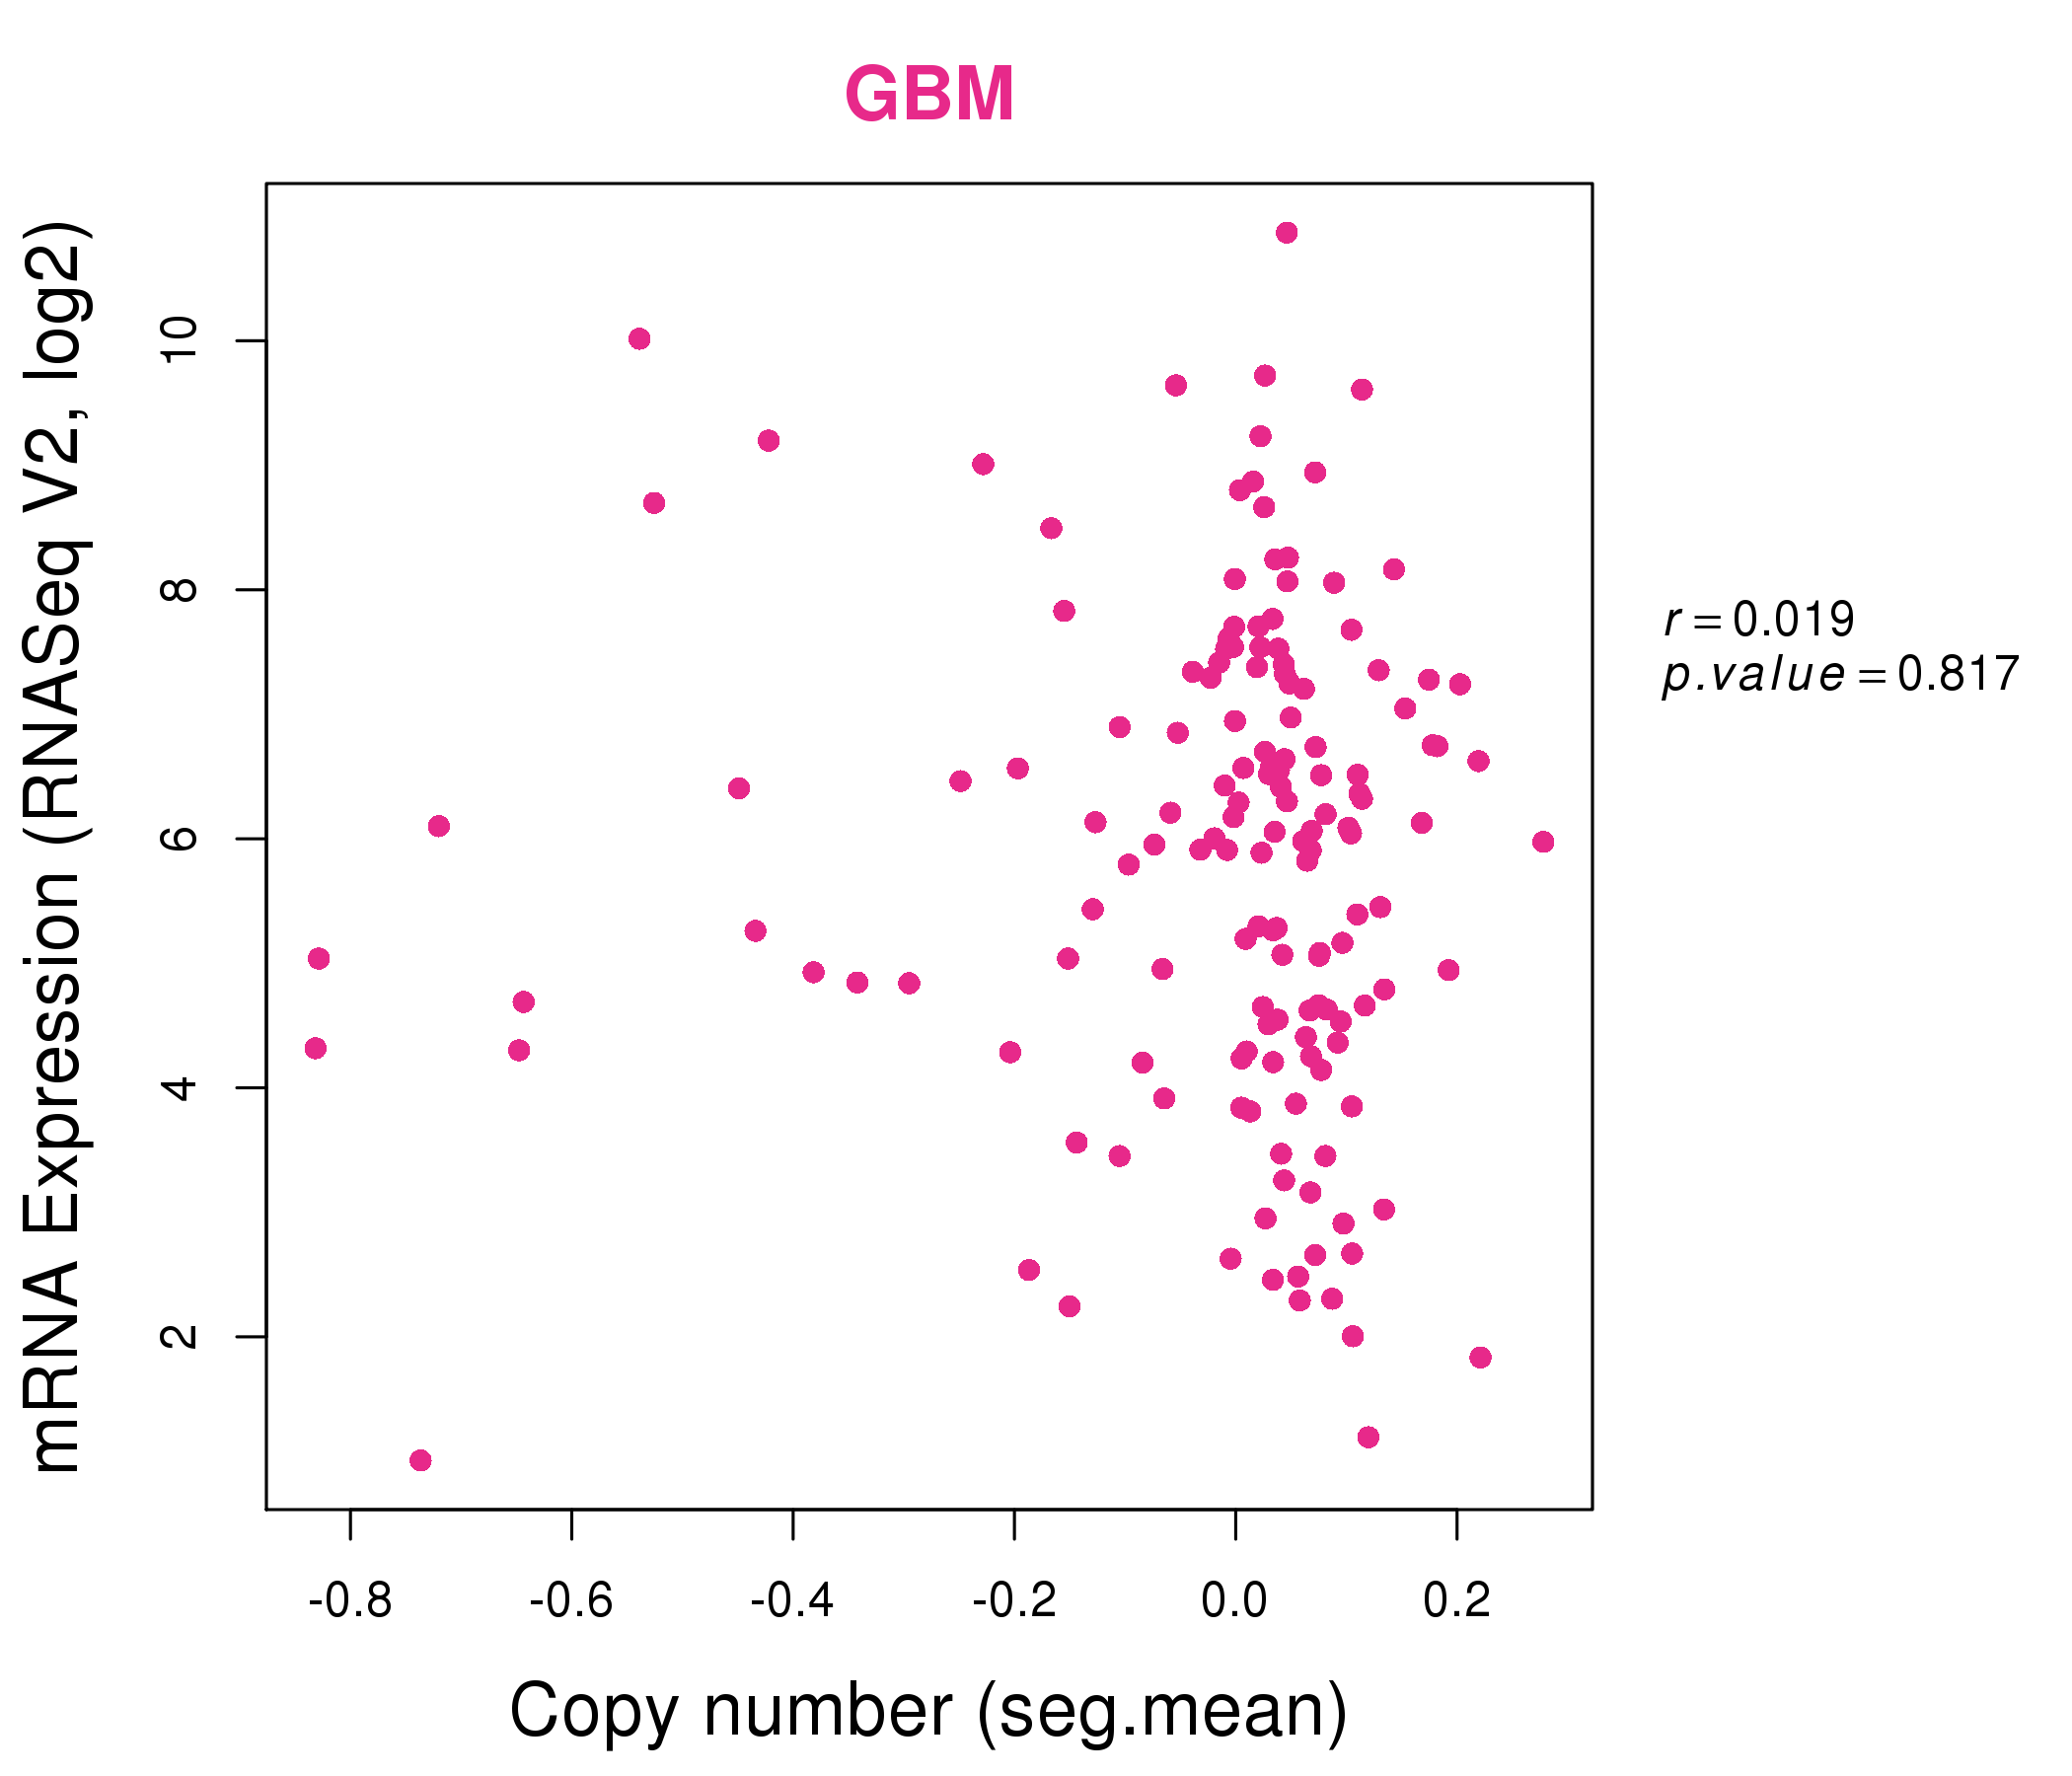
| * Normalized gene expression data of RNASeqV2 was extracted from TCGA using R package TCGA-Assembler. The URLs of all public data files on TCGA DCC data server were gathered at Jan-05-2015. Only eight cancer types have enough normal control samples for differential expression analysis. (t test, adjusted p<0.05 (using Benjamini-Hochberg FDR)) |
 |
| Top |
| * This plots show the correlation between CNV and gene expression. |
: Open all plots for all cancer types
 |
|
 |
|

| Top |
| Gene-Gene Network Information |
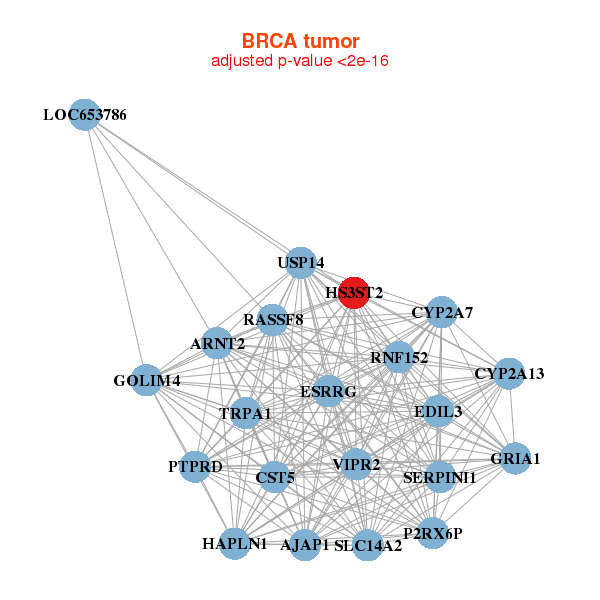
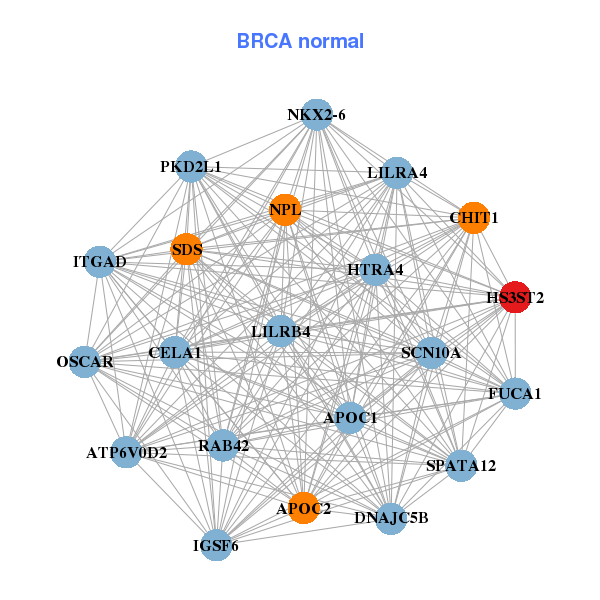
| * Co-Expression network figures were drawn using R package igraph. Only the top 20 genes with the highest correlations were shown. Red circle: input gene, orange circle: cell metabolism gene, sky circle: other gene |
: Open all plots for all cancer types
 |
|
| AJAP1,ARNT2,CST5,CYP2A13,CYP2A7,EDIL3,ESRRG, GOLIM4,GRIA1,HAPLN1,HS3ST2,LOC653786,P2RX6P,PTPRD, RASSF8,RNF152,SERPINI1,SLC14A2,TRPA1,USP14,VIPR2 | APOC1,APOC2,ATP6V0D2,CELA1,CHIT1,DNAJC5B,FUCA1, HS3ST2,HTRA4,IGSF6,ITGAD,LILRA4,LILRB4,NKX2-6, NPL,OSCAR,PKD2L1,RAB42,SCN10A,SDS,SPATA12 |
 |
|
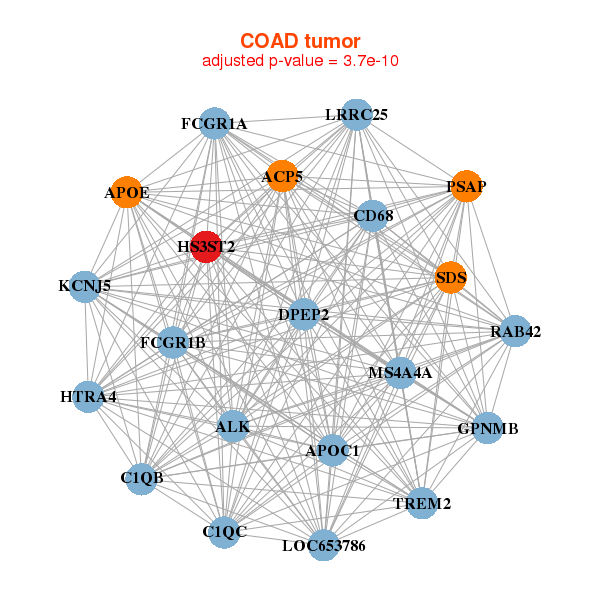
| ACP5,ALK,APOC1,APOE,C1QB,C1QC,CD68, DPEP2,FCGR1A,FCGR1B,GPNMB,HS3ST2,HTRA4,KCNJ5, LOC653786,LRRC25,MS4A4A,PSAP,RAB42,SDS,TREM2 | ACTBL2,CCL18,CHIT1,DEFB103B,DEFB4A,DUOX1,FAM74A1, FAM92A1P2,FLJ25758,HS3ST2,HTRA4,KRT6B,KRTAP13-1,LY6D, MMP10,OR1J2,PRAMEF12,RBMXL3,TM4SF19,TRIM42,XKRY2 |
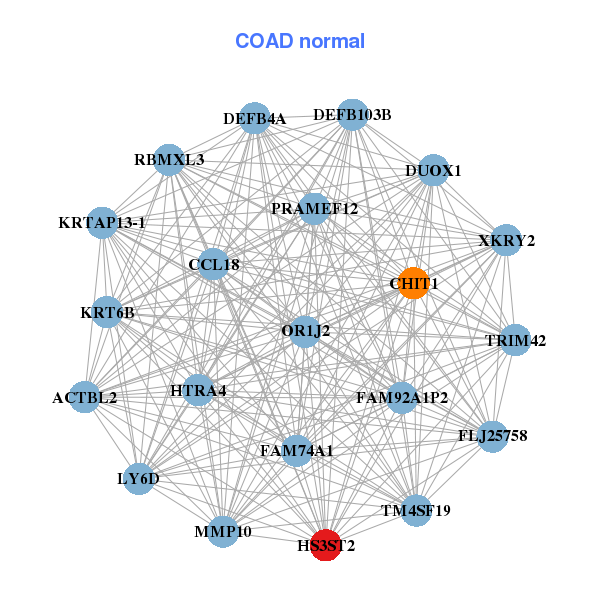
| * Co-Expression network figures were drawn using R package igraph. Only the top 20 genes with the highest correlations were shown. Red circle: input gene, orange circle: cell metabolism gene, sky circle: other gene |
: Open all plots for all cancer types
| Top |
: Open all interacting genes' information including KEGG pathway for all interacting genes from DAVID
| Top |
| Pharmacological Information for HS3ST2 |
| There's no related Drug. |
| Top |
| Cross referenced IDs for HS3ST2 |
| * We obtained these cross-references from Uniprot database. It covers 150 different DBs, 18 categories. http://www.uniprot.org/help/cross_references_section |
: Open all cross reference information
|
Copyright © 2016-Present - The Univsersity of Texas Health Science Center at Houston @ |