|
||||||||||||||||||||||||||||||||||||||||||||||||||||||||||||||||||||||||||||||||||||||||||||||||||||||||||||||||||||||||||||||||||||||||||||||||||||||||||||||||||||||||||||||||||||||||||||||||||||||||||||||||||||||||||||||||||||||||||||||||||||||||||||||||||||||||||||||||||||||||||||||||||||||||||||||||||||||||||
| |
| Phenotypic Information (metabolism pathway, cancer, disease, phenome) |
| |
| |
| Gene-Gene Network Information: Co-Expression Network, Interacting Genes & KEGG |
| |
|


| Gene Summary for SLC23A2 |
| Basic gene info. | Gene symbol | SLC23A2 |
| Gene name | solute carrier family 23 (ascorbic acid transporter), member 2 | |
| Synonyms | NBTL1|SLC23A1|SVCT2|YSPL2 | |
| Cytomap | UCSC genome browser: 20p13 | |
| Genomic location | chr20 :4833001-4990939 | |
| Type of gene | protein-coding | |
| RefGenes | NM_005116.5, NM_203327.1, | |
| Ensembl id | ENSG00000089057 | |
| Description | Na(+)/L-ascorbic acid transporter 2hSVCT2nucleobase transporter-like 1 proteinsodium-dependent vitamin C transporter-2solute carrier family 23 (nucleobase transporters), member 1solute carrier family 23 (nucleobase transporters), member 2solute carr | |
| Modification date | 20141222 | |
| dbXrefs | MIM : 603791 | |
| HGNC : HGNC | ||
| Ensembl : ENSG00000089057 | ||
| HPRD : 04811 | ||
| Vega : OTTHUMG00000031793 | ||
| Protein | UniProt: go to UniProt's Cross Reference DB Table | |
| Expression | CleanEX: HS_SLC23A2 | |
| BioGPS: 9962 | ||
| Gene Expression Atlas: ENSG00000089057 | ||
| The Human Protein Atlas: ENSG00000089057 | ||
| Pathway | NCI Pathway Interaction Database: SLC23A2 | |
| KEGG: SLC23A2 | ||
| REACTOME: SLC23A2 | ||
| ConsensusPathDB | ||
| Pathway Commons: SLC23A2 | ||
| Metabolism | MetaCyc: SLC23A2 | |
| HUMANCyc: SLC23A2 | ||
| Regulation | Ensembl's Regulation: ENSG00000089057 | |
| miRBase: chr20 :4,833,001-4,990,939 | ||
| TargetScan: NM_005116 | ||
| cisRED: ENSG00000089057 | ||
| Context | iHOP: SLC23A2 | |
| cancer metabolism search in PubMed: SLC23A2 | ||
| UCL Cancer Institute: SLC23A2 | ||
| Assigned class in ccmGDB | C | |
| Top |
| Phenotypic Information for SLC23A2(metabolism pathway, cancer, disease, phenome) |
| Cancer | CGAP: SLC23A2 |
| Familial Cancer Database: SLC23A2 | |
| * This gene is included in those cancer gene databases. |
|
|
|
|
|
|
| ||||||||||||||||||||||||||||||||||||||||||||||||||||||||||||||||||||||||||||||||||||||||||||||||||||||||||||||||||||||||||||||||||||||||||||||||||||||||||||||||||||||||||||||||||||||||||||||||||||||||||||||||||||||||||||||||||||||||||||||||||||||||||||||||||||||||||||||||||||||||||||||||||||||||||||||||||||
Oncogene 1 | Significant driver gene in | |||||||||||||||||||||||||||||||||||||||||||||||||||||||||||||||||||||||||||||||||||||||||||||||||||||||||||||||||||||||||||||||||||||||||||||||||||||||||||||||||||||||||||||||||||||||||||||||||||||||||||||||||||||||||||||||||||||||||||||||||||||||||||||||||||||||||||||||||||||||||||||||||||||||||||||||||||||||||
| cf) number; DB name 1 Oncogene; http://nar.oxfordjournals.org/content/35/suppl_1/D721.long, 2 Tumor Suppressor gene; https://bioinfo.uth.edu/TSGene/, 3 Cancer Gene Census; http://www.nature.com/nrc/journal/v4/n3/abs/nrc1299.html, 4 CancerGenes; http://nar.oxfordjournals.org/content/35/suppl_1/D721.long, 5 Network of Cancer Gene; http://ncg.kcl.ac.uk/index.php, 1Therapeutic Vulnerabilities in Cancer; http://cbio.mskcc.org/cancergenomics/statius/ |
| REACTOME_METABOLISM_OF_VITAMINS_AND_COFACTORS | |
| Mutations for SLC23A2 |
| * Under tables are showing count per each tissue to give us broad intuition about tissue specific mutation patterns.You can go to the detailed page for each mutation database's web site. |
| - Statistics for Tissue and Mutation type | Top |
 |
| - For Inter-chromosomal Variations |
| There's no inter-chromosomal structural variation. |
| - For Intra-chromosomal Variations |
| * Intra-chromosomal variantions includes 'intrachromosomal amplicon to amplicon', 'intrachromosomal amplicon to non-amplified dna', 'intrachromosomal deletion', 'intrachromosomal fold-back inversion', 'intrachromosomal inversion', 'intrachromosomal tandem duplication', 'Intrachromosomal unknown type', 'intrachromosomal with inverted orientation', 'intrachromosomal with non-inverted orientation'. |
 |
| Sample | Symbol_a | Chr_a | Start_a | End_a | Symbol_b | Chr_b | Start_b | End_b |
| ovary | SLC23A2 | chr20 | 4891940 | 4891960 | SLC23A2 | chr20 | 4859575 | 4859595 |
| ovary | SLC23A2 | chr20 | 4926518 | 4926538 | SLC23A2 | chr20 | 4922869 | 4922889 |
| cf) Tissue number; Tissue name (1;Breast, 2;Central_nervous_system, 3;Haematopoietic_and_lymphoid_tissue, 4;Large_intestine, 5;Liver, 6;Lung, 7;Ovary, 8;Pancreas, 9;Prostate, 10;Skin, 11;Soft_tissue, 12;Upper_aerodigestive_tract) |
| * From mRNA Sanger sequences, Chitars2.0 arranged chimeric transcripts. This table shows SLC23A2 related fusion information. |
| ID | Head Gene | Tail Gene | Accession | Gene_a | qStart_a | qEnd_a | Chromosome_a | tStart_a | tEnd_a | Gene_a | qStart_a | qEnd_a | Chromosome_a | tStart_a | tEnd_a |
| BF088490 | FLOT2 | 6 | 241 | 17 | 27208983 | 27209407 | SLC23A2 | 230 | 353 | 20 | 4943158 | 4943281 | |
| BM708210 | SLC23A2 | 1 | 117 | 20 | 4835006 | 4835122 | NDUFS2 | 114 | 163 | 1 | 161184136 | 161184185 | |
| BF923492 | SLC23A2 | 13 | 379 | 20 | 4864418 | 4880357 | SLC23A2 | 377 | 435 | 20 | 4883113 | 4883171 | |
| BF805458 | UBC | 12 | 217 | 12 | 125398070 | 125398278 | SLC23A2 | 211 | 399 | 20 | 4833041 | 4833227 | |
| AI497603 | RPL36 | 24 | 66 | 19 | 5691636 | 5691678 | SLC23A2 | 65 | 335 | 20 | 4833667 | 4833937 | |
| Top |
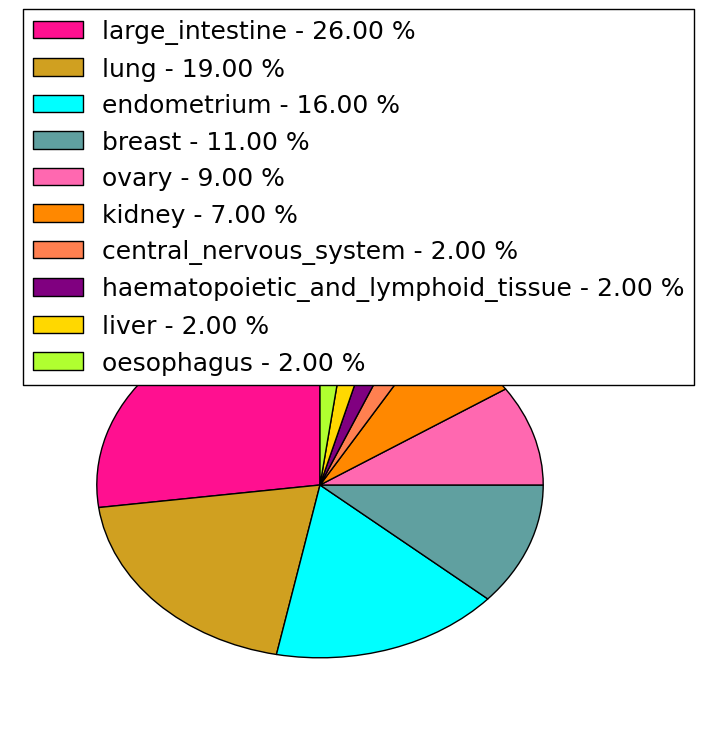
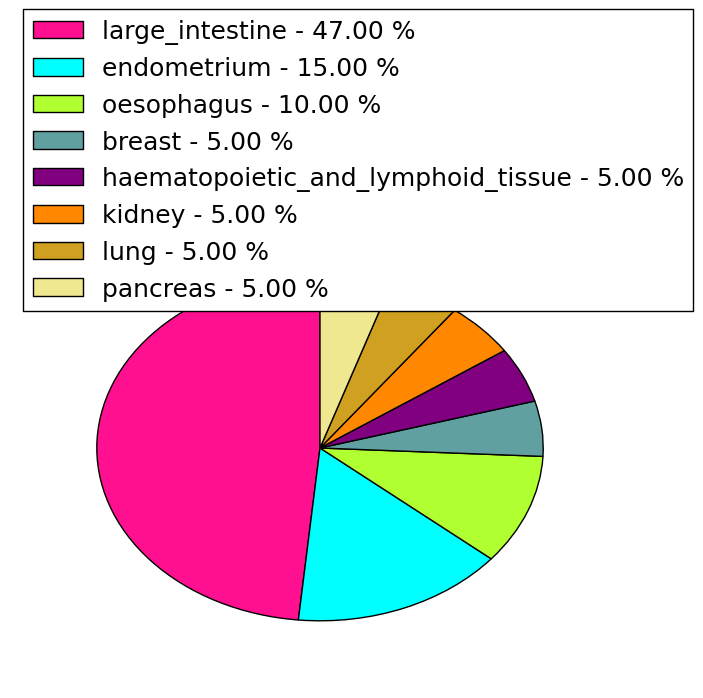
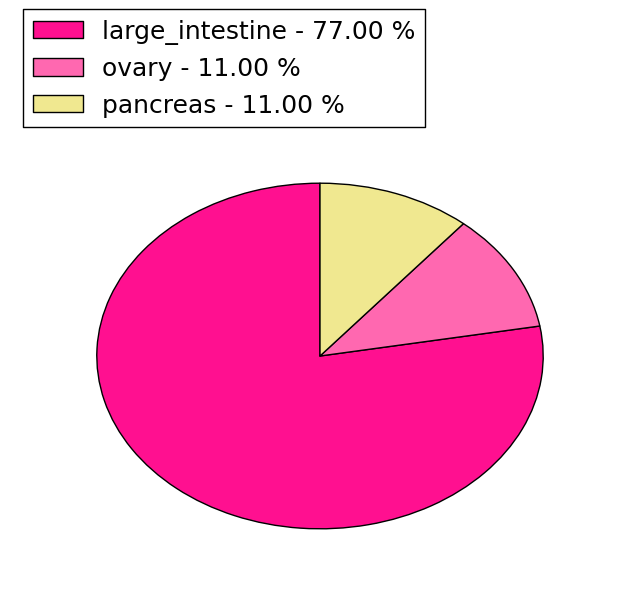
| Mutation type/ Tissue ID | brca | cns | cerv | endome | haematopo | kidn | Lintest | liver | lung | ns | ovary | pancre | prost | skin | stoma | thyro | urina | |||
| Total # sample | 1 | |||||||||||||||||||
| GAIN (# sample) | ||||||||||||||||||||
| LOSS (# sample) | 1 |
| cf) Tissue ID; Tissue type (1; Breast, 2; Central_nervous_system, 3; Cervix, 4; Endometrium, 5; Haematopoietic_and_lymphoid_tissue, 6; Kidney, 7; Large_intestine, 8; Liver, 9; Lung, 10; NS, 11; Ovary, 12; Pancreas, 13; Prostate, 14; Skin, 15; Stomach, 16; Thyroid, 17; Urinary_tract) |
| Top |
|
 |
| Top |
| Stat. for Non-Synonymous SNVs (# total SNVs=42) | (# total SNVs=19) |
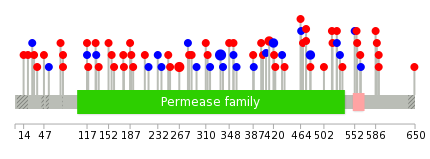
 |  |
(# total SNVs=9) | (# total SNVs=0) |
 |
| Top |
| * When you move the cursor on each content, you can see more deailed mutation information on the Tooltip. Those are primary_site,primary_histology,mutation(aa),pubmedID. |
| GRCh37 position | Mutation(aa) | Unique sampleID count |
| chr20:4850569-4850569 | p.I412fs*4 | 5 |
| chr20:4854682-4854682 | p.D334D | 5 |
| chr20:4864313-4864313 | p.G267R | 3 |
| chr20:4843470-4843470 | p.A480A | 2 |
| chr20:4848512-4848512 | p.F420F | 2 |
| chr20:4850563-4850563 | p.H413Q | 2 |
| chr20:4843493-4843493 | p.G473W | 2 |
| chr20:4837800-4837800 | p.G591W | 2 |
| chr20:4848470-4848470 | p.T434T | 1 |
| chr20:4864461-4864461 | p.G217G | 1 |
| Top |
|
 |
| Point Mutation/ Tissue ID | 1 | 2 | 3 | 4 | 5 | 6 | 7 | 8 | 9 | 10 | 11 | 12 | 13 | 14 | 15 | 16 | 17 | 18 | 19 | 20 |
| # sample | 2 | 12 | 8 | 4 | 1 | 7 | 4 | 3 | 1 | 4 | 12 | 1 | 9 | |||||||
| # mutation | 2 | 12 | 8 | 4 | 1 | 8 | 4 | 3 | 1 | 4 | 13 | 1 | 10 | |||||||
| nonsynonymous SNV | 9 | 5 | 2 | 1 | 5 | 4 | 3 | 3 | 9 | 1 | 7 | |||||||||
| synonymous SNV | 2 | 3 | 3 | 2 | 3 | 1 | 1 | 4 | 3 |
| cf) Tissue ID; Tissue type (1; BLCA[Bladder Urothelial Carcinoma], 2; BRCA[Breast invasive carcinoma], 3; CESC[Cervical squamous cell carcinoma and endocervical adenocarcinoma], 4; COAD[Colon adenocarcinoma], 5; GBM[Glioblastoma multiforme], 6; Glioma Low Grade, 7; HNSC[Head and Neck squamous cell carcinoma], 8; KICH[Kidney Chromophobe], 9; KIRC[Kidney renal clear cell carcinoma], 10; KIRP[Kidney renal papillary cell carcinoma], 11; LAML[Acute Myeloid Leukemia], 12; LUAD[Lung adenocarcinoma], 13; LUSC[Lung squamous cell carcinoma], 14; OV[Ovarian serous cystadenocarcinoma ], 15; PAAD[Pancreatic adenocarcinoma], 16; PRAD[Prostate adenocarcinoma], 17; SKCM[Skin Cutaneous Melanoma], 18:STAD[Stomach adenocarcinoma], 19:THCA[Thyroid carcinoma], 20:UCEC[Uterine Corpus Endometrial Carcinoma]) |
| Top |
| * We represented just top 10 SNVs. When you move the cursor on each content, you can see more deailed mutation information on the Tooltip. Those are primary_site, primary_histology, mutation(aa), pubmedID. |
| Genomic Position | Mutation(aa) | Unique sampleID count |
| chr20:4864313 | p.G267R,SLC23A2 | 2 |
| chr20:4848512 | p.G591W,SLC23A2 | 2 |
| chr20:4837800 | p.V588L,SLC23A2 | 2 |
| chr20:4837809 | p.F420F,SLC23A2 | 2 |
| chr20:4850682 | p.R161S,SLC23A2 | 1 |
| chr20:4880292 | p.G21D,SLC23A2 | 1 |
| chr20:4913125 | p.T556N,SLC23A2 | 1 |
| chr20:4839969 | p.P410H,SLC23A2 | 1 |
| chr20:4855301 | p.F283S,SLC23A2 | 1 |
| chr20:4843461 | p.F158S,SLC23A2 | 1 |
| * Copy number data were extracted from TCGA using R package TCGA-Assembler. The URLs of all public data files on TCGA DCC data server were gathered on Jan-05-2015. Function ProcessCNAData in TCGA-Assembler package was used to obtain gene-level copy number value which is calculated as the average copy number of the genomic region of a gene. |
 |
| cf) Tissue ID[Tissue type]: BLCA[Bladder Urothelial Carcinoma], BRCA[Breast invasive carcinoma], CESC[Cervical squamous cell carcinoma and endocervical adenocarcinoma], COAD[Colon adenocarcinoma], GBM[Glioblastoma multiforme], Glioma Low Grade, HNSC[Head and Neck squamous cell carcinoma], KICH[Kidney Chromophobe], KIRC[Kidney renal clear cell carcinoma], KIRP[Kidney renal papillary cell carcinoma], LAML[Acute Myeloid Leukemia], LUAD[Lung adenocarcinoma], LUSC[Lung squamous cell carcinoma], OV[Ovarian serous cystadenocarcinoma ], PAAD[Pancreatic adenocarcinoma], PRAD[Prostate adenocarcinoma], SKCM[Skin Cutaneous Melanoma], STAD[Stomach adenocarcinoma], THCA[Thyroid carcinoma], UCEC[Uterine Corpus Endometrial Carcinoma] |
| Top |
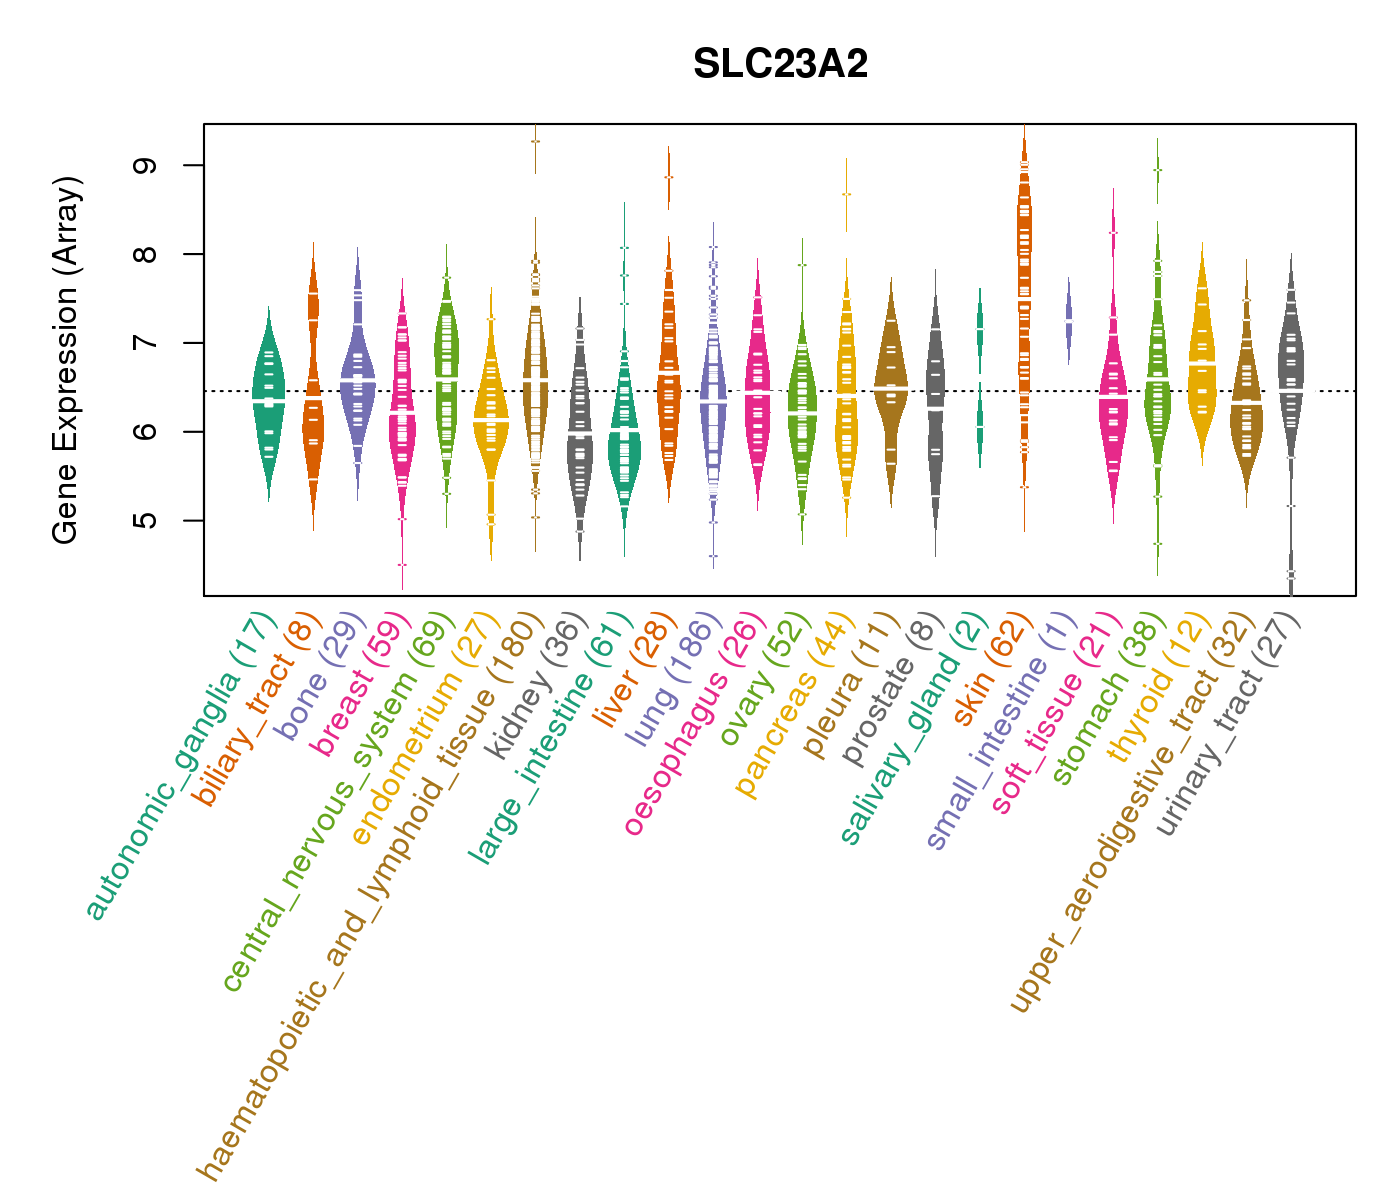
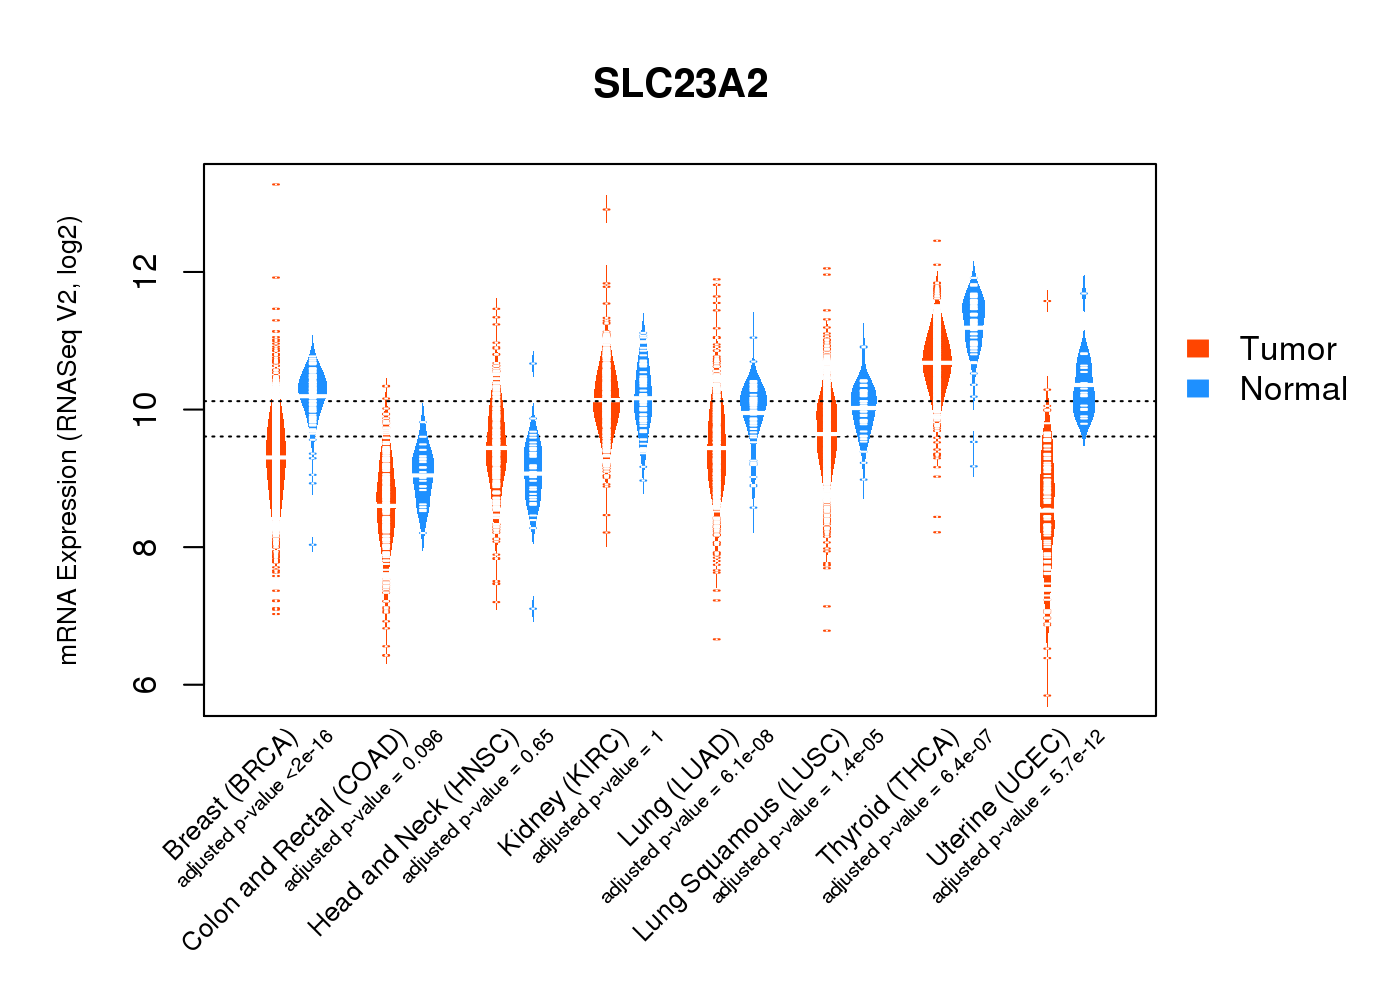
| Gene Expression for SLC23A2 |
| * CCLE gene expression data were extracted from CCLE_Expression_Entrez_2012-10-18.res: Gene-centric RMA-normalized mRNA expression data. |
 |
| * Normalized gene expression data of RNASeqV2 was extracted from TCGA using R package TCGA-Assembler. The URLs of all public data files on TCGA DCC data server were gathered at Jan-05-2015. Only eight cancer types have enough normal control samples for differential expression analysis. (t test, adjusted p<0.05 (using Benjamini-Hochberg FDR)) |
 |
| Top |
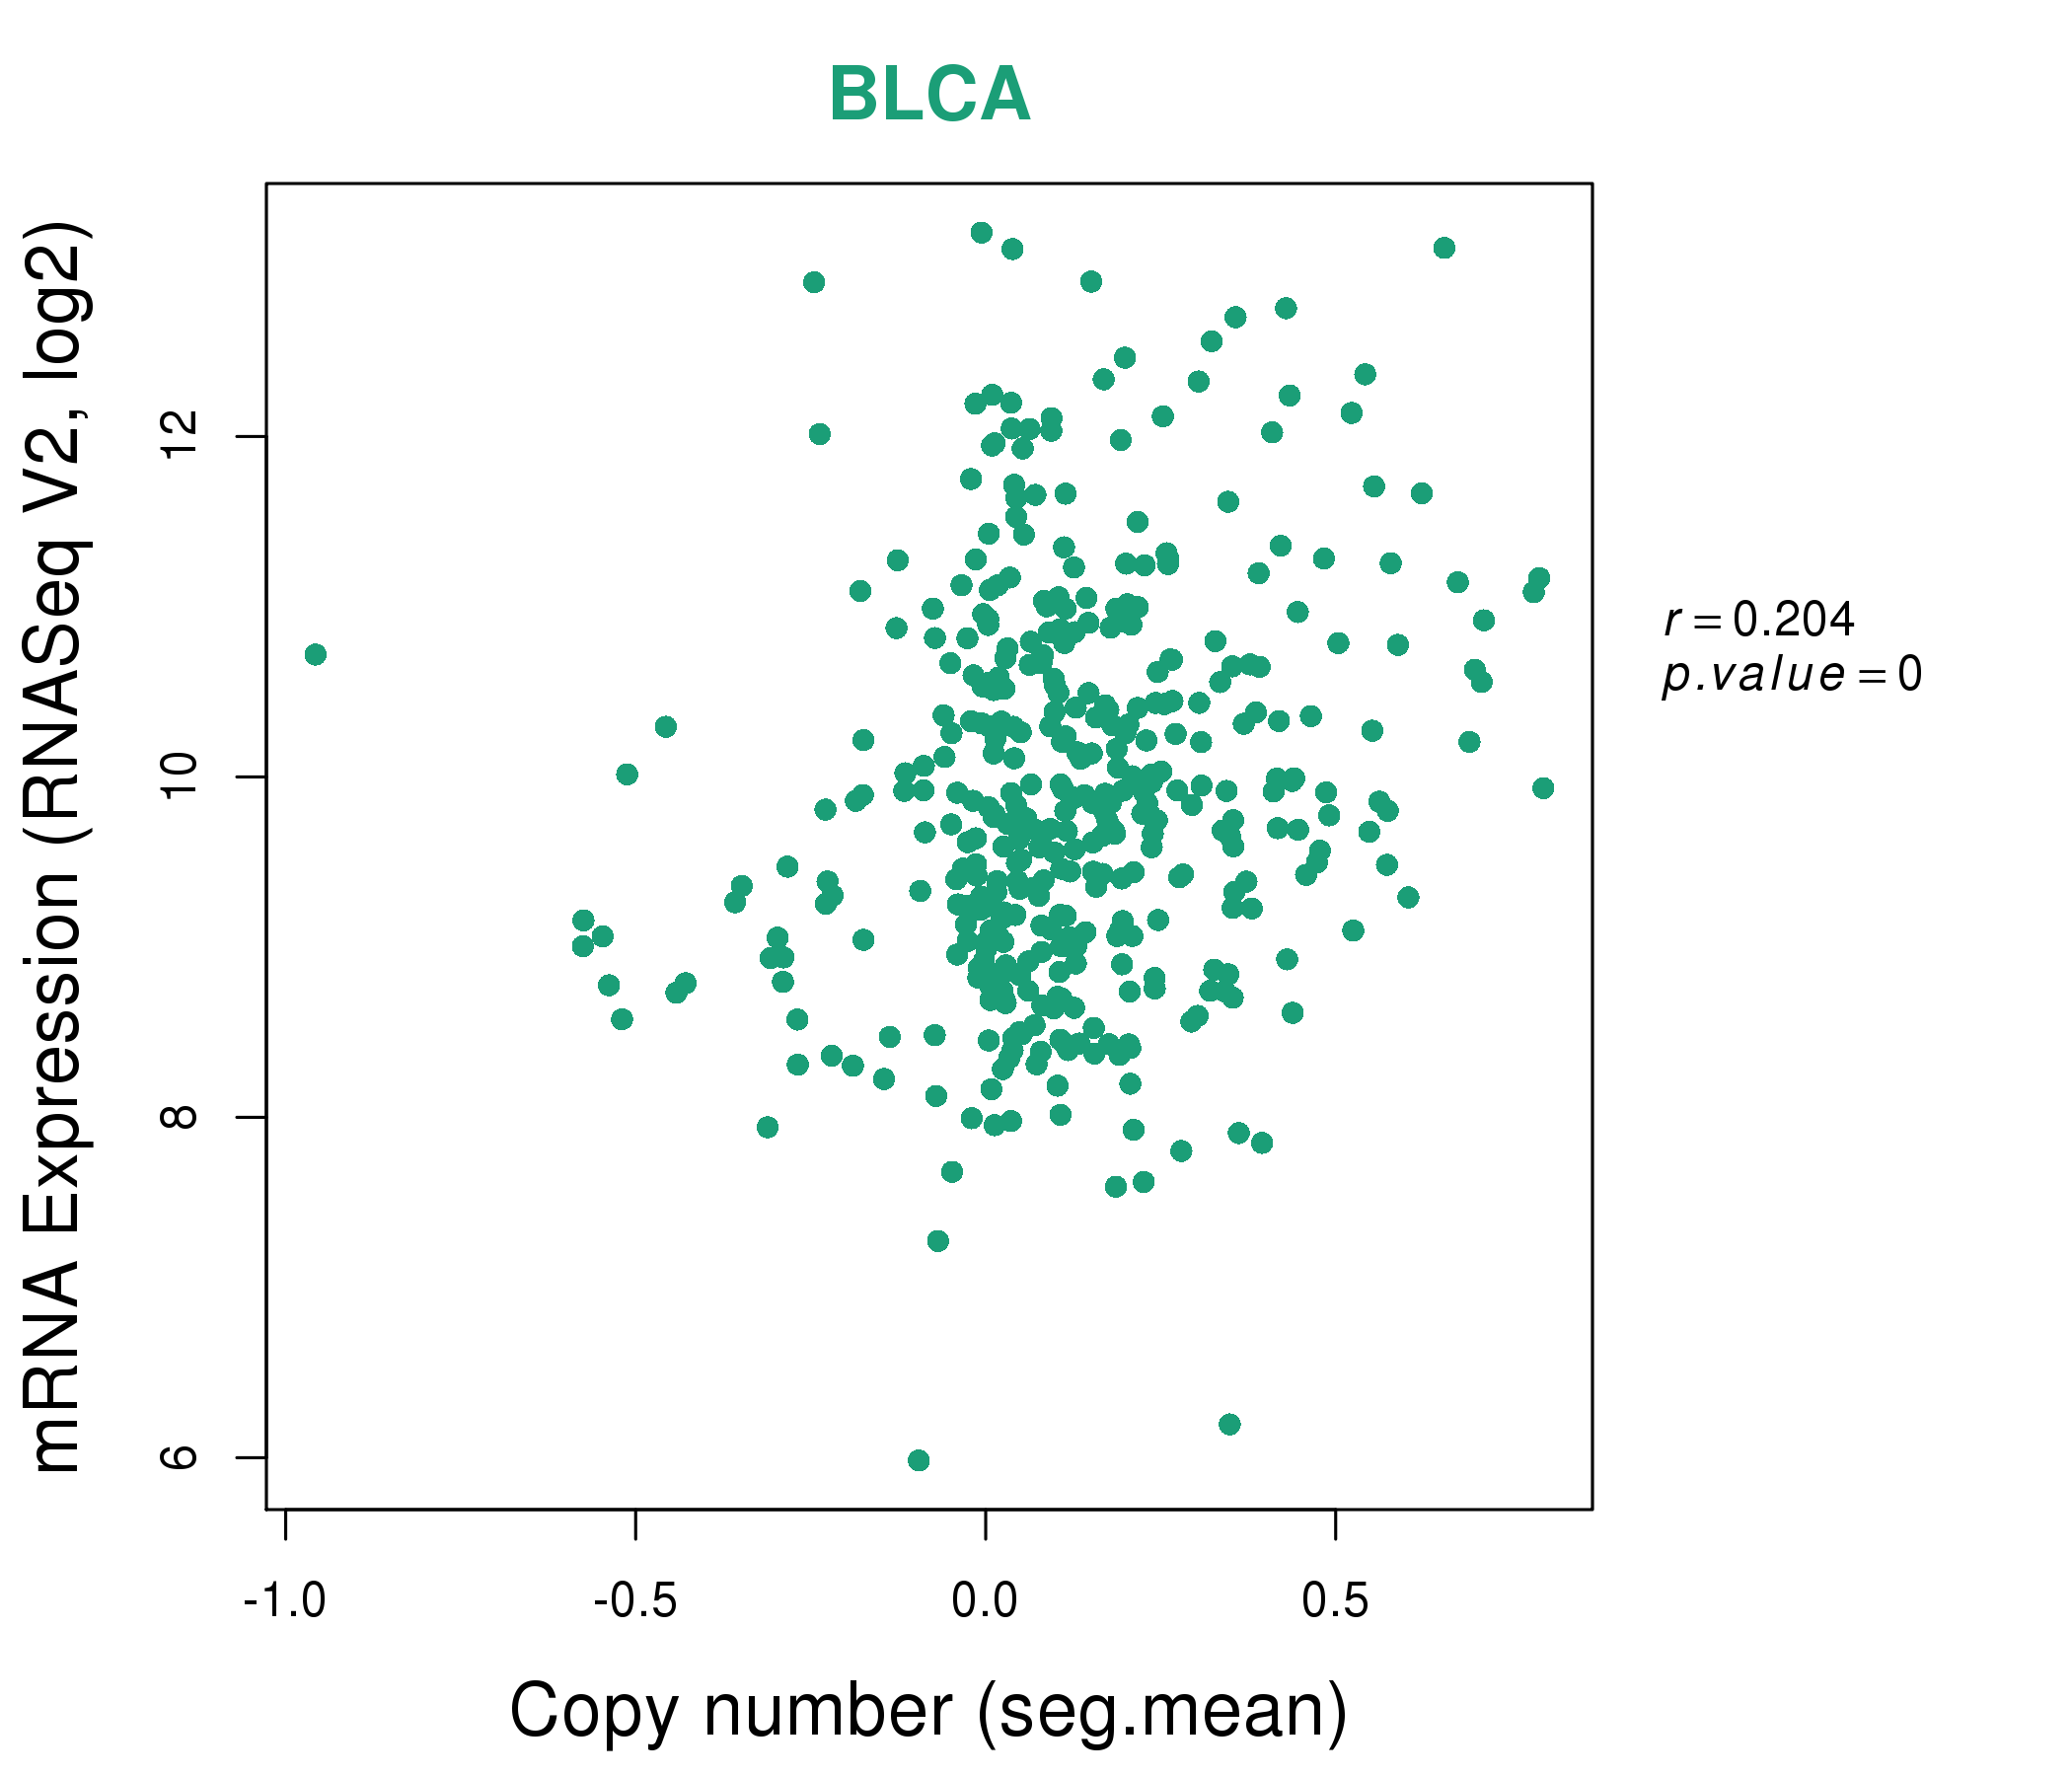
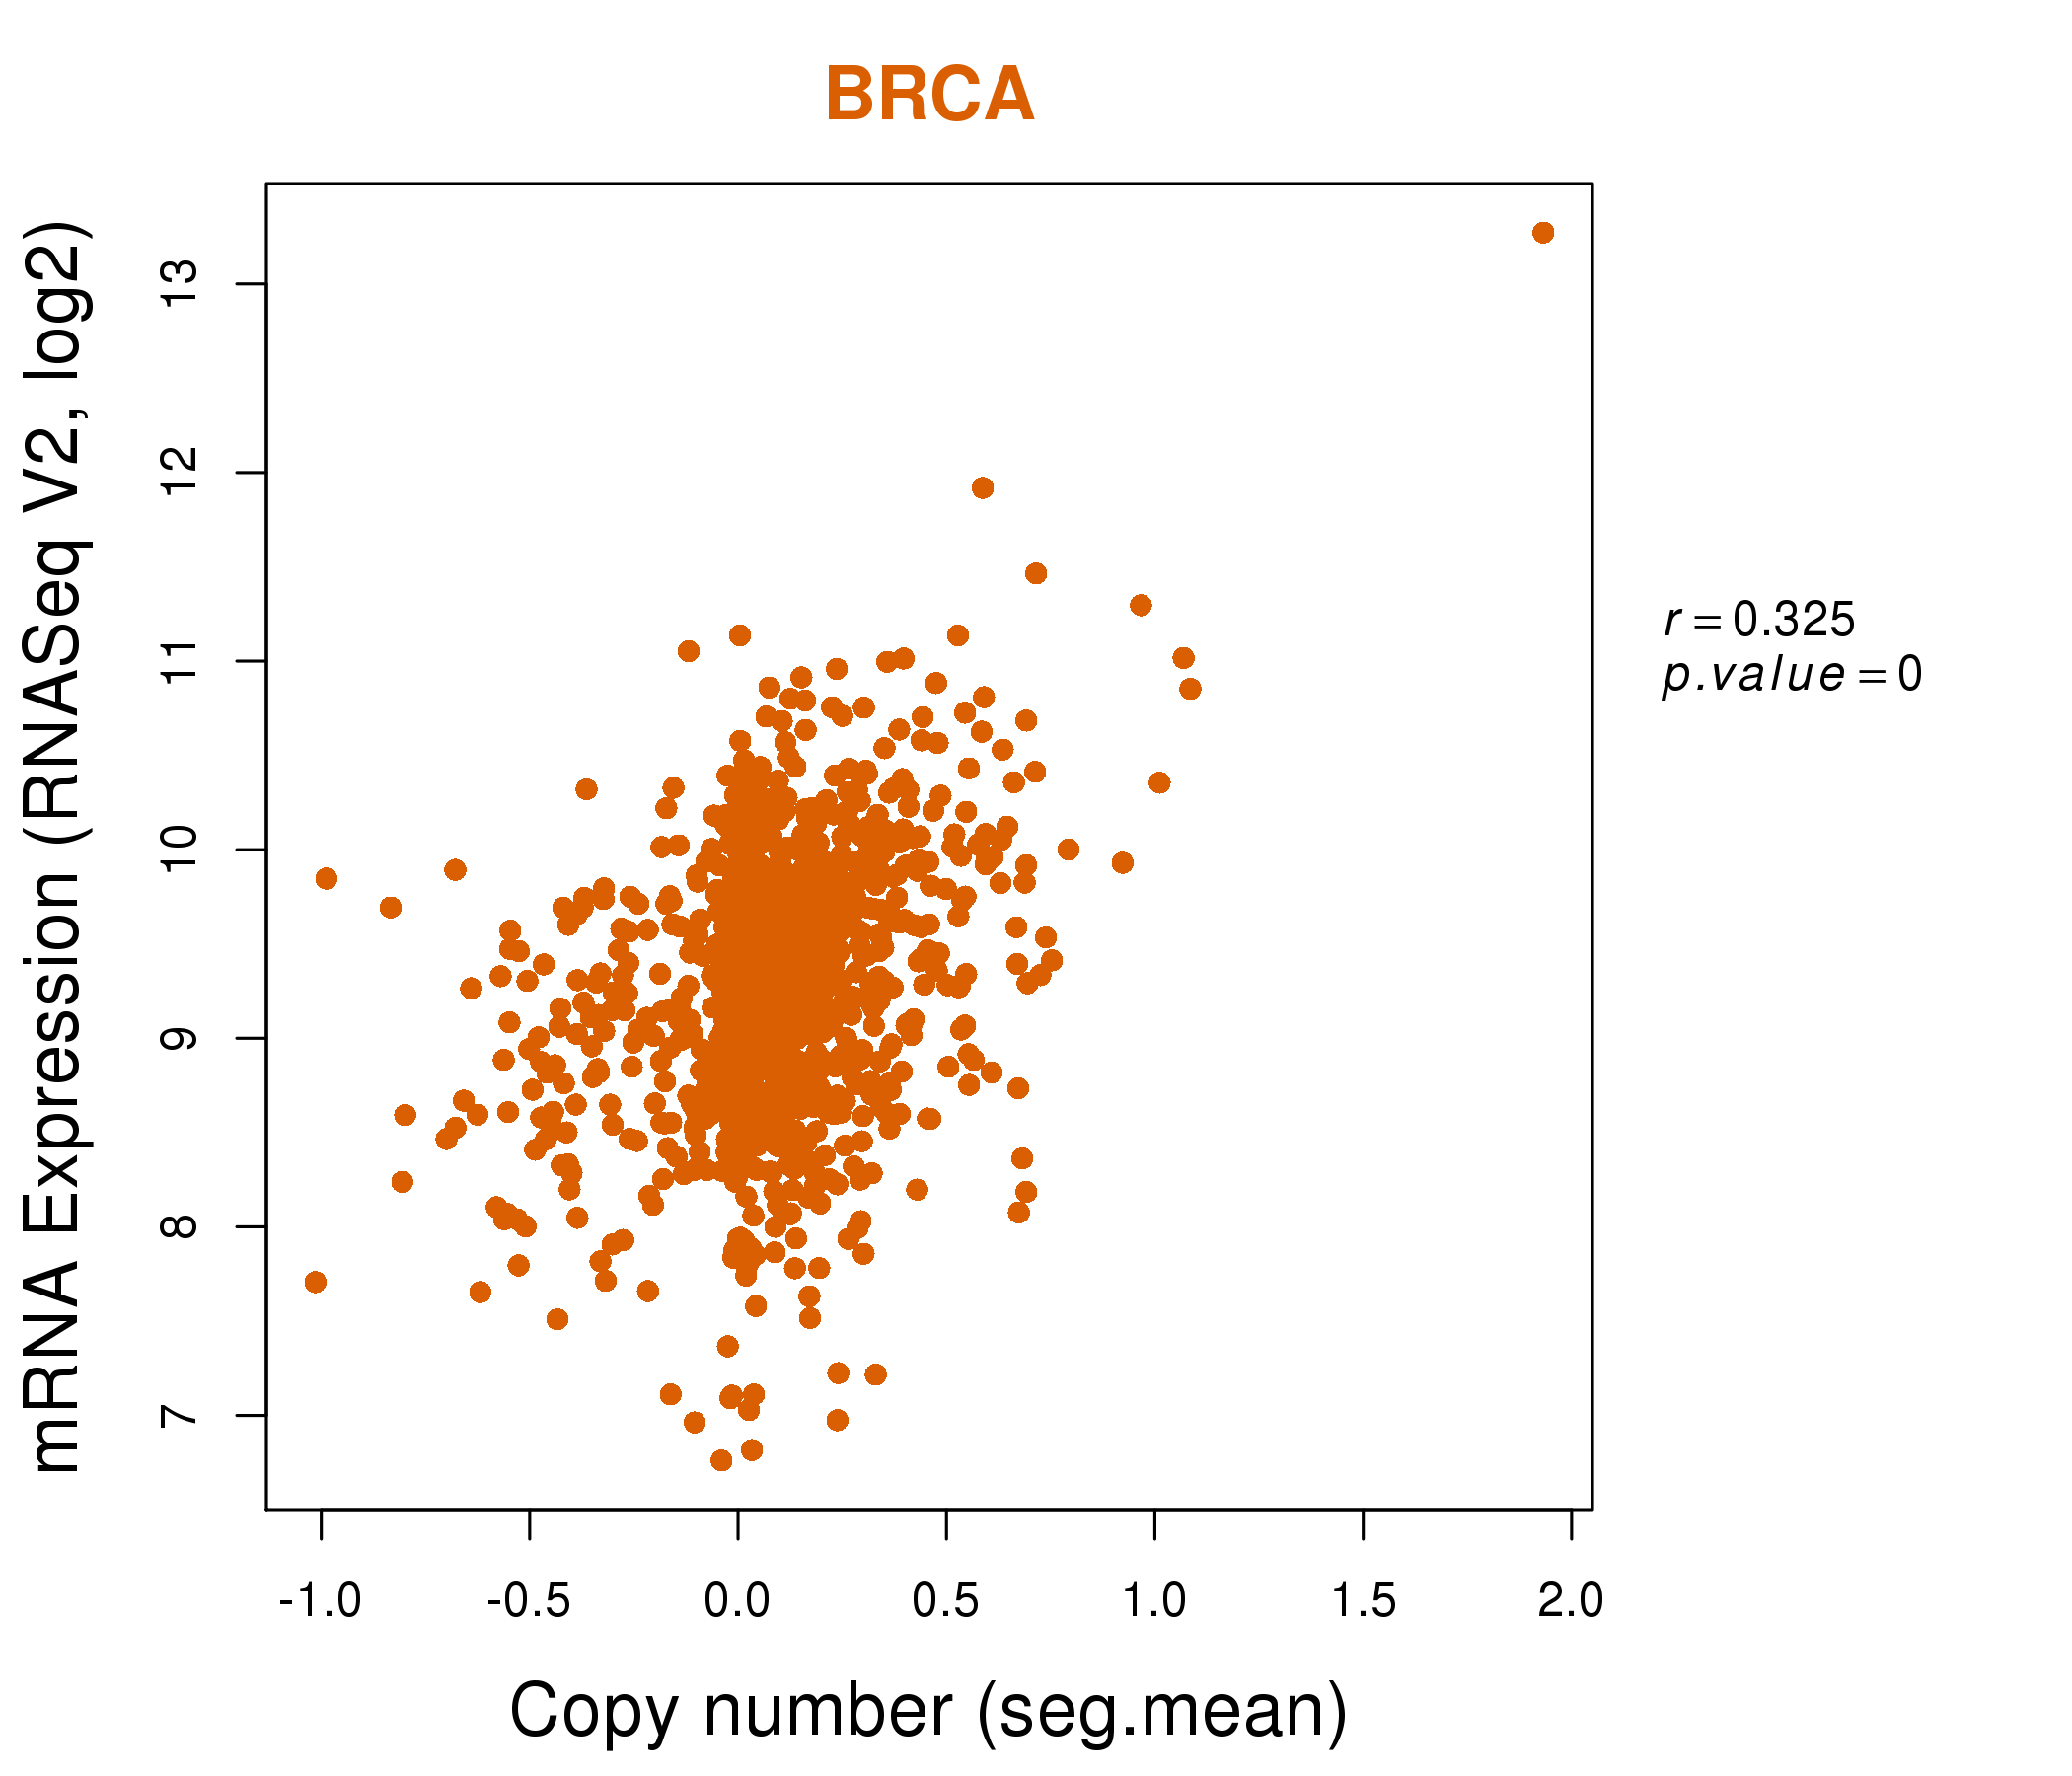
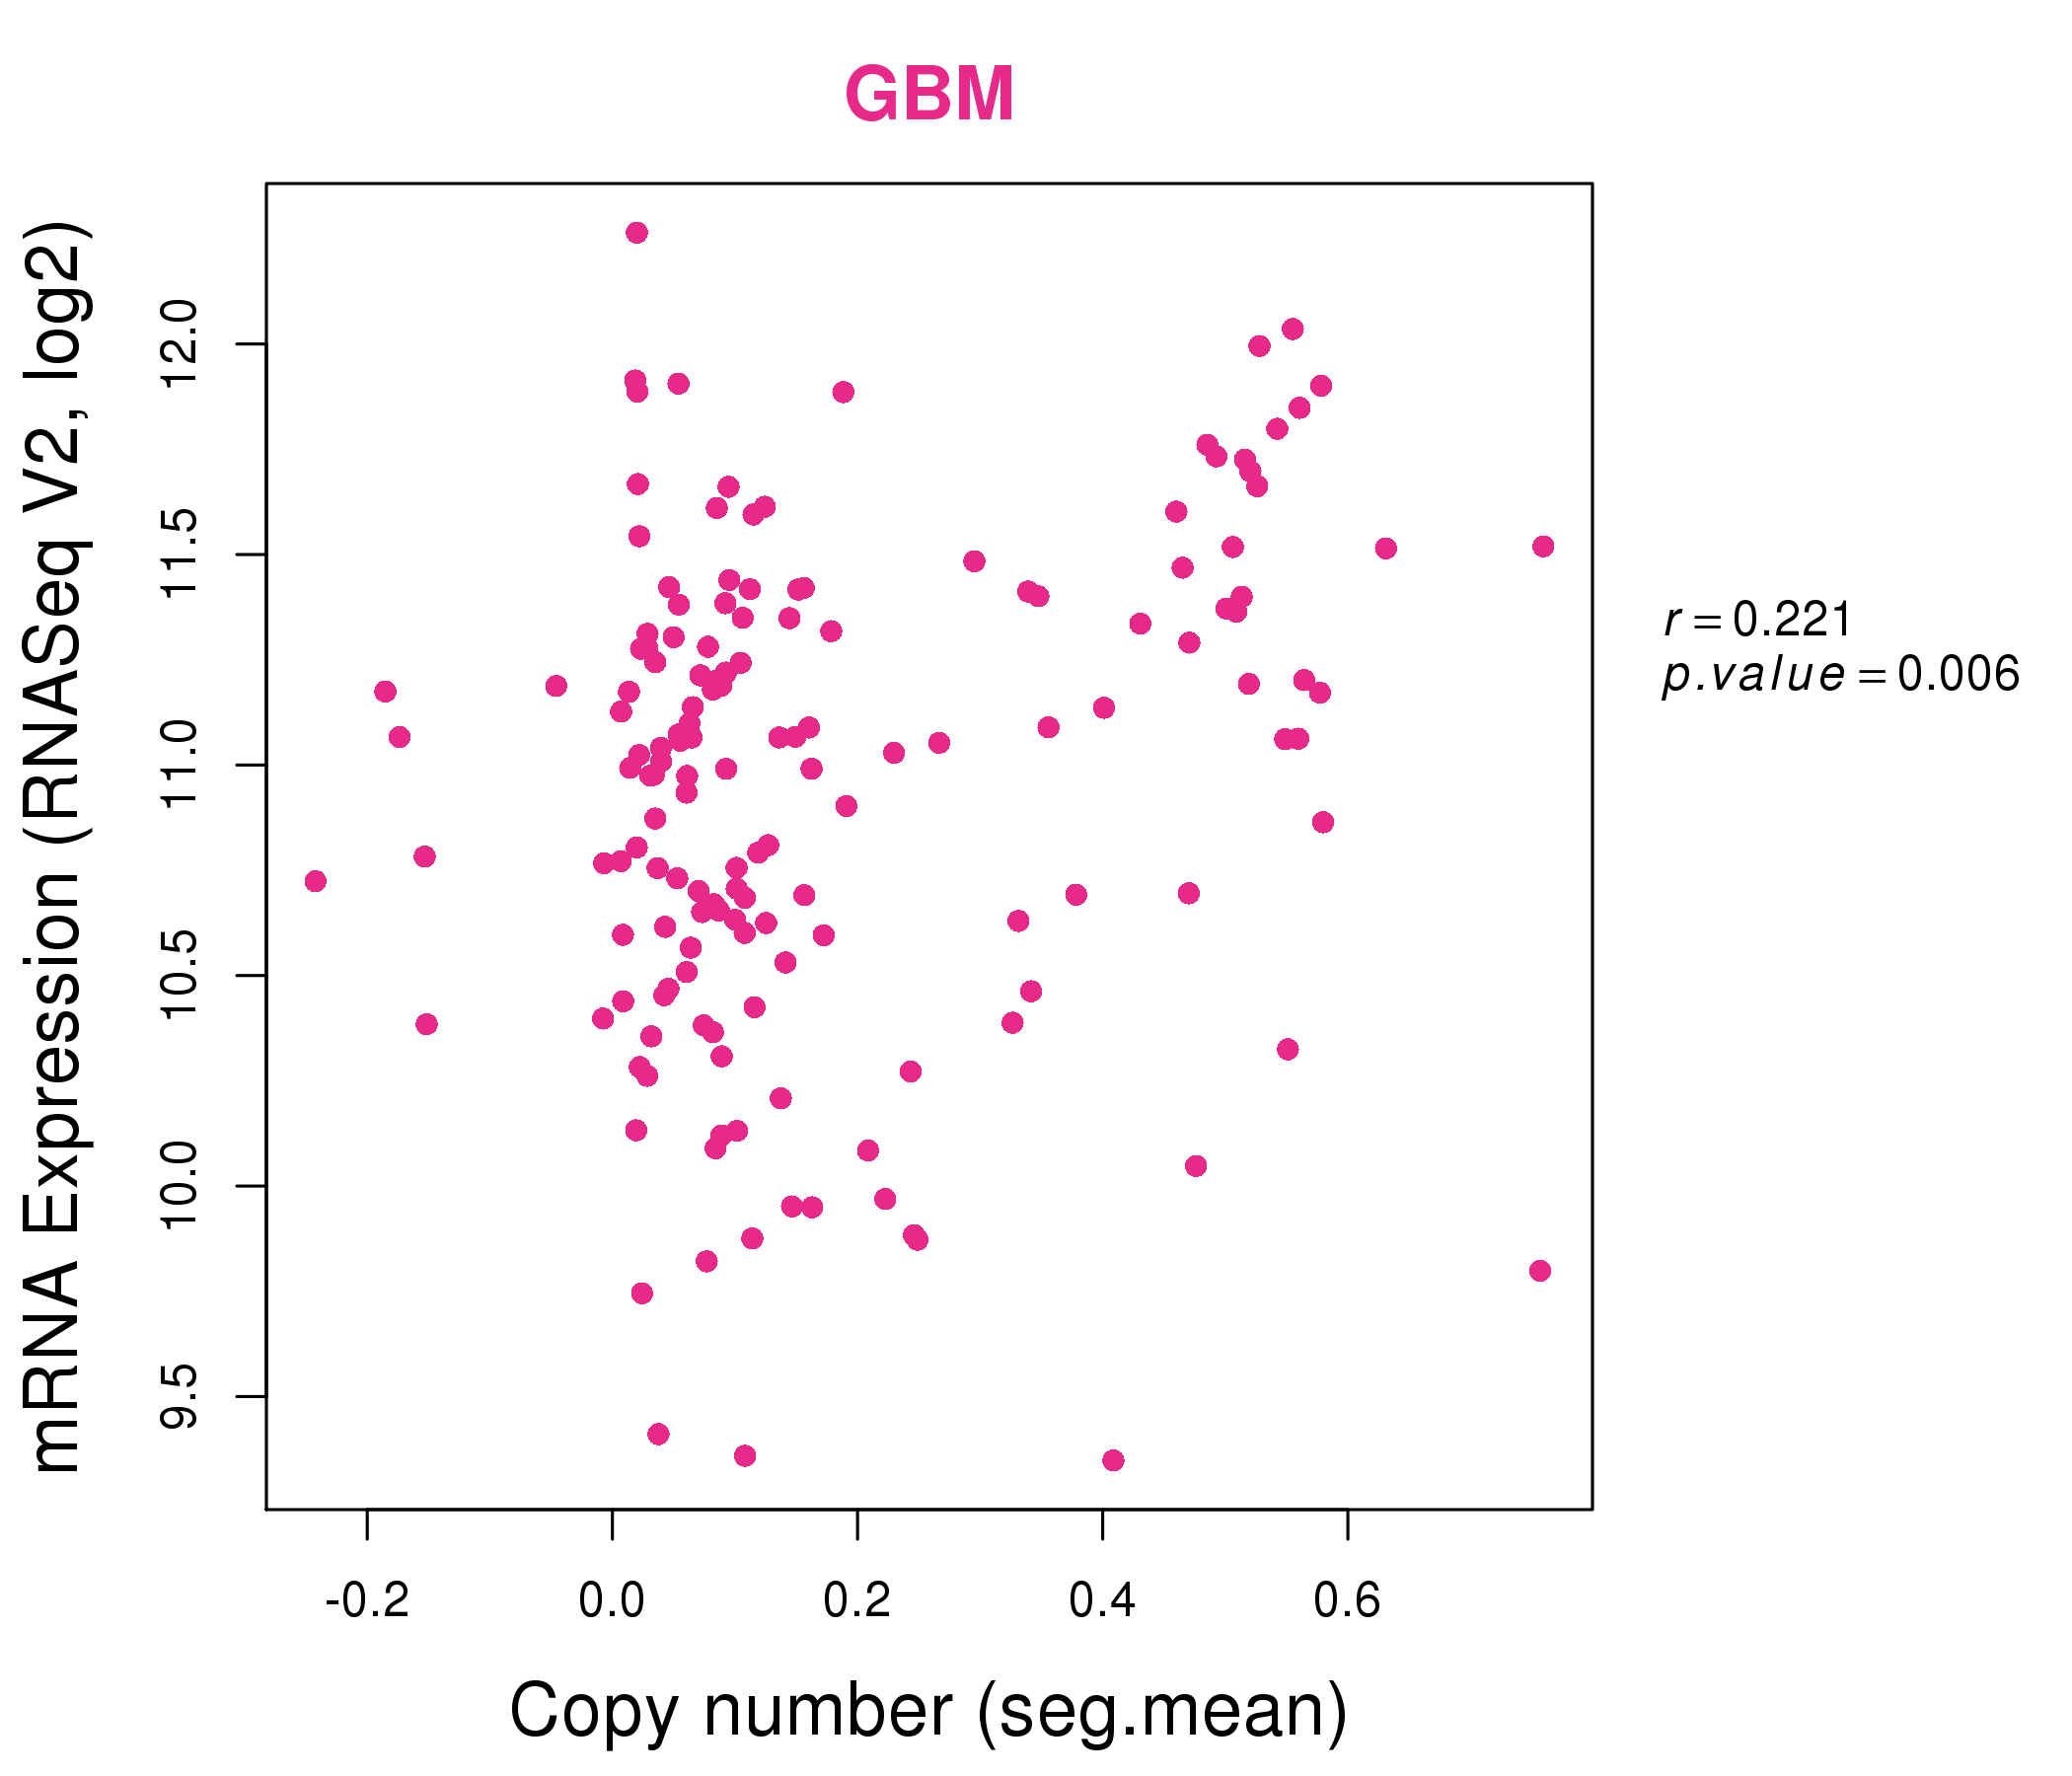
| * This plots show the correlation between CNV and gene expression. |
: Open all plots for all cancer types
 |
|
 |
|
| Top |
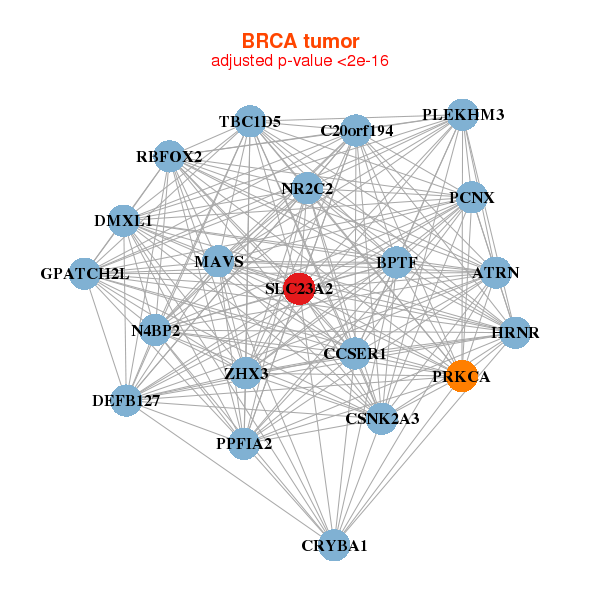
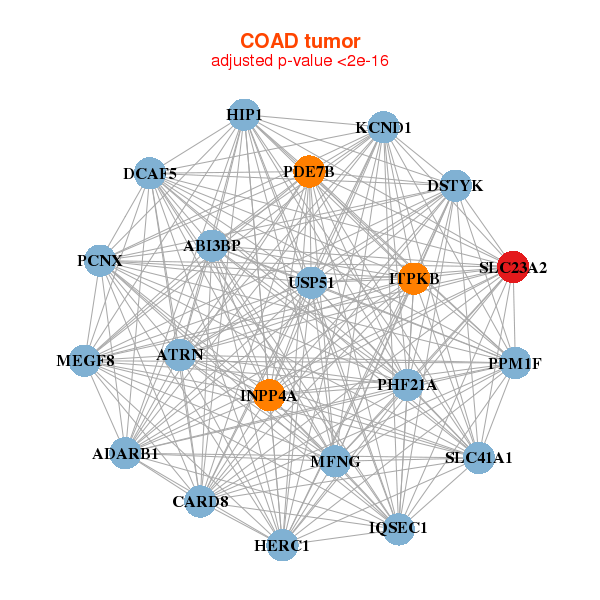
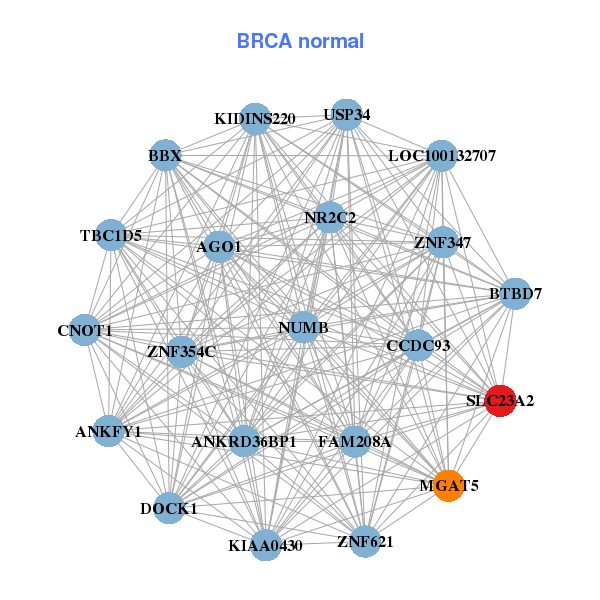
| Gene-Gene Network Information |
| * Co-Expression network figures were drawn using R package igraph. Only the top 20 genes with the highest correlations were shown. Red circle: input gene, orange circle: cell metabolism gene, sky circle: other gene |
: Open all plots for all cancer types
 |
|
| ATRN,BPTF,GPATCH2L,C20orf194,CRYBA1,CSNK2A3,DEFB127, DMXL1,CCSER1,HRNR,MAVS,N4BP2,NR2C2,PCNX, PLEKHM3,PPFIA2,PRKCA,RBFOX2,SLC23A2,TBC1D5,ZHX3 | ANKFY1,ANKRD36BP1,BBX,BTBD7,FAM208A,CCDC93,CNOT1, DOCK1,AGO1,KIAA0430,KIDINS220,LOC100132707,MGAT5,NR2C2, NUMB,SLC23A2,TBC1D5,USP34,ZNF347,ZNF354C,ZNF621 |
 |
|
| ABI3BP,ADARB1,ATRN,CARD8,DCAF5,DSTYK,HERC1, HIP1,INPP4A,IQSEC1,ITPKB,KCND1,MEGF8,MFNG, PCNX,PDE7B,PHF21A,PPM1F,SLC23A2,SLC41A1,USP51 | ARHGAP31,ASAP1,ASXL1,CCDC149,CHD6,HIP1,IQSEC1, MCC,MTR,NOTCH2,OBSCN,PHF2,PODXL,REV3L, SLC23A2,SSH1,SYNGAP1,WDR91,ZNF337,ZNF445,ZNF589 |
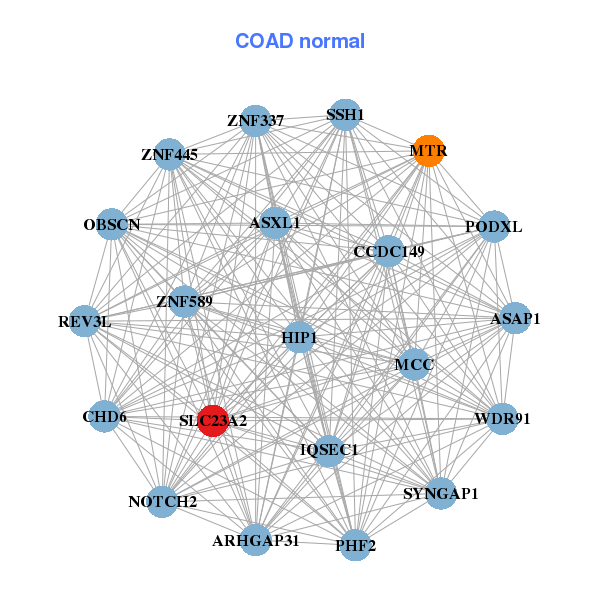
| * Co-Expression network figures were drawn using R package igraph. Only the top 20 genes with the highest correlations were shown. Red circle: input gene, orange circle: cell metabolism gene, sky circle: other gene |
: Open all plots for all cancer types
| Top |
: Open all interacting genes' information including KEGG pathway for all interacting genes from DAVID
| Top |
| Pharmacological Information for SLC23A2 |
| There's no related Drug. |
| Top |
| Cross referenced IDs for SLC23A2 |
| * We obtained these cross-references from Uniprot database. It covers 150 different DBs, 18 categories. http://www.uniprot.org/help/cross_references_section |
: Open all cross reference information
|
Copyright © 2016-Present - The Univsersity of Texas Health Science Center at Houston @ |