|
||||||||||||||||||||
| |
| Phenotypic Information (metabolism pathway, cancer, disease, phenome) |
| |
| |
| Gene-Gene Network Information: Co-Expression Network, Interacting Genes & KEGG |
| |
|


| Gene Summary for MED12 |
| Basic gene info. | Gene symbol | MED12 |
| Gene name | mediator complex subunit 12 | |
| Synonyms | ARC240|CAGH45|FGS1|HOPA|MED12S|OHDOX|OKS|OPA1|TNRC11|TRAP230 | |
| Cytomap | UCSC genome browser: Xq13 | |
| Genomic location | chrX :70338405-70362304 | |
| Type of gene | protein-coding | |
| RefGenes | NM_005120.2, | |
| Ensembl id | ENSG00000184634 | |
| Description | CAG repeat protein 45OPA-containing proteinactivator-recruited cofactor 240 kDa componenthuman opposite pairedmediator of RNA polymerase II transcription subunit 12mediator of RNA polymerase II transcription, subunit 12 homologputative mediator subu | |
| Modification date | 20141219 | |
| dbXrefs | MIM : 300188 | |
| HGNC : HGNC | ||
| Ensembl : ENSG00000184634 | ||
| HPRD : 02176 | ||
| Vega : OTTHUMG00000021788 | ||
| Protein | UniProt: Q93074 go to UniProt's Cross Reference DB Table | |
| Expression | CleanEX: HS_MED12 | |
| BioGPS: 9968 | ||
| Gene Expression Atlas: ENSG00000184634 | ||
| The Human Protein Atlas: ENSG00000184634 | ||
| Pathway | NCI Pathway Interaction Database: MED12 | |
| KEGG: MED12 | ||
| REACTOME: MED12 | ||
| ConsensusPathDB | ||
| Pathway Commons: MED12 | ||
| Metabolism | MetaCyc: MED12 | |
| HUMANCyc: MED12 | ||
| Regulation | Ensembl's Regulation: ENSG00000184634 | |
| miRBase: chrX :70,338,405-70,362,304 | ||
| TargetScan: NM_005120 | ||
| cisRED: ENSG00000184634 | ||
| Context | iHOP: MED12 | |
| cancer metabolism search in PubMed: MED12 | ||
| UCL Cancer Institute: MED12 | ||
| Assigned class in ccmGDB | A - This gene has a literature evidence and it belongs to cancer gene. | |
| References showing role of MED12 in cancer cell metabolism | 1. Grants JM, Goh GY, Taubert S (2015) The Mediator complex of Caenorhabditis elegans: insights into the developmental and physiological roles of a conserved transcriptional coregulator. Nucleic Acids Res 43: 2442-2453. doi: 10.1093/nar/gkv037. pmid: 4344494. go to article | |
| Top |
| Phenotypic Information for MED12(metabolism pathway, cancer, disease, phenome) |
| Cancer | CGAP: MED12 |
| Familial Cancer Database: MED12 | |
| * This gene is included in those cancer gene databases. |
|
|
|
|
|
| . | ||||||||||||||
Oncogene 1 | Significant driver gene in PRAD 6, | |||||||||||||||||||
| cf) number; DB name 1 Oncogene; http://nar.oxfordjournals.org/content/35/suppl_1/D721.long, 2 Tumor Suppressor gene; https://bioinfo.uth.edu/TSGene/, 3 Cancer Gene Census; http://www.nature.com/nrc/journal/v4/n3/abs/nrc1299.html, 4 CancerGenes; http://nar.oxfordjournals.org/content/35/suppl_1/D721.long, 5 Network of Cancer Gene; http://ncg.kcl.ac.uk/index.php, 6 http://www.nature.com/nature/journal/v505/n7484/full/nature12912.html, 7Therapeutic Vulnerabilities in Cancer; http://cbio.mskcc.org/cancergenomics/statius/ |
| REACTOME_METABOLISM_OF_LIPIDS_AND_LIPOPROTEINS | |
| OMIM | 300188; gene. 300895; phenotype. 305450; phenotype. 309520; phenotype. |
| Orphanet | 293707; Blepharophimosis-intellectual disability syndrome, MKB type. 776; X-linked intellectual disability with marfanoid habitus. 777; X-linked non-syndromic intellectual disability. 93932; FG syndrome type 1. |
| Disease | KEGG Disease: MED12 |
| MedGen: MED12 (Human Medical Genetics with Condition) | |
| ClinVar: MED12 | |
| Phenotype | MGI: MED12 (International Mouse Phenotyping Consortium) |
| PhenomicDB: MED12 | |
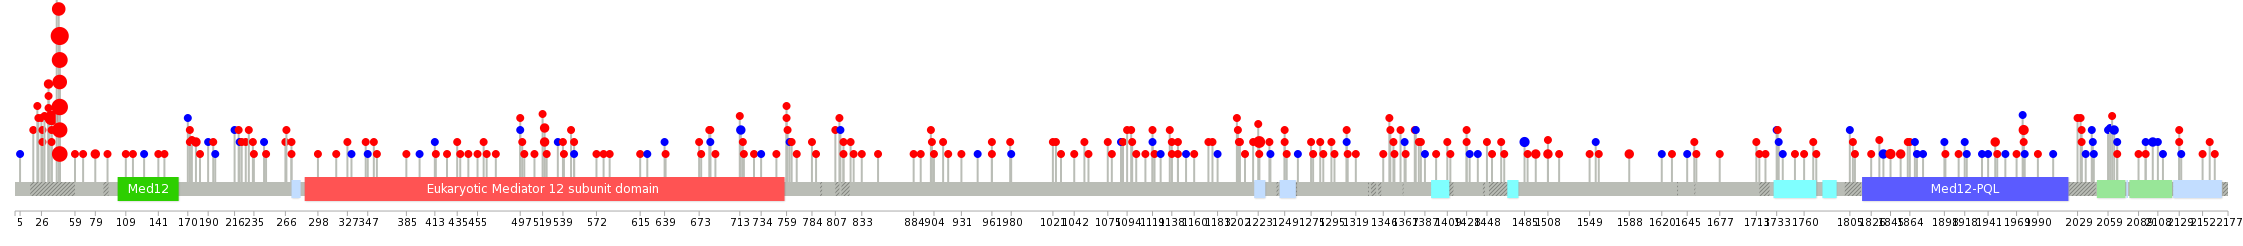
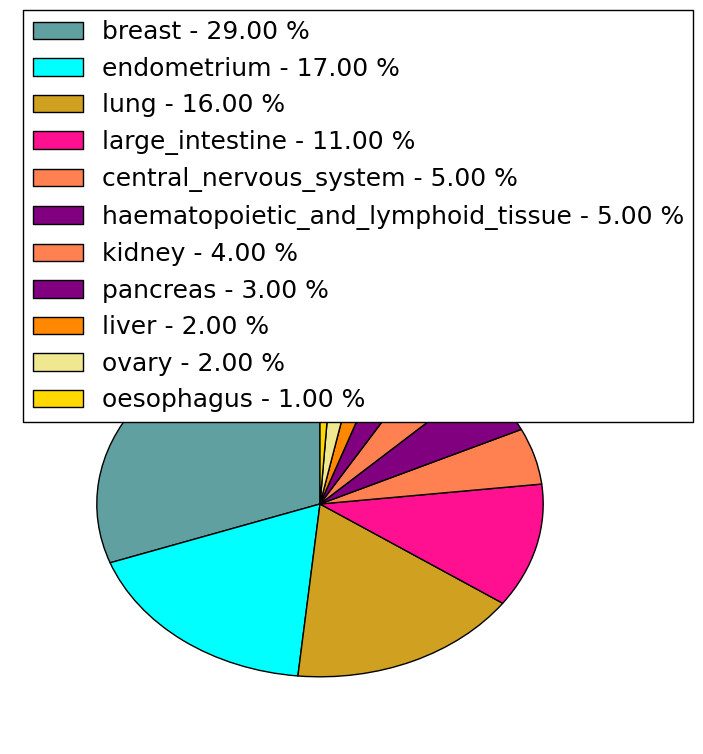
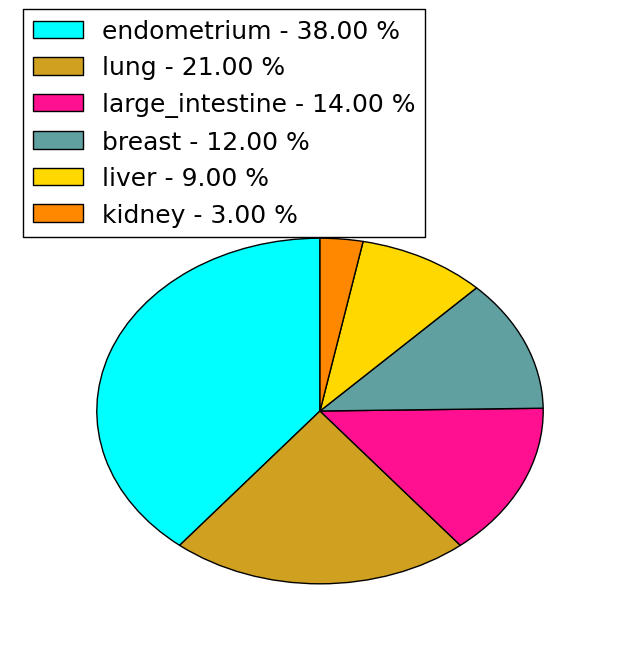
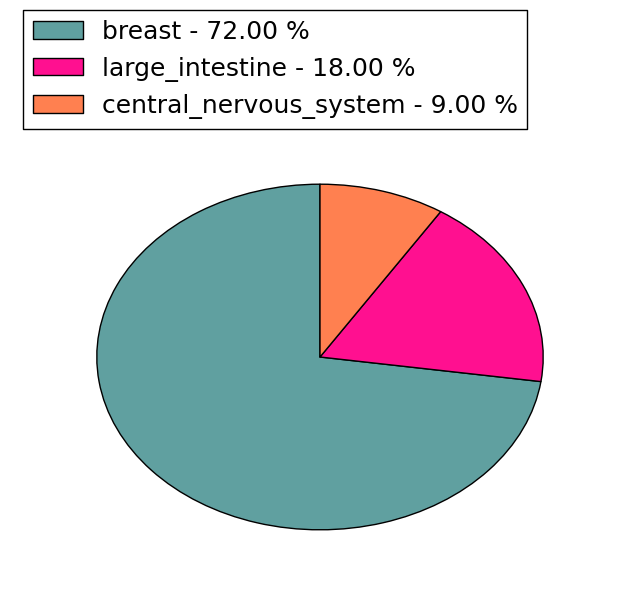
| Mutations for MED12 |
| * Under tables are showing count per each tissue to give us broad intuition about tissue specific mutation patterns.You can go to the detailed page for each mutation database's web site. |
| There's no structural variation information in COSMIC data for this gene. |
| * From mRNA Sanger sequences, Chitars2.0 arranged chimeric transcripts. This table shows MED12 related fusion information. |
| ID | Head Gene | Tail Gene | Accession | Gene_a | qStart_a | qEnd_a | Chromosome_a | tStart_a | tEnd_a | Gene_a | qStart_a | qEnd_a | Chromosome_a | tStart_a | tEnd_a |
| BG519661 | RPL14 | 2 | 76 | 3 | 40503567 | 40503641 | MED12 | 71 | 399 | X | 70361761 | 70362299 | |
| AF117755 | RPRD2 | 1 | 106 | 1 | 150407357 | 150407462 | MED12 | 107 | 6757 | X | 70338573 | 70362147 | |
| BF361917 | ANKS1B | 8 | 570 | 12 | 99783693 | 99784255 | MED12 | 562 | 641 | X | 70343019 | 70343465 | |
| BE005998 | AKAP12 | 25 | 251 | 6 | 151670841 | 151671064 | MED12 | 252 | 645 | X | 70346111 | 70347191 | |
| BE005999 | AKAP12 | 8 | 223 | 6 | 151670841 | 151671056 | MED12 | 224 | 663 | X | 70346111 | 70347238 | |
| Top |
| There's no copy number variation information in COSMIC data for this gene. |
| Top |
|
 |
| Top |
| Stat. for Non-Synonymous SNVs (# total SNVs=242) | (# total SNVs=55) |
 |  |
(# total SNVs=11) | (# total SNVs=10) |
 |  |
| Top |
| * When you move the cursor on each content, you can see more deailed mutation information on the Tooltip. Those are primary_site,primary_histology,mutation(aa),pubmedID. |
| GRCh37 position | Mutation(aa) | Unique sampleID count |
| chr23:70339254-70339254 | p.G44D | 240 |
| chr23:70339253-70339253 | p.G44R | 158 |
| chr23:70339230-70339230 | p.L36R | 25 |
| chr23:70339215-70339215 | p.E33_D34insPQ | 21 |
| chr23:70339251-70339251 | p.Q43P | 16 |
| chr23:70349258-70349258 | p.L1224F | 8 |
| chr23:70339241-70339267 | p.N40_Q48del | 5 |
| chr23:70339245-70339271 | p.V41_P49del | 4 |
| chr23:70338701-70338701 | p.E33* | 4 |
| chr23:70339249-70339263 | p.K42_N46del | 4 |
| Top |
|
 |
| Point Mutation/ Tissue ID | 1 | 2 | 3 | 4 | 5 | 6 | 7 | 8 | 9 | 10 | 11 | 12 | 13 | 14 | 15 | 16 | 17 | 18 | 19 | 20 |
| # sample | 13 | 14 | 2 | 27 | 4 | 13 | 8 | 1 | 27 | 6 | 1 | 1 | 5 | 14 | 11 | 36 | ||||
| # mutation | 13 | 14 | 2 | 26 | 4 | 15 | 8 | 1 | 33 | 6 | 1 | 1 | 4 | 14 | 11 | 53 | ||||
| nonsynonymous SNV | 10 | 11 | 2 | 20 | 4 | 12 | 7 | 1 | 25 | 5 | 1 | 1 | 3 | 11 | 8 | 36 | ||||
| synonymous SNV | 3 | 3 | 6 | 3 | 1 | 8 | 1 | 1 | 3 | 3 | 18 |
| cf) Tissue ID; Tissue type (1; BLCA[Bladder Urothelial Carcinoma], 2; BRCA[Breast invasive carcinoma], 3; CESC[Cervical squamous cell carcinoma and endocervical adenocarcinoma], 4; COAD[Colon adenocarcinoma], 5; GBM[Glioblastoma multiforme], 6; Glioma Low Grade, 7; HNSC[Head and Neck squamous cell carcinoma], 8; KICH[Kidney Chromophobe], 9; KIRC[Kidney renal clear cell carcinoma], 10; KIRP[Kidney renal papillary cell carcinoma], 11; LAML[Acute Myeloid Leukemia], 12; LUAD[Lung adenocarcinoma], 13; LUSC[Lung squamous cell carcinoma], 14; OV[Ovarian serous cystadenocarcinoma ], 15; PAAD[Pancreatic adenocarcinoma], 16; PRAD[Prostate adenocarcinoma], 17; SKCM[Skin Cutaneous Melanoma], 18:STAD[Stomach adenocarcinoma], 19:THCA[Thyroid carcinoma], 20:UCEC[Uterine Corpus Endometrial Carcinoma]) |
| Top |
| * We represented just top 10 SNVs. When you move the cursor on each content, you can see more deailed mutation information on the Tooltip. Those are primary_site, primary_histology, mutation(aa), pubmedID. |
| Genomic Position | Mutation(aa) | Unique sampleID count |
| chrX:70349258 | p.L1224V | 4 |
| chrX:70356862 | p.N1845T | 3 |
| chrX:70338703 | p.A240V | 2 |
| chrX:70348505 | p.R817H | 2 |
| chrX:70340986 | p.V1588M | 2 |
| chrX:70339568 | p.F684L | 2 |
| chrX:70343021 | p.R1627H | 2 |
| chrX:70346843 | p.R1138G | 2 |
| chrX:70344691 | p.Q2065Q | 2 |
| chrX:70354597 | p.E904Q | 2 |
| * Copy number data were extracted from TCGA using R package TCGA-Assembler. The URLs of all public data files on TCGA DCC data server were gathered on Jan-05-2015. Function ProcessCNAData in TCGA-Assembler package was used to obtain gene-level copy number value which is calculated as the average copy number of the genomic region of a gene. |
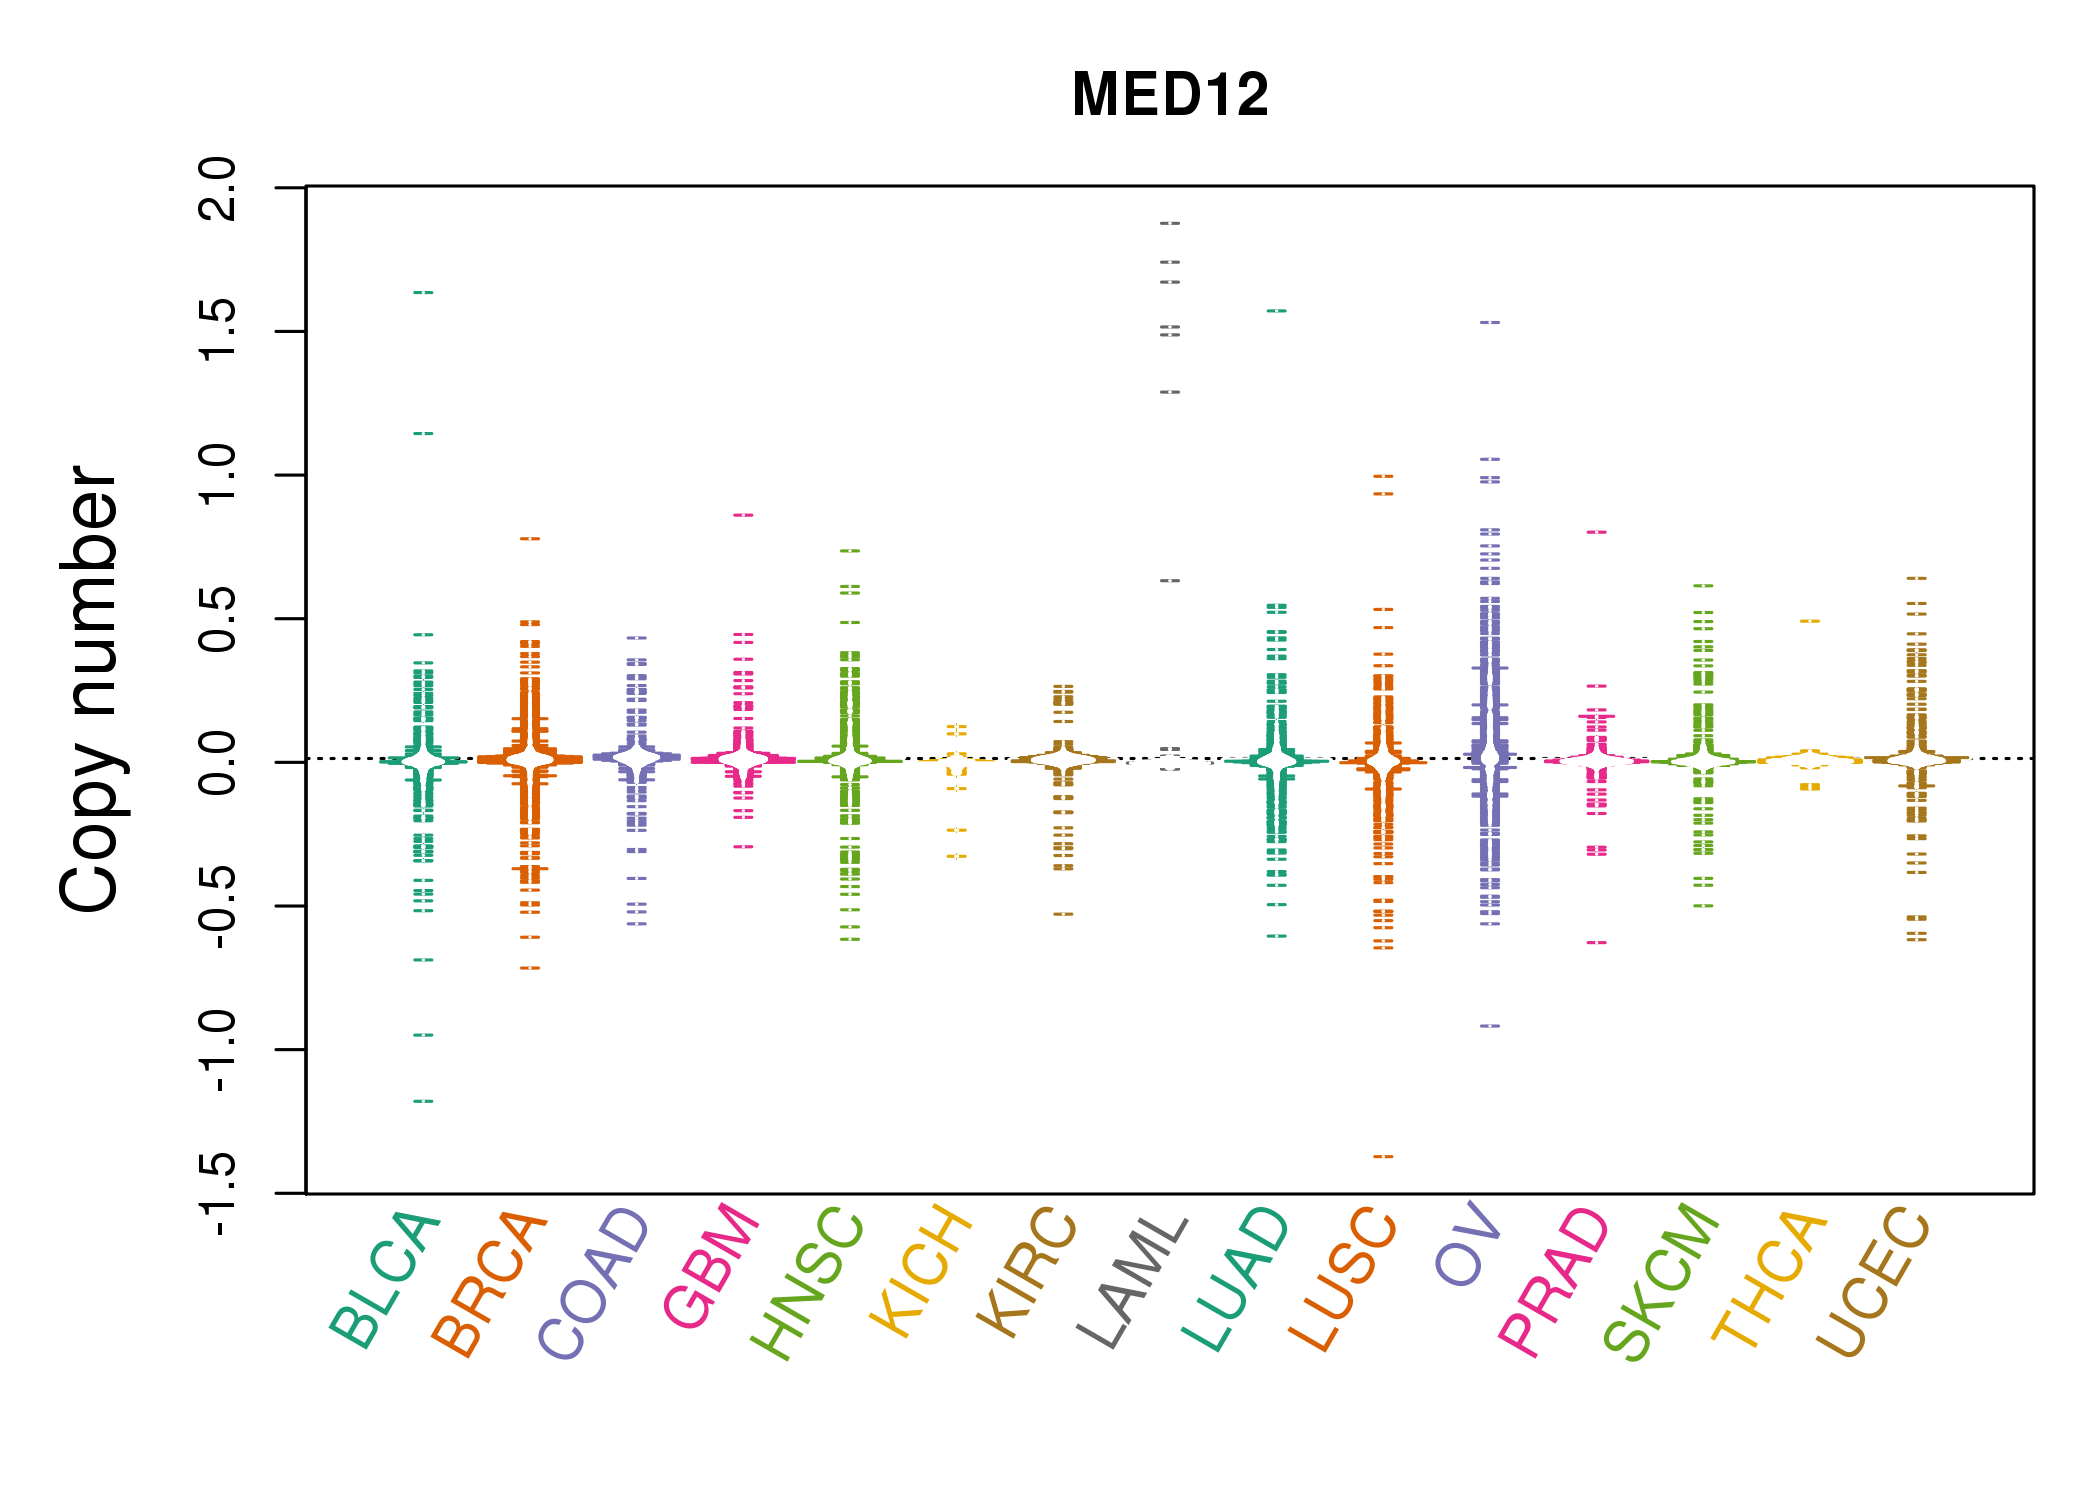 |
| cf) Tissue ID[Tissue type]: BLCA[Bladder Urothelial Carcinoma], BRCA[Breast invasive carcinoma], CESC[Cervical squamous cell carcinoma and endocervical adenocarcinoma], COAD[Colon adenocarcinoma], GBM[Glioblastoma multiforme], Glioma Low Grade, HNSC[Head and Neck squamous cell carcinoma], KICH[Kidney Chromophobe], KIRC[Kidney renal clear cell carcinoma], KIRP[Kidney renal papillary cell carcinoma], LAML[Acute Myeloid Leukemia], LUAD[Lung adenocarcinoma], LUSC[Lung squamous cell carcinoma], OV[Ovarian serous cystadenocarcinoma ], PAAD[Pancreatic adenocarcinoma], PRAD[Prostate adenocarcinoma], SKCM[Skin Cutaneous Melanoma], STAD[Stomach adenocarcinoma], THCA[Thyroid carcinoma], UCEC[Uterine Corpus Endometrial Carcinoma] |
| Top |
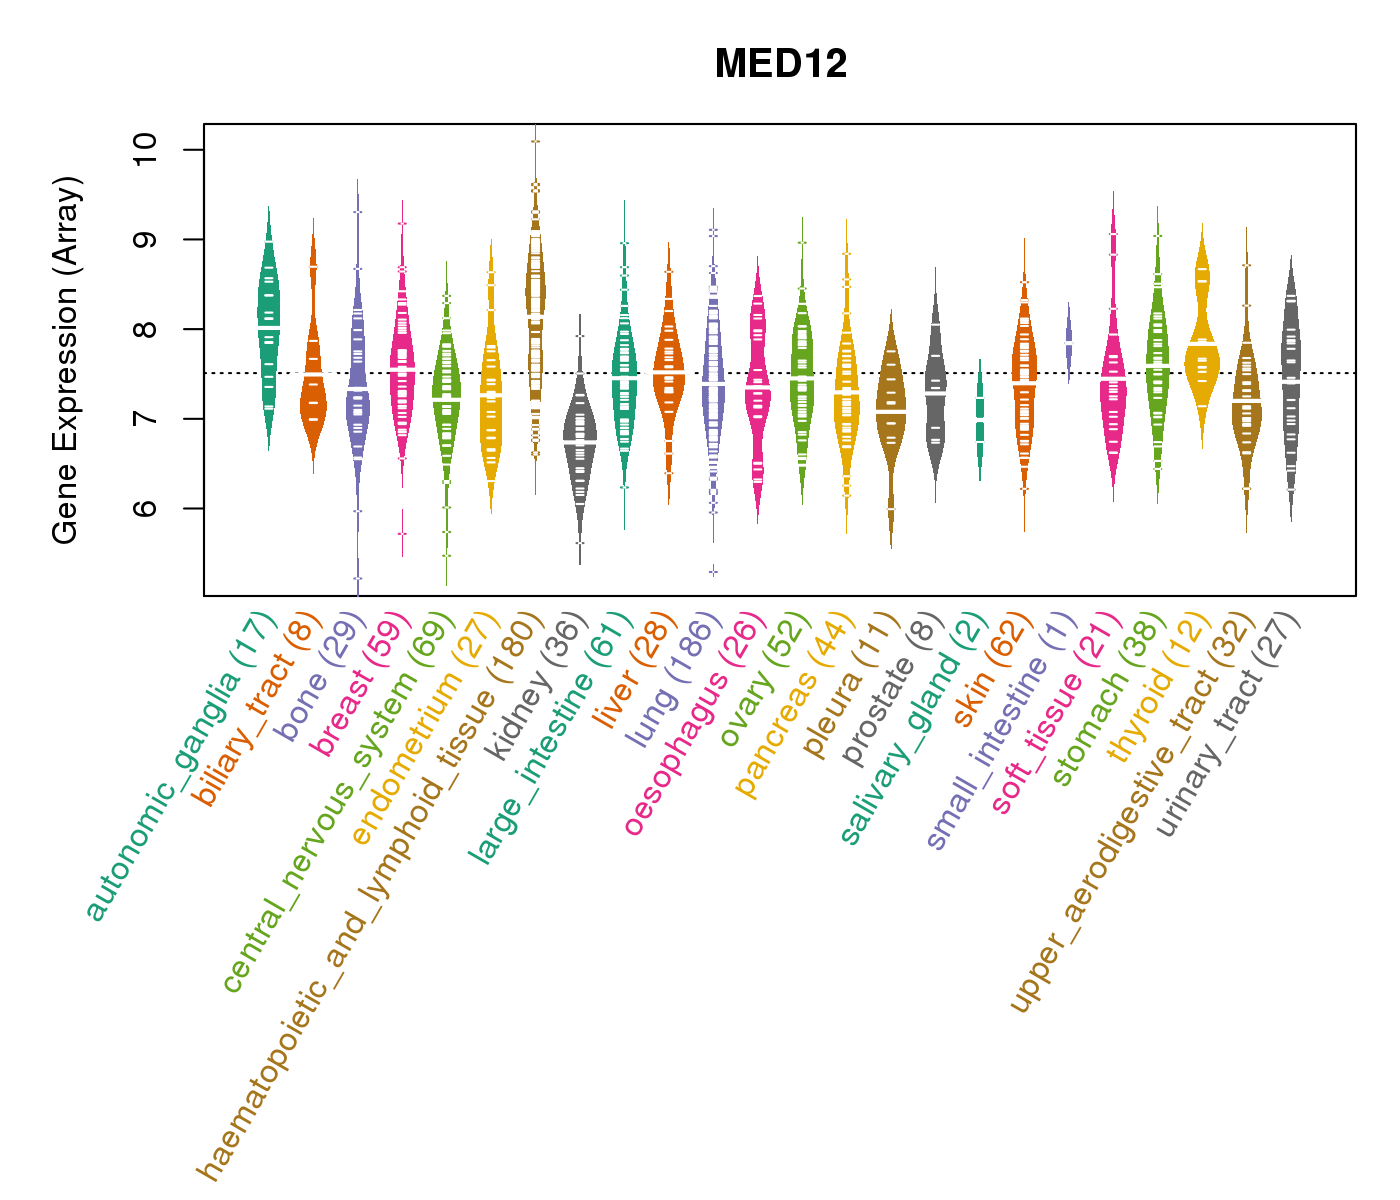
| Gene Expression for MED12 |
| * CCLE gene expression data were extracted from CCLE_Expression_Entrez_2012-10-18.res: Gene-centric RMA-normalized mRNA expression data. |
 |
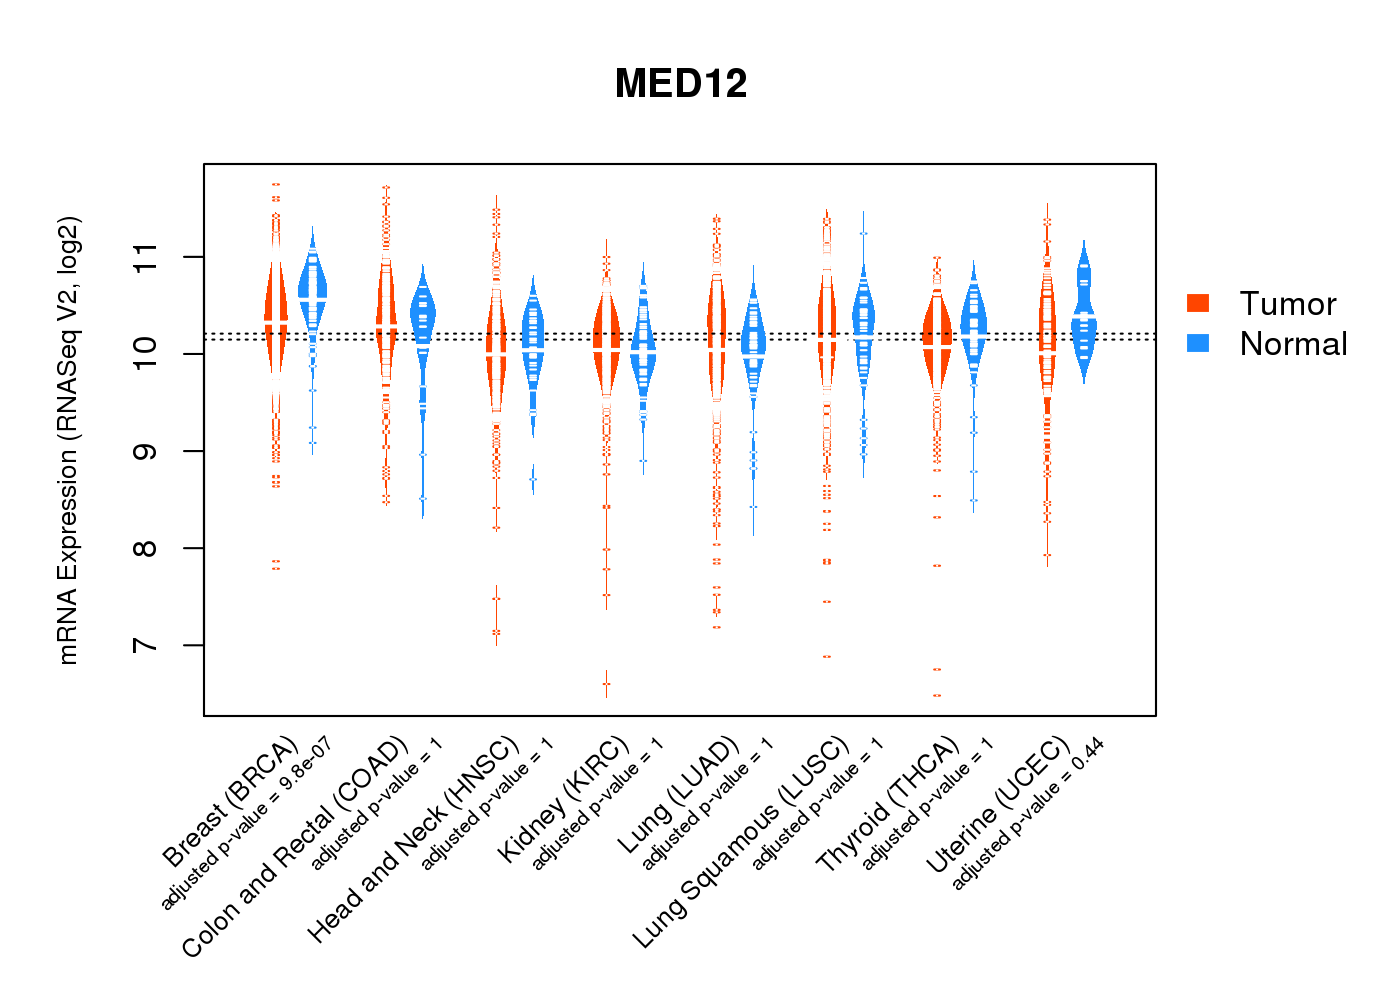
| * Normalized gene expression data of RNASeqV2 was extracted from TCGA using R package TCGA-Assembler. The URLs of all public data files on TCGA DCC data server were gathered at Jan-05-2015. Only eight cancer types have enough normal control samples for differential expression analysis. (t test, adjusted p<0.05 (using Benjamini-Hochberg FDR)) |
 |
| Top |
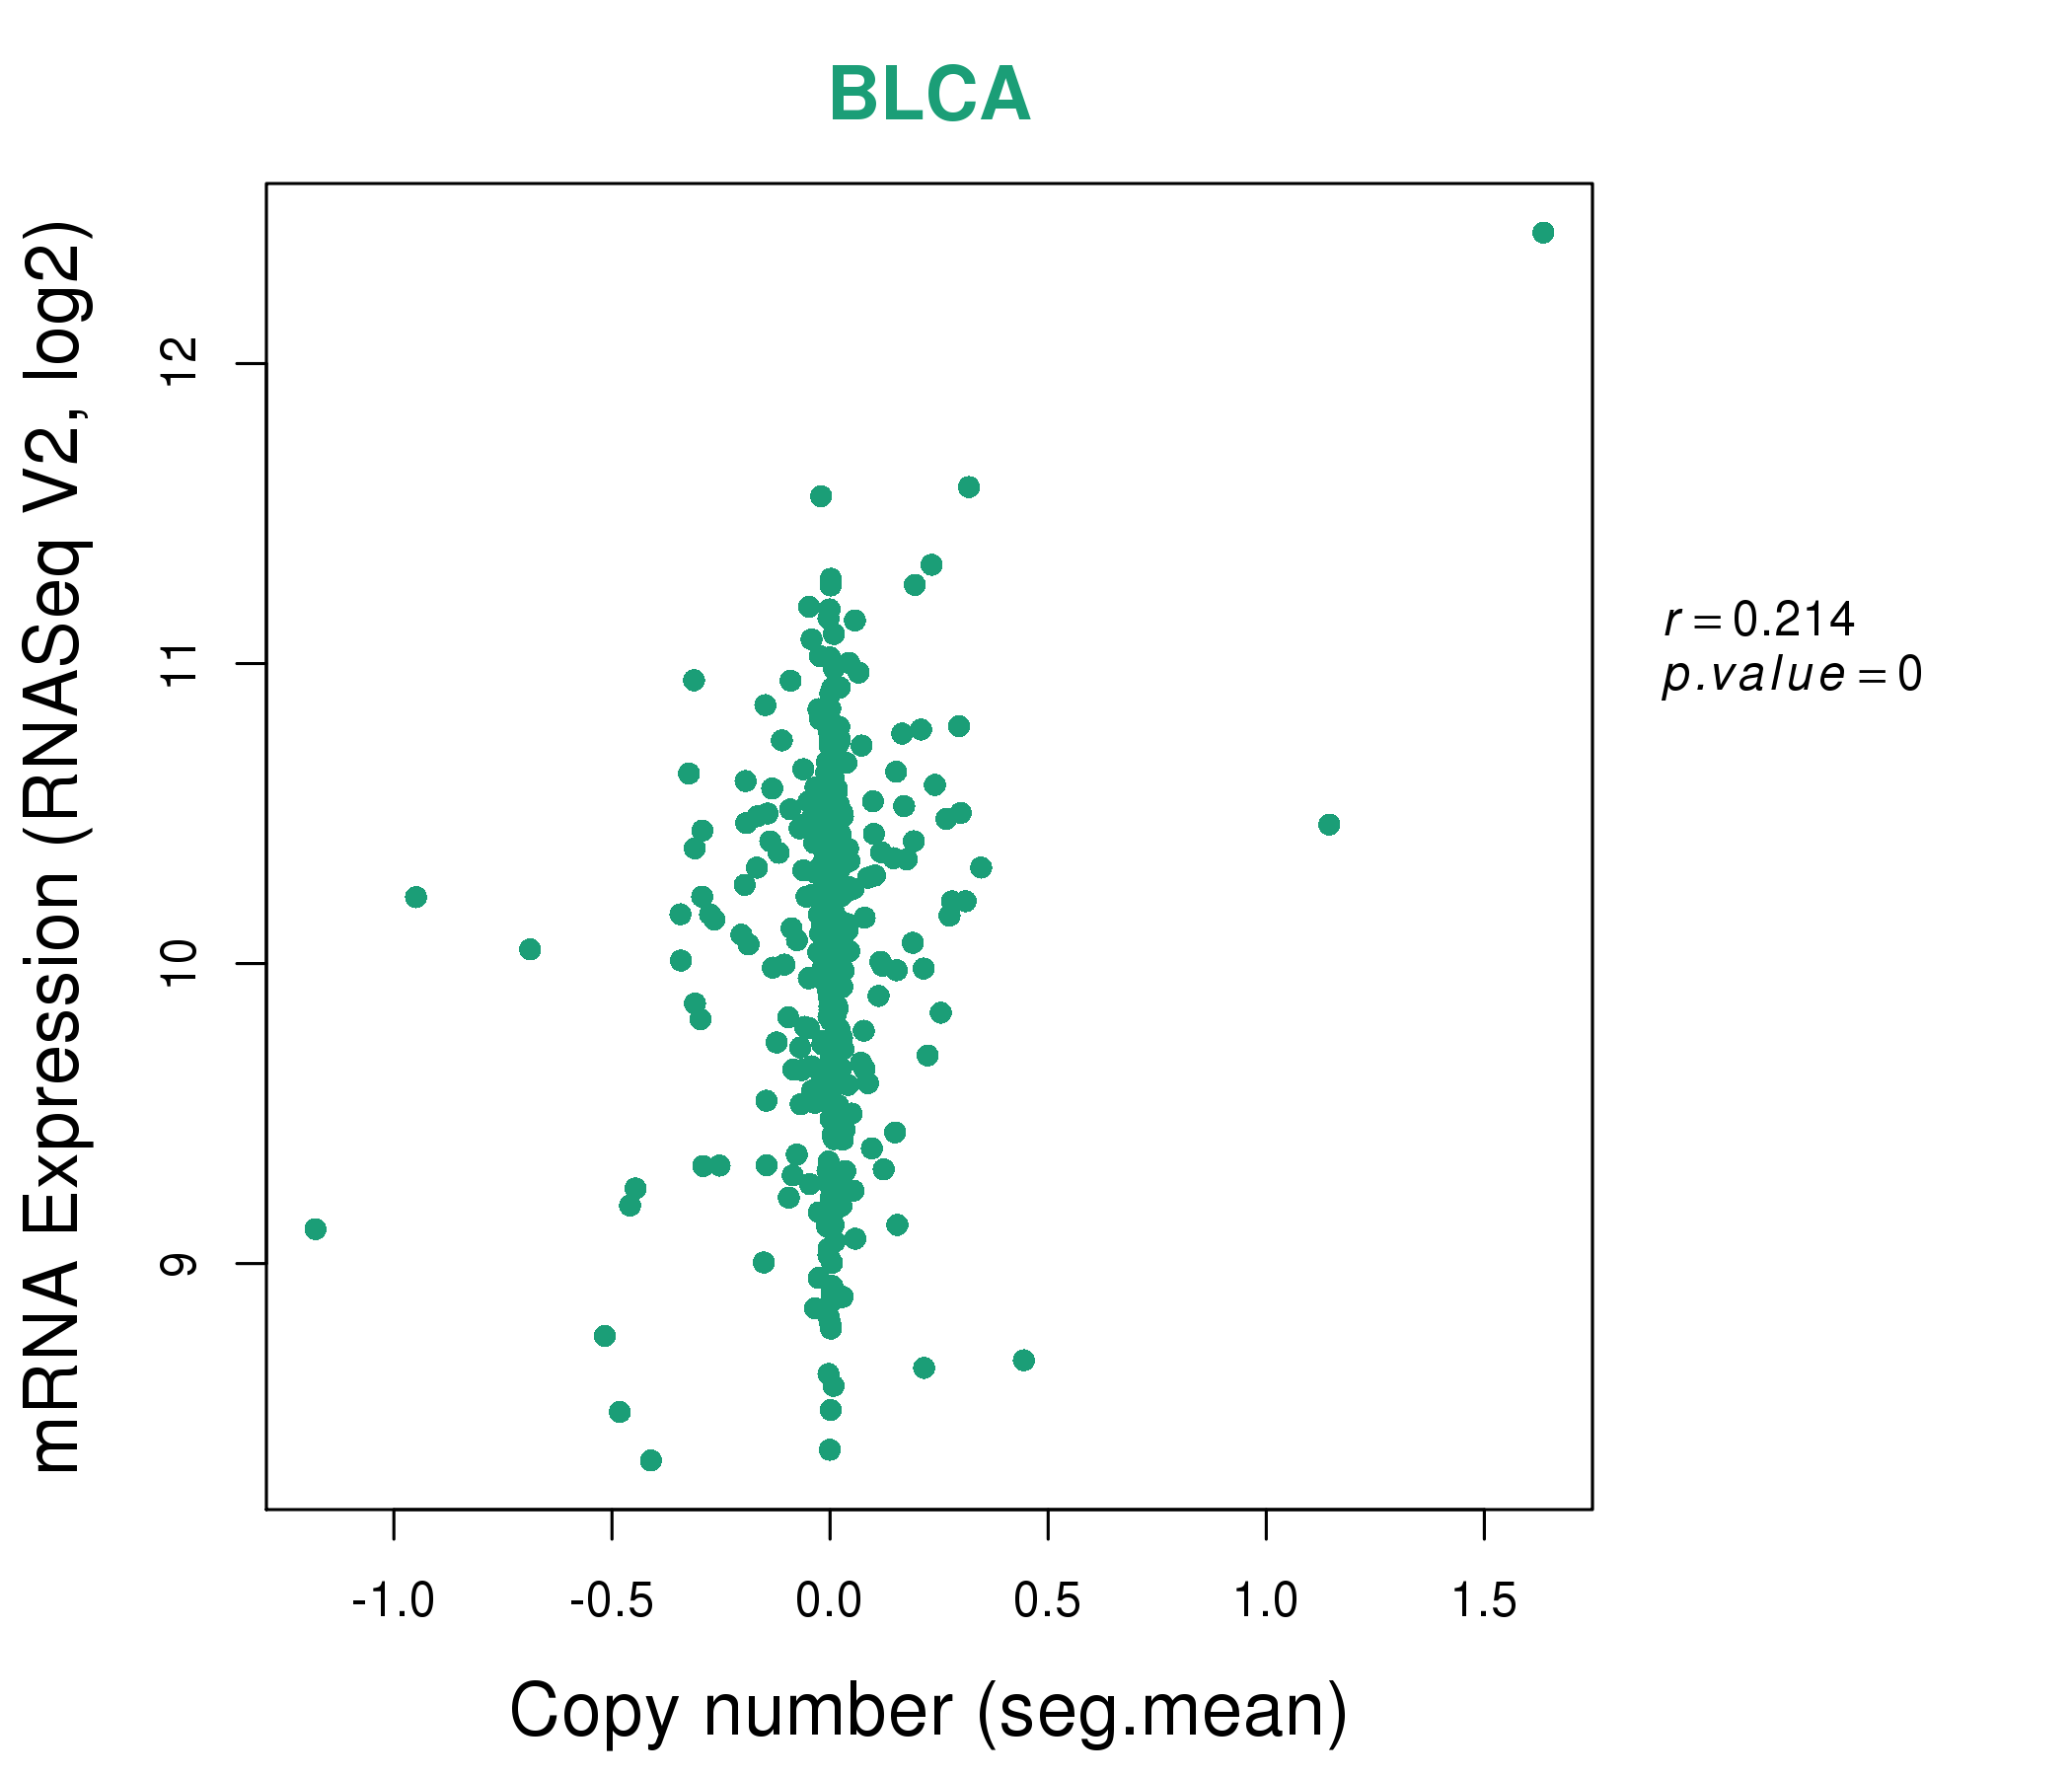
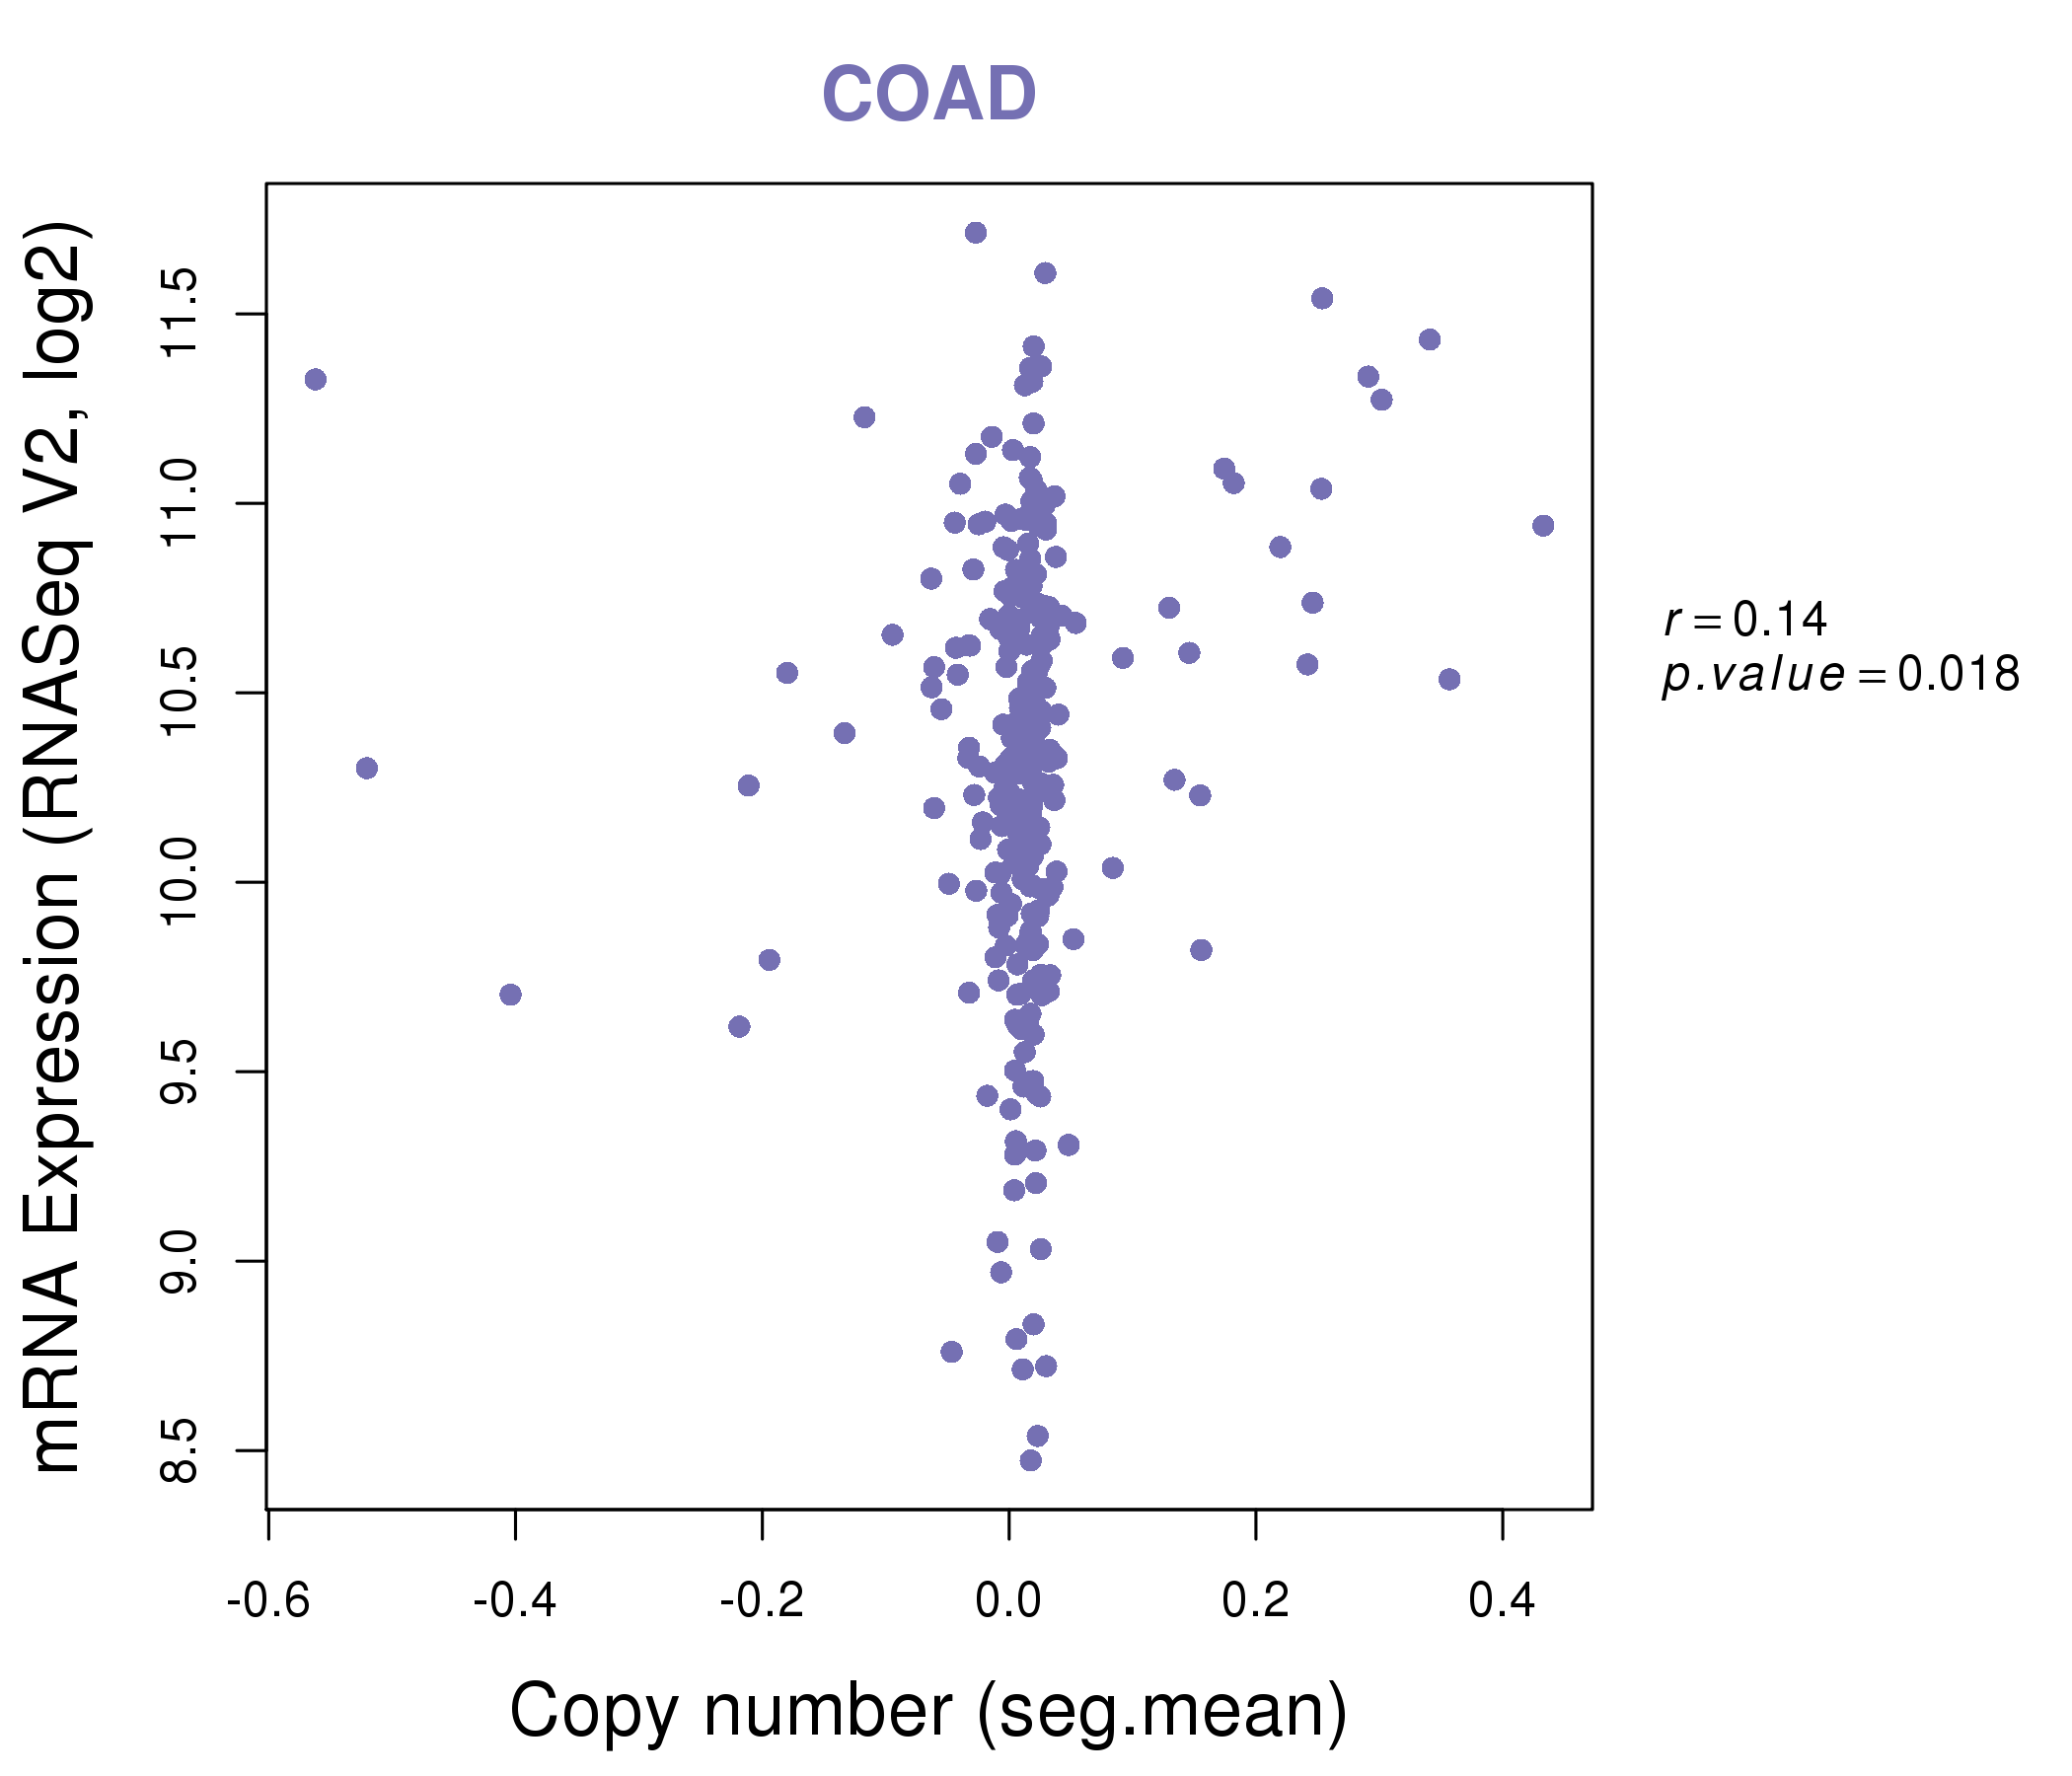
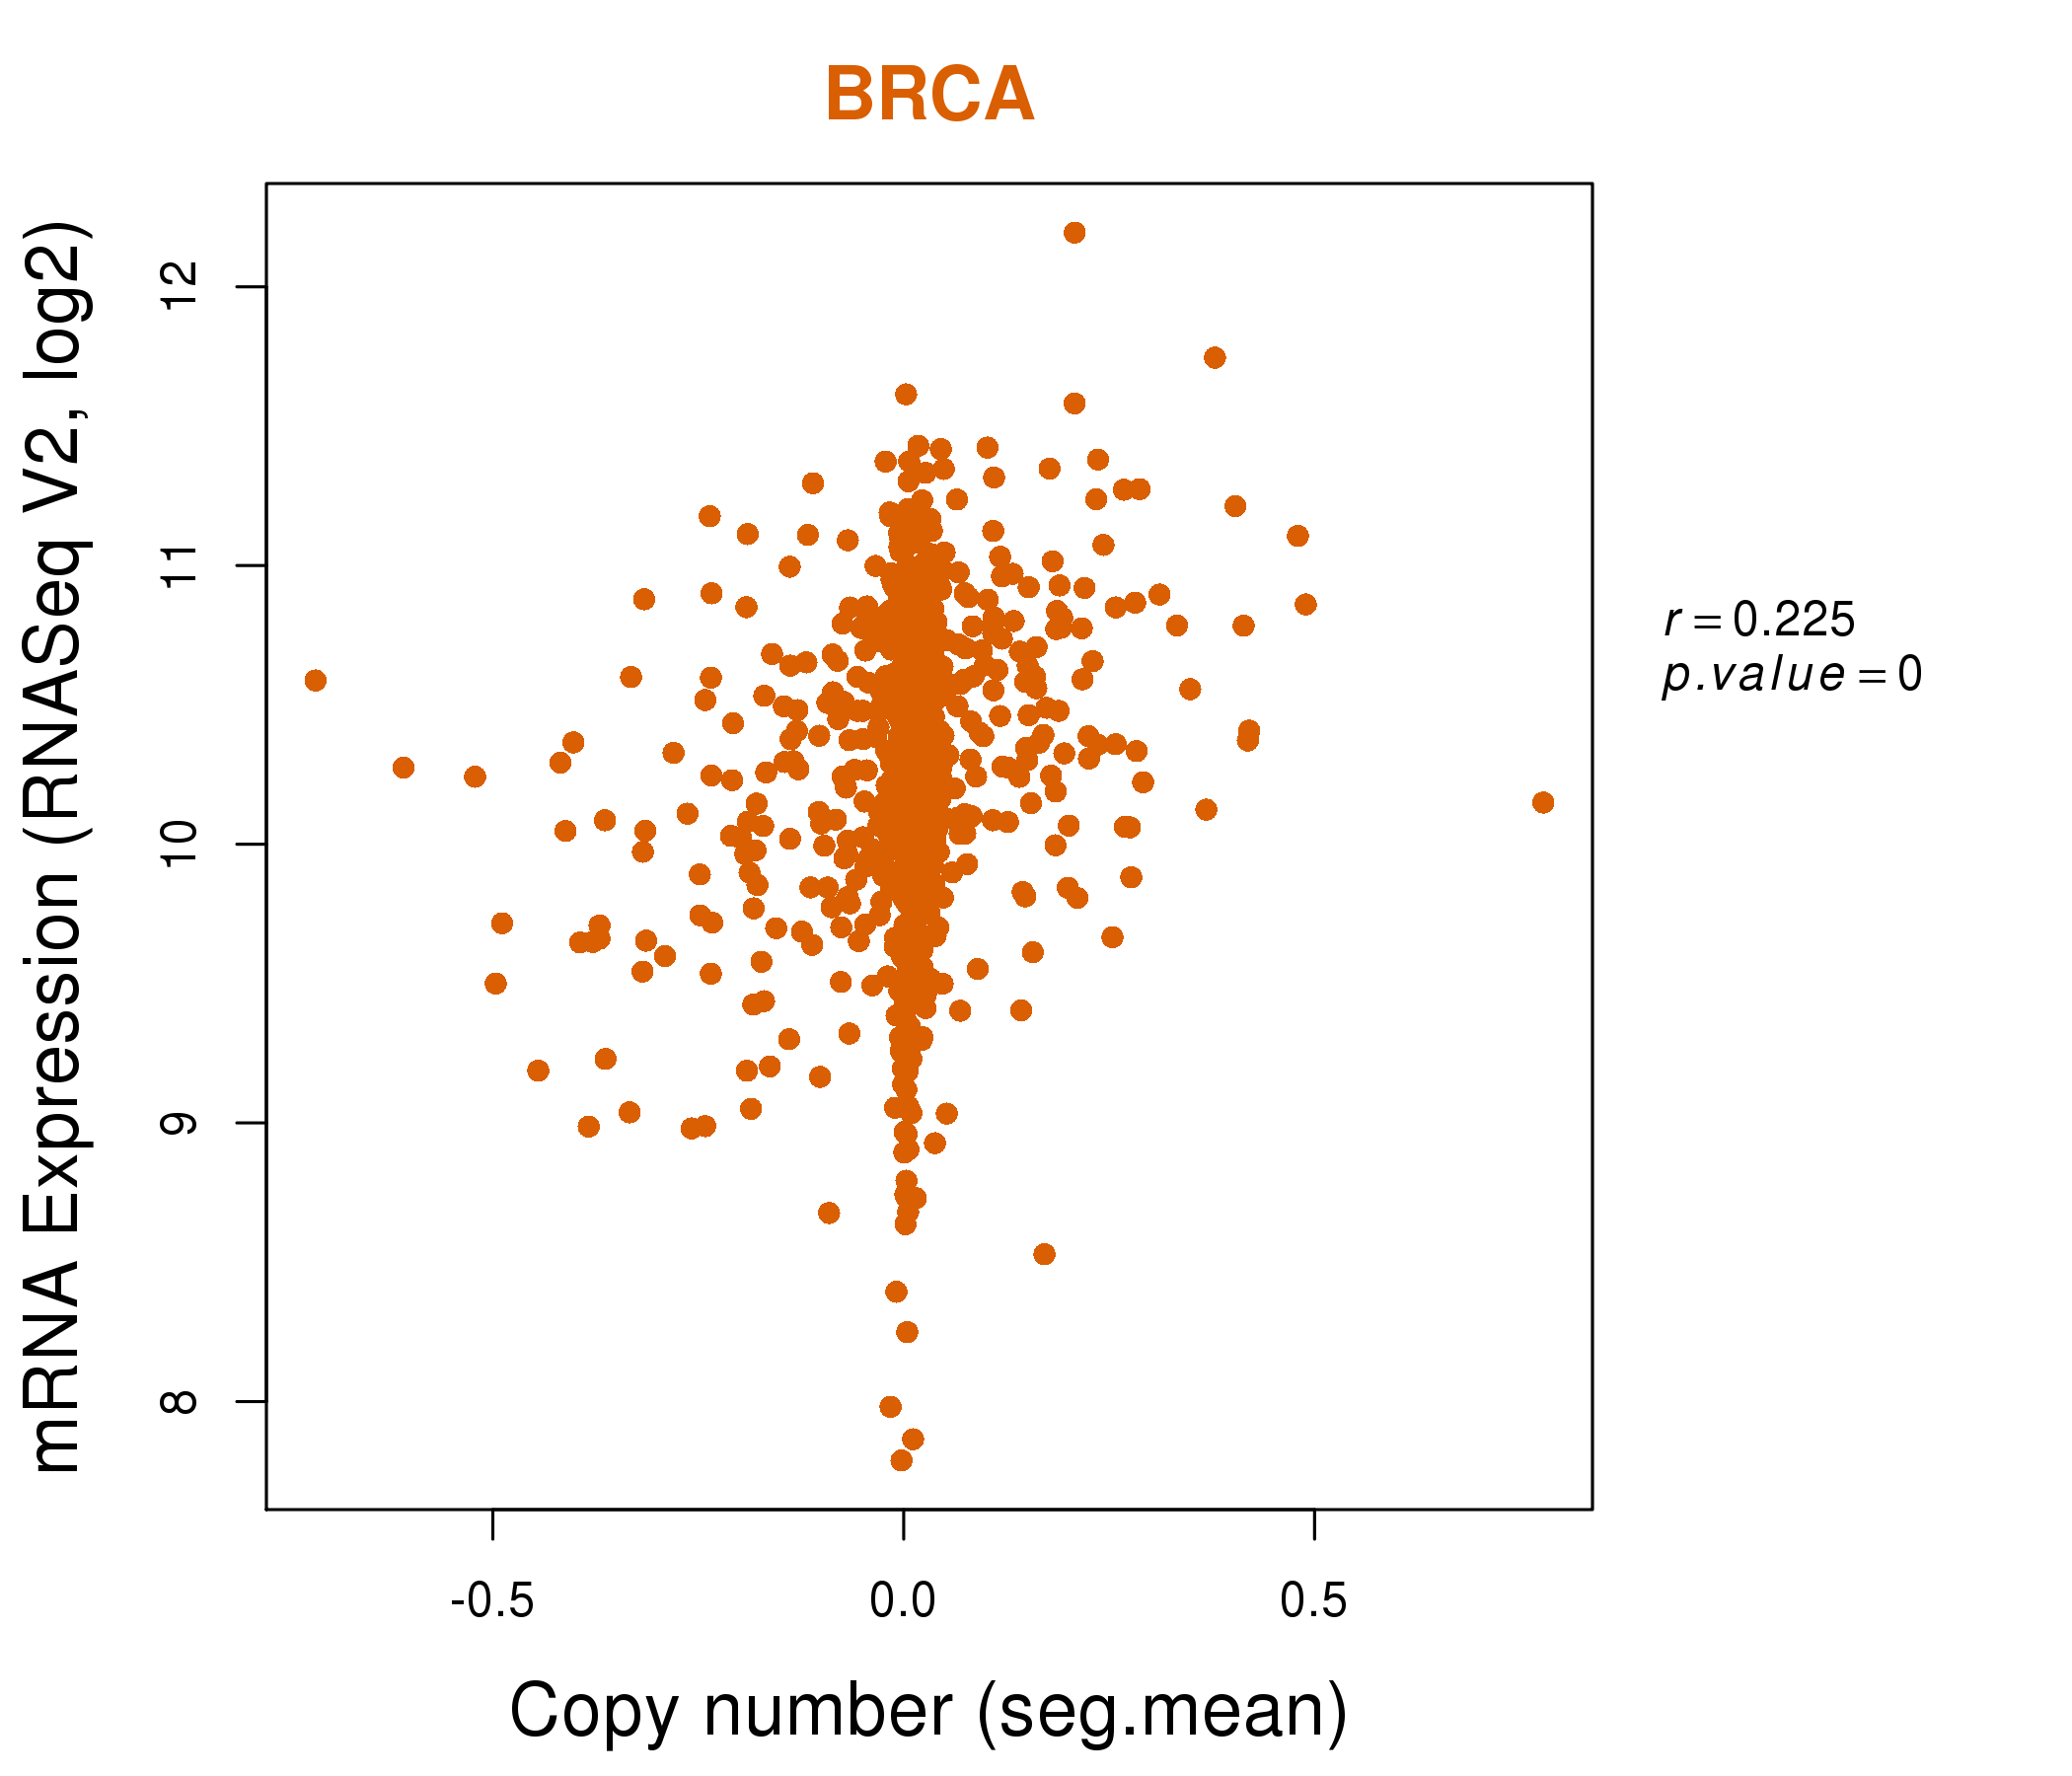
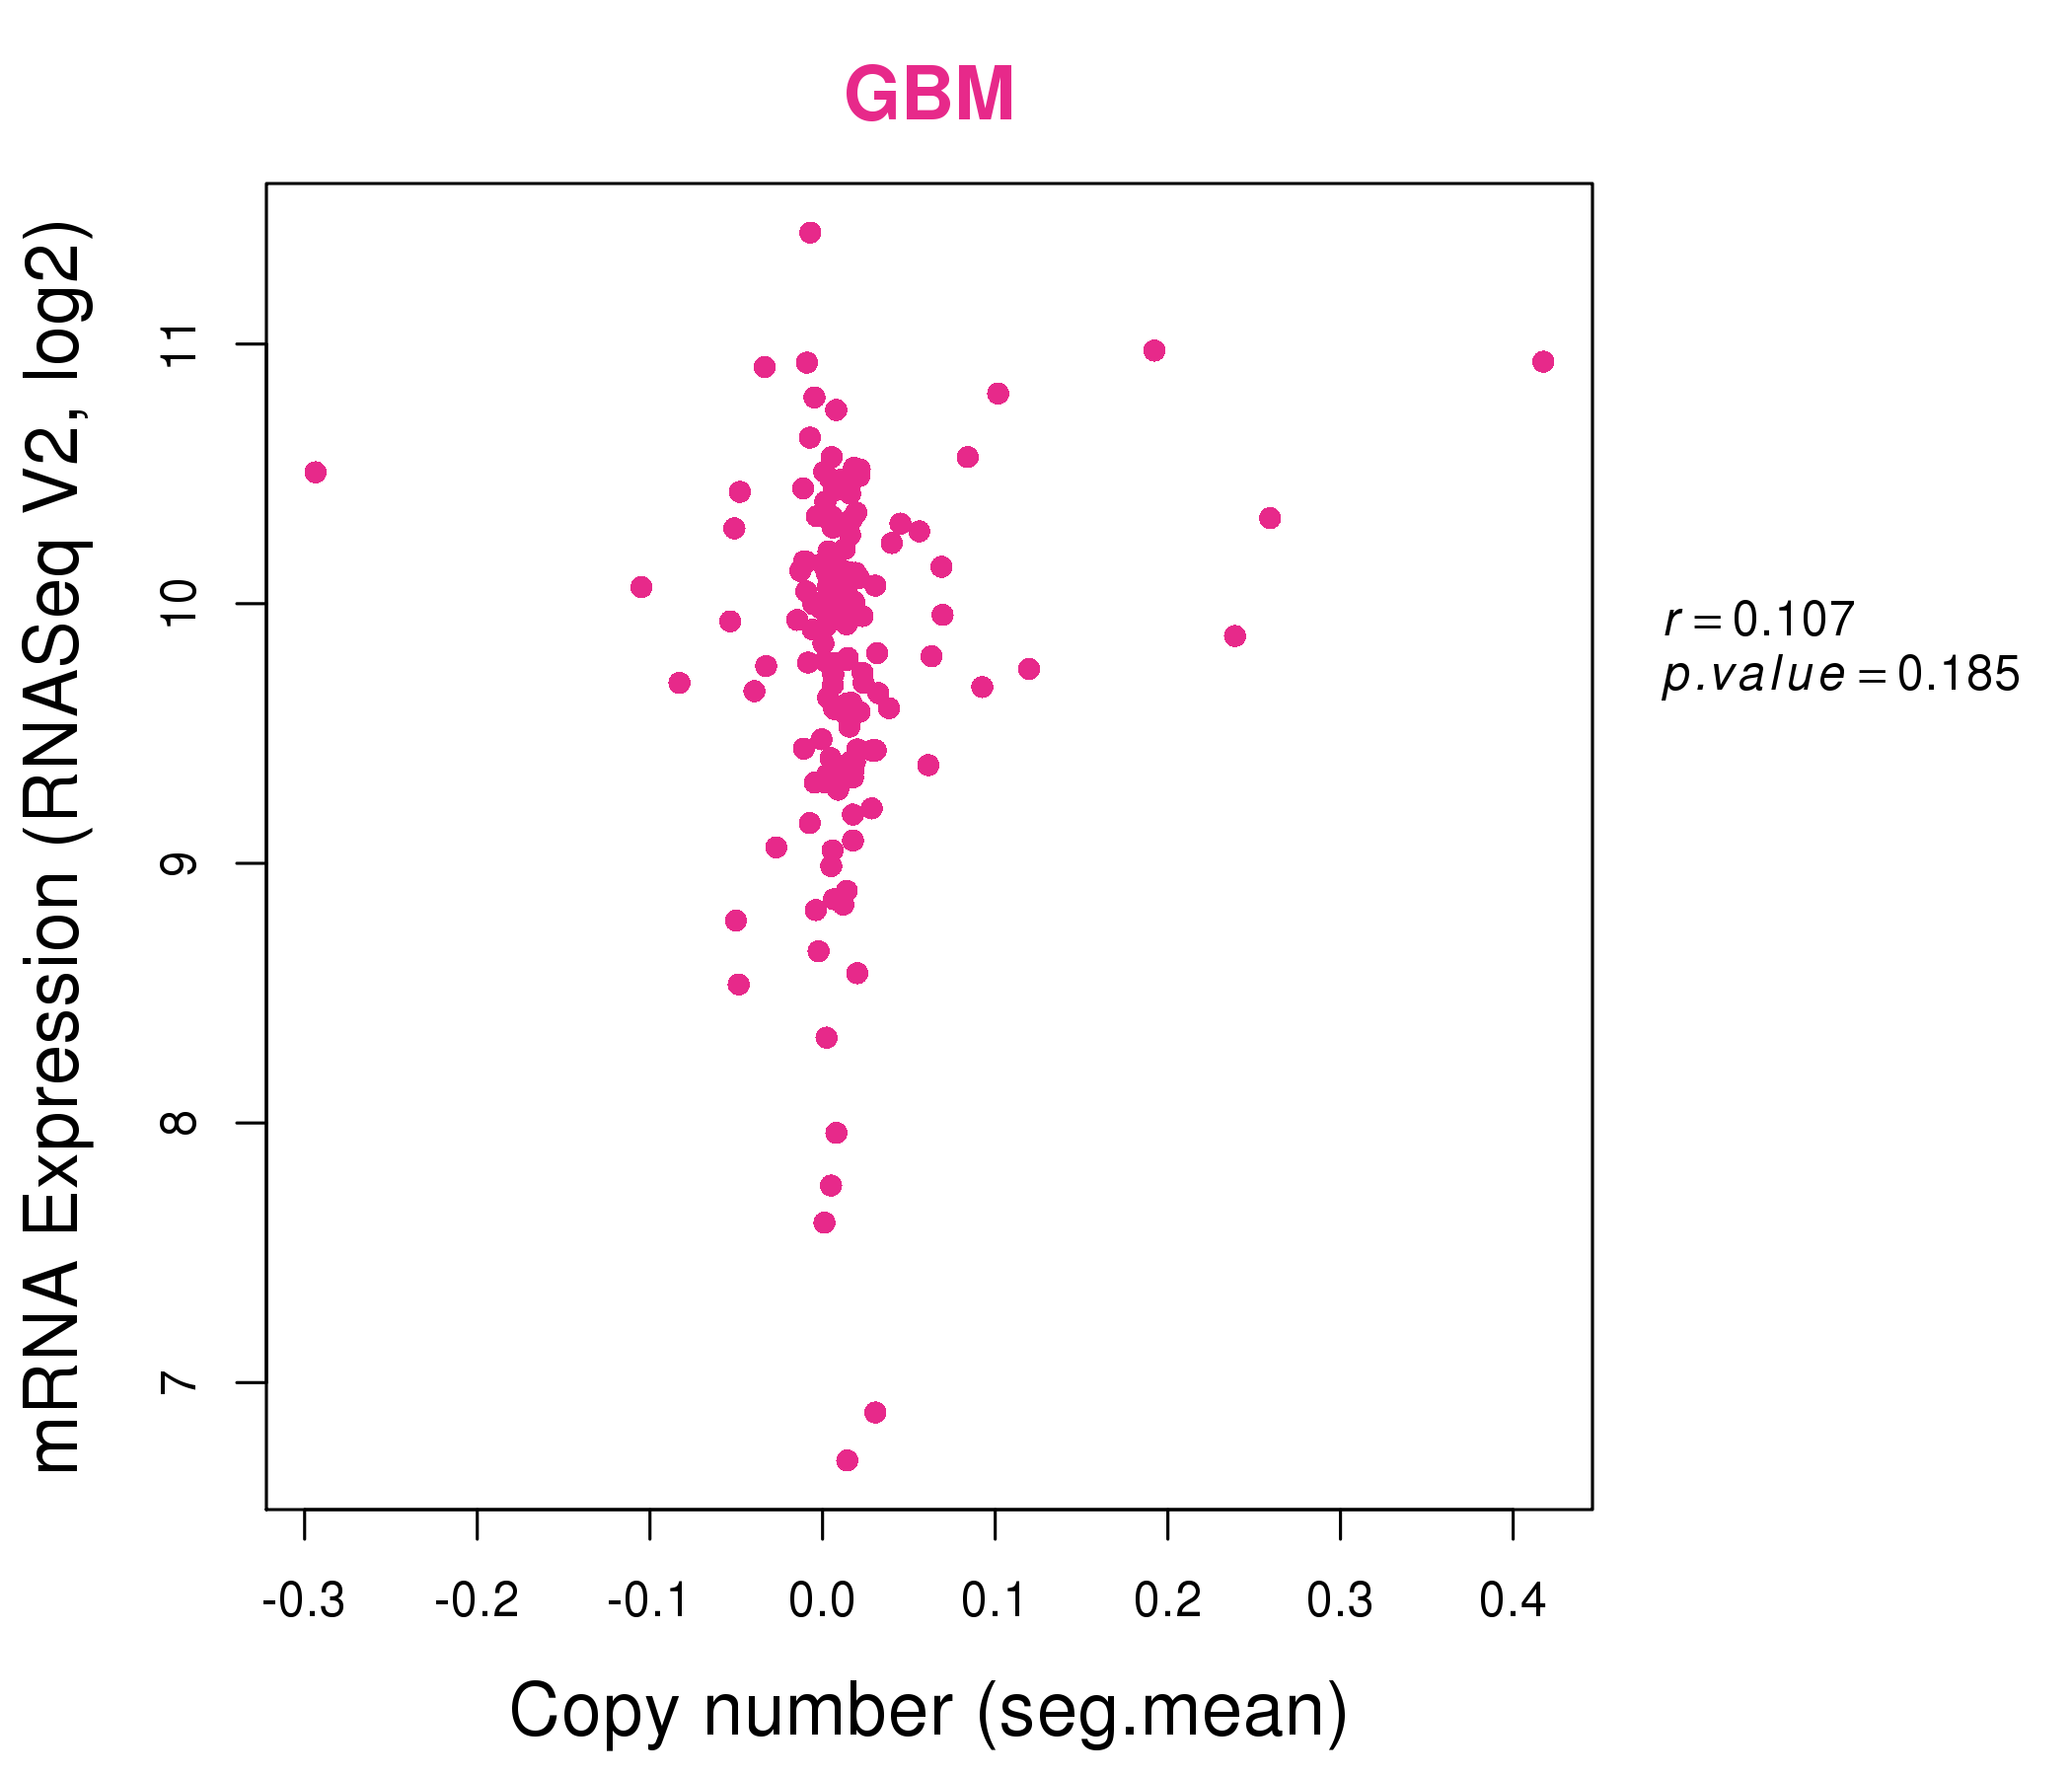
| * This plots show the correlation between CNV and gene expression. |
: Open all plots for all cancer types
 |
|
 |
|
| Top |
| Gene-Gene Network Information |
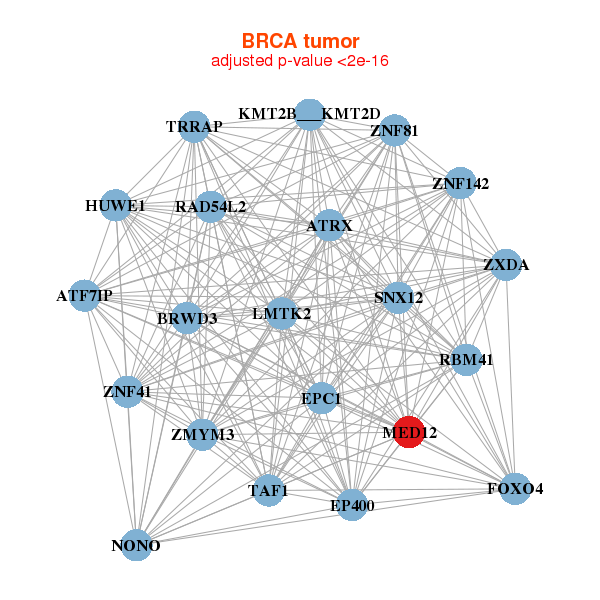
| * Co-Expression network figures were drawn using R package igraph. Only the top 20 genes with the highest correlations were shown. Red circle: input gene, orange circle: cell metabolism gene, sky circle: other gene |
: Open all plots for all cancer types
 |
|
| ATF7IP,ATRX,BRWD3,EP400,EPC1,FOXO4,HUWE1, LMTK2,MED12,KMT2B___KMT2D,NONO,RAD54L2,RBM41,SNX12, TAF1,TRRAP,ZMYM3,ZNF142,ZNF41,ZNF81,ZXDA | ARID1B,PRRC2B,BAZ2A,HECTD4,CREBBP,EP300,EP400, EVC,HERC2,LMTK2,MDN1,MECP2,MED12,KMT2B___KMT2D, NUP214,PRPF8,RAD54L2,RGP1,SPEN,TRRAP,ZNF142 |
 |
|
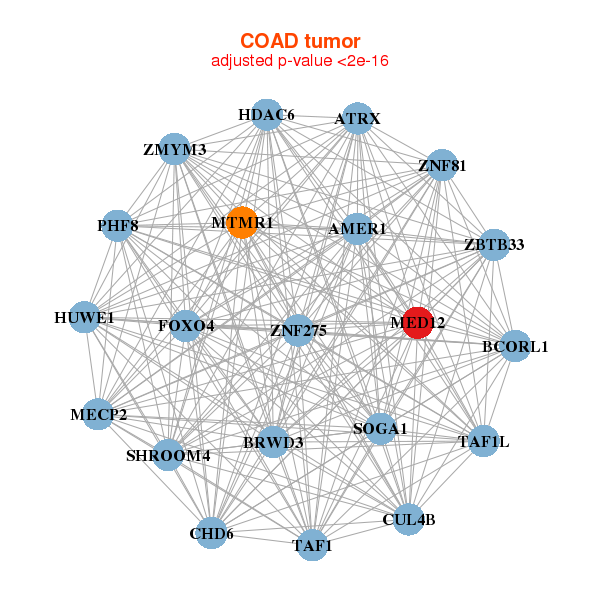
| ATRX,BCORL1,BRWD3,SOGA1,CHD6,CUL4B,AMER1, FOXO4,HDAC6,HUWE1,MECP2,MED12,MTMR1,PHF8, SHROOM4,TAF1,TAF1L,ZBTB33,ZMYM3,ZNF275,ZNF81 | ARID1A,BRD1,CHD8,CREBBP,EP300,FAM193A,GTF3C1, KDM2A,EPG5,MAML1,MED12,MEGF8,PHF8,PRPF8, PRR12,SMARCC2,SMG6,SNRNP200,SRCAP,TRRAP,USP22 |
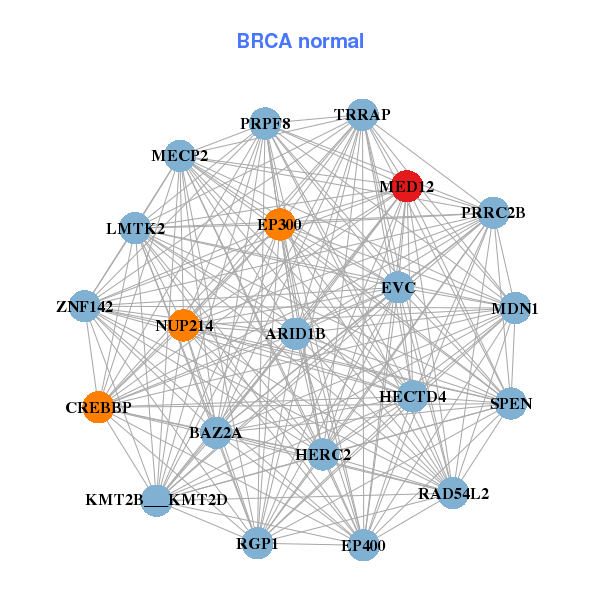
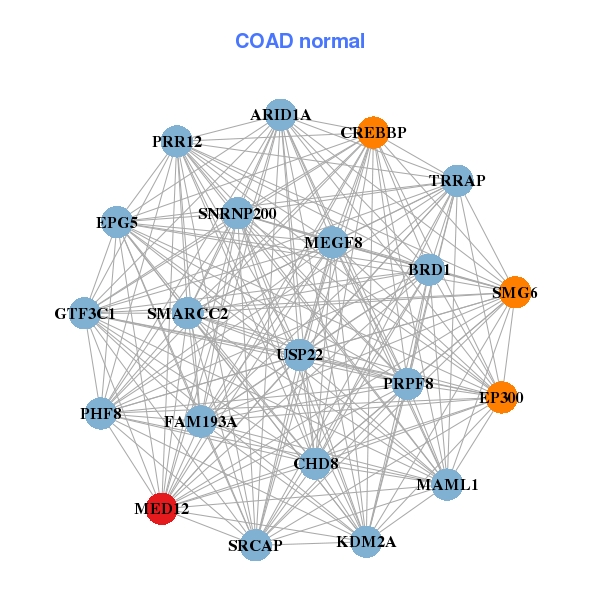
| * Co-Expression network figures were drawn using R package igraph. Only the top 20 genes with the highest correlations were shown. Red circle: input gene, orange circle: cell metabolism gene, sky circle: other gene |
: Open all plots for all cancer types
| Top |
: Open all interacting genes' information including KEGG pathway for all interacting genes from DAVID
| Top |
| Pharmacological Information for MED12 |
| There's no related Drug. |
| Top |
| Cross referenced IDs for MED12 |
| * We obtained these cross-references from Uniprot database. It covers 150 different DBs, 18 categories. http://www.uniprot.org/help/cross_references_section |
: Open all cross reference information
|
Copyright © 2016-Present - The Univsersity of Texas Health Science Center at Houston @ |