|
||||||||||||||||||||||||||||||||||||||||||||||||||||||||||||||||||||||||||||||||||||||||||||||||||||||||||||||||||||||||||||||||||||||||||||||||||||||||||||||||||||||||||||||||||||||||||||||||||||||||||||||||||||||||||||||||||||||||||||||||||||||||||||||||||||||||||||||||||||||||||||||||||||||||||||||||||||||||||
| |
| Phenotypic Information (metabolism pathway, cancer, disease, phenome) |
| |
| |
| Gene-Gene Network Information: Co-Expression Network, Interacting Genes & KEGG |
| |
|


| Gene Summary for NUP153 |
| Top |
| Phenotypic Information for NUP153(metabolism pathway, cancer, disease, phenome) |
| Cancer | CGAP: NUP153 |
| Familial Cancer Database: NUP153 | |
| * This gene is included in those cancer gene databases. |
|
|
|
|
|
| . | ||||||||||||||||||||||||||||||||||||||||||||||||||||||||||||||||||||||||||||||||||||||||||||||||||||||||||||||||||||||||||||||||||||||||||||||||||||||||||||||||||||||||||||||||||||||||||||||||||||||||||||||||||||||||||||||||||||||||||||||||||||||||||||||||||||||||||||||||||||||||||||||||||||||||||||||||||||
Oncogene 1 | Significant driver gene in | |||||||||||||||||||||||||||||||||||||||||||||||||||||||||||||||||||||||||||||||||||||||||||||||||||||||||||||||||||||||||||||||||||||||||||||||||||||||||||||||||||||||||||||||||||||||||||||||||||||||||||||||||||||||||||||||||||||||||||||||||||||||||||||||||||||||||||||||||||||||||||||||||||||||||||||||||||||||||
| cf) number; DB name 1 Oncogene; http://nar.oxfordjournals.org/content/35/suppl_1/D721.long, 2 Tumor Suppressor gene; https://bioinfo.uth.edu/TSGene/, 3 Cancer Gene Census; http://www.nature.com/nrc/journal/v4/n3/abs/nrc1299.html, 4 CancerGenes; http://nar.oxfordjournals.org/content/35/suppl_1/D721.long, 5 Network of Cancer Gene; http://ncg.kcl.ac.uk/index.php, 1Therapeutic Vulnerabilities in Cancer; http://cbio.mskcc.org/cancergenomics/statius/ |
| REACTOME_METABOLISM_OF_NON_CODING_RNA REACTOME_METABOLISM_OF_RNA REACTOME_METABOLISM_OF_CARBOHYDRATES | |
| OMIM | 603948; gene. |
| Orphanet | |
| Disease | KEGG Disease: NUP153 |
| MedGen: NUP153 (Human Medical Genetics with Condition) | |
| ClinVar: NUP153 | |
| Phenotype | MGI: NUP153 (International Mouse Phenotyping Consortium) |
| PhenomicDB: NUP153 | |
| Mutations for NUP153 |
| * Under tables are showing count per each tissue to give us broad intuition about tissue specific mutation patterns.You can go to the detailed page for each mutation database's web site. |
| - Statistics for Tissue and Mutation type | Top |
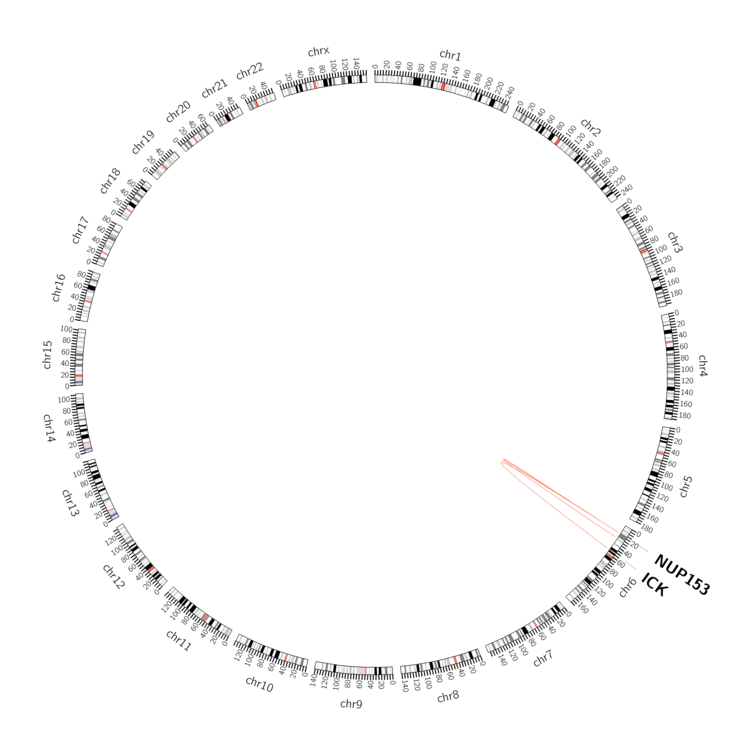 |
| - For Inter-chromosomal Variations |
| There's no inter-chromosomal structural variation. |
| - For Intra-chromosomal Variations |
| * Intra-chromosomal variantions includes 'intrachromosomal amplicon to amplicon', 'intrachromosomal amplicon to non-amplified dna', 'intrachromosomal deletion', 'intrachromosomal fold-back inversion', 'intrachromosomal inversion', 'intrachromosomal tandem duplication', 'Intrachromosomal unknown type', 'intrachromosomal with inverted orientation', 'intrachromosomal with non-inverted orientation'. |
 |
| Sample | Symbol_a | Chr_a | Start_a | End_a | Symbol_b | Chr_b | Start_b | End_b |
| ovary | NUP153 | chr6 | 17648872 | 17648892 | NUP153 | chr6 | 17650680 | 17650700 |
| ovary | NUP153 | chr6 | 17651269 | 17651289 | ICK | chr6 | 52919524 | 52919544 |
| ovary | NUP153 | chr6 | 17686634 | 17686654 | NUP153 | chr6 | 17636664 | 17636684 |
| pancreas | NUP153 | chr6 | 17673236 | 17673256 | chr6 | 27752265 | 27752285 | |
| pancreas | NUP153 | chr6 | 17700737 | 17700757 | NUP153 | chr6 | 17702897 | 17702917 |
| cf) Tissue number; Tissue name (1;Breast, 2;Central_nervous_system, 3;Haematopoietic_and_lymphoid_tissue, 4;Large_intestine, 5;Liver, 6;Lung, 7;Ovary, 8;Pancreas, 9;Prostate, 10;Skin, 11;Soft_tissue, 12;Upper_aerodigestive_tract) |
| * From mRNA Sanger sequences, Chitars2.0 arranged chimeric transcripts. This table shows NUP153 related fusion information. |
| ID | Head Gene | Tail Gene | Accession | Gene_a | qStart_a | qEnd_a | Chromosome_a | tStart_a | tEnd_a | Gene_a | qStart_a | qEnd_a | Chromosome_a | tStart_a | tEnd_a |
| BP352751 | NUP153 | 1 | 307 | 6 | 17624791 | 17626071 | NUP153 | 307 | 543 | 6 | 17648038 | 17649531 | |
| AA281956 | NUP153 | 9 | 113 | 6 | 17665469 | 17665573 | NUP153 | 100 | 448 | 6 | 17669728 | 17675782 | |
| Top |
| Mutation type/ Tissue ID | brca | cns | cerv | endome | haematopo | kidn | Lintest | liver | lung | ns | ovary | pancre | prost | skin | stoma | thyro | urina | |||
| Total # sample | 1 | 2 | 1 | |||||||||||||||||
| GAIN (# sample) | 1 | 2 | 1 | |||||||||||||||||
| LOSS (# sample) |
| cf) Tissue ID; Tissue type (1; Breast, 2; Central_nervous_system, 3; Cervix, 4; Endometrium, 5; Haematopoietic_and_lymphoid_tissue, 6; Kidney, 7; Large_intestine, 8; Liver, 9; Lung, 10; NS, 11; Ovary, 12; Pancreas, 13; Prostate, 14; Skin, 15; Stomach, 16; Thyroid, 17; Urinary_tract) |
| Top |
|
 |
| Top |
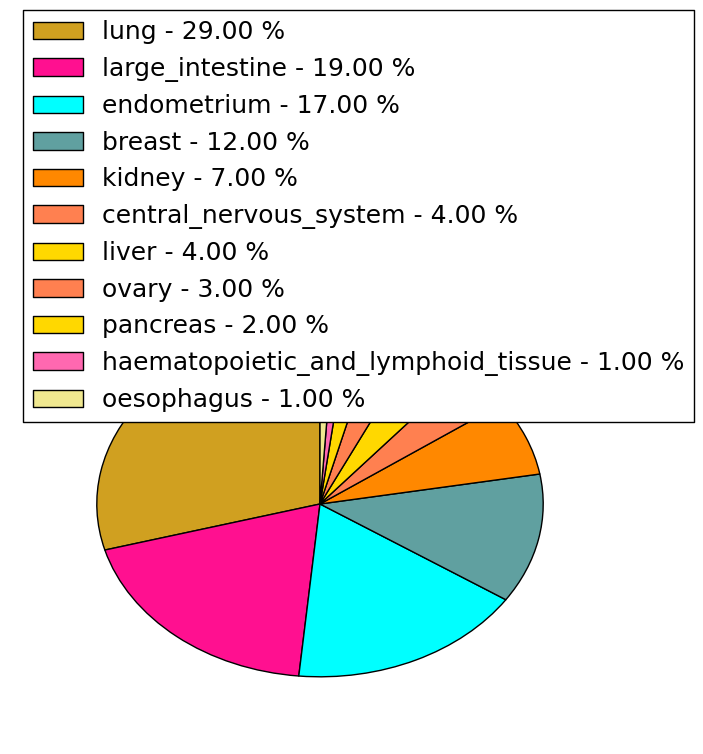
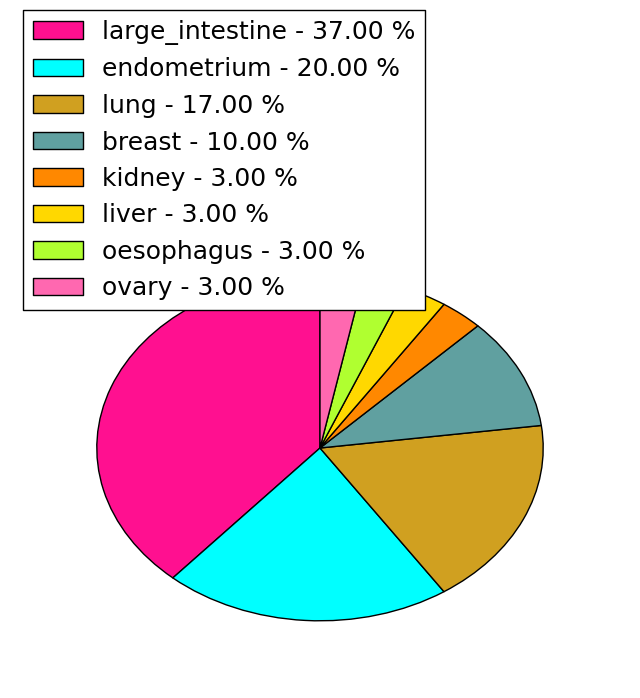
| Stat. for Non-Synonymous SNVs (# total SNVs=99) | (# total SNVs=29) |
 |  |
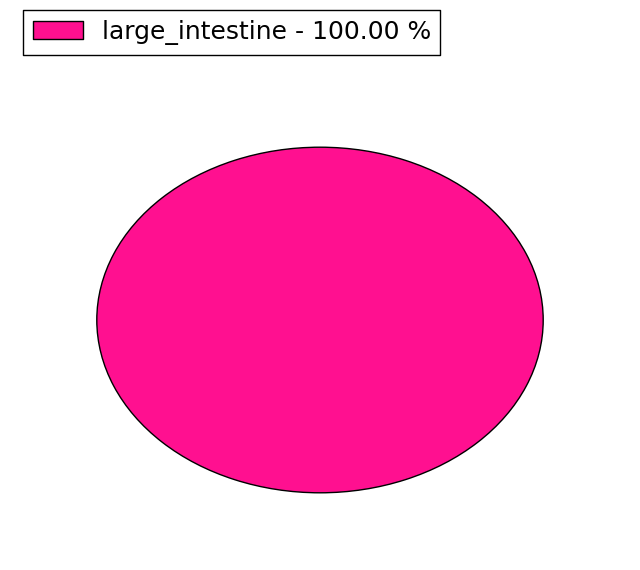
(# total SNVs=1) | (# total SNVs=1) |
 |  |
| Top |
| * When you move the cursor on each content, you can see more deailed mutation information on the Tooltip. Those are primary_site,primary_histology,mutation(aa),pubmedID. |
| GRCh37 position | Mutation(aa) | Unique sampleID count |
| chr6:17637424-17637424 | p.A808A | 4 |
| chr6:17629357-17629357 | p.G1025S | 3 |
| chr6:17629745-17629745 | p.S895S | 3 |
| chr6:17637996-17637996 | p.A618T | 3 |
| chr6:17675939-17675939 | p.R133W | 2 |
| chr6:17629341-17629341 | p.N1030S | 2 |
| chr6:17616339-17616339 | p.R1473C | 2 |
| chr6:17637957-17637957 | p.A631T | 2 |
| chr6:17616370-17616370 | p.F1462L | 2 |
| chr6:17629013-17629013 | p.E1139E | 2 |
| Top |
|
 |
| Point Mutation/ Tissue ID | 1 | 2 | 3 | 4 | 5 | 6 | 7 | 8 | 9 | 10 | 11 | 12 | 13 | 14 | 15 | 16 | 17 | 18 | 19 | 20 |
| # sample | 4 | 6 | 1 | 13 | 2 | 5 | 6 | 1 | 9 | 9 | 2 | 7 | 16 | 14 | ||||||
| # mutation | 4 | 6 | 1 | 12 | 2 | 5 | 6 | 1 | 9 | 10 | 2 | 8 | 17 | 22 | ||||||
| nonsynonymous SNV | 3 | 5 | 1 | 8 | 2 | 4 | 4 | 1 | 8 | 7 | 2 | 6 | 13 | 17 | ||||||
| synonymous SNV | 1 | 1 | 4 | 1 | 2 | 1 | 3 | 2 | 4 | 5 |
| cf) Tissue ID; Tissue type (1; BLCA[Bladder Urothelial Carcinoma], 2; BRCA[Breast invasive carcinoma], 3; CESC[Cervical squamous cell carcinoma and endocervical adenocarcinoma], 4; COAD[Colon adenocarcinoma], 5; GBM[Glioblastoma multiforme], 6; Glioma Low Grade, 7; HNSC[Head and Neck squamous cell carcinoma], 8; KICH[Kidney Chromophobe], 9; KIRC[Kidney renal clear cell carcinoma], 10; KIRP[Kidney renal papillary cell carcinoma], 11; LAML[Acute Myeloid Leukemia], 12; LUAD[Lung adenocarcinoma], 13; LUSC[Lung squamous cell carcinoma], 14; OV[Ovarian serous cystadenocarcinoma ], 15; PAAD[Pancreatic adenocarcinoma], 16; PRAD[Prostate adenocarcinoma], 17; SKCM[Skin Cutaneous Melanoma], 18:STAD[Stomach adenocarcinoma], 19:THCA[Thyroid carcinoma], 20:UCEC[Uterine Corpus Endometrial Carcinoma]) |
| Top |
| * We represented just top 10 SNVs. When you move the cursor on each content, you can see more deailed mutation information on the Tooltip. Those are primary_site, primary_histology, mutation(aa), pubmedID. |
| Genomic Position | Mutation(aa) | Unique sampleID count |
| chr6:17637957 | p.P706P,NUP153 | 3 |
| chr6:17637604 | p.A589T,NUP153 | 3 |
| chr6:17629253 | p.G893G,NUP153 | 2 |
| chr6:17675207 | p.S853S,NUP153 | 2 |
| chr6:17629625 | p.S1017S,NUP153 | 2 |
| chr6:17629745 | p.P261T,NUP153 | 2 |
| chr6:17629488 | p.F939C,NUP153 | 2 |
| chr6:17637996 | p.A576T,NUP153 | 2 |
| chr6:17637765 | p.S73N,NUP153 | 1 |
| chr6:17675190 | p.S1121Y,NUP153 | 1 |
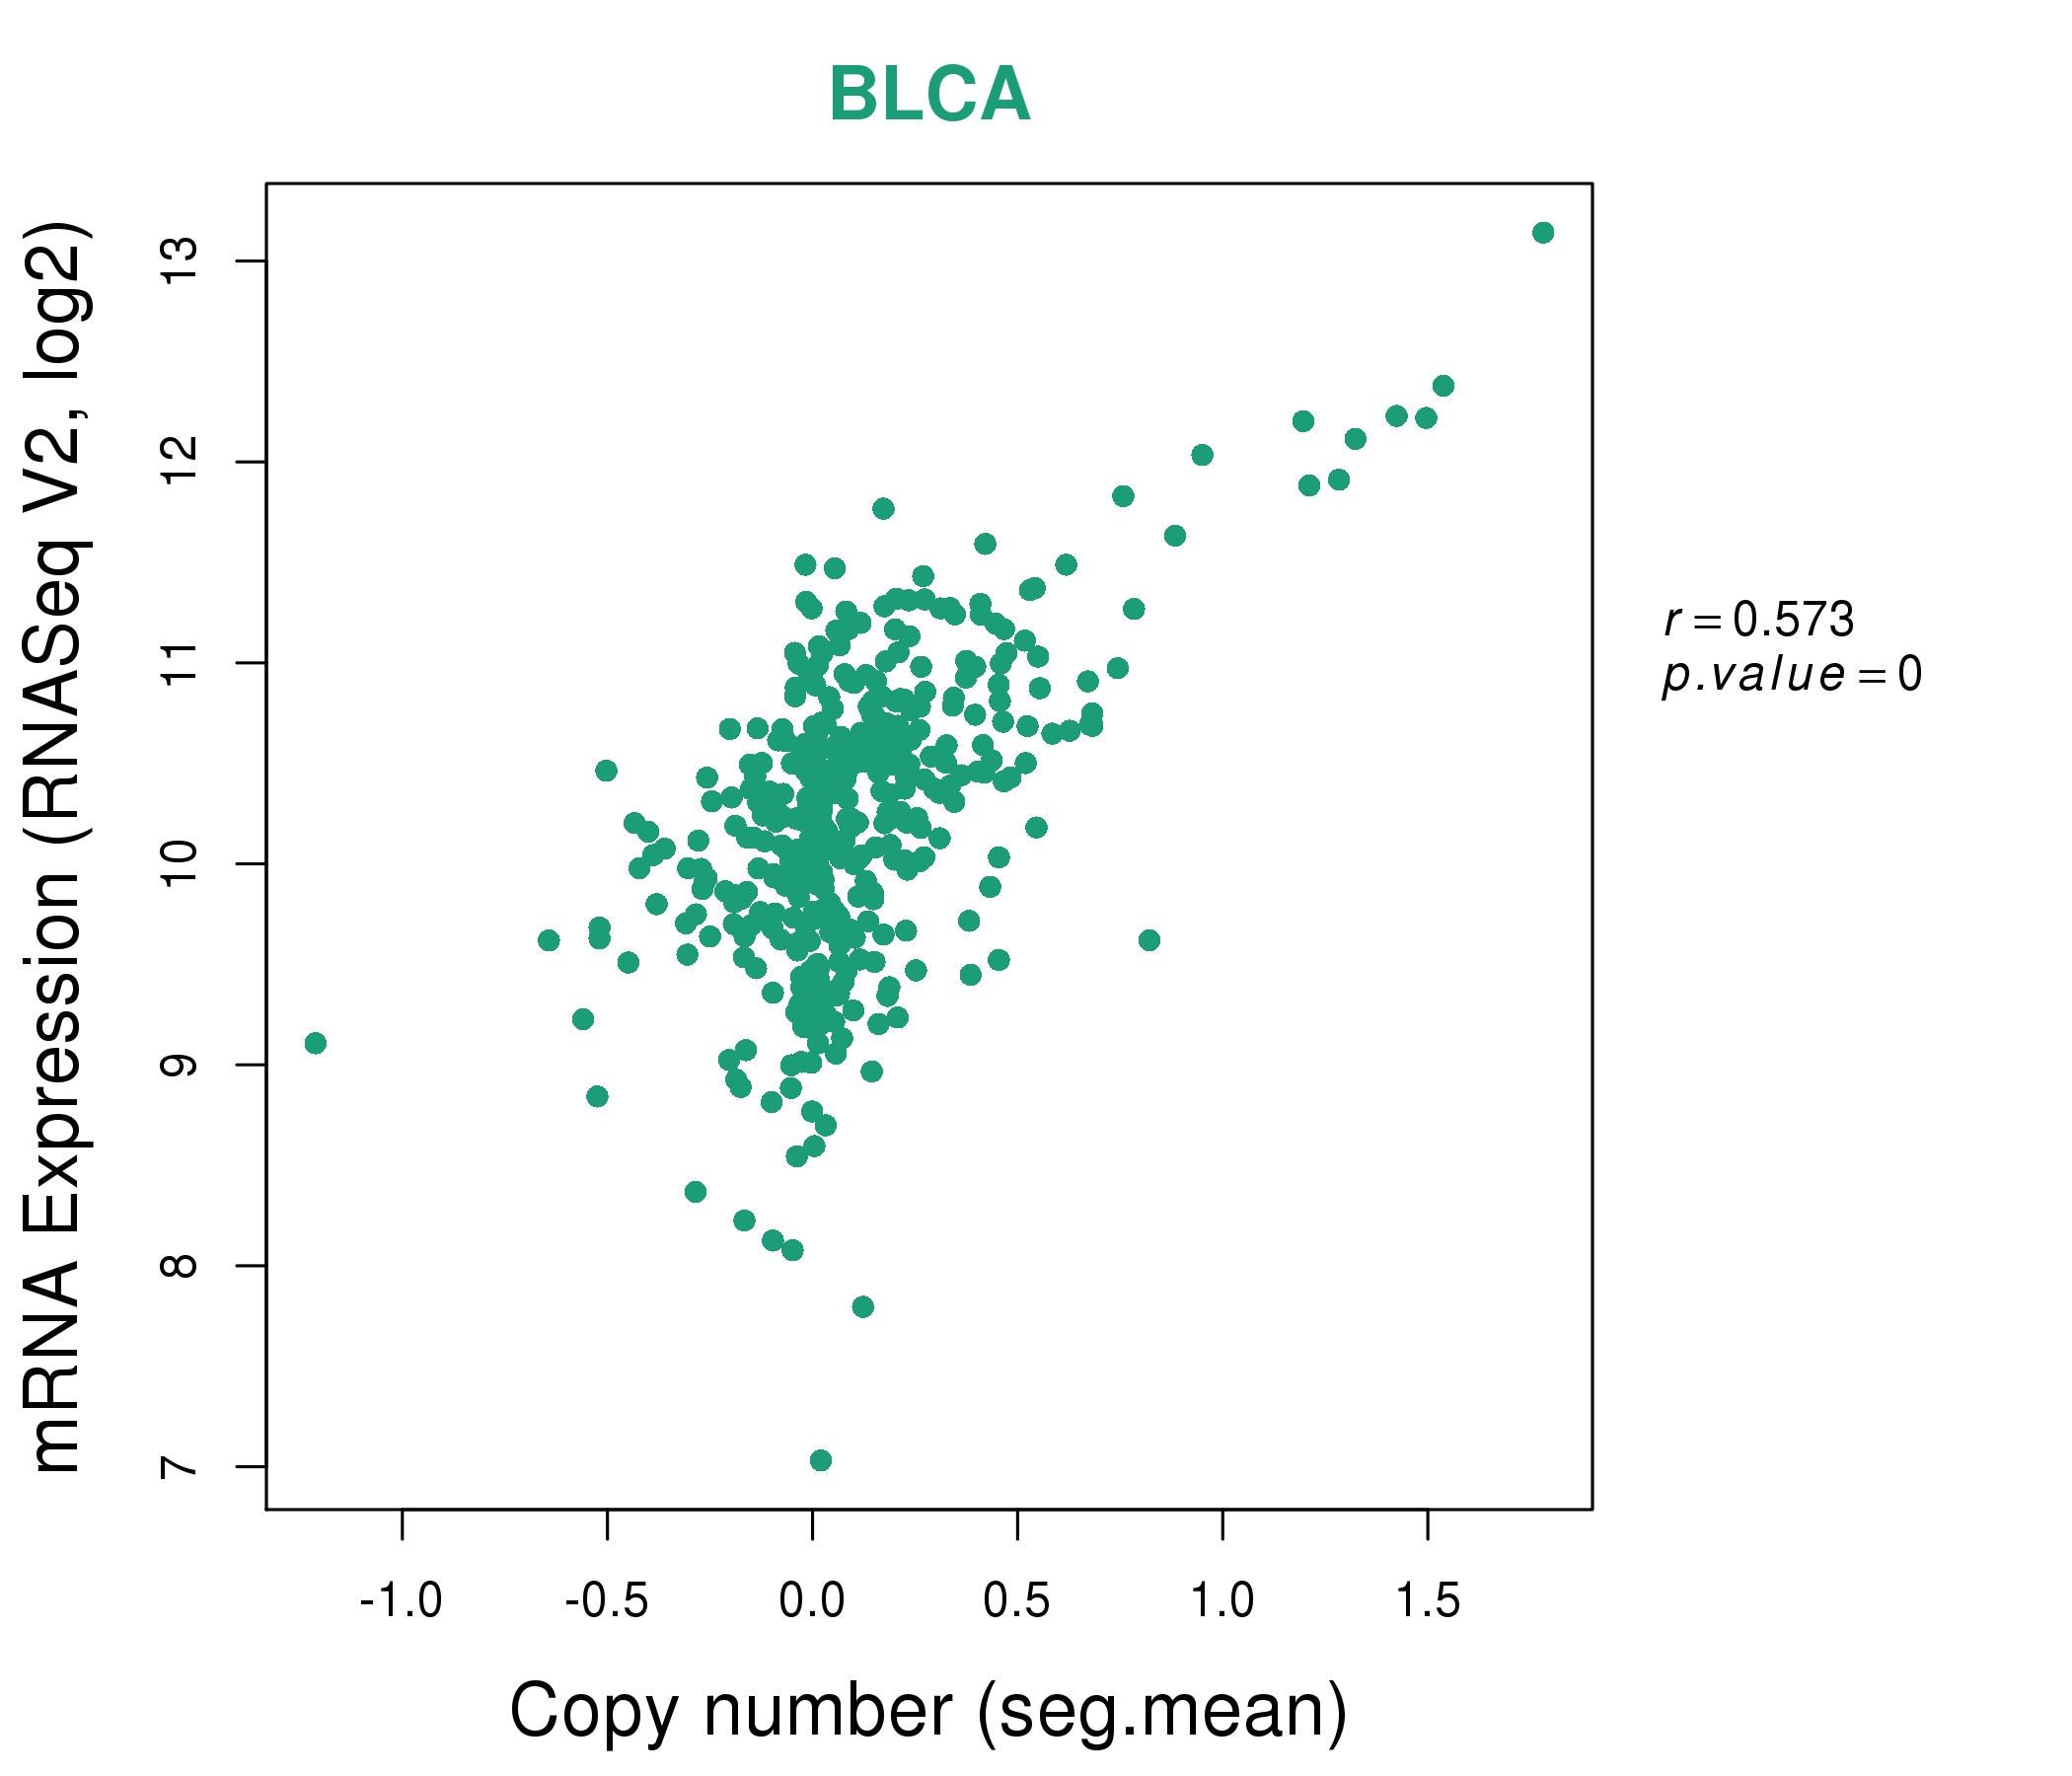
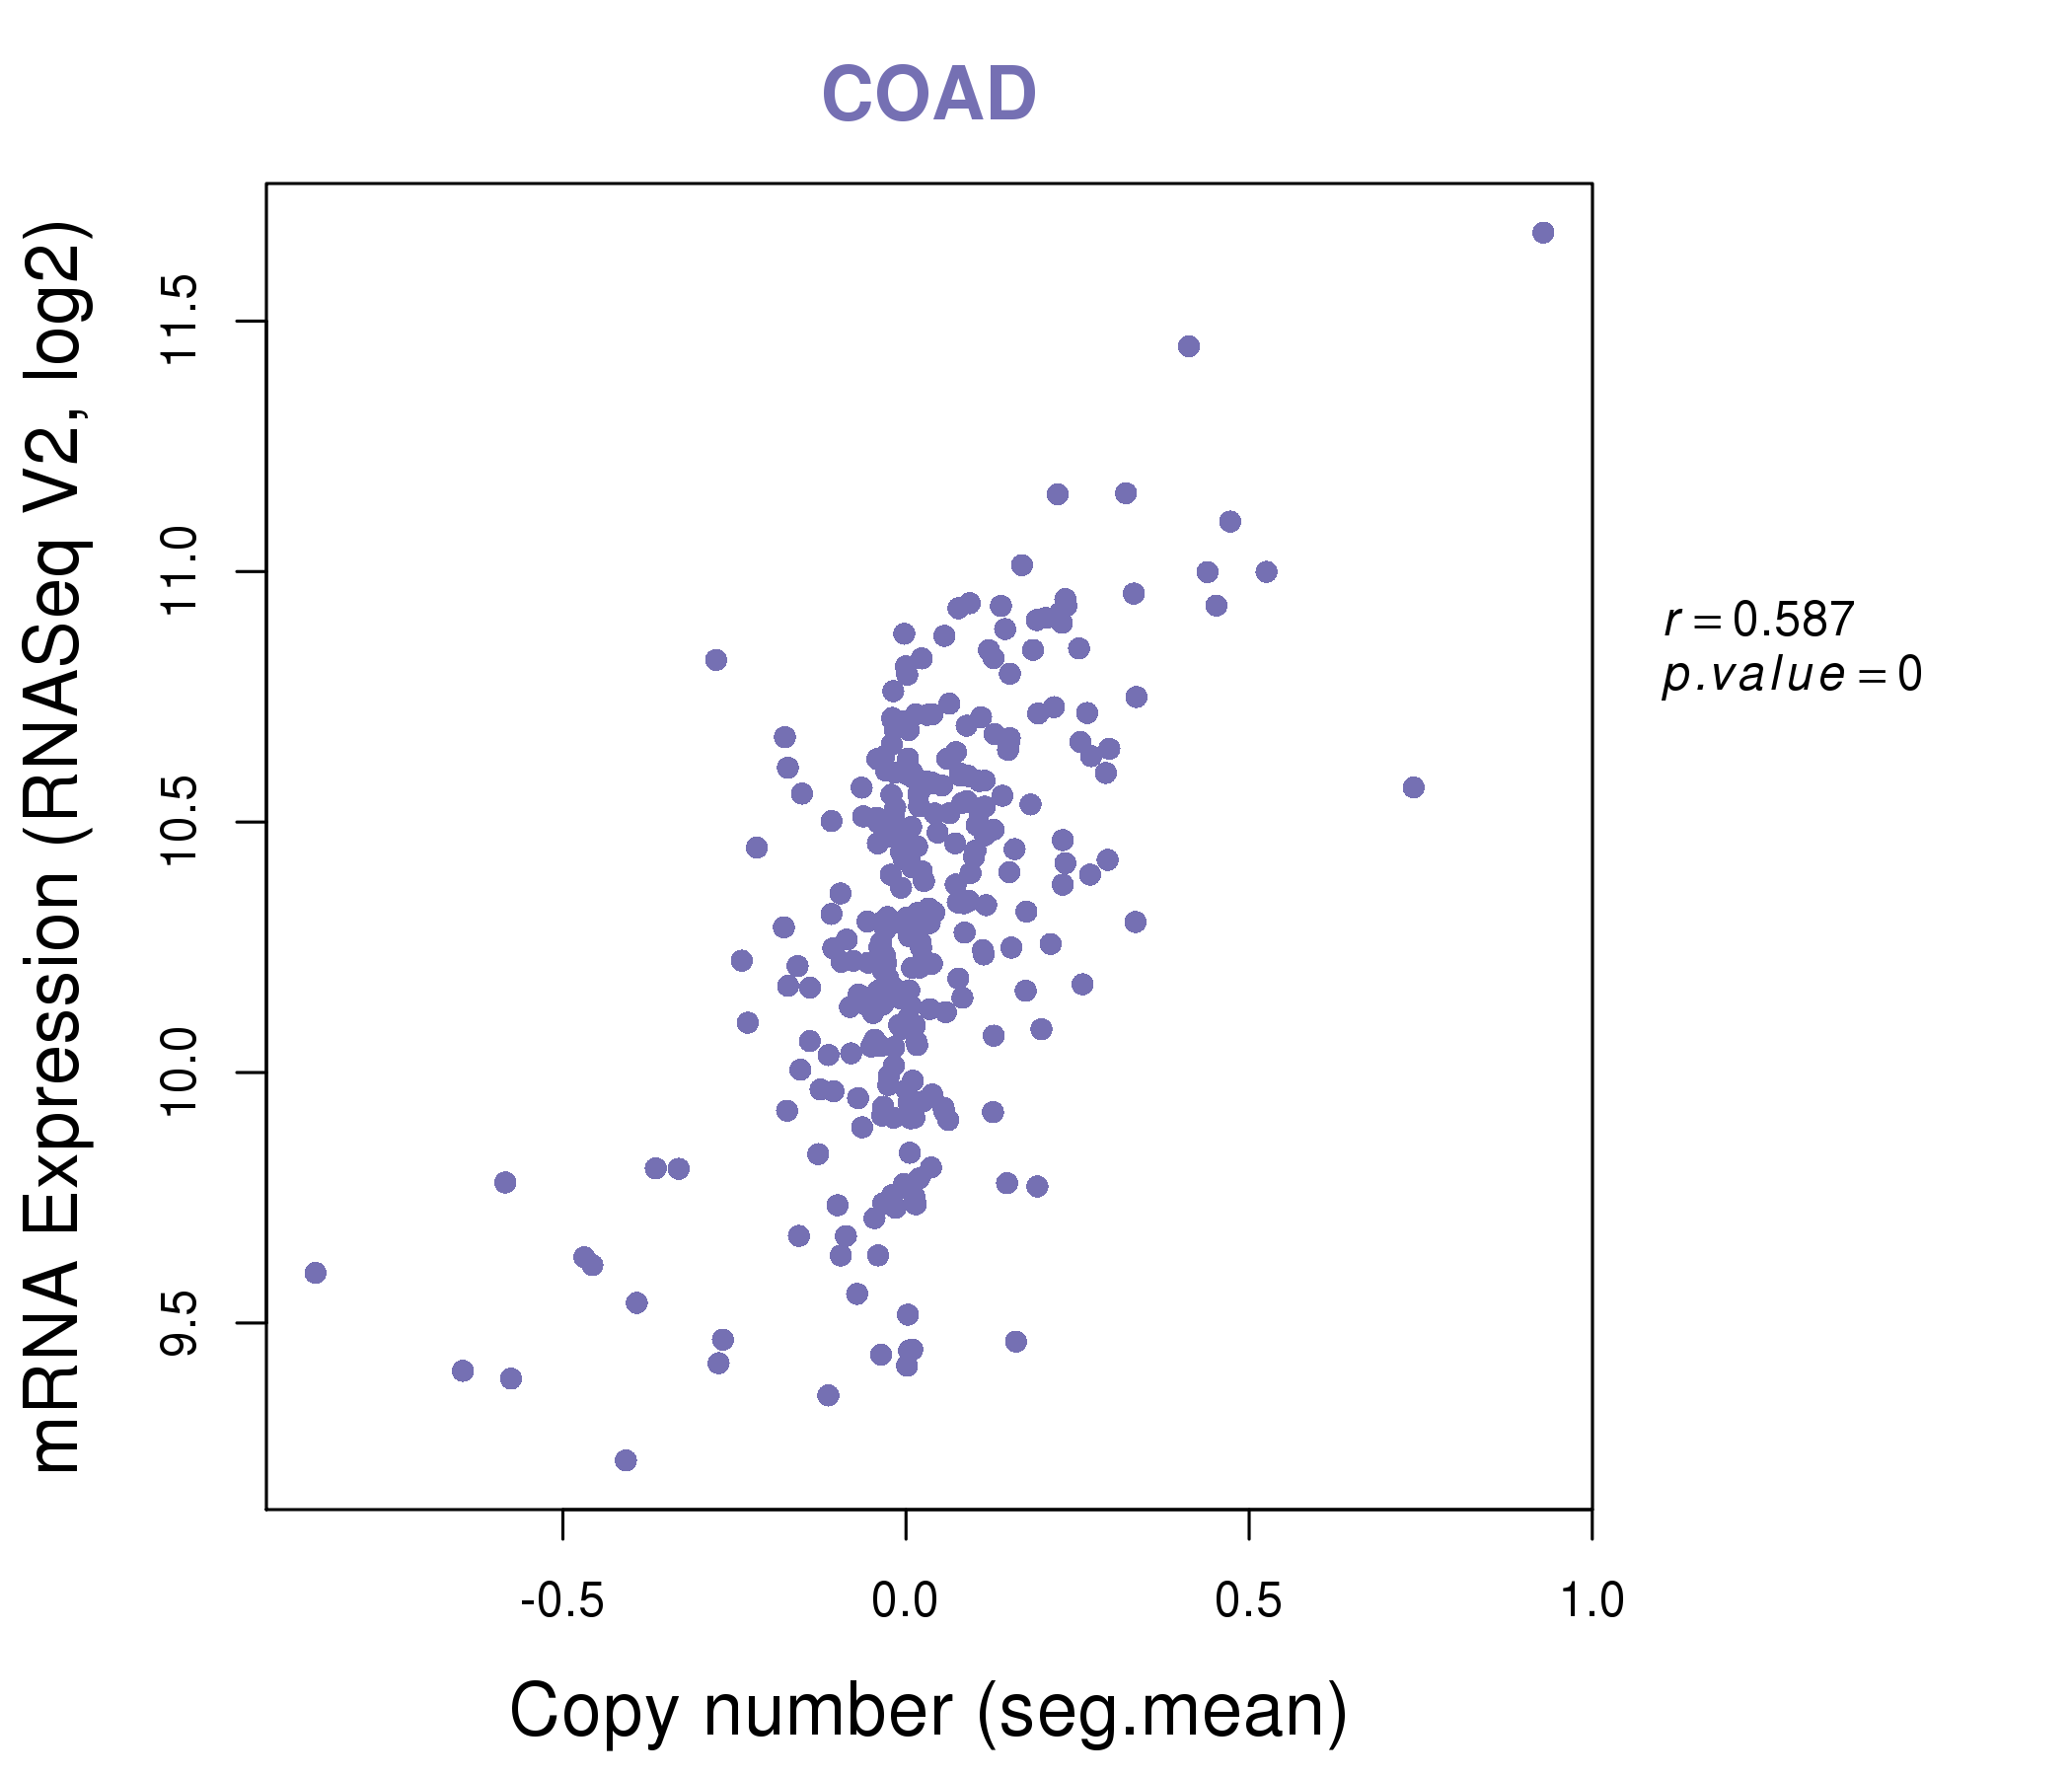
| * Copy number data were extracted from TCGA using R package TCGA-Assembler. The URLs of all public data files on TCGA DCC data server were gathered on Jan-05-2015. Function ProcessCNAData in TCGA-Assembler package was used to obtain gene-level copy number value which is calculated as the average copy number of the genomic region of a gene. |
 |
| cf) Tissue ID[Tissue type]: BLCA[Bladder Urothelial Carcinoma], BRCA[Breast invasive carcinoma], CESC[Cervical squamous cell carcinoma and endocervical adenocarcinoma], COAD[Colon adenocarcinoma], GBM[Glioblastoma multiforme], Glioma Low Grade, HNSC[Head and Neck squamous cell carcinoma], KICH[Kidney Chromophobe], KIRC[Kidney renal clear cell carcinoma], KIRP[Kidney renal papillary cell carcinoma], LAML[Acute Myeloid Leukemia], LUAD[Lung adenocarcinoma], LUSC[Lung squamous cell carcinoma], OV[Ovarian serous cystadenocarcinoma ], PAAD[Pancreatic adenocarcinoma], PRAD[Prostate adenocarcinoma], SKCM[Skin Cutaneous Melanoma], STAD[Stomach adenocarcinoma], THCA[Thyroid carcinoma], UCEC[Uterine Corpus Endometrial Carcinoma] |
| Top |
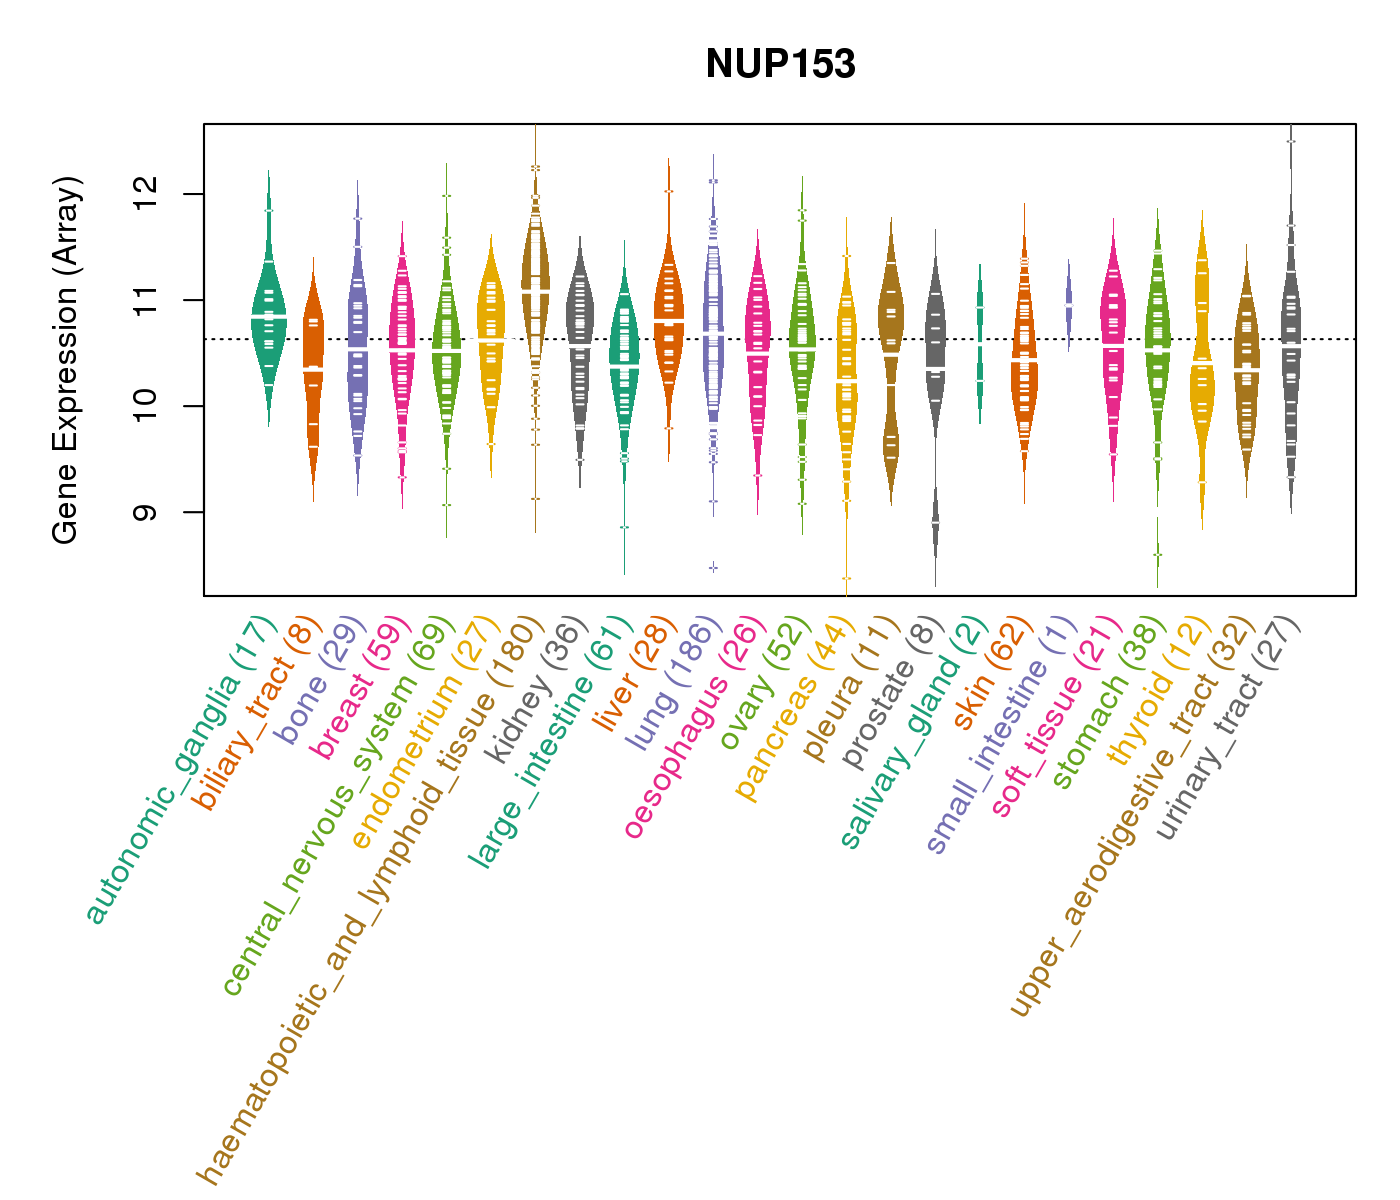
| Gene Expression for NUP153 |
| * CCLE gene expression data were extracted from CCLE_Expression_Entrez_2012-10-18.res: Gene-centric RMA-normalized mRNA expression data. |
 |
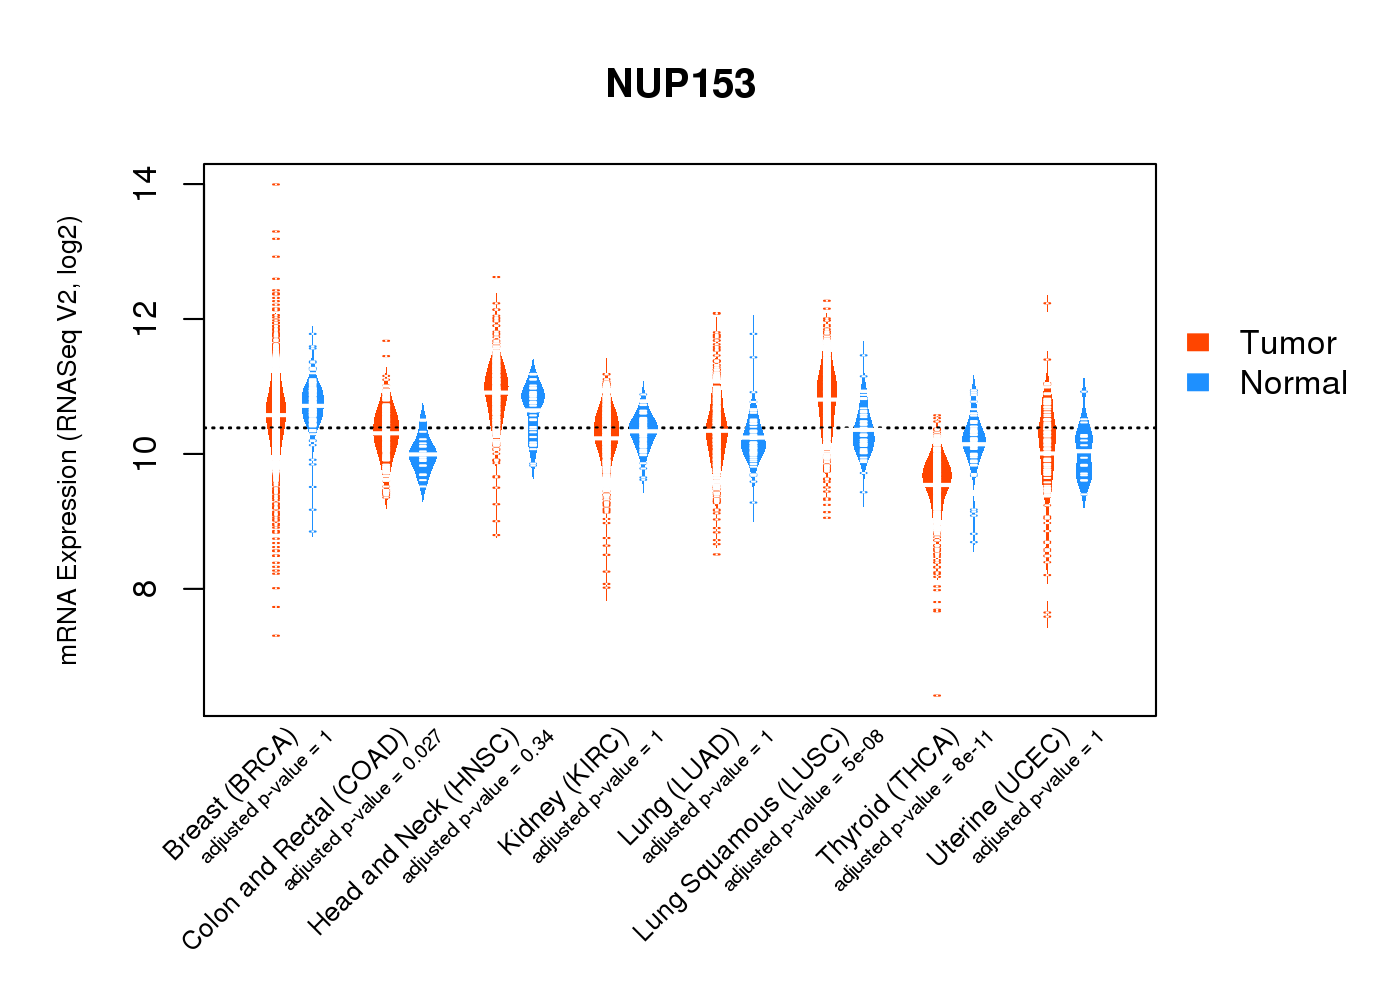
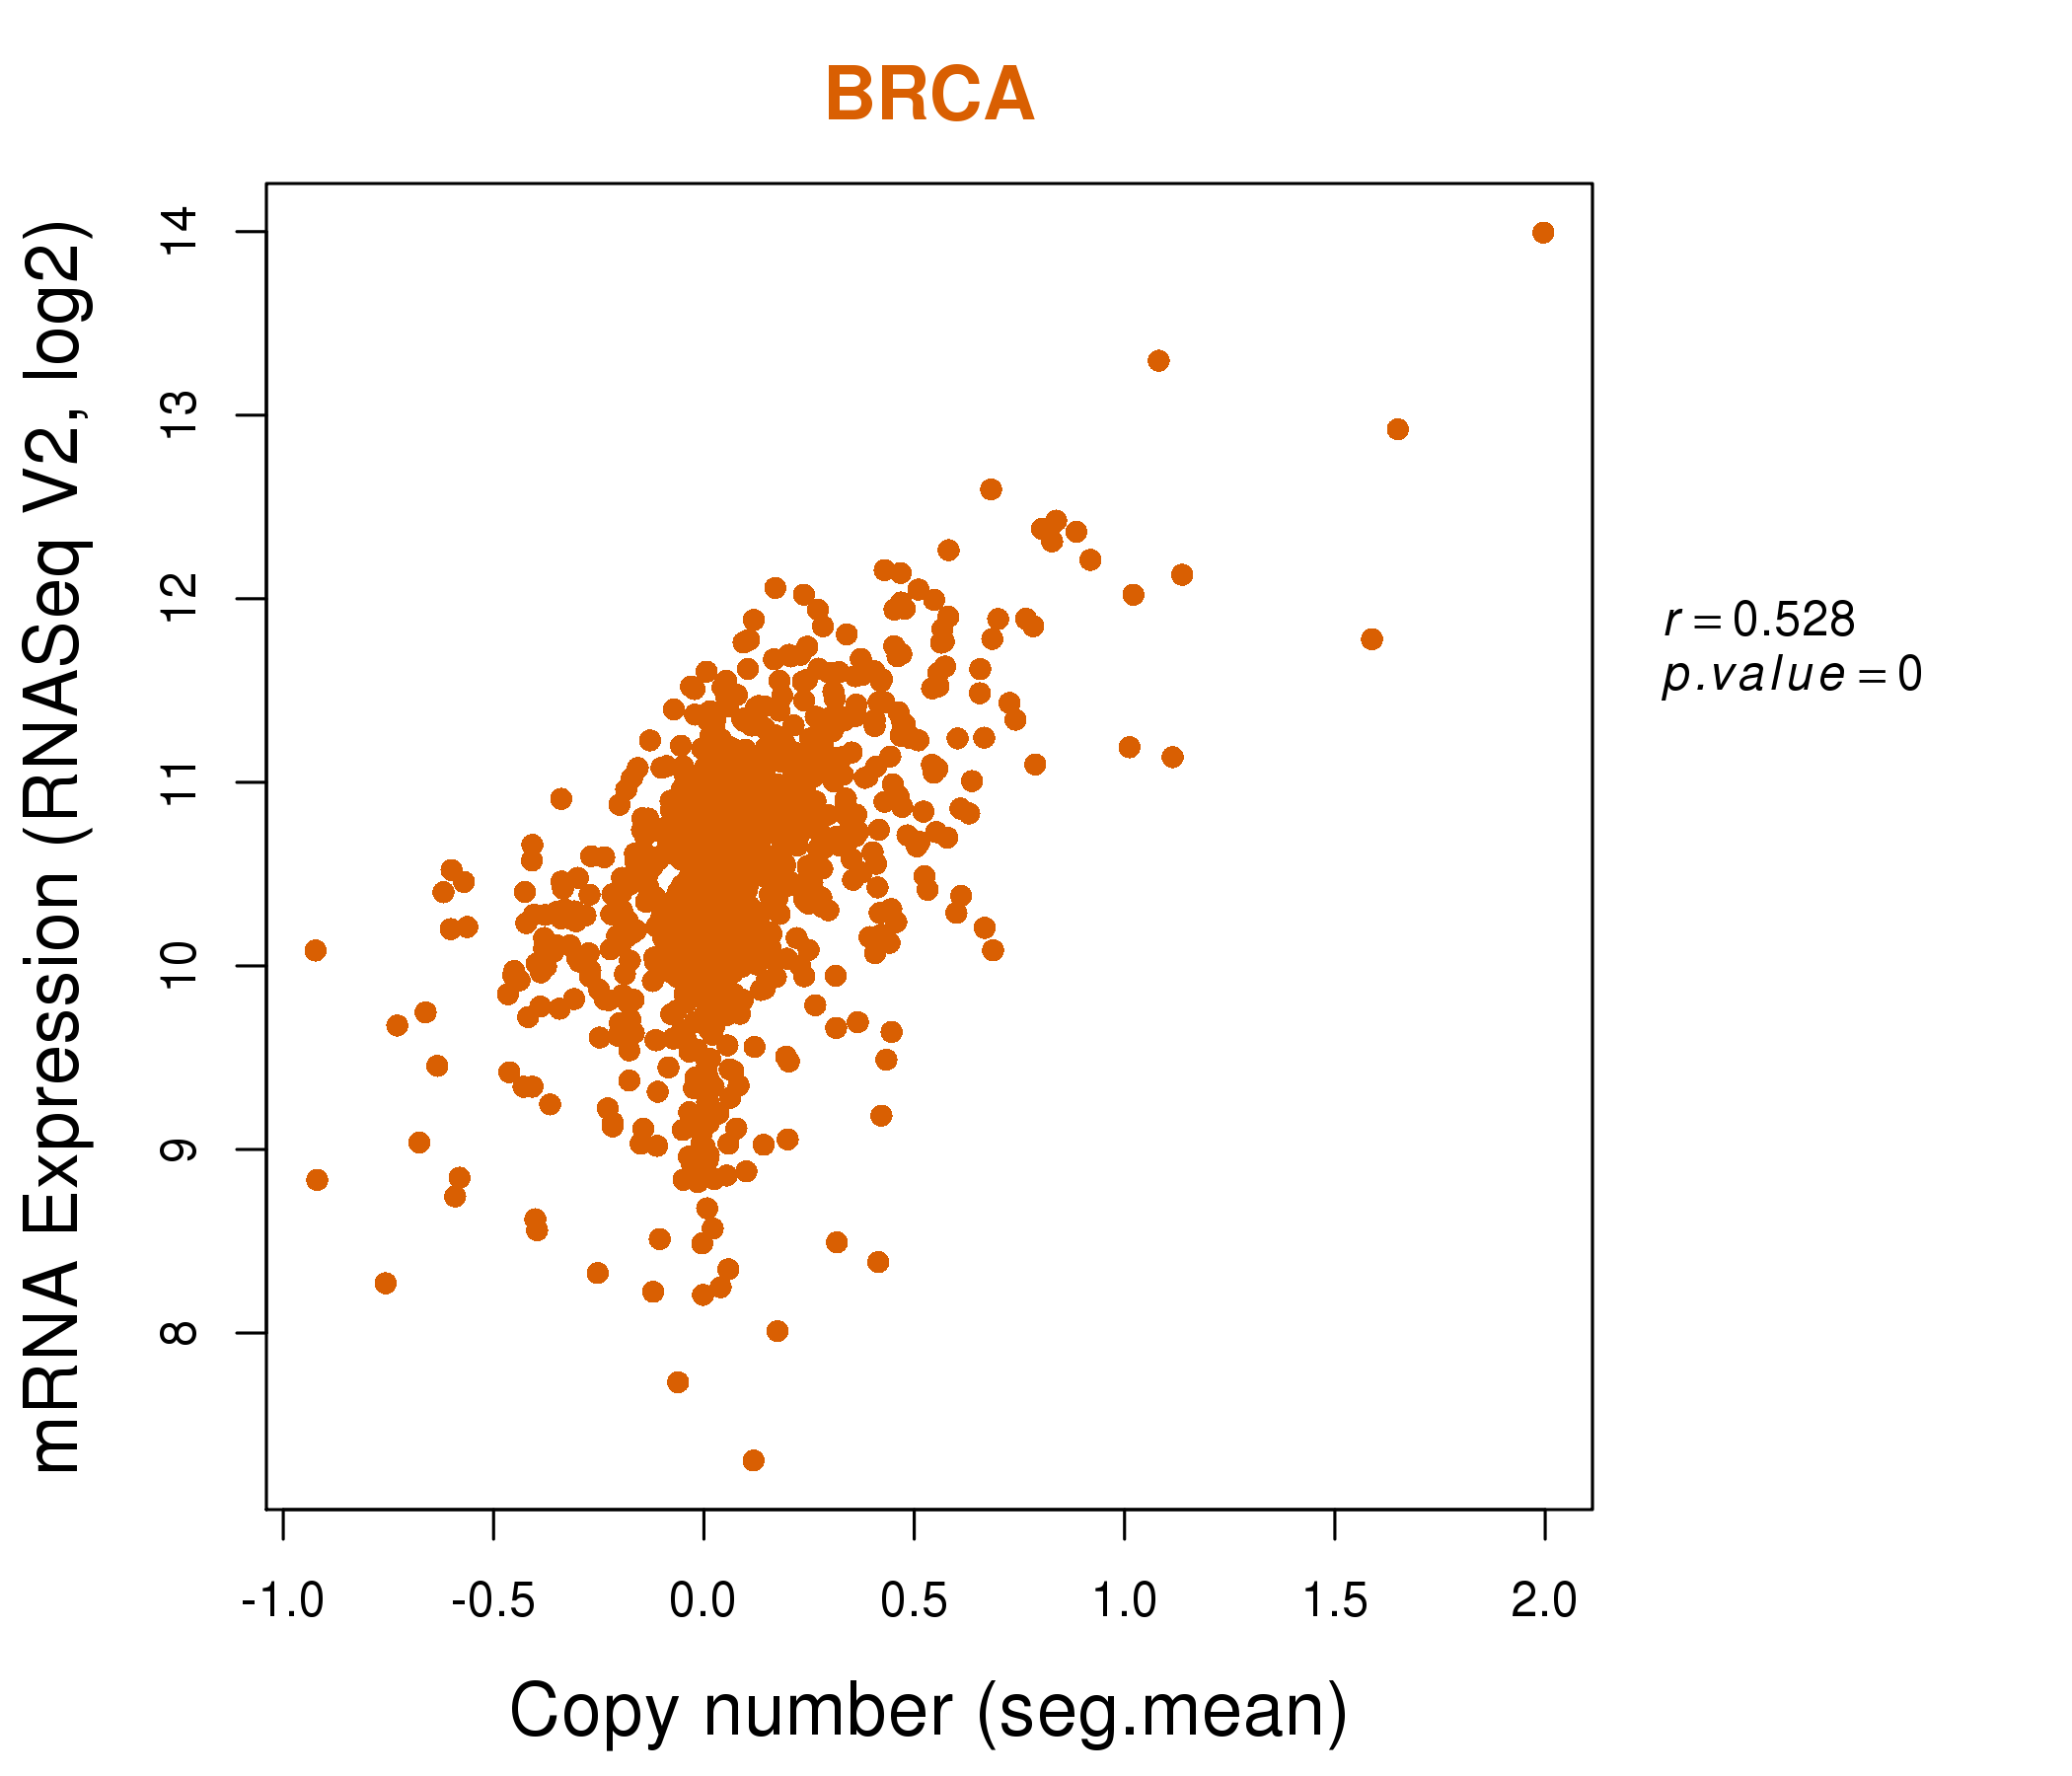
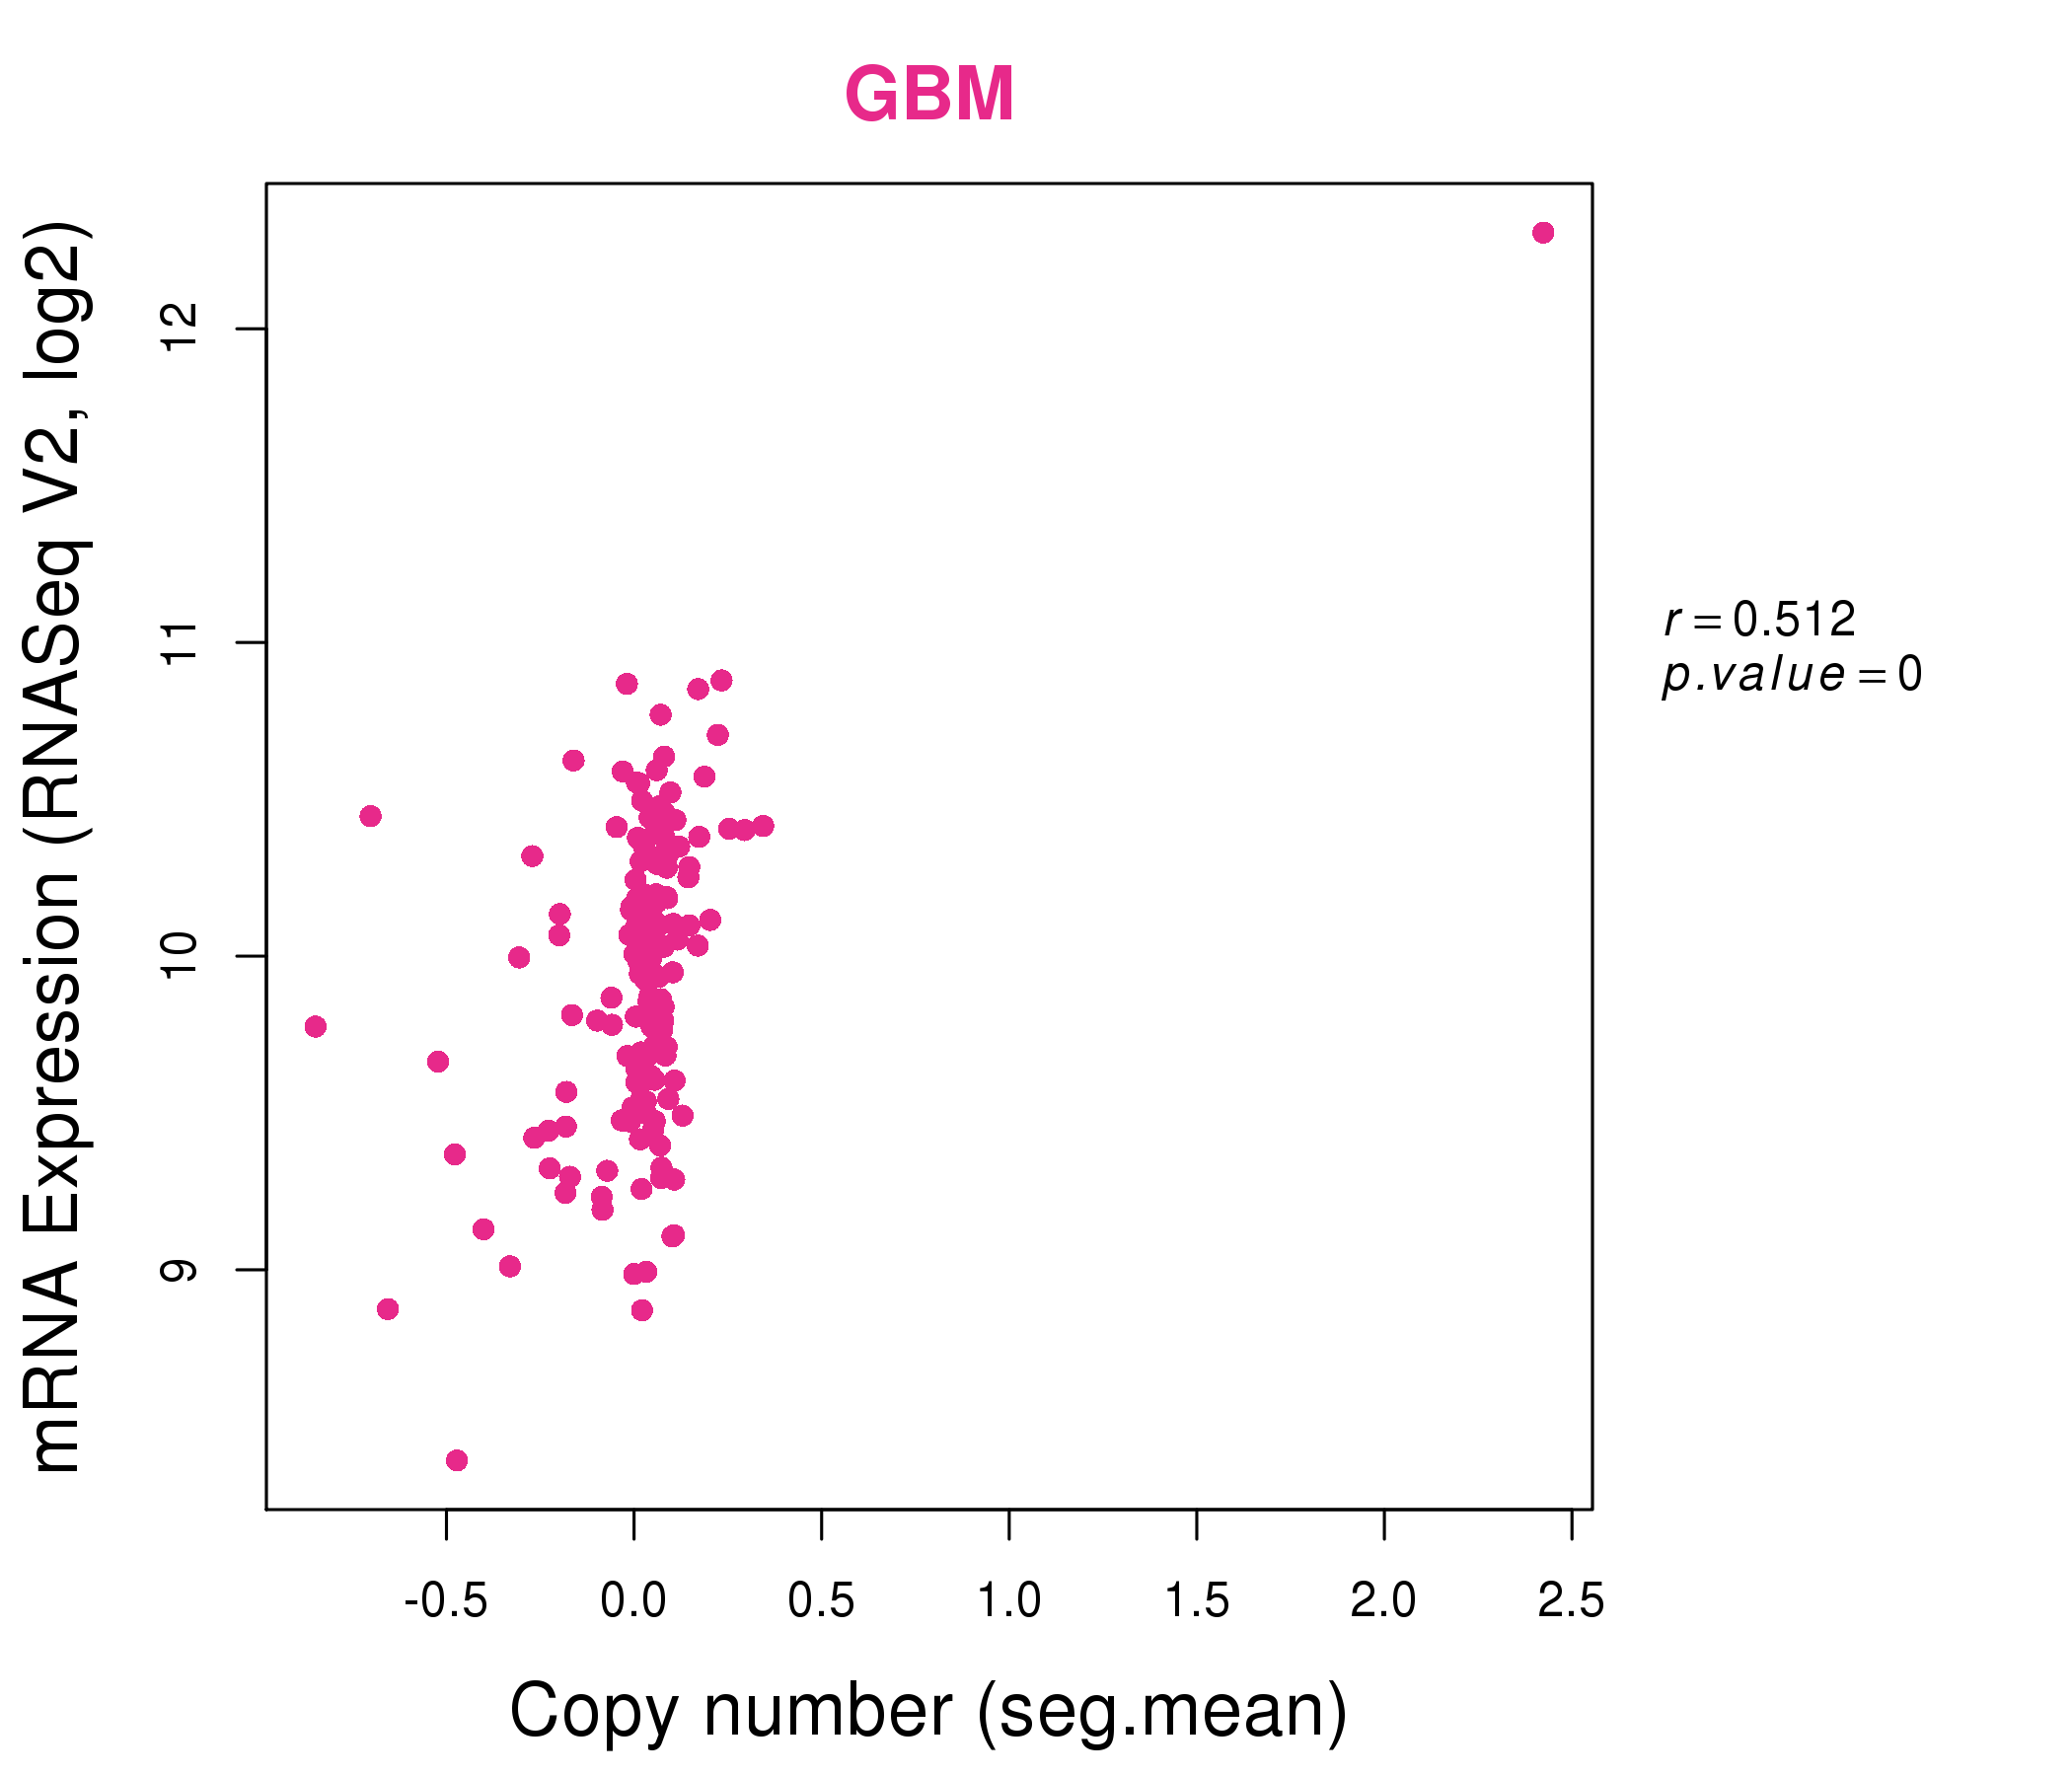
| * Normalized gene expression data of RNASeqV2 was extracted from TCGA using R package TCGA-Assembler. The URLs of all public data files on TCGA DCC data server were gathered at Jan-05-2015. Only eight cancer types have enough normal control samples for differential expression analysis. (t test, adjusted p<0.05 (using Benjamini-Hochberg FDR)) |
 |
| Top |
| * This plots show the correlation between CNV and gene expression. |
: Open all plots for all cancer types
 |
|
 |
|
| Top |
| Gene-Gene Network Information |
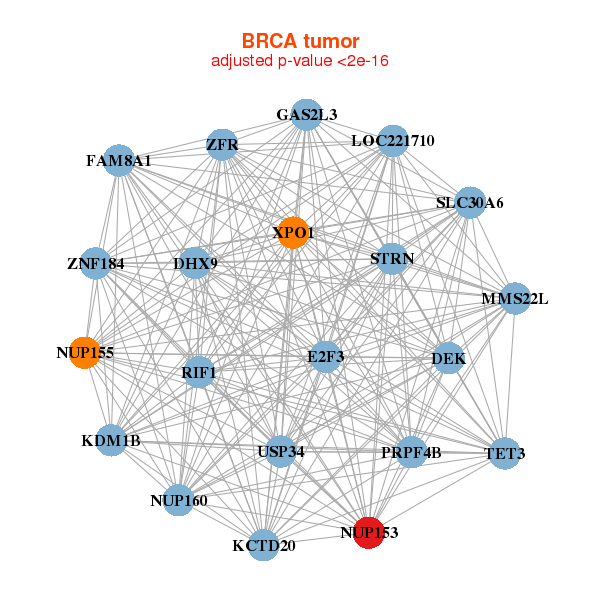
| * Co-Expression network figures were drawn using R package igraph. Only the top 20 genes with the highest correlations were shown. Red circle: input gene, orange circle: cell metabolism gene, sky circle: other gene |
: Open all plots for all cancer types
 |
|
| MMS22L,DEK,DHX9,E2F3,FAM8A1,GAS2L3,KCTD20, KDM1B,LOC221710,NUP153,NUP155,NUP160,PRPF4B,RIF1, SLC30A6,STRN,TET3,USP34,XPO1,ZFR,ZNF184 | AFF4,BCLAF1,TRAPPC11,JMJD1C,KIAA2026,LATS1,MAP3K7, NUP153,NUP98,RANBP2,SCAF8,RBM27,RIF1,RLF, LTN1,RNF169,SON,SRFBP1,WAPAL,ZBTB11,ZNF644 |
 |
|
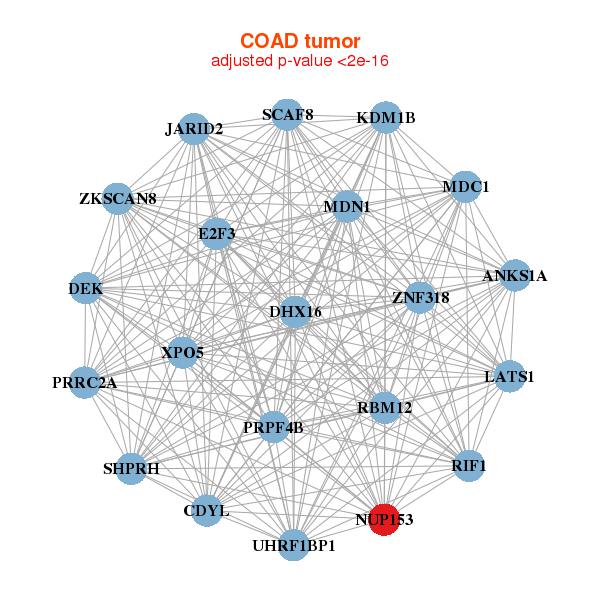
| ANKS1A,PRRC2A,CDYL,DEK,DHX16,E2F3,JARID2, KDM1B,LATS1,MDC1,MDN1,NUP153,PRPF4B,RBM12, SCAF8,RIF1,SHPRH,UHRF1BP1,XPO5,ZKSCAN8,ZNF318 | AQR,PRRC2C,BCLAF1,CDK12,CHD7,E2F3,OTULIN, IQGAP1,NFKB1,NUP153,RALGAPA1,SAFB,SART3,SF3B3, SFPQ,SCAF4,UBAP2,UGGT1,USP24,VPRBP,WAPAL |

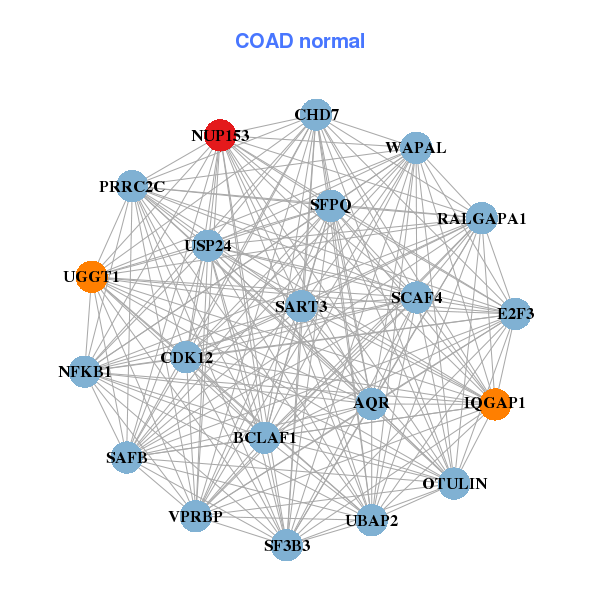
| * Co-Expression network figures were drawn using R package igraph. Only the top 20 genes with the highest correlations were shown. Red circle: input gene, orange circle: cell metabolism gene, sky circle: other gene |
: Open all plots for all cancer types
| Top |
: Open all interacting genes' information including KEGG pathway for all interacting genes from DAVID
| Top |
| Pharmacological Information for NUP153 |
| There's no related Drug. |
| Top |
| Cross referenced IDs for NUP153 |
| * We obtained these cross-references from Uniprot database. It covers 150 different DBs, 18 categories. http://www.uniprot.org/help/cross_references_section |
: Open all cross reference information
|
Copyright © 2016-Present - The Univsersity of Texas Health Science Center at Houston @ |