1. Methods
1.1 Database construction pipeline
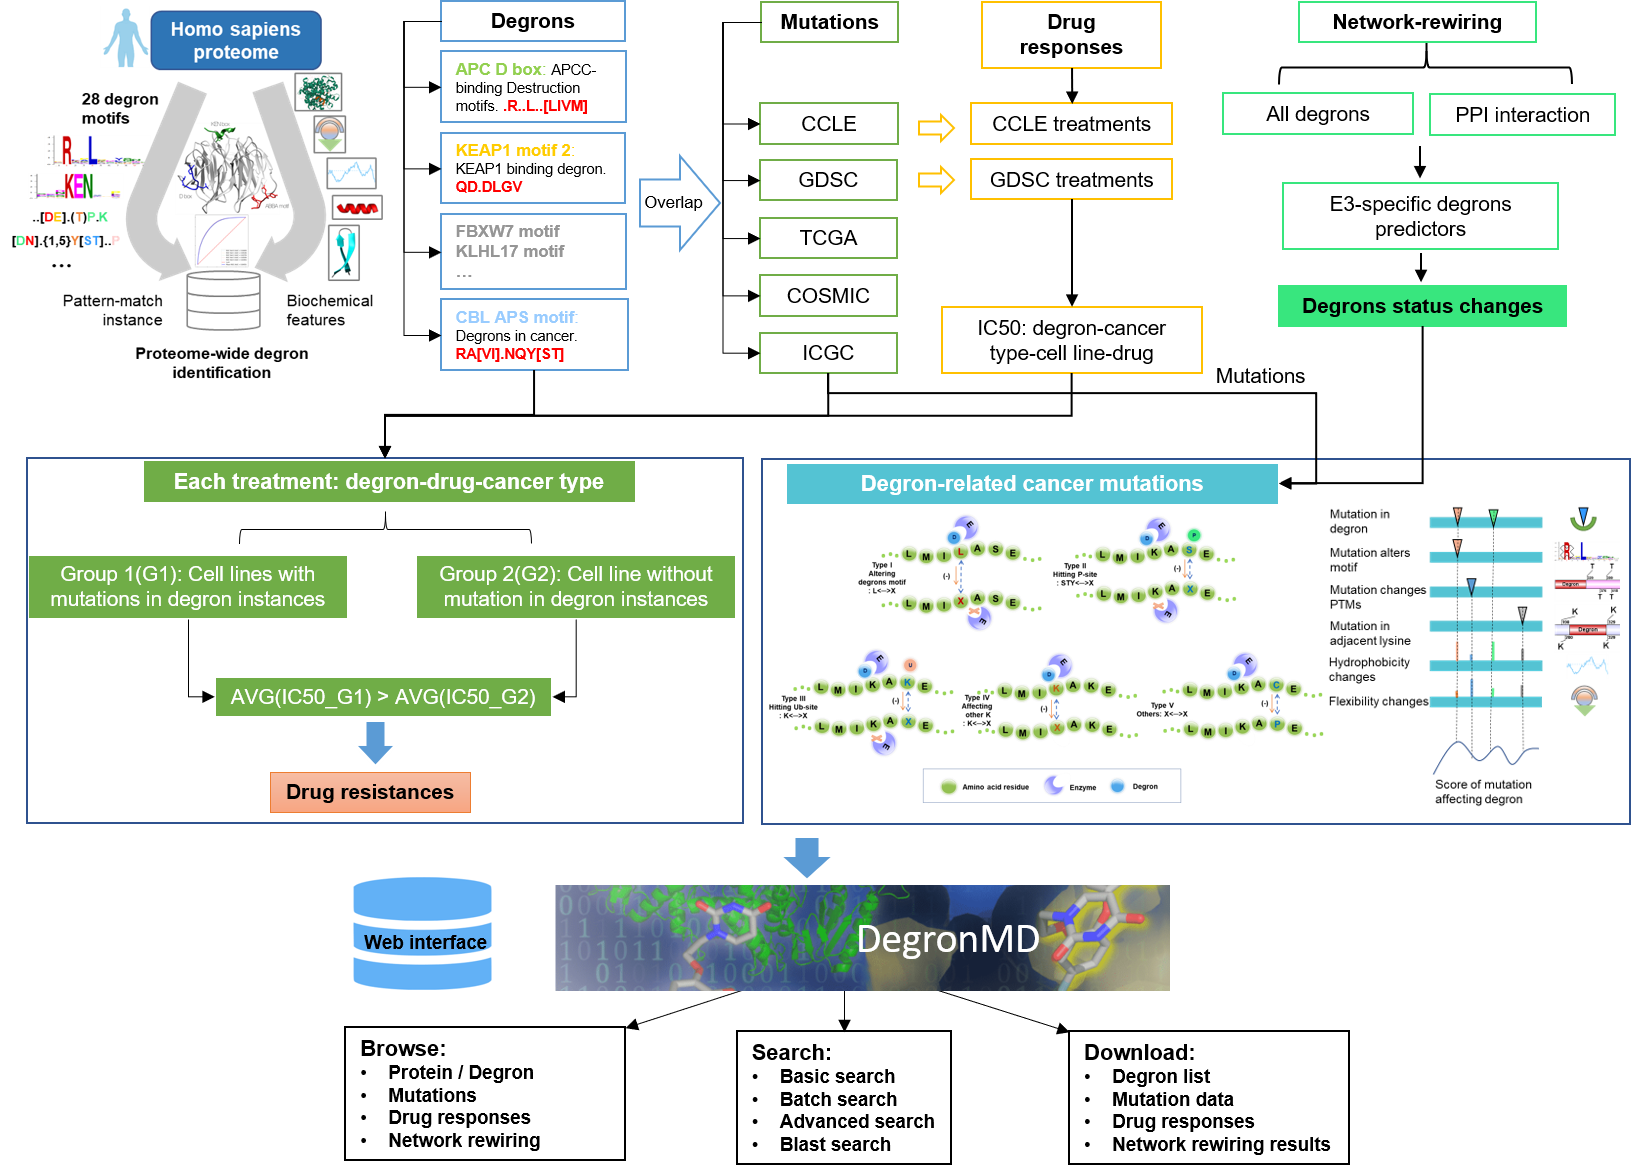
1.2 Collection and data processing
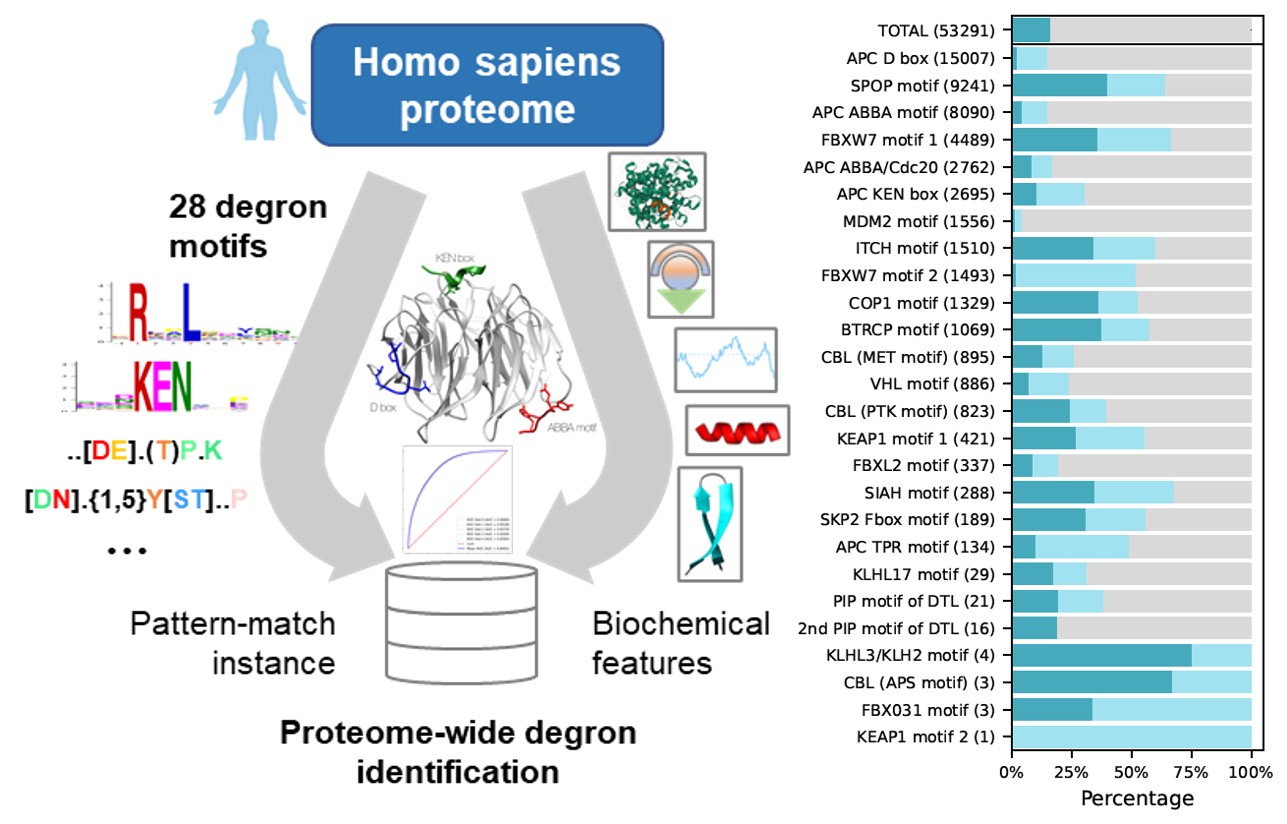
Degron motifs i.e., consensus motifs of particular E3 ubiquitin ligase or adaptor protein, in the human were downloaded from ELM. Motifs not directly involved in ubiquitination were filtered out. In this study, we focused on internal motifs, therefore motifs recognizing N or C-terminals were not considered. The final table included 26 ubiquitination motifs. For example, the consensus motifs of APC D box can be represented as R..L..[LIVM].
Scanning the human proteome (20,377 reviewed human proteins downloaded from UniProt) with the 26 known degron motifs produced 53,291 matches, many of which are likely false positives. Then, multiple characteristic features, i.e., disorder, solvent accessibility and secondary structure (COIL, HELIX and SHEET), rigidity, stabilization upon binding, flanking conservation, structured domains, degron-associated phosphorylation sites, degron-associated ubiquitinated lysines, were calculated for each match. All motif matches with characteristic features were evaluated by a XGBoost classifier trained on known degron instances downloaded from ELM and ranked according to the degron probability. In all, 18,929 new degron instances in different protein possessed degron probability greater than 0.5.
1.3 Investigation of cancer mutation on functional Degron
Somatic mutation data were downloaded from five cancer-related datasets: CCLE, GDSC, TCGA, GDSC and COSMIC. We only kept the nonsynonymous mutations, because synonymous mutations do not change the protein sequences. All the amino acid mutations were mapped to protein sequences. The mutations were kept when the reference residue at the mutation point matched the one at the full-length amino acid sequence. Then, the somatic mutations were mapped to degron regions for pan-cancer analysis. If a mutation position occurred in multiple samples, we saved all the identifiers of those samples defined by each dataset in the results. After filtering out synonymous mutations and removing the unmatched records, we had ∼7.2 million somatic mutation records from the five cancer-related datasets. These mutations were then mapped to the regions of all new degron instances. Finally, 288,345 somatic mutation records on 122,503 unique amino acid positions were obtained.
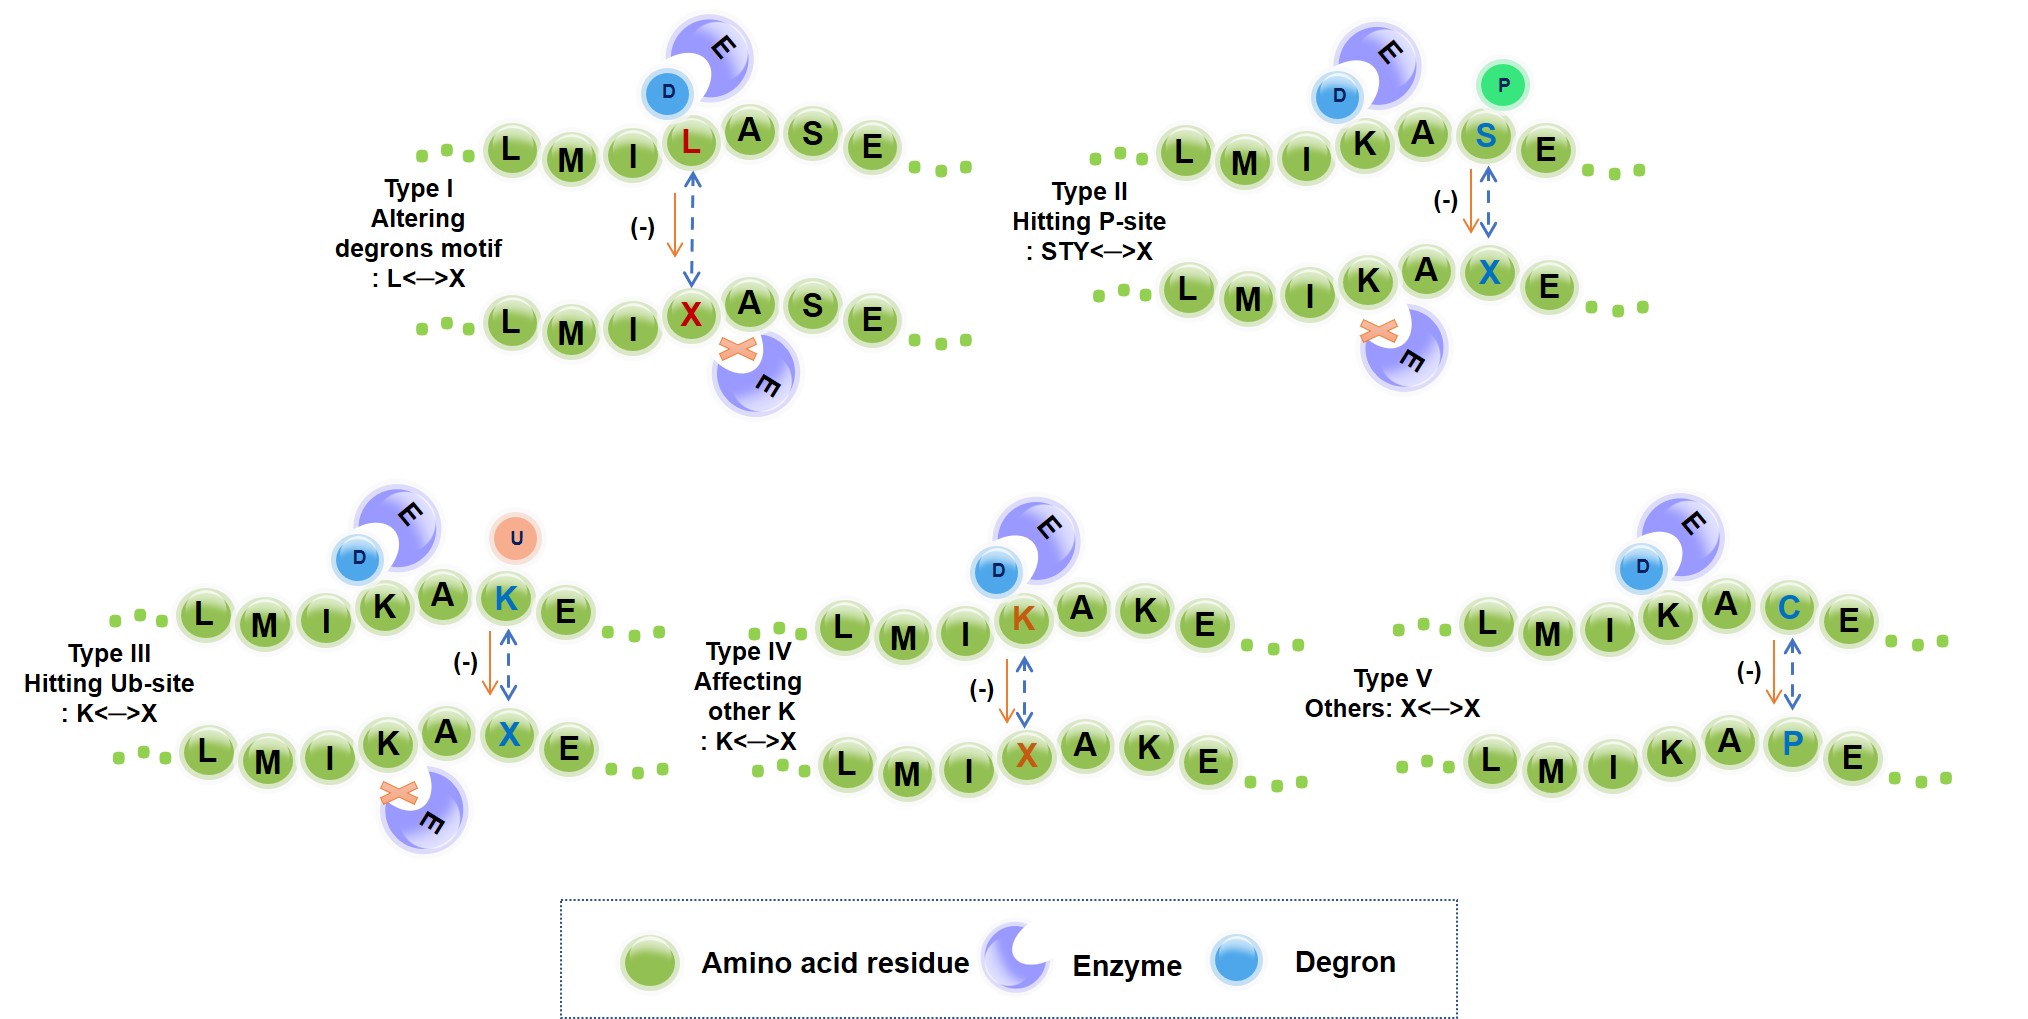
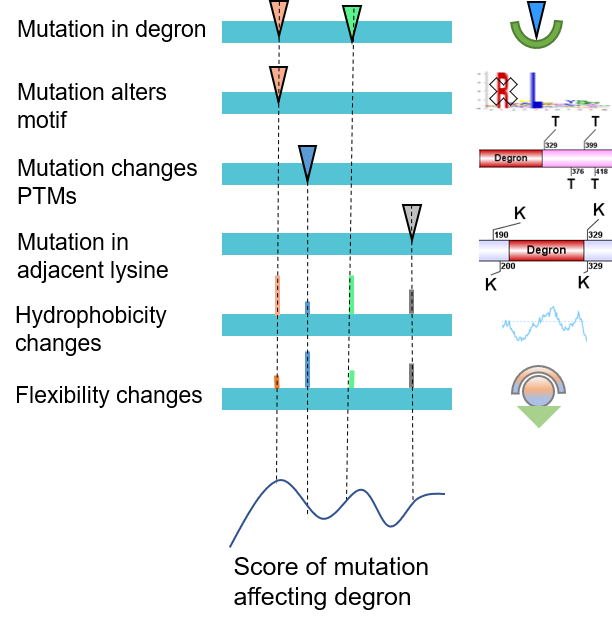
We systematically investigated and quantified the impact of missense mutations on the functionality of a degron. As a result, 89,318 actionable mutations were identified that directly destroys UPS signaling. The remaining mutations would indirectly perturb E3- degron network. The functional outcomes were annotated into five types: altering degron motif, blocking phosphorylation signal, blocking ubiquitination signal, and substituting flanking lysine, rewiring degron network.
1.4 Degrome-wide drug response and resistance
We downloaded the drug response data from two representative databases: CCLE and GDSC, along with the cell line annotation files. We only kept the treatment records that are targeted to the degron proteins. A total of 10,831 drug treatment records were in our current version of the database.• In the GDSC dataset, for each treatment (same drug, same degron proteins, same cancer type), cell lines were divided into two groups: (1) cell lines with mutations in the degrons, (2) cell lines without mutations in the degrons. The average IC50 values were calculated for each group to assess the drug resistance.393 treatments were concluded to potential drug resistance.
2. Query
Our database was developed in a user-friendly manner. DegronMD provided four implemented search options, including General search, Batch search, and BLAST search. Users can conveniently query the database with one or multiple keywords.
2.1 General search
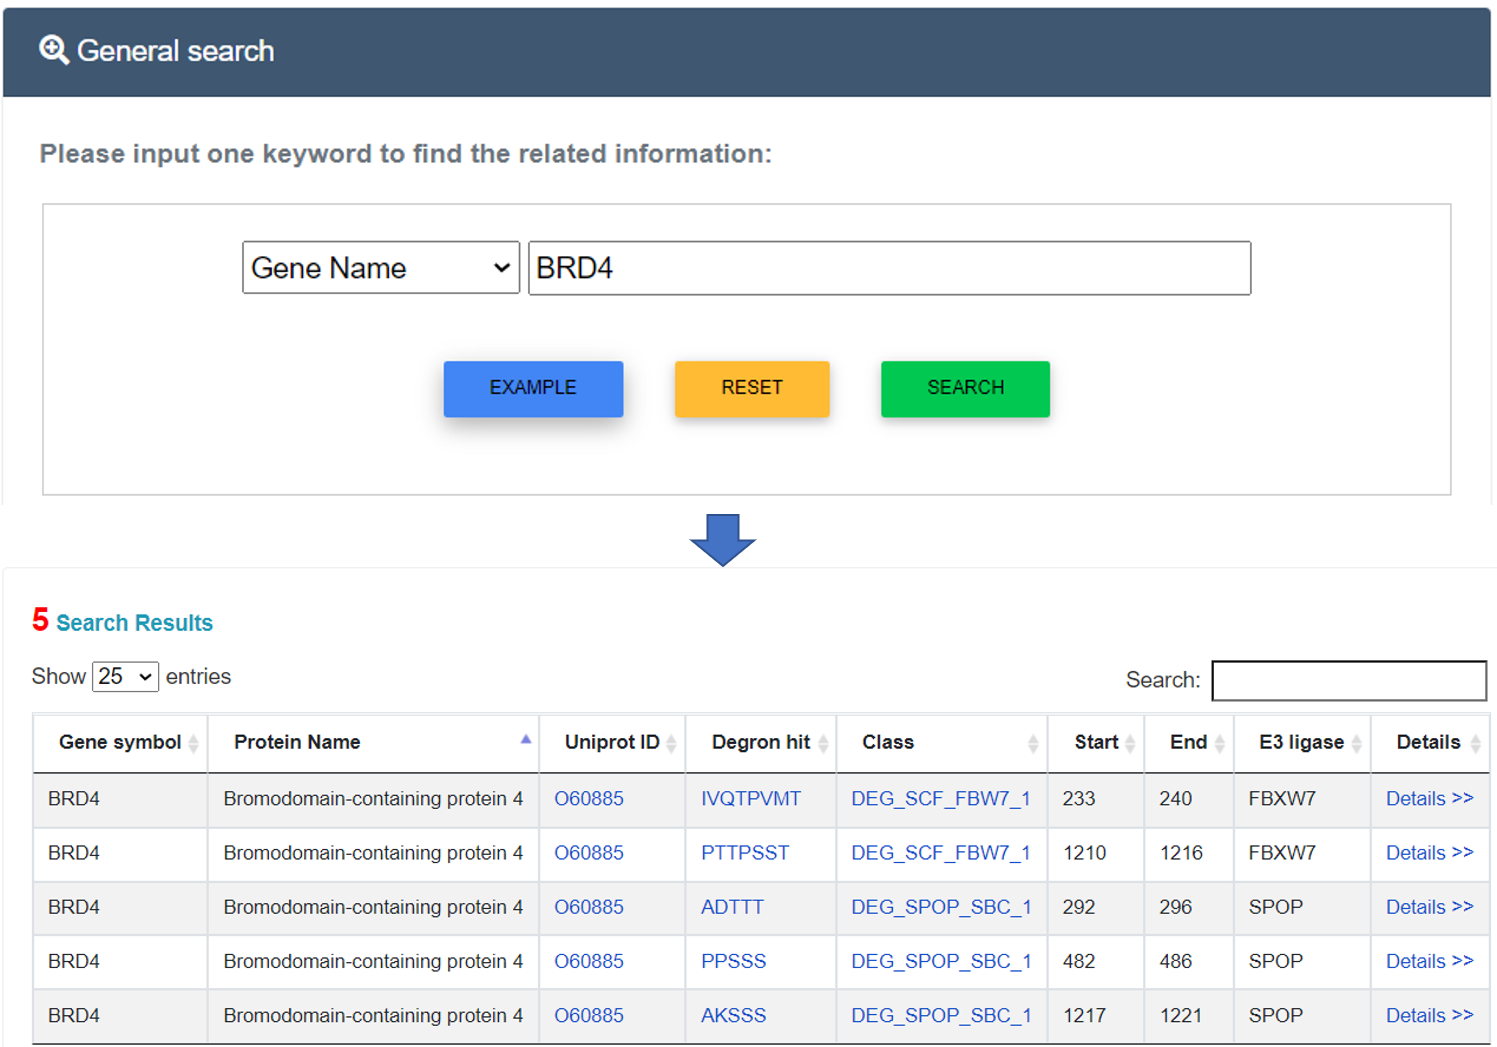
For the general search, users can directly search the DegronMD database by inputting one keyword and related tag. Detailed annotations can be retrieved through the "More" link.
2.2 Batch search
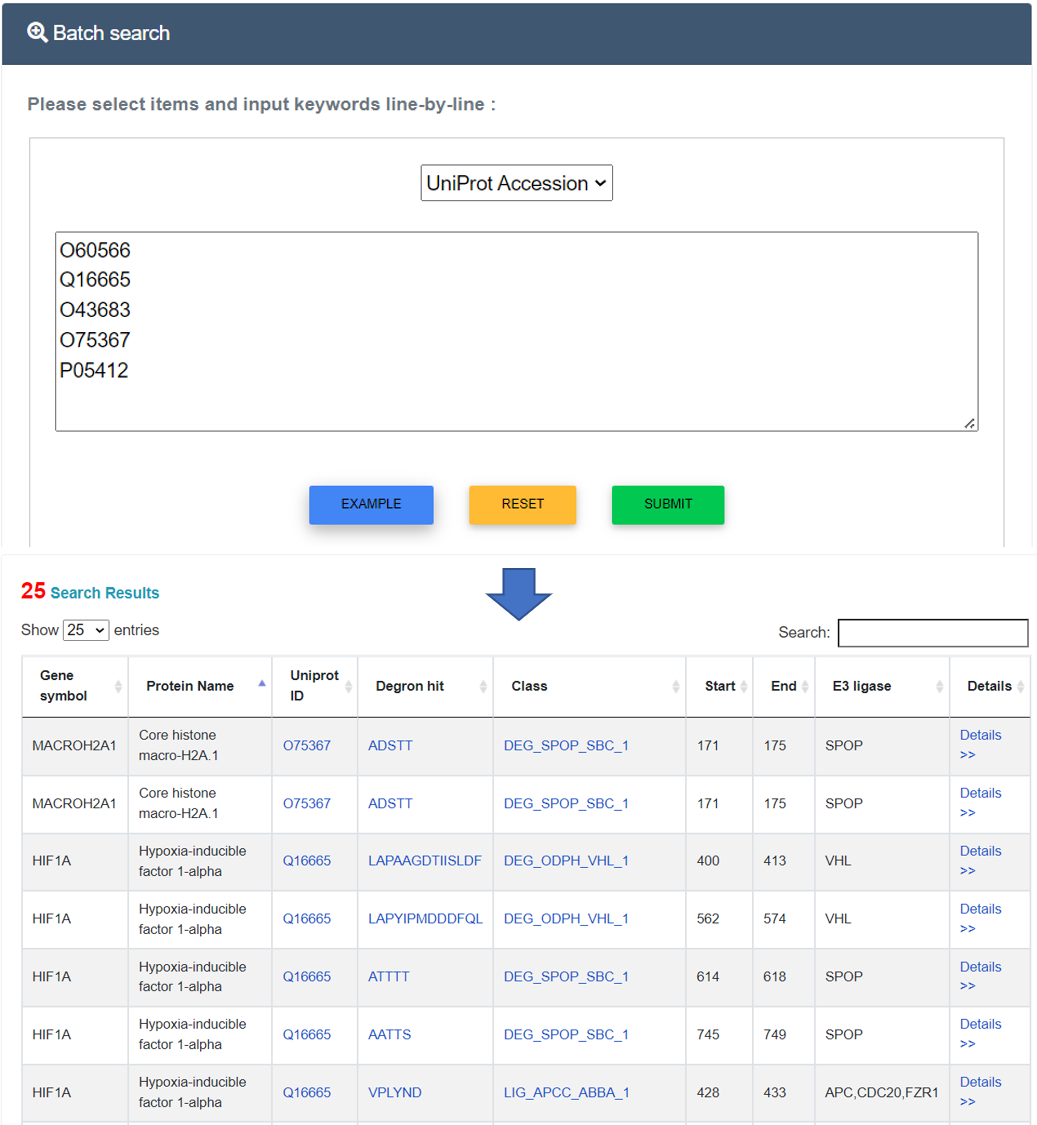
Users can enter multiple keywords, such as UniProt accession, gene name, protein name, E3 ligase, and degron, in a line-by-line format for querying. For example, if the multiple keyword "UniProt Accession", including "O60566", "Q16665", "O43683", "O75367" and "P05412", are submitted, the corresponding results are shown in a tabular format, including UniProt accessions, gene symbols, protein names, Degron classification, chromosome and more details. Users could click the "More" link to see more annotations.
2.3 BLAST search
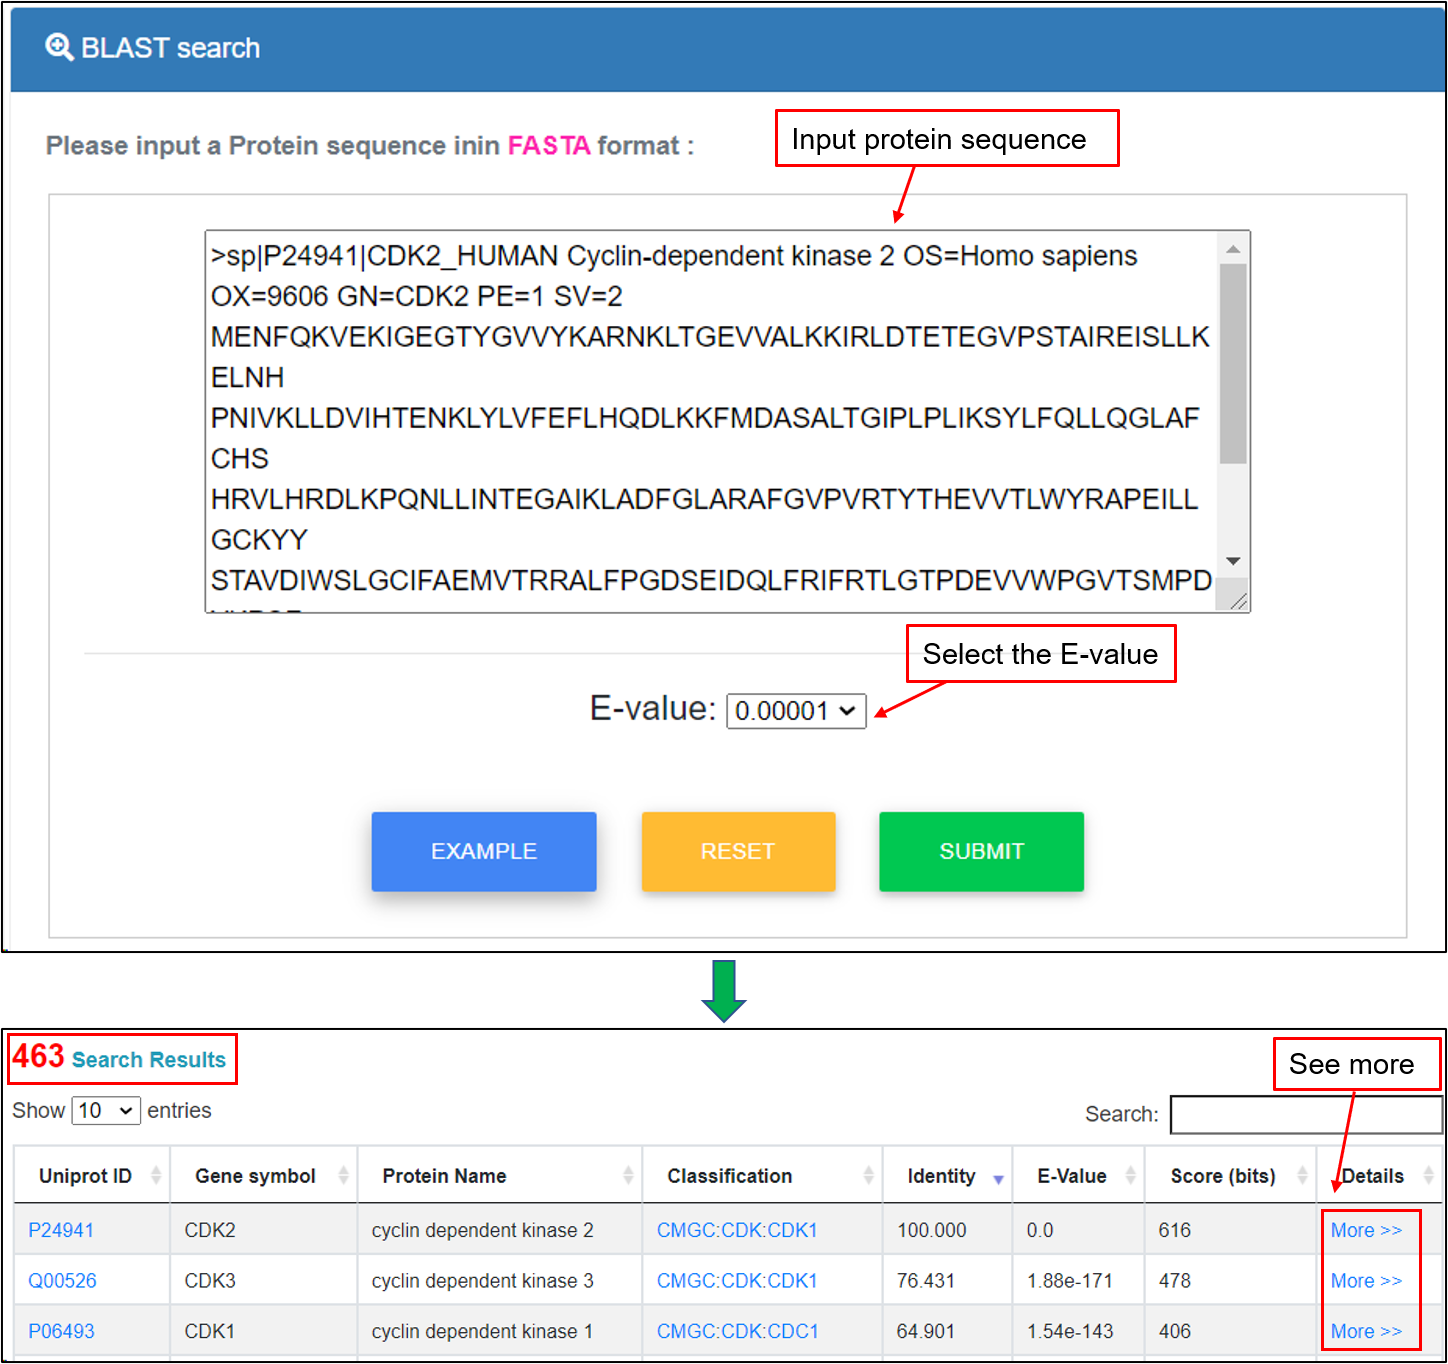
This option was designed for querying the DegronMD by protein sequences. The blastp program of NCBI BLAST packages was included in the database. Users can enter a protein sequence in FASTA format to search identical or homologous proteins. For example, if the protein sequence of "CDK2" gene and user-defined “E-value” is submitted, the corresponding homologous proteins greater than that value will be shown in a tabular format, including UniProt accessions, gene symbols, protein names, Degron classification, identity, E-value, Score (bits) and more details.
3. Compendium
The annotationpage has abundant information. It can be visited by the search or browse function (click the link in data tables). The website page contains 7 tabs is provided to show the detailed annotations for each protein/degron.
3.1 Degron/proteinin formation and function annotations
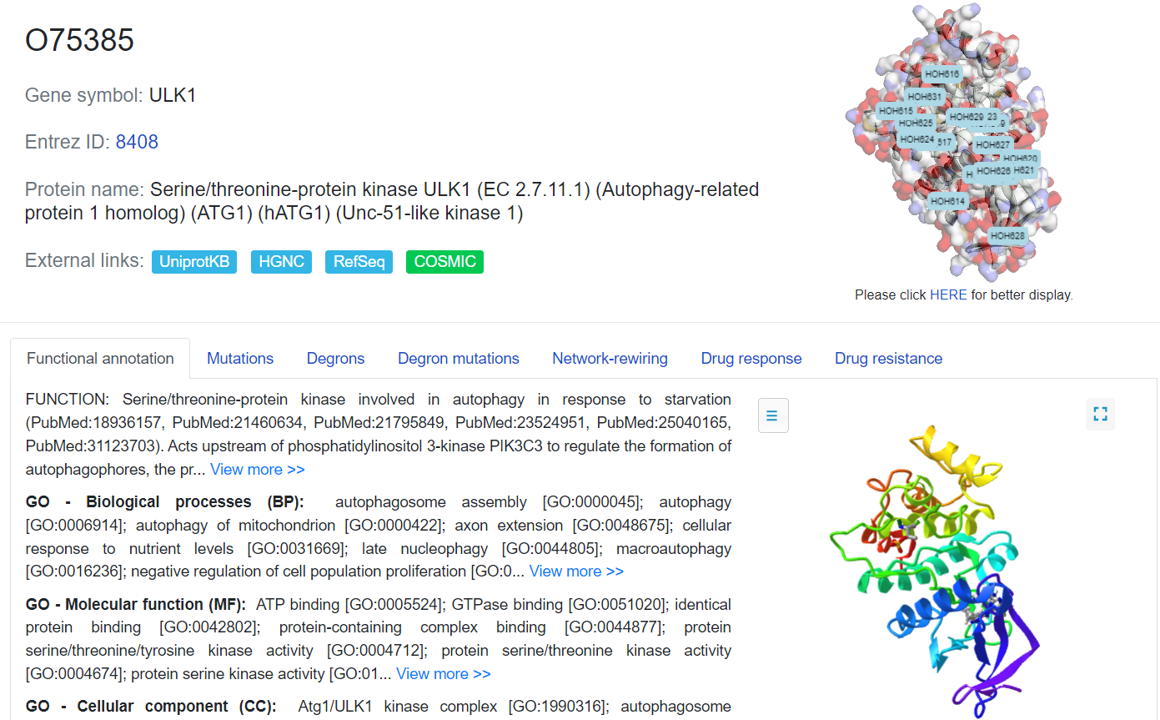
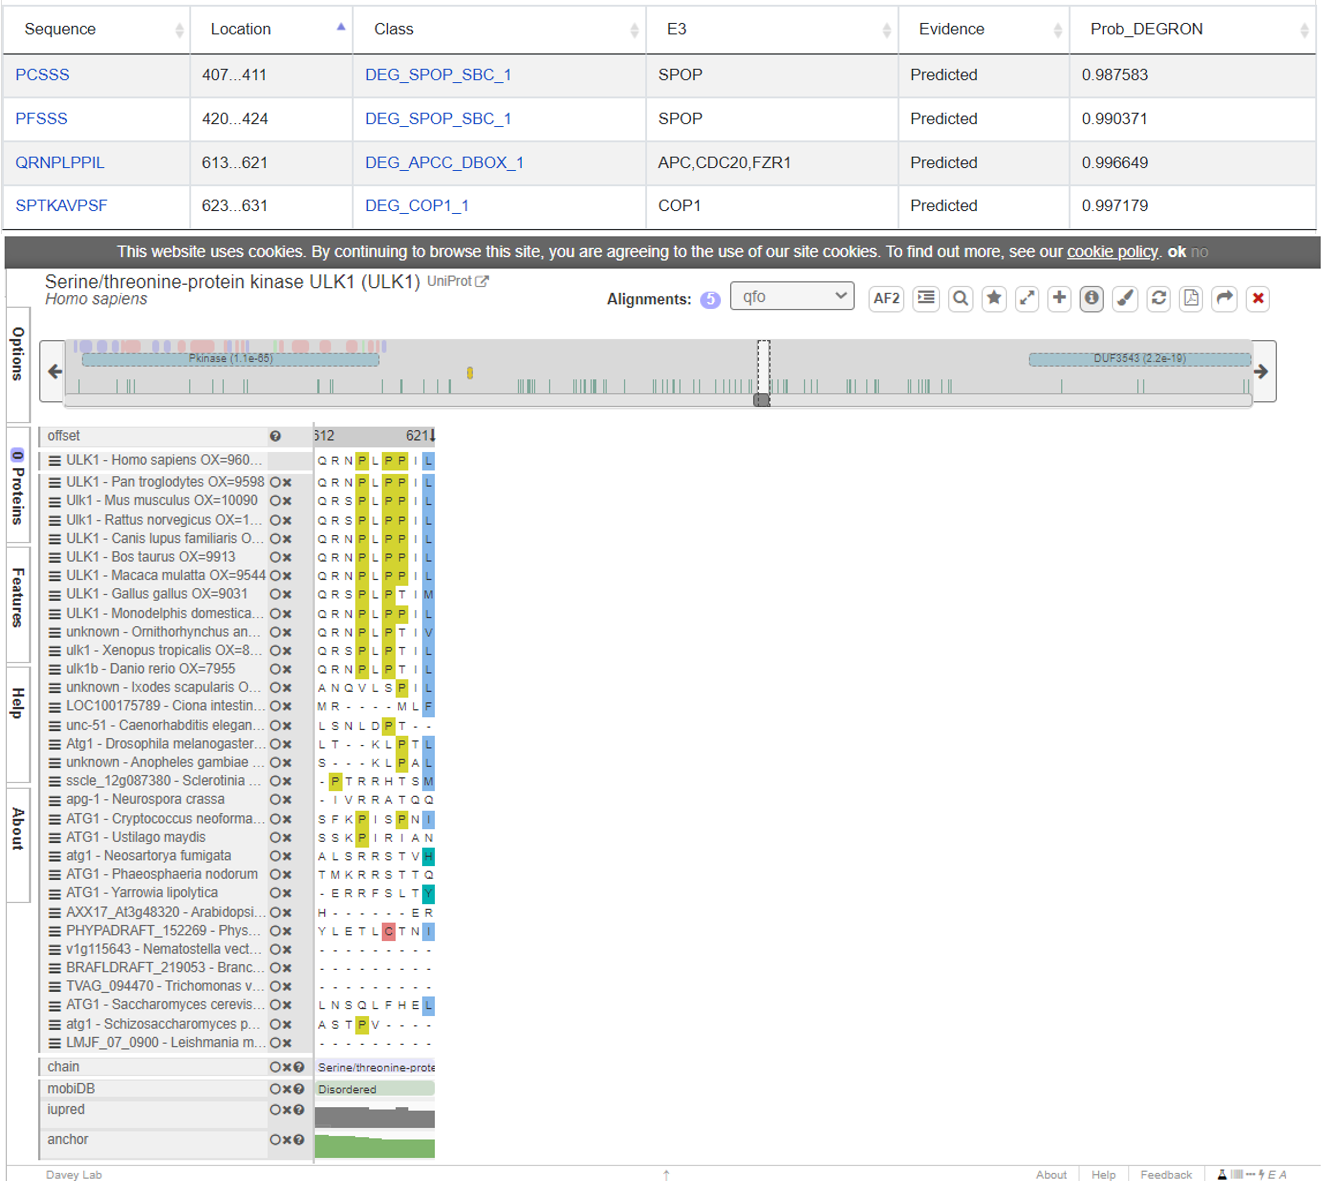
The basic annotation information for the degron proteins is shown in this tab, including the gene symbol, full name. External links are also provided to some well-known database. The loci can be viewed in a large size with PDB ID switching.
The functional annotation includes the description of Degron role in our body. Additionally, the relevant gene ontology(GO) terms (GO-biological processes, GO-molecular functions, and GO-cellular components) were collected and displayed in this tab.
The 3D structure view is provided for the user to look into the AA sequence characters.
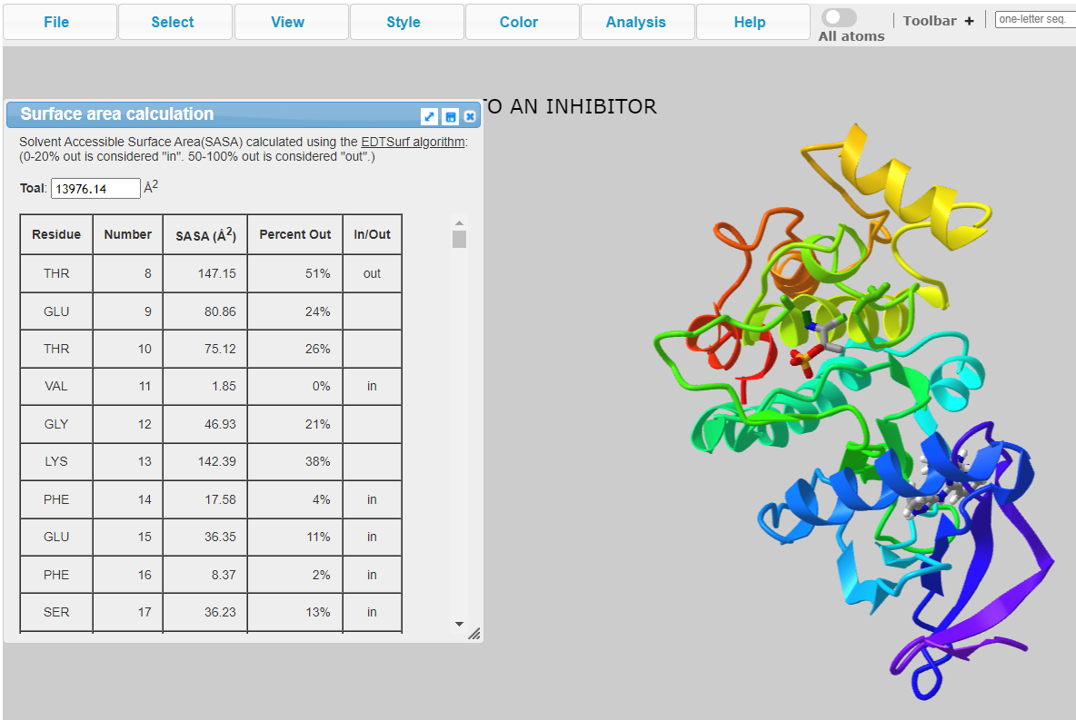
The 3D structure view is provided for the user to look into the AA sequence characters.
The information for specific degron and many structural and physicochemical features.
3.2 Cancer mutations on degron protein
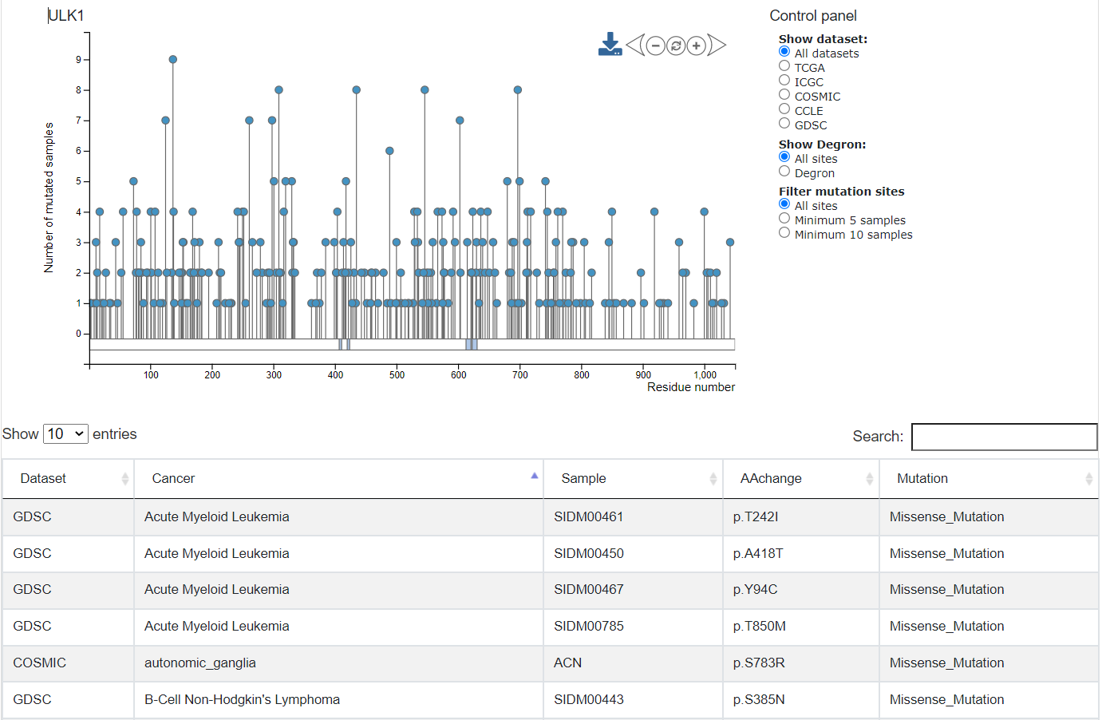
The mutation data were shown for the selected degron protein in this tab. The needle plot on the top displays the sample counts in the mutation positions. Users can use the control panel on the right upper corner to choose specific mutations, and the plot will change dynamically. A table at the bottom shows the full list of mutations in the selected degron in different samples from the 5 pan-cancer datasets.
3.3 Degron mutations
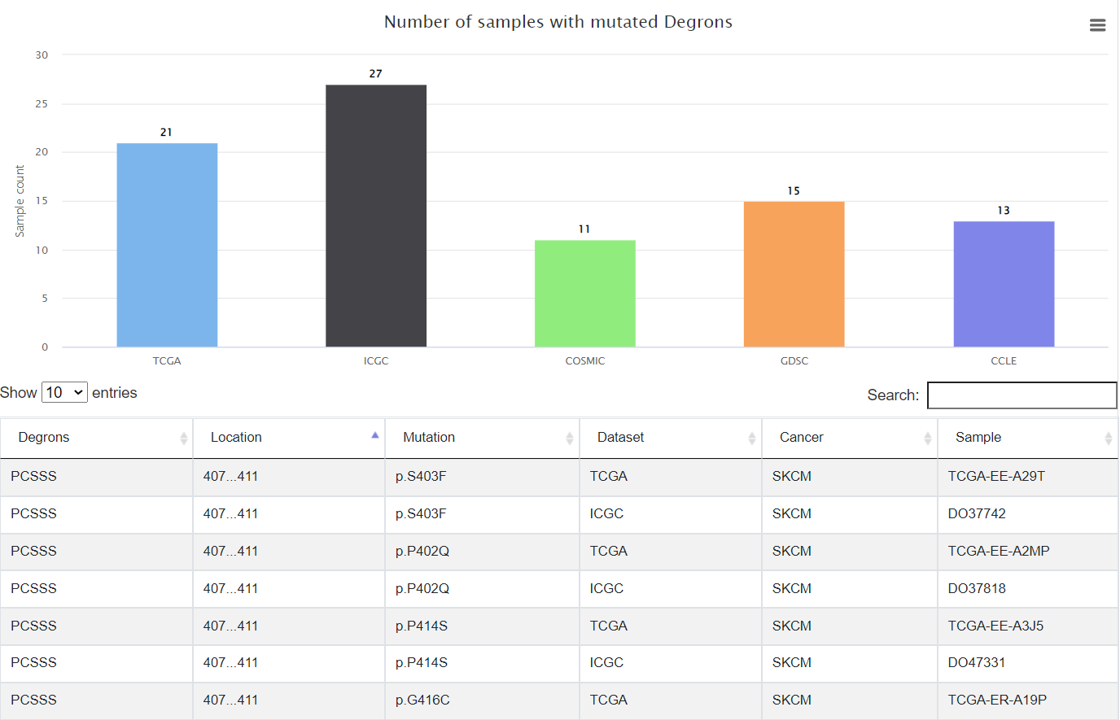
In this tab, mutations in the degrons were listed. A bar plot displayed the number of mutated samples in each degron. Clicking on the bar will show the number of mutated samples in each pan-cancer dataset.
3.4 Regulatory network-rewiring mutations
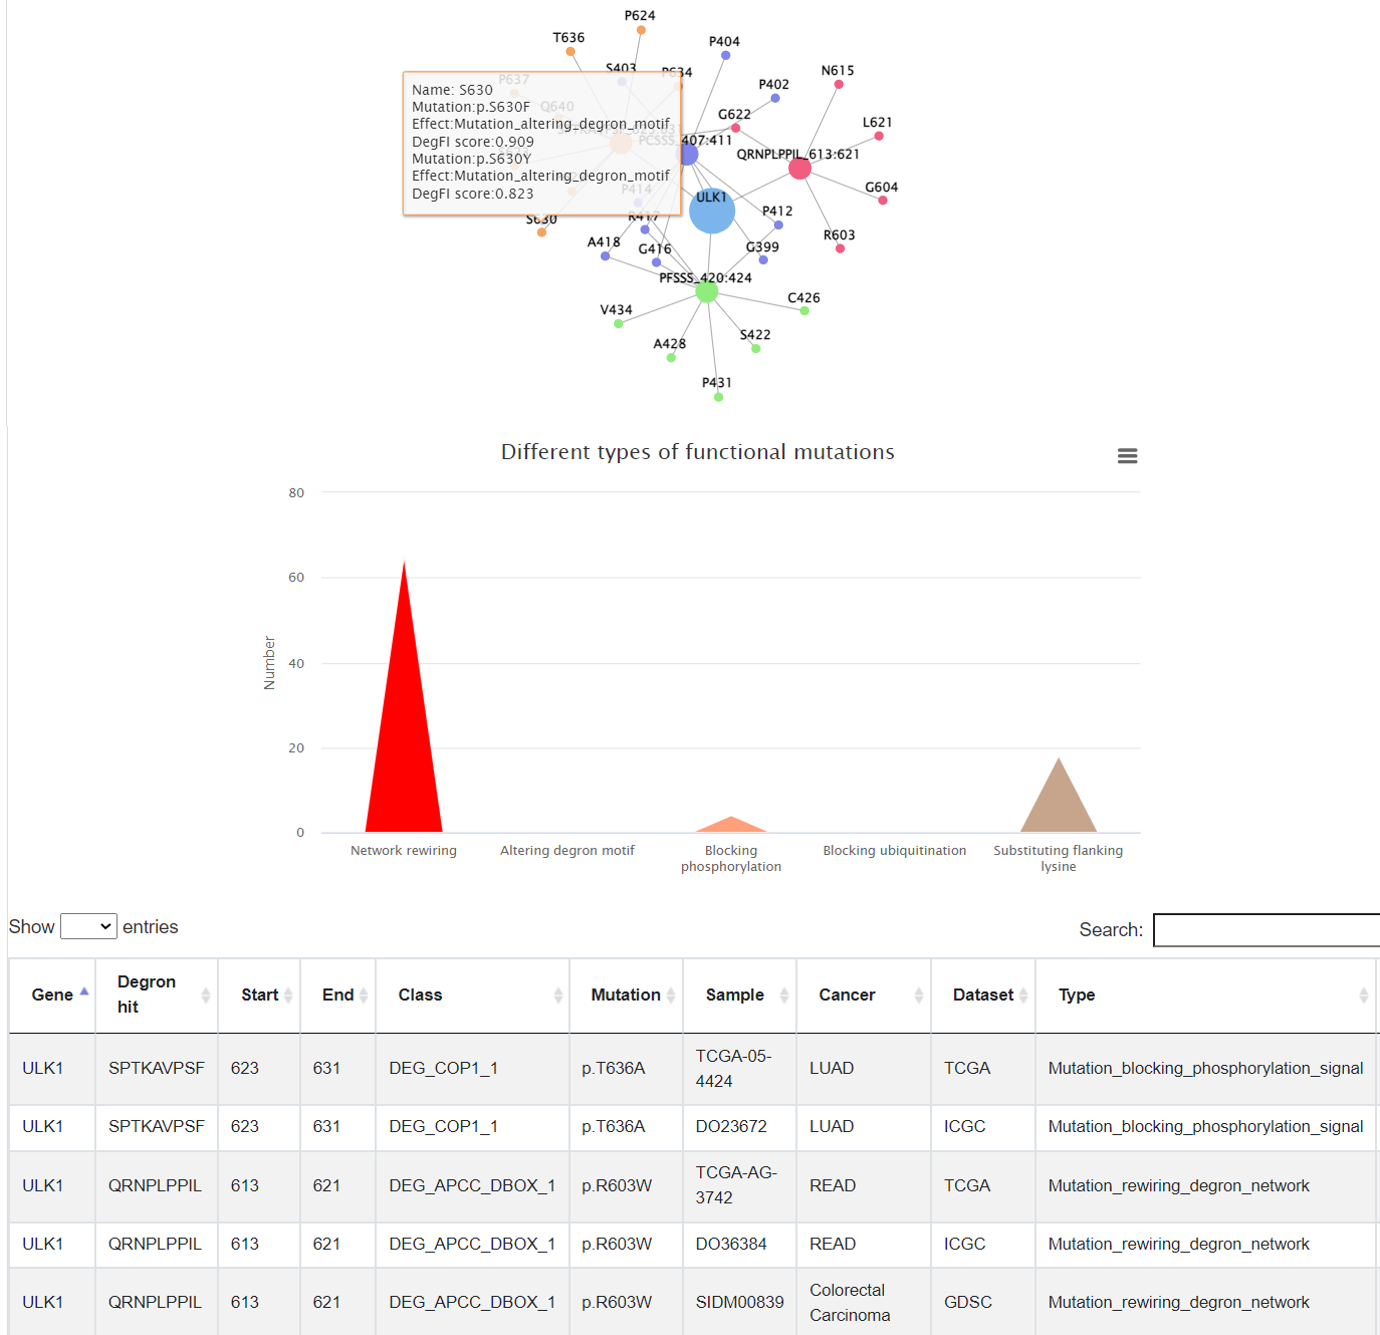
In this tab, it shows the E3-degron regulatory network affected by mutations. The number of the functional mutations were summarized and shown in a bar plot, which will give users an intuitional view of the main consequences that may be caused by mutations in this degron. A detailed table were provided as well to check the consequence from a specific mutation.
3.5 Drug response
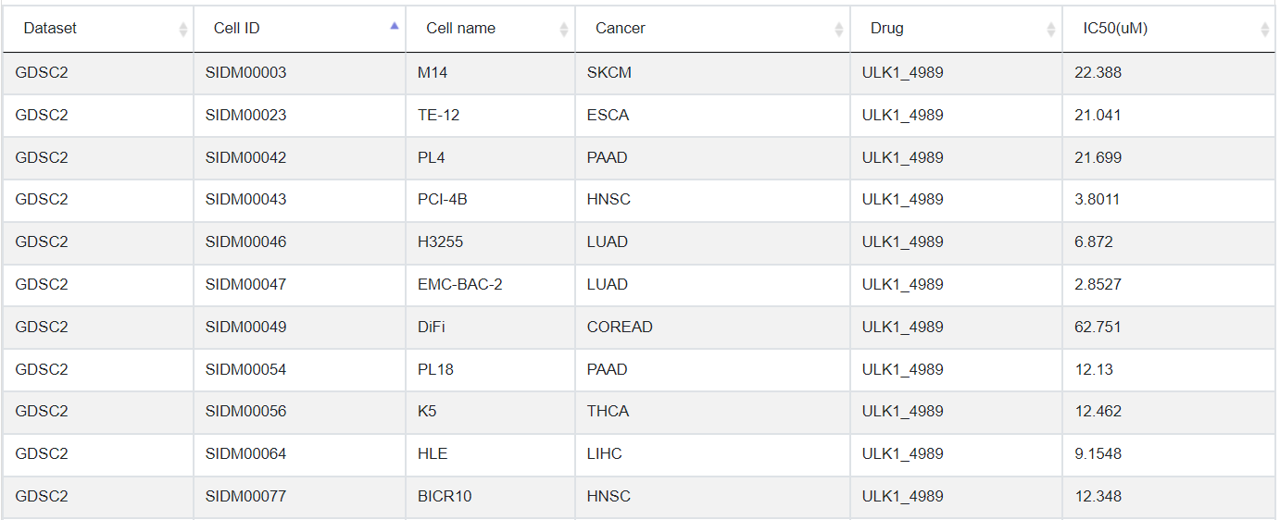
In this tab, all the drug treatments data associated with the selected degron proteins were listed for different cancer types in multiple cell lines that harbor different mutations.
3.6 Drug resistance
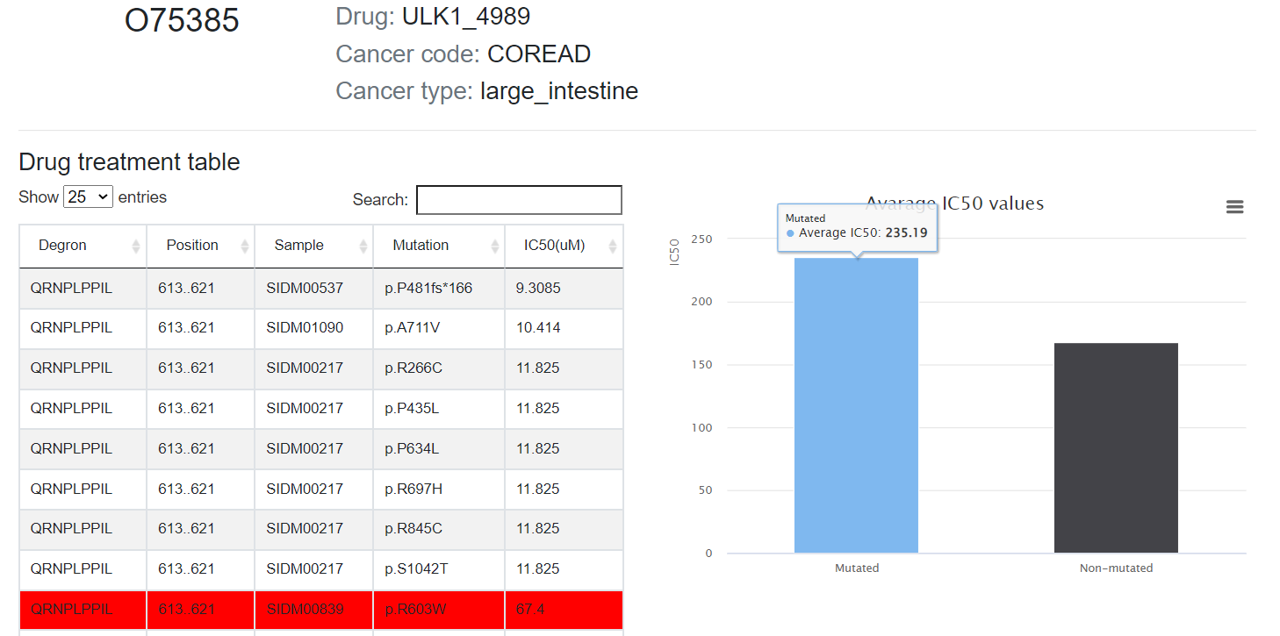
If the degron mutations can cause potential drug resistance, mutations in the degron will be displayed in this tab, as well as the drugs and corresponding cancer types that drug resistances involved in.
4. How to cite
Please cite: Haodong Xu, Ruifeng Hu, Zhongming Zhao, DegronMD: Degron mutations and drug response database. (Submitted)