Search by cell
In
Cell View, scRNASeqDB provides summary of cell group, sample information in cell group and top 200 up-regulated genes in cell group, as well as
interactive correlation matrix.
By selecting
By Cell menu item, users can query a cell group by inputing the name of cell group or select from the cell group list.
The detailed information can be obtained by clicking the name of cell group.
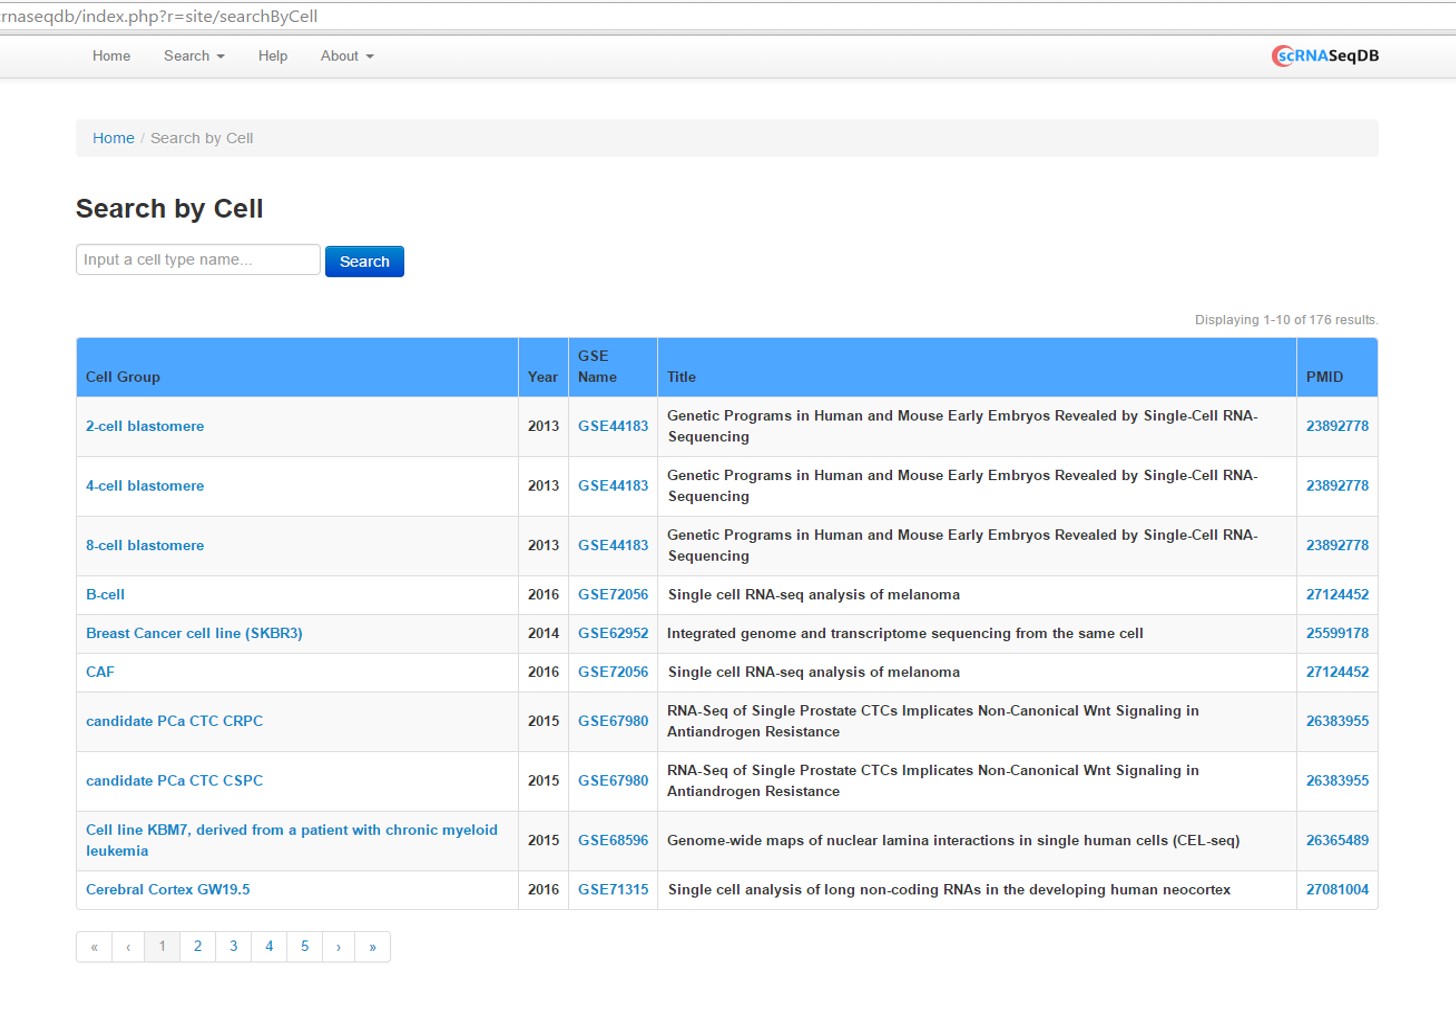
Figure 9. Cell group search interface.
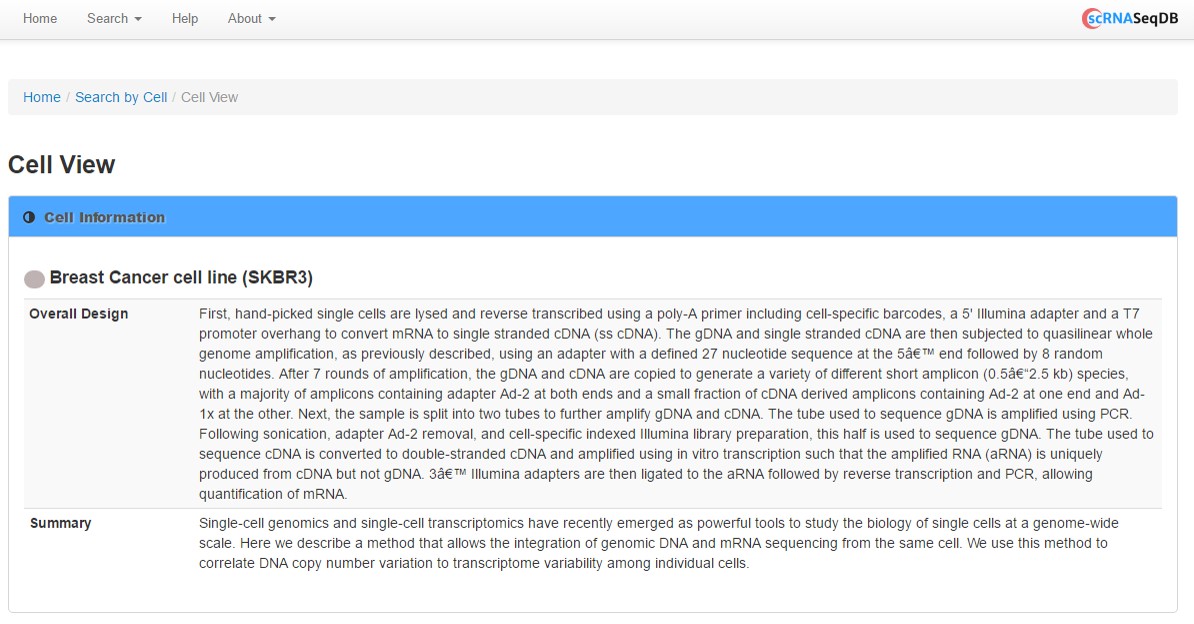
Figure 10. Overall design and summary of the cell group.

Figure 11. The table provides sample information in the cell group.

Figure 12. The table provides top 200 up-regulated genes in the specific cell group.
R/qtlcharts was used to provide interactive data visualizations for gene correlation analysis.

Figure 13. The left panel is an image of a correlation matrix for 200 up-regulated genes in a specific cell group.
Hover over pixels in the correlation matrix on the left to see the values; click to see the corresponding scatterplot on the right.

