1. Collection and processing of GWAS summary statistics for complex traits and diseases
-
We update our Expanded Trait Collection (ETC) of GWAS summary statistics from 6/20/2019 to 5/18/2020 according to the GWAS catalog summary files. Overall, we discovered >700 newly collected GWAS traits, 388 of them with downloadable summary statistics.
-
We adapted the same criteria used in previous TSEA-DB to conduct quality control and preprocessing of the GWAS summary statistics. Detail see the description TSEA-Documentation. After all, we obtained 171 new GWAS traits. Along with previous near 5000 GWAS traits we collected in the TSEA-DB, we have collected 5120 human complex traits and diseases for the CSEA-DB.
-
We upgrade our gene-level p value calculating algorithm to a more widely-used tool Magma, which utilizes a gene-level regression model-based algorithm to aggregate the gene-level impact for each human complex trait or disease.
2. Collection and processing of human tissue single-cell expression data
-
The current version of CSEA-DB, we mainly use the uniformed and normalized human tissue single-cell expression data generated by the Human Cell Landscape , Single Cell Expression Atlas, and literatures, which contain 71 human tissues single-cell datasets and 752 tissue-cell types.
-
For each single-cell expression tissue, we selected those cell types to have at least 30 cells to conduct t-statistics for each gene to assess the gene’s cell type-specificity among those cell types in each tissue. Detail of how we calculate t-statistics could be found in the method part of our previous work. (Pei et. al., 2019, Bioinformatics )
-
We are also actively collecting and processing new available labeled human tissue single-cell transcriptome data from consortium and literature (e.g. The Human Lung Cell Atlas, Human Cell Atlas).
3. Cell type-specific enrichment analysis (CSEA)
-
For each trait, we define five trait-associated-gene (TAG) sets using different thresholds for the gene-based p-value from Pascal: p < 0.05, p < 0.01, p < 0.001, p < 0.0001, and p < 0.00001. Among them, if a TAG set has more than 1000 genes or less than 20 genes, the set will not be analyzed by deTS. The number of qualified TAG sets is shown in the traits information for each trait.
-
Our original deTS package implements the chi-squared test to conduct cell type-specific enrichment analysis (CSEA). In CSEA-DB, we also applied the Kolmogorov-Smirnov test to validate the top 3 most significantly enriched tissue-cell types for each trait.
-
In the trait page, we label the enrichment p-values for tissues where the p-value is < 0.2 and we use gradient color to show tissues that are nominally significantly enriched in the TAG sets. Note that all CSEA p-values shown in this web-site are the raw p-values before multiple-testing correction.
4. Overview - Home page
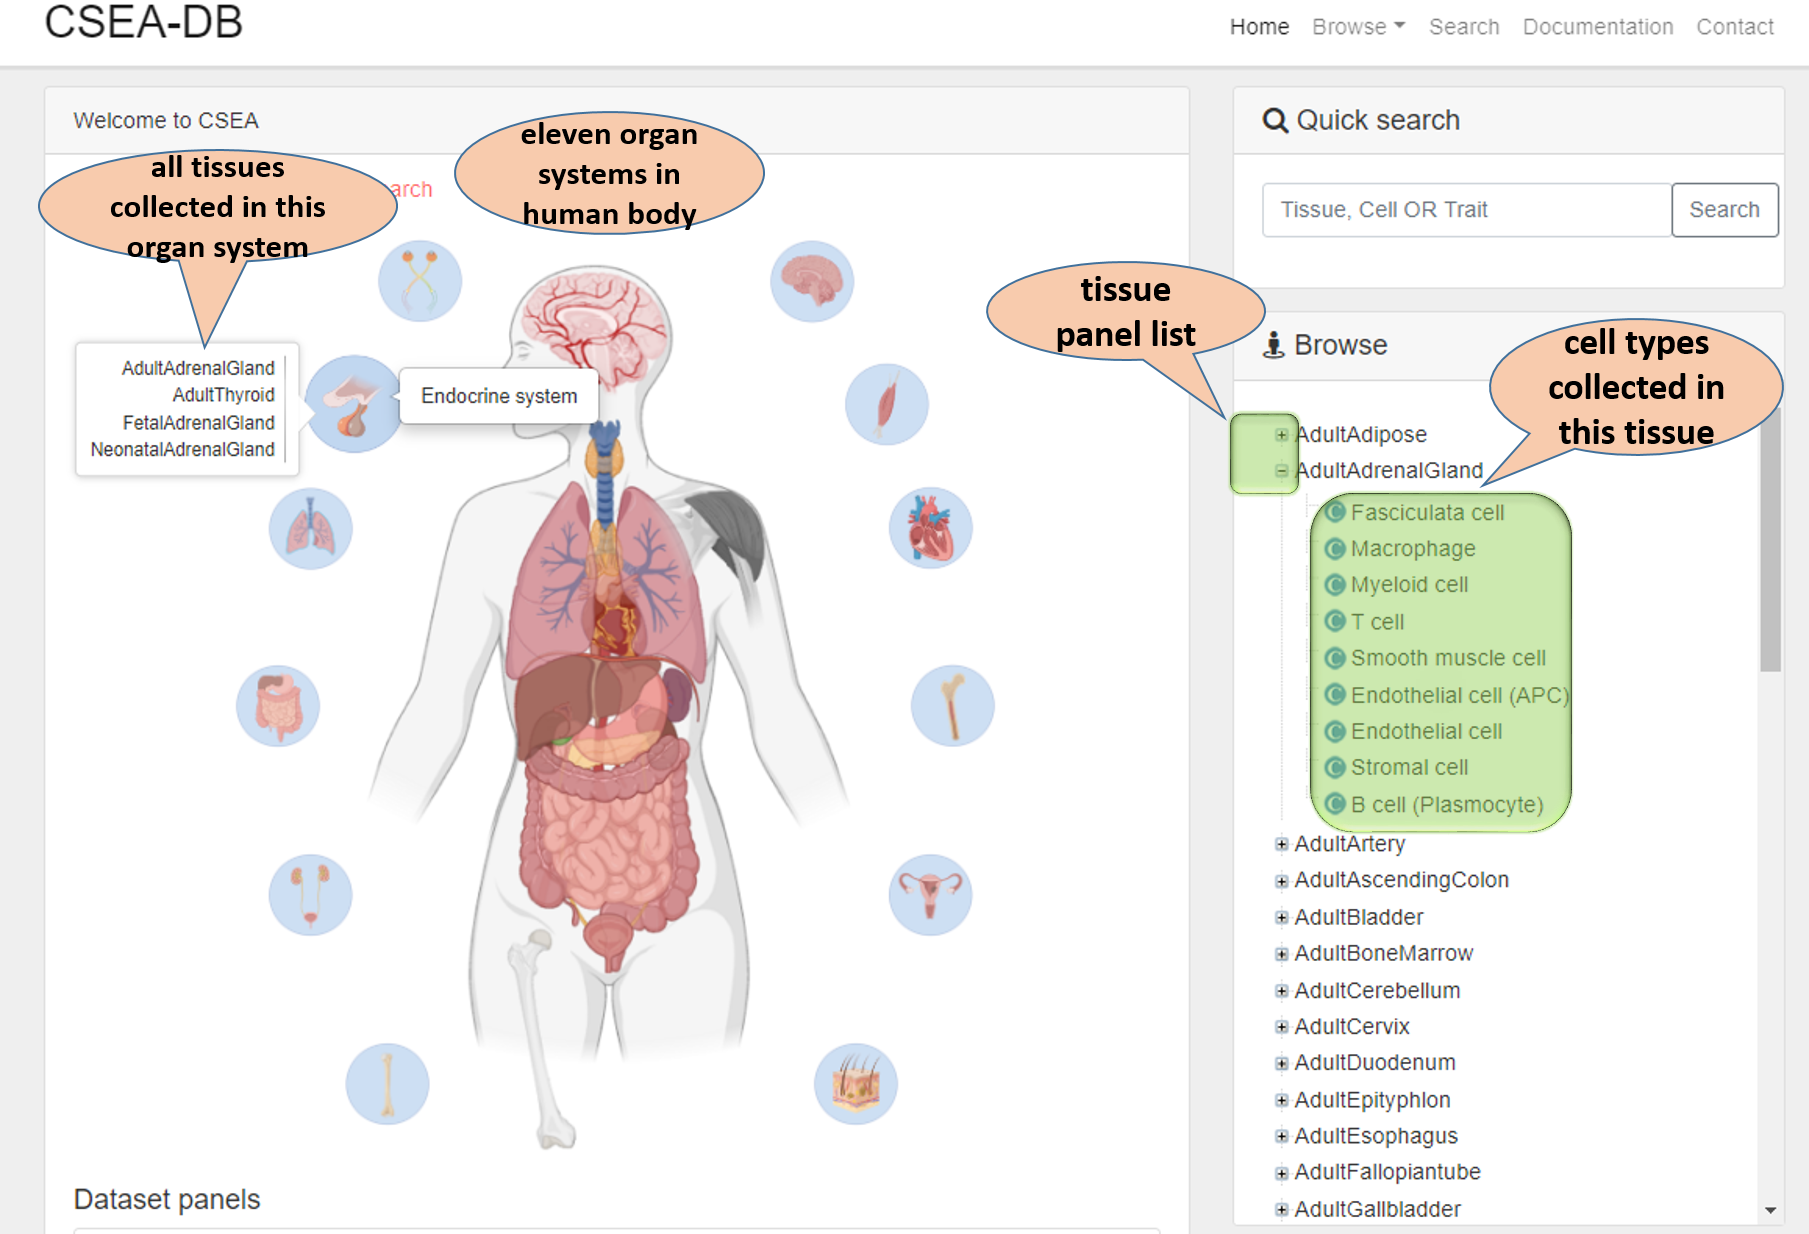
In this Cell type-Specific Enrichment Analysis DataBase (CSEA-DB) home page, we have an overview for evelen human organ systems (plus sensory systems). Users could click the organ icons to find the tissues with single-cell transcriptome data. Users will find the tissue-cell type associated trait map there. In the right part, user could conduct information search by typing the keywords related to tissue, cell type or Trait in "Quick search" section. Users could explore the tissue-cell type relation in "Browse" section. Users could have a brief idea of how CSEA-DB constructed by reading "About CSEA-DB" and "Dataset panels" sections. The website updates are listed in the News bulletin section.
5. Tissue and cell type-associated traits map
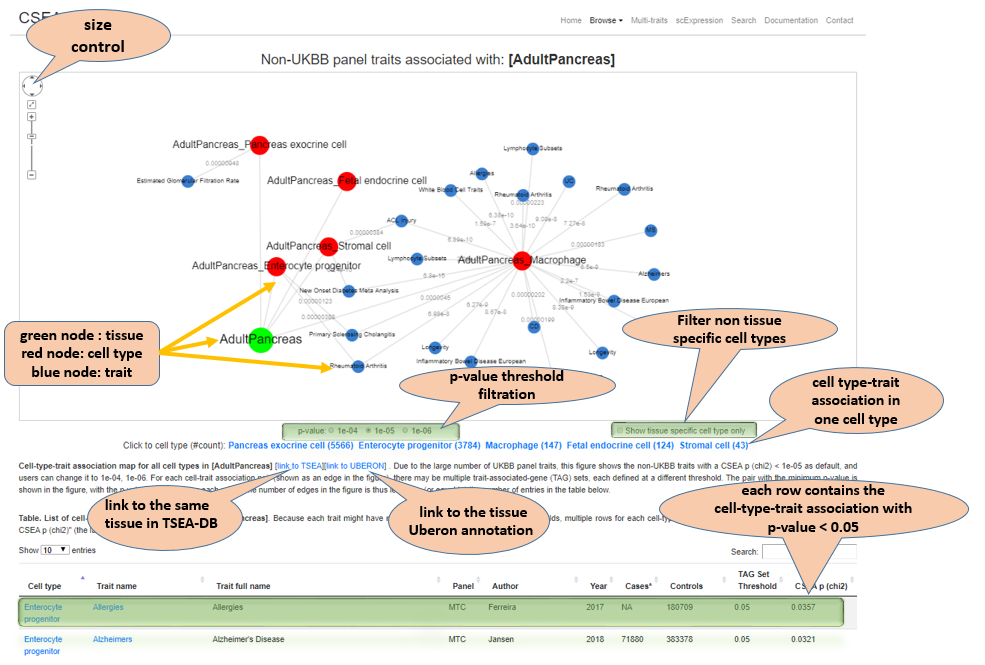
Tissue and cell type-associated traits map for one tissue. Due to the large number of UKBB panel traits, this figure shows the non-UKBB traits with a CSEA p (chi2) < 1e-05 as default, and users can change it to 1e-04, 1e-06. For each cell type and trait association pair (shown as an edge in the figure), there may be multiple trait-associated-gene (TAG) sets, each defined at a different threshold. The pair with the minimum p-value is shown in the figure, with the p-value showing along each edge. The number of edges in the figure is thus less than (or equal to) the number of entries in the table below. Notes in the vignette show the features.
6. Cell type-asscociated traits map for one cell type
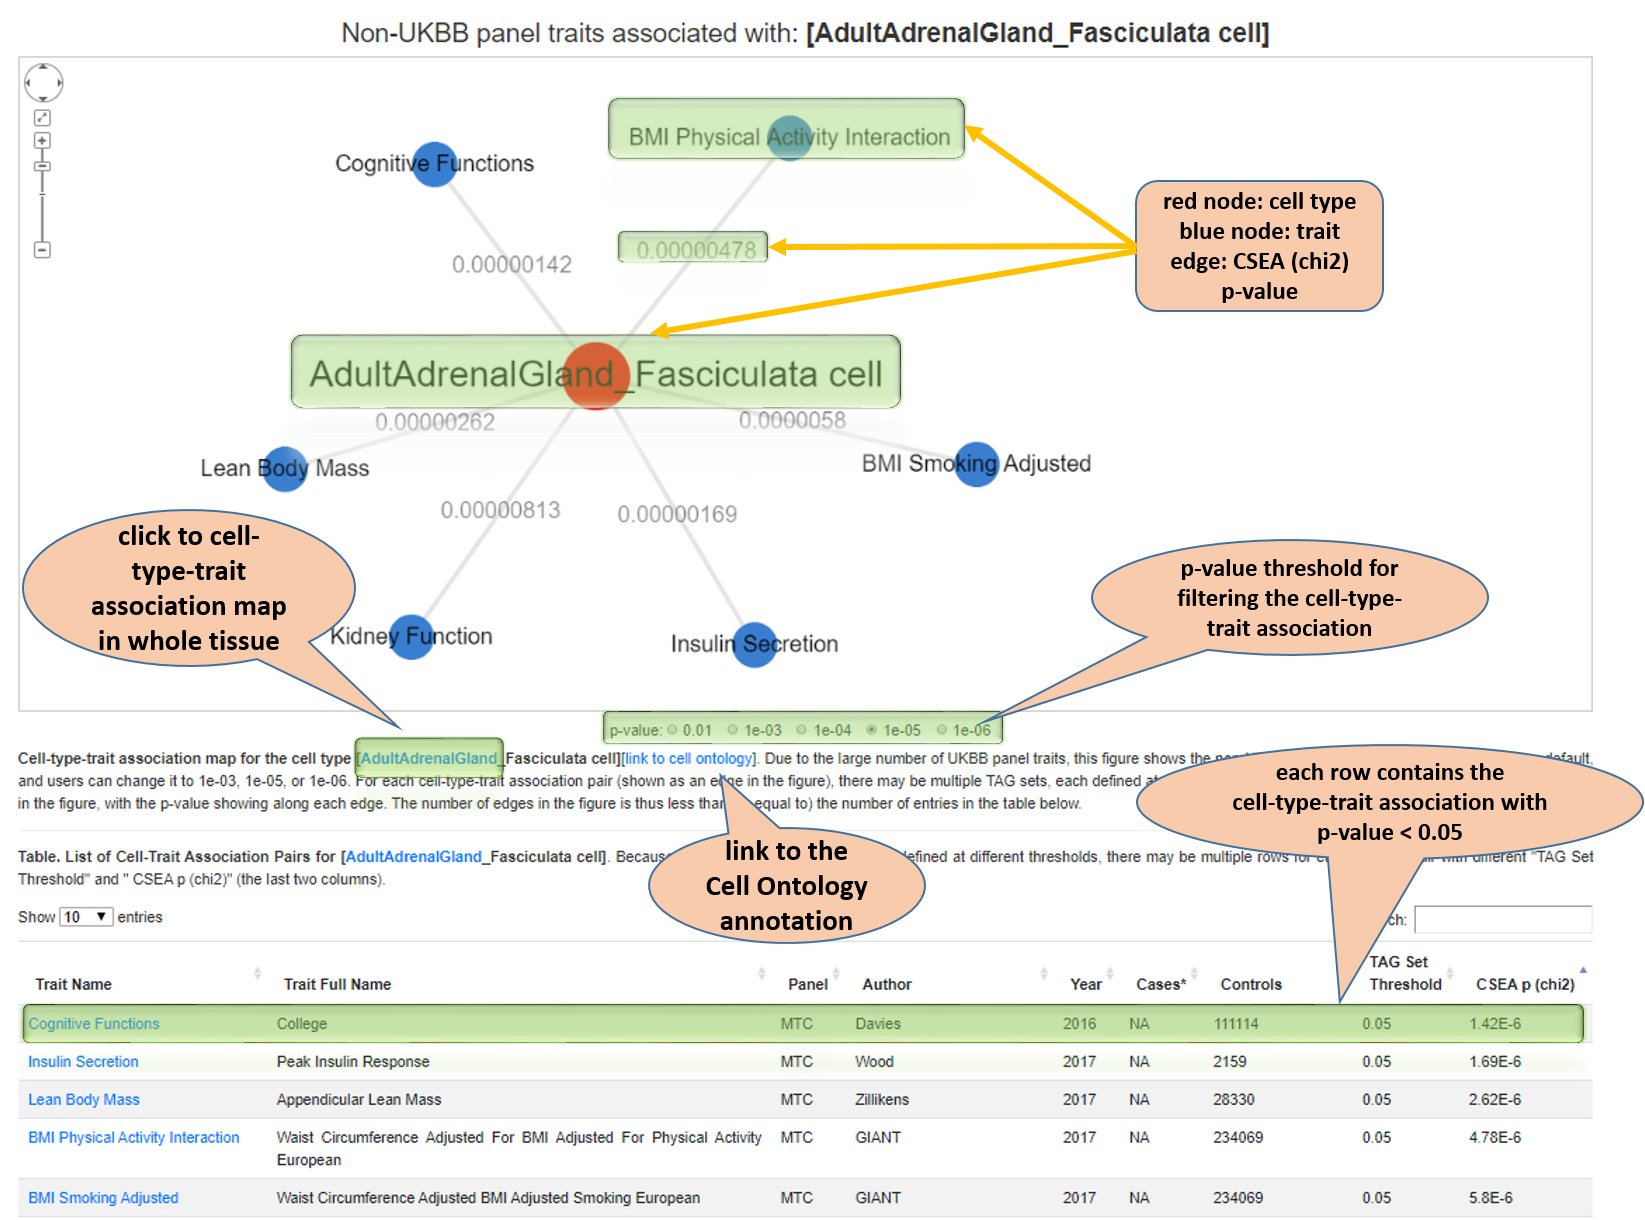
Cell type-asscociated traits map for one cell type. Due to the large number of UKBB panel traits, this figure shows the non-UKBB traits with a CSEA p (chi2) < 1e-04 as default, and users can change it to 1e-03, 1e-05, or 1e-06. For each cell type and trait association pair (shown as an edge in the figure), there may be multiple TAG sets, each defined at a different threshold. The pair with the minimum p-value is shown in the figure, with the p-value showing along each edge. The number of edges in the figure is thus less than (or equal to) the number of entries in the table below. Notes in the vignette show the features.
7. Demonstration of CSEA result
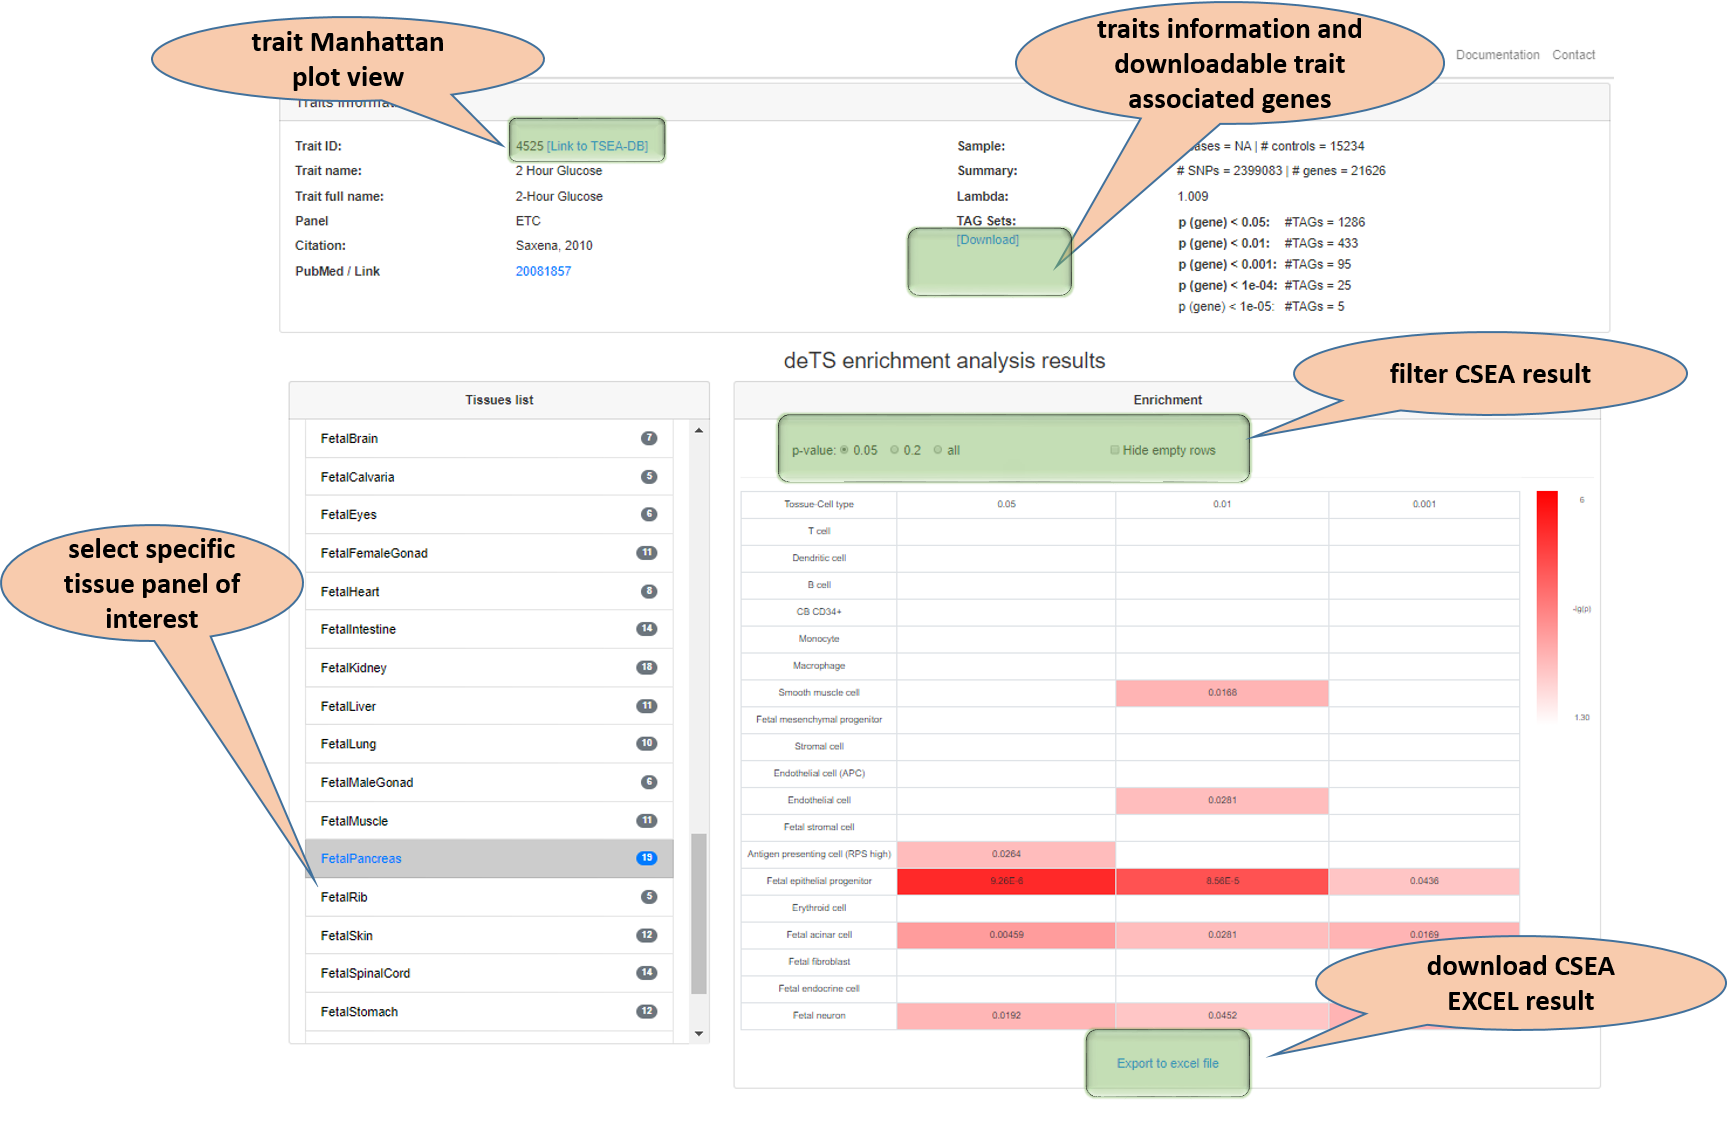
For each query trait, CSEA results frr all tissues will be listed and users could select the specific tissue of interest from the left column to see the CSEA result in that focal tissue. Notes in the vignette show the features.
8. Multi-traits
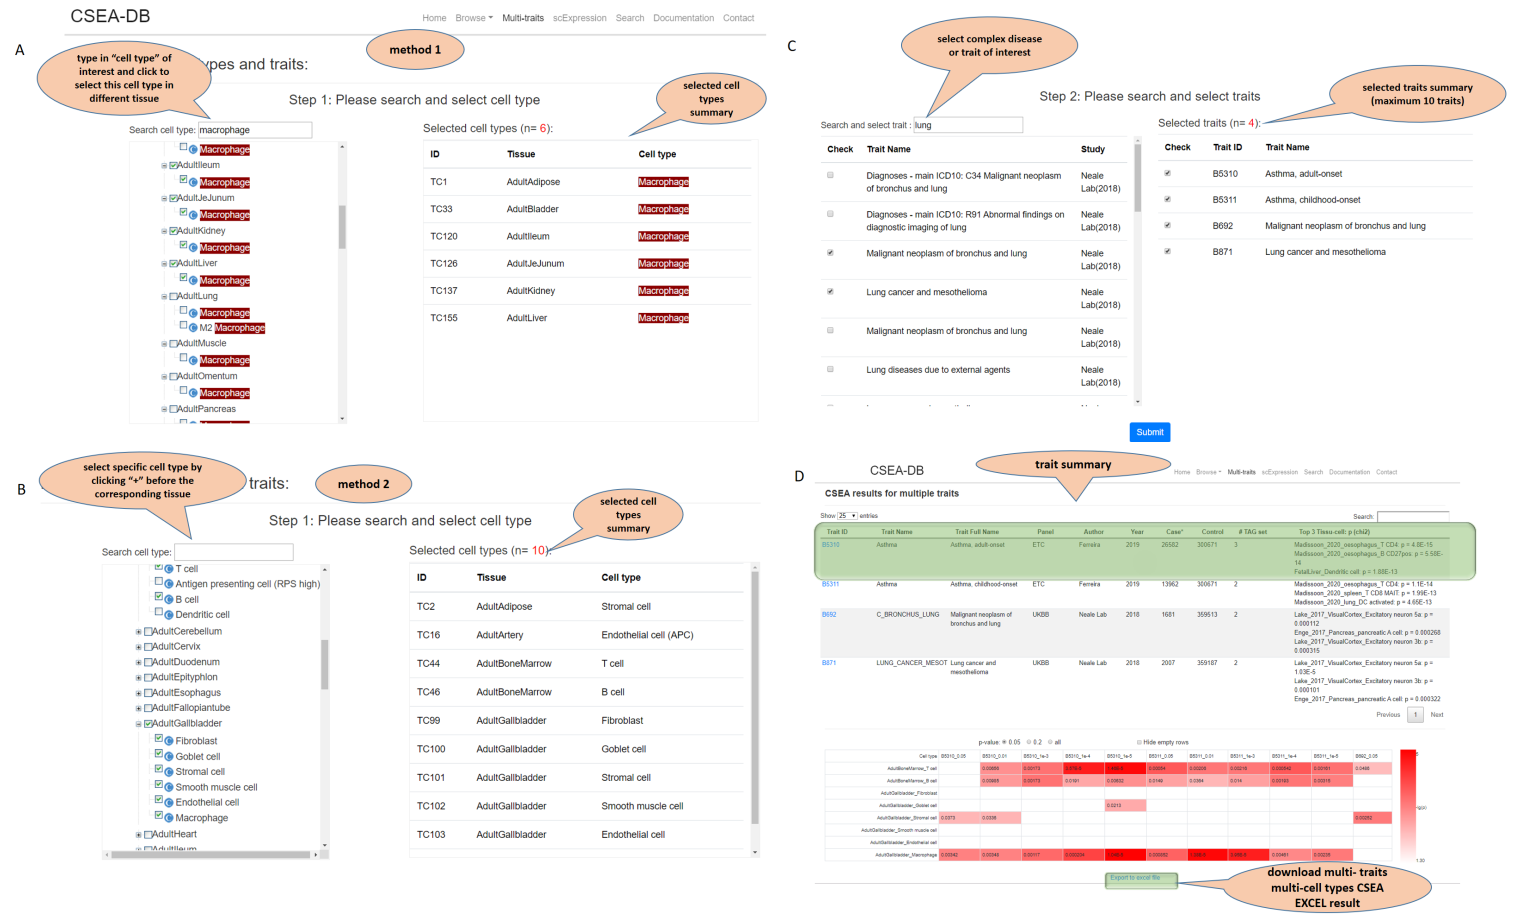
An example of our Multi-traits function by comparing the asthma and other lung diseases from 4 GWAS datasets in 8 tissue-cell types. We provide two methods for the “Step 1” to select the multiple “cell types” of interest. A) method 1: typing key words. B) method: click to select from the list of tissues and their cell types. C) We provide the fuzzy search for the human complex diseases and traits. Users could select no more than 10 traits at one search. D) After submit the query, the page will go to the “Multi-traits” summary and CSEA result heatmap.The color is proportional to the –log(p-value) value of the associations. The tables with p < 0.05 are filled with the corresponding p-values and the tables with p ≥ 0.05 are left blank. Notes in the vignette show the features.
9. scExpression
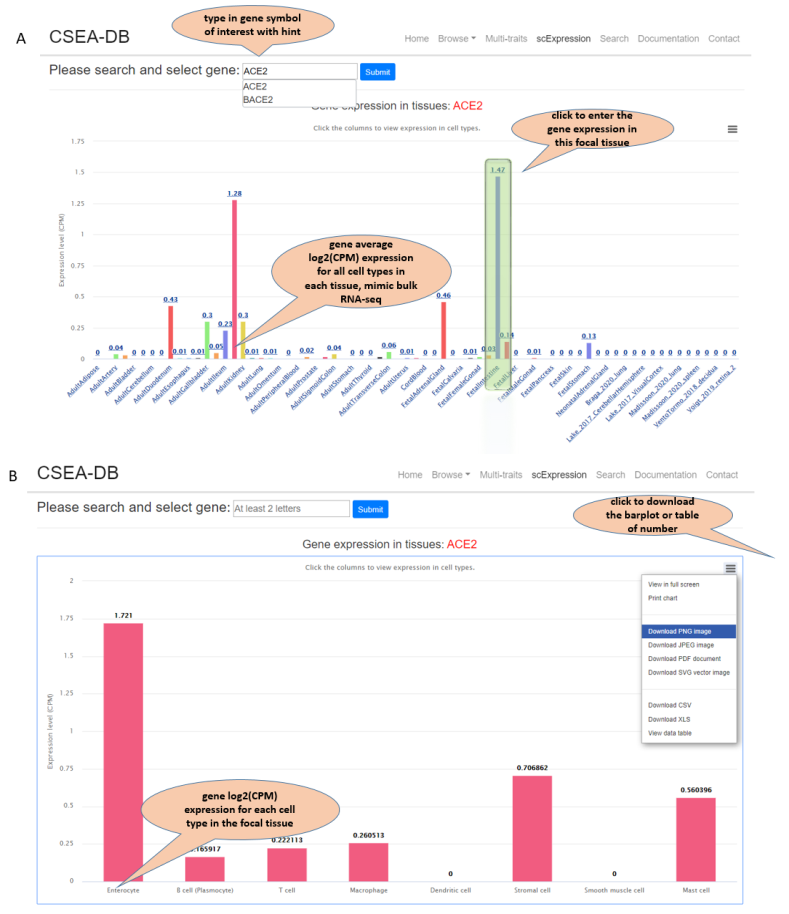
This scExpression page provides normalized gene expression information at both tissue and cell type level. Users could submit one gene symbol name of interest and the scExpression page will return an overview (barplot) of the average CPM normalized gene expression within each of the 68 tissues studies with UMI-based data. The users could further click the tissue bar of interest and barplot for the average CPM normalized expression of each cell type in that tissue will return. The plot and the expression data are all downloadable. Notes in the vignette show the features.
10. Search page
The search function on the front page of CSEA-DB supports the search for trait name, tissue, and cell type of interest. And the return page includes all the possible results related to the keywords. The search function in the search page allows keywords searching specifically for either the trait name, tissue or cell type.
11. Related resources
-
The Multi-Trait Collection was download from other researcher’s curation .(https://github.com/mikegloudemans/gwas-download) .
-
Human Cell Landscape (http://bis.zju.edu.cn/HCL/)