![]() About GWAS summary statistics panels of human complex traits and diseases: the MTC, ETC, and UKBB panels.
About GWAS summary statistics panels of human complex traits and diseases: the MTC, ETC, and UKBB panels.
The Multi-Trait Collection (MTC) traits were previously reported in the work by Liu et al., 2019. We downloaded each individual GWAS summary statistics data set following the GitHub resource. A total of ~700 data sets were successfully collected, covering ~200 complex traits and diseases. Most of these data sets are also linked to GWAS Catalog references. A pair-wise correlation using gene-level p-values was conducted to identify duplicated or highly-correlated data set. We also excluded those of non-European ancestry or those of trans-ethnic meta-analysis data sets. As a result, 435 GWAS data sets were successfully analyzed by Pascal and deposited in TSEA-DB.
The panel manually curated by our lab, namely the Expanded Trait Collection (ETC) panel, included 161 GWAS summary statistics data sets (as of 6/20/2019). In our original publication of deTS, we collected 25 traits to demonstrate the method. Afterwards, we continue with the manual curation but excluded those that have been included in the MTC panel. We similarly did a pair-wise correlation analysis for traits from the MTC panel and traits from the ETC panel to remove duplicated data sets. In total, there were 161 GWAS data sets in this panel.
The UK Biobank (UKBB) traits were originally processed by the Neale Lab. Specifically, in TSEA-DB release 1.0 (August 6, 2019), we used the UKBB results referred as "GWAS round 2 released in August 1, 2018". We only downloaded data sets that were analyzed using both sexes, which amounted to 4525 data sets. After quality check and filtering, 4423 data sets were deposited in TSEA-DB. Notably, a subset of 633 traits in UKBB had corresponding ICD-10 codes. We further linked these code the higher categories of ICD-10. This subset can be browsed in the UKBB-ICD10 panel.
- After downloading the original data sets, we calculated gene-level p-values using Pascal. To this end, we split the job into ~100 threads and distributed to 5 servers (we very much appreciate our collaborators to provide the valuable computational resources to us!).
![]() Criteria for quality control and processing:
Criteria for quality control and processing:
Remove the data sets with trans-ethnic design
Remove the data sets with non-European populations
Remove the data sets that failed in Pascal calculations (e.g., missing chromosome positions or SNP rs-IDs)
Remove studies with targeted genotyping or #SNPs < 50k, but keep exome chip studies
![]() The GTEx panel
The GTEx panel
The GTEx release v7 contains 53 tissues. We chose 47 tissues that had 30 or more samples to build our panel. For each tissue, we fit an Ordinary Least Squares (OLS) regression and used the t-scores for each gene to assess the gene's tissue specificity. Age and gender were included as the covariates in the model fitting. The GTEx RNA-seq data included 14,725 protein-coding, non-housekeeping genes in 47 tissues. The t-score matrix is available in the deTS package.
![]() The ENCODE panel
The ENCODE panel
The tissue samples with RNA-seq data in the ENCODE were relatively small. We selected those that had at least 2 samples. We employed z-score to measure tissue specificity, where zi = (ei-mean(E)/sd(E) for gene i.
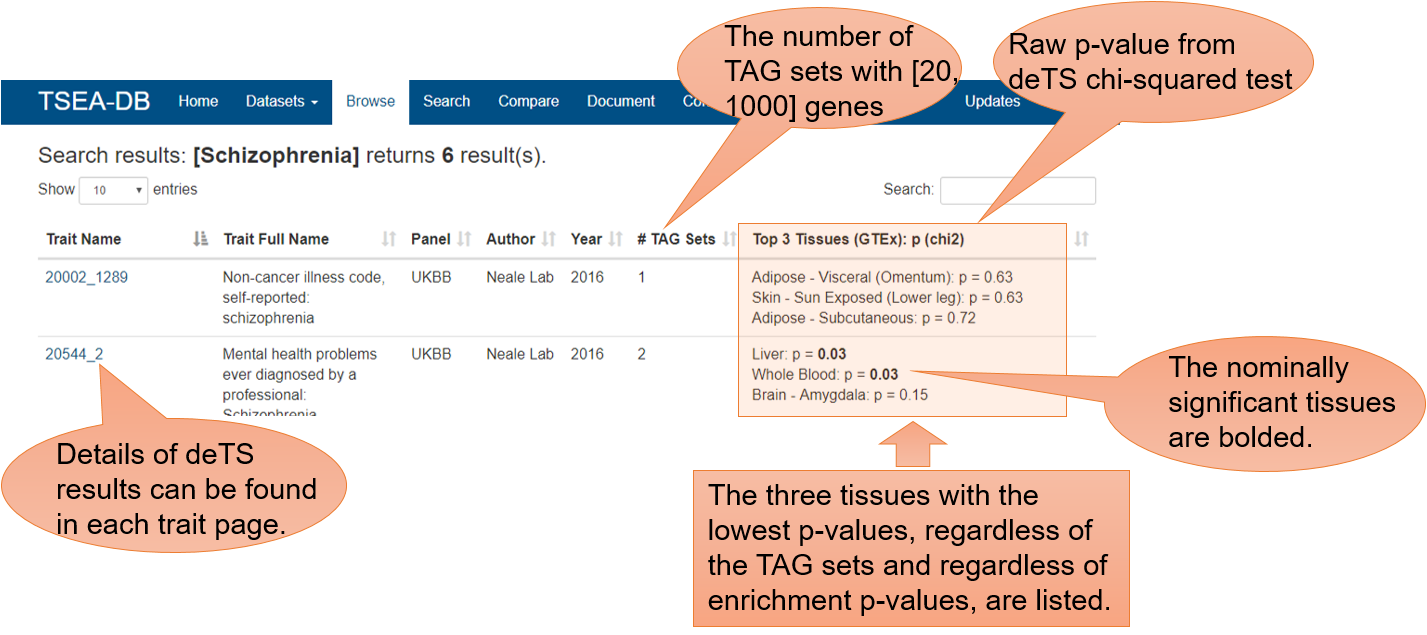
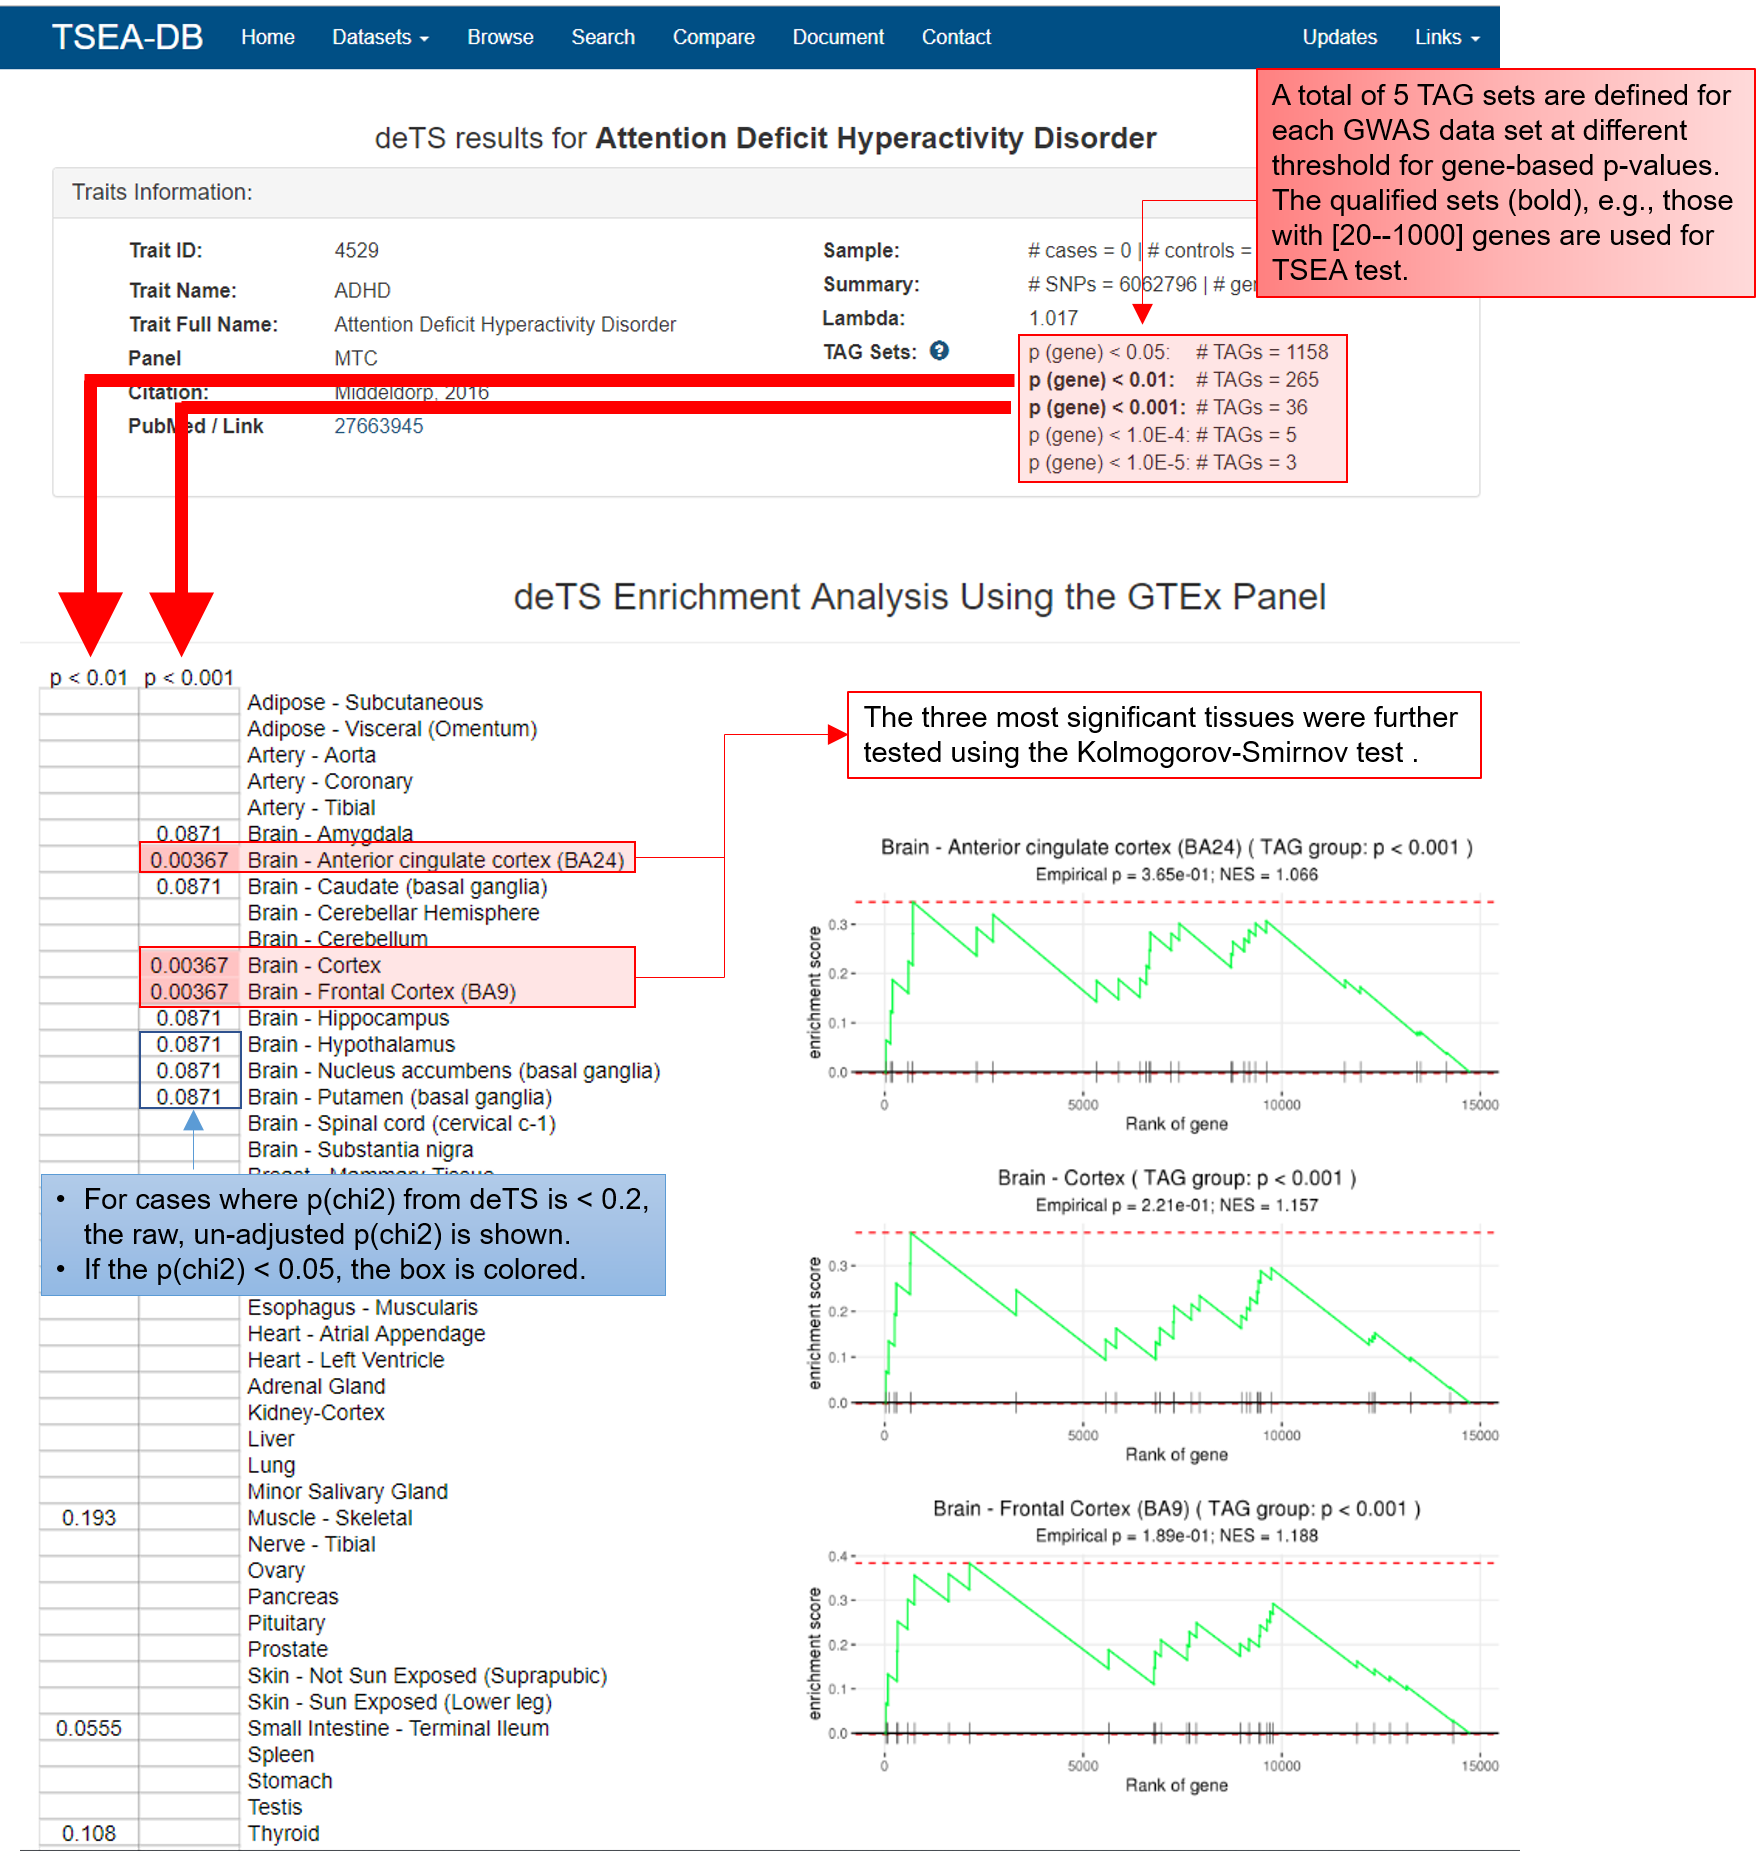
For each trait, we define five trait-associated gene (TAG) sets using different thresholds for the gene-based p-value from Pascal: p < 0.05, p < 0.01, p < 0.001, p < 0.0001, and p < 0.00001. Among them, if a TAG set has more than 1000 genes or less than 20 genes, the set will not be analyzed by deTS. The number of qualified TAG sets is shown in the search result page (see Section 4 below).
Our original deTS package implements the chi-squred test to conduct TSEA. In TSEA-DB, we further applied the Kolmogorov-Smirnov test to validate the top 3 most significantly enriched tissues for each trait.
In the trait page, we label the enrichment p-values for tissues where the p-value is < 0.2 and we use gradiant color to show tissues that are nominally significantly enriched in the TAG sets. Note that all deTS p-values shown in this web-site are the raw p-values before multiple-testing correction. If users would like to use our TSEA results for publication, users can conduct the correction on their own data. (We would also appreciate citation of our resource).
We provide multiple search functions for users to identify traits or tissues of interest. The search function in the home page allows searching of either traits or tissues. The search functions in the Search page allows more complex searching with customization of parameters.
For a user-input query string to search for a trait, we will search both the short names and the full names of traits.
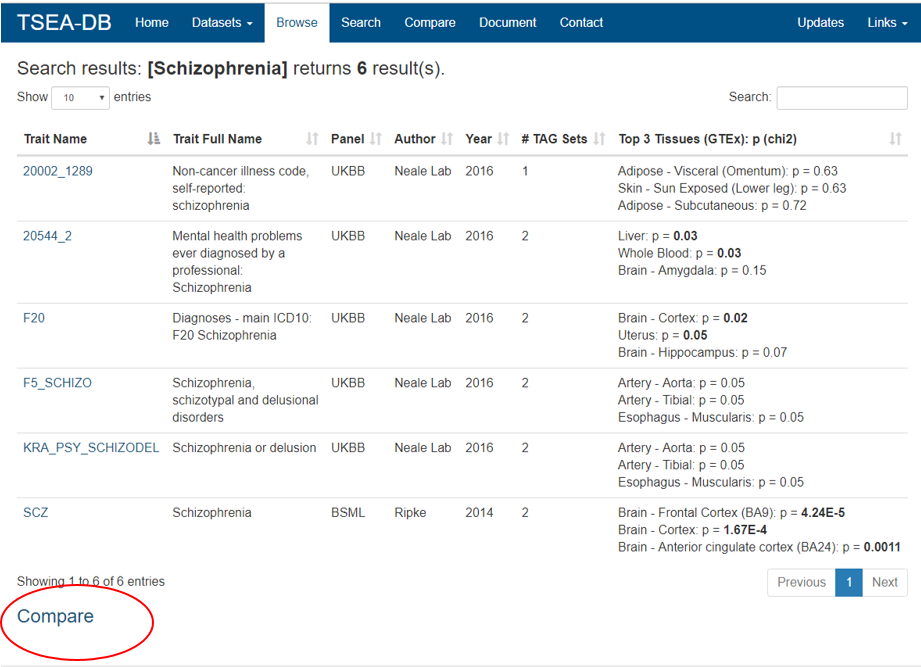
In the result page listing traits, we provide a function to allow users to compare multiple traits. This is particularly important to compare the traits with multiple GWAS data sets.
For a user-input query string to search for a tissue, both the GTEx panel and ENCODE panel will be searched.
Notably, for security issues, we do not allow search using special characters. If you are not sure about the trait name, please just use the part of trait names you know. For traits with a quote in their names, such as [Crohn's disease], please search simply using the keyword [Crohn]. A list of traits with special letters in their names are as below:
Alzheimer's disease
Autism, Asperger's or autistic spectrum disorder
Bell's palsy
Crohn's disease
Father's age at death
Mother's age at death
Hodgkin's disease or non-Hodgkin's disease
Parkinson's disease
Crohn's disease
5. The Compare function
Sometimes, it is informative to compare multiple related traits and their related tissues, such as psychiatric diseases, BMI-related traits, and immune traits, etc. We provide the Compare function for such purposes. There are two pages that users can conduct a compare analysis.
![]() Place 1: the searching result page
Place 1: the searching result page
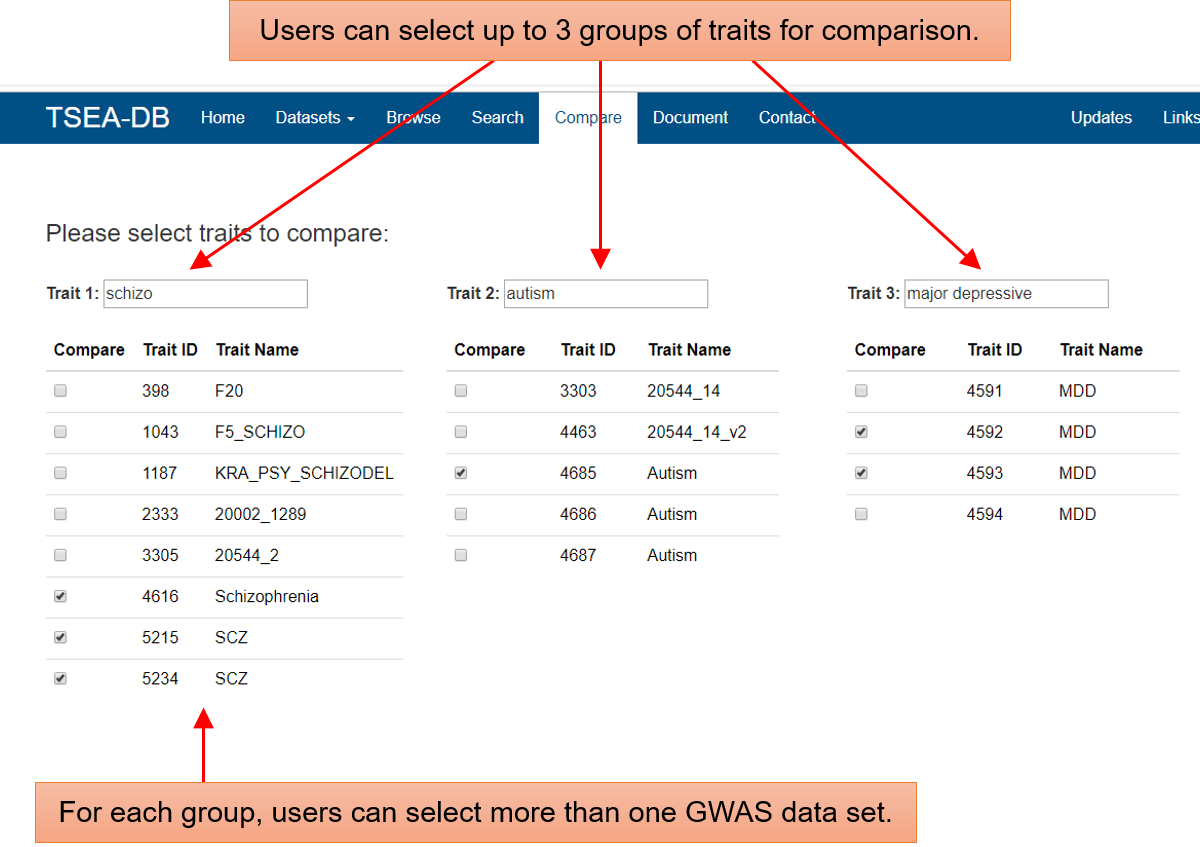
![]() Place 2: the Compare page. In this page, users can select up to three groups of traits. For each group, users can also select multiple traits. To make the deTS results easy to view, we allow at most 10 data sets for the comparison. Note that each data set may have multiple deTS results with different threshold to define TAGs.
Place 2: the Compare page. In this page, users can select up to three groups of traits. For each group, users can also select multiple traits. To make the deTS results easy to view, we allow at most 10 data sets for the comparison. Note that each data set may have multiple deTS results with different threshold to define TAGs.
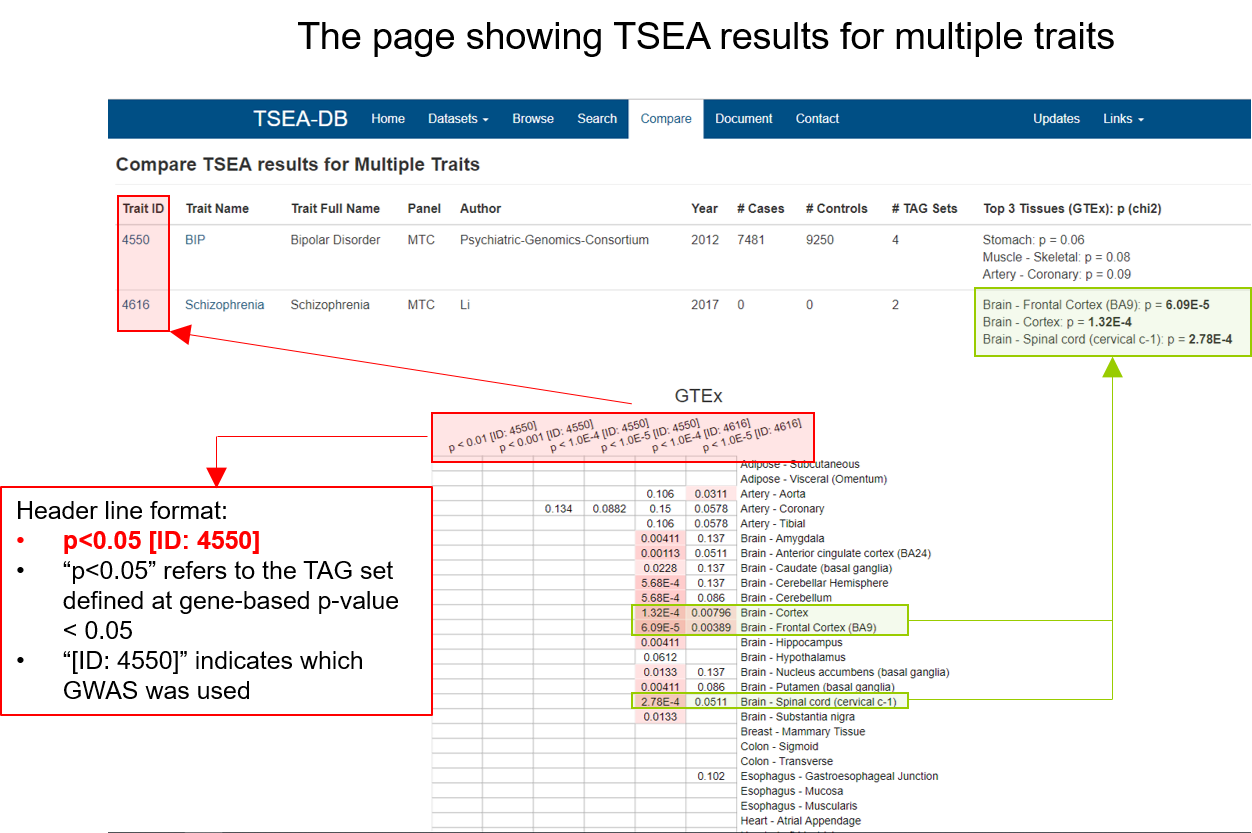
The page showing TSEA results for multiple traits
In this page, we provide five sections.
Trait Information: details of the GWAS data set
Manhattan Plot of all SNPs in the GWAS
Manhattan Plot of all genes in the GWAS
deTS Enrichment Analysis Using the GTEx Panel. The left panel is the output of the deTS R package. The right panel shows validation of the top three most significantly enriched tissues using the Kolmogorov-Smirnov test.
deTS Enrichment Analysis Using the ENCODE Panel. Similar as the GTEx panel.
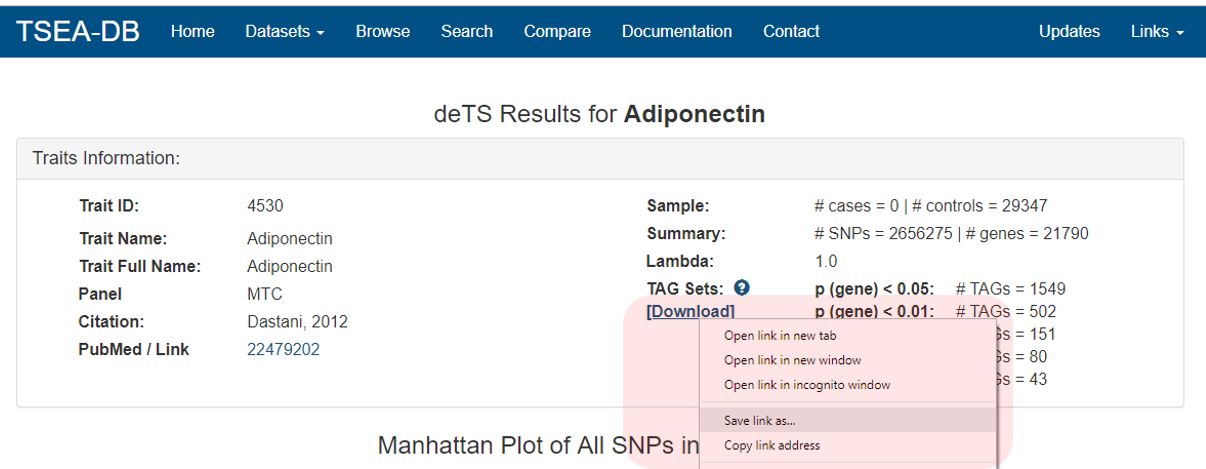
Genes with p-value < 0.05 are available for downloading.
With the downloaded file, users can reproduce the deTS results using the following code.
	### install deTS package
	install.packages("deTS")

	### include the package and data
	library(deTS)
	data(GWAS_gene_multiple)
	data(GTEx_t_score)
	data(ENCODE_z_score)

	### read the downloaded file including trait-associated genes
	dat <- read.delim("/path/to/B1_0.05.txt",as.is=T,header=F)
	head(dat)

	### deTS for one TAG set at gene-based p-value < 0.01
	TAGs <- dat[dat[,2]<0.01,1]

	### GTEx panel top 5% highly expressed genes;
	tsea_GTEx = tsea.analysis(TAGs, GTEx_t_score, ratio = 0.05, p.adjust.method = "none")
	head(tsea_GTEx)
	tsea.plot(tsea_GTEx)

	### Find intersecting genes from a GTEx tissue and a TAG list
	Tissue_idx <- 1
	intersected_gene_GTEx <- intersect(dat_input,rownames(GTEx_t_score[order(GTEx_t_score[,Tissue_idx],decreasing = T),])[1:round(0.05*nrow(GTEx_t_score))])

	### ENCODE panel top 5% highly expressed genes;
	tsea_ENCODE = tsea.analysis(dat_input, ENCODE_z_score, ratio = 0.05, p.adjust.method = "none")
	head(tsea_ENCODE)
	tsea.plot(tsea_ENCODE)

	### Find intersecting genes from an ENCODE tissue and a TAG list
	Tissue_idx <- 2
	intersected_gene_ENCODE <- intersect(dat_input,rownames(ENCODE_z_score[order(ENCODE_z_score[,Tissue_idx],decreasing = T),])[1:round(0.05*nrow(ENCODE_z_score))])
8. Resources
The Multi-Trait Collection traits: http://locuscompare.com/ and GitHub
UK Biobank traits: http://www.nealelab.is/uk-biobank
deTS: Pei G., Dai Y., Zhao Z., Jia P. (2019) deTS: Tissue-Specific Enrichment Analysis to decode tissue specificity. Bioinformatics, btz138 GitHub PubMed