deTS Results for Malignant neoplasm of testis

Traits Information:

Trait ID:

976

C3_TESTIS
Malignant neoplasm of testis
UK Biobank (UKBB)
Neale Lab, 2018
N/A
# cases = 432 | # controls = 360762
# SNPs = 7904418 | # genes = 21889
1.03
p (gene) < 0.05:  # TAGs = 1284
p (gene) < 0.01:  # TAGs = 296
p (gene) < 0.001:  # TAGs = 64
p (gene) < 1.0E-4:  # TAGs = 21
p (gene) < 1.0E-5: # TAGs = 4

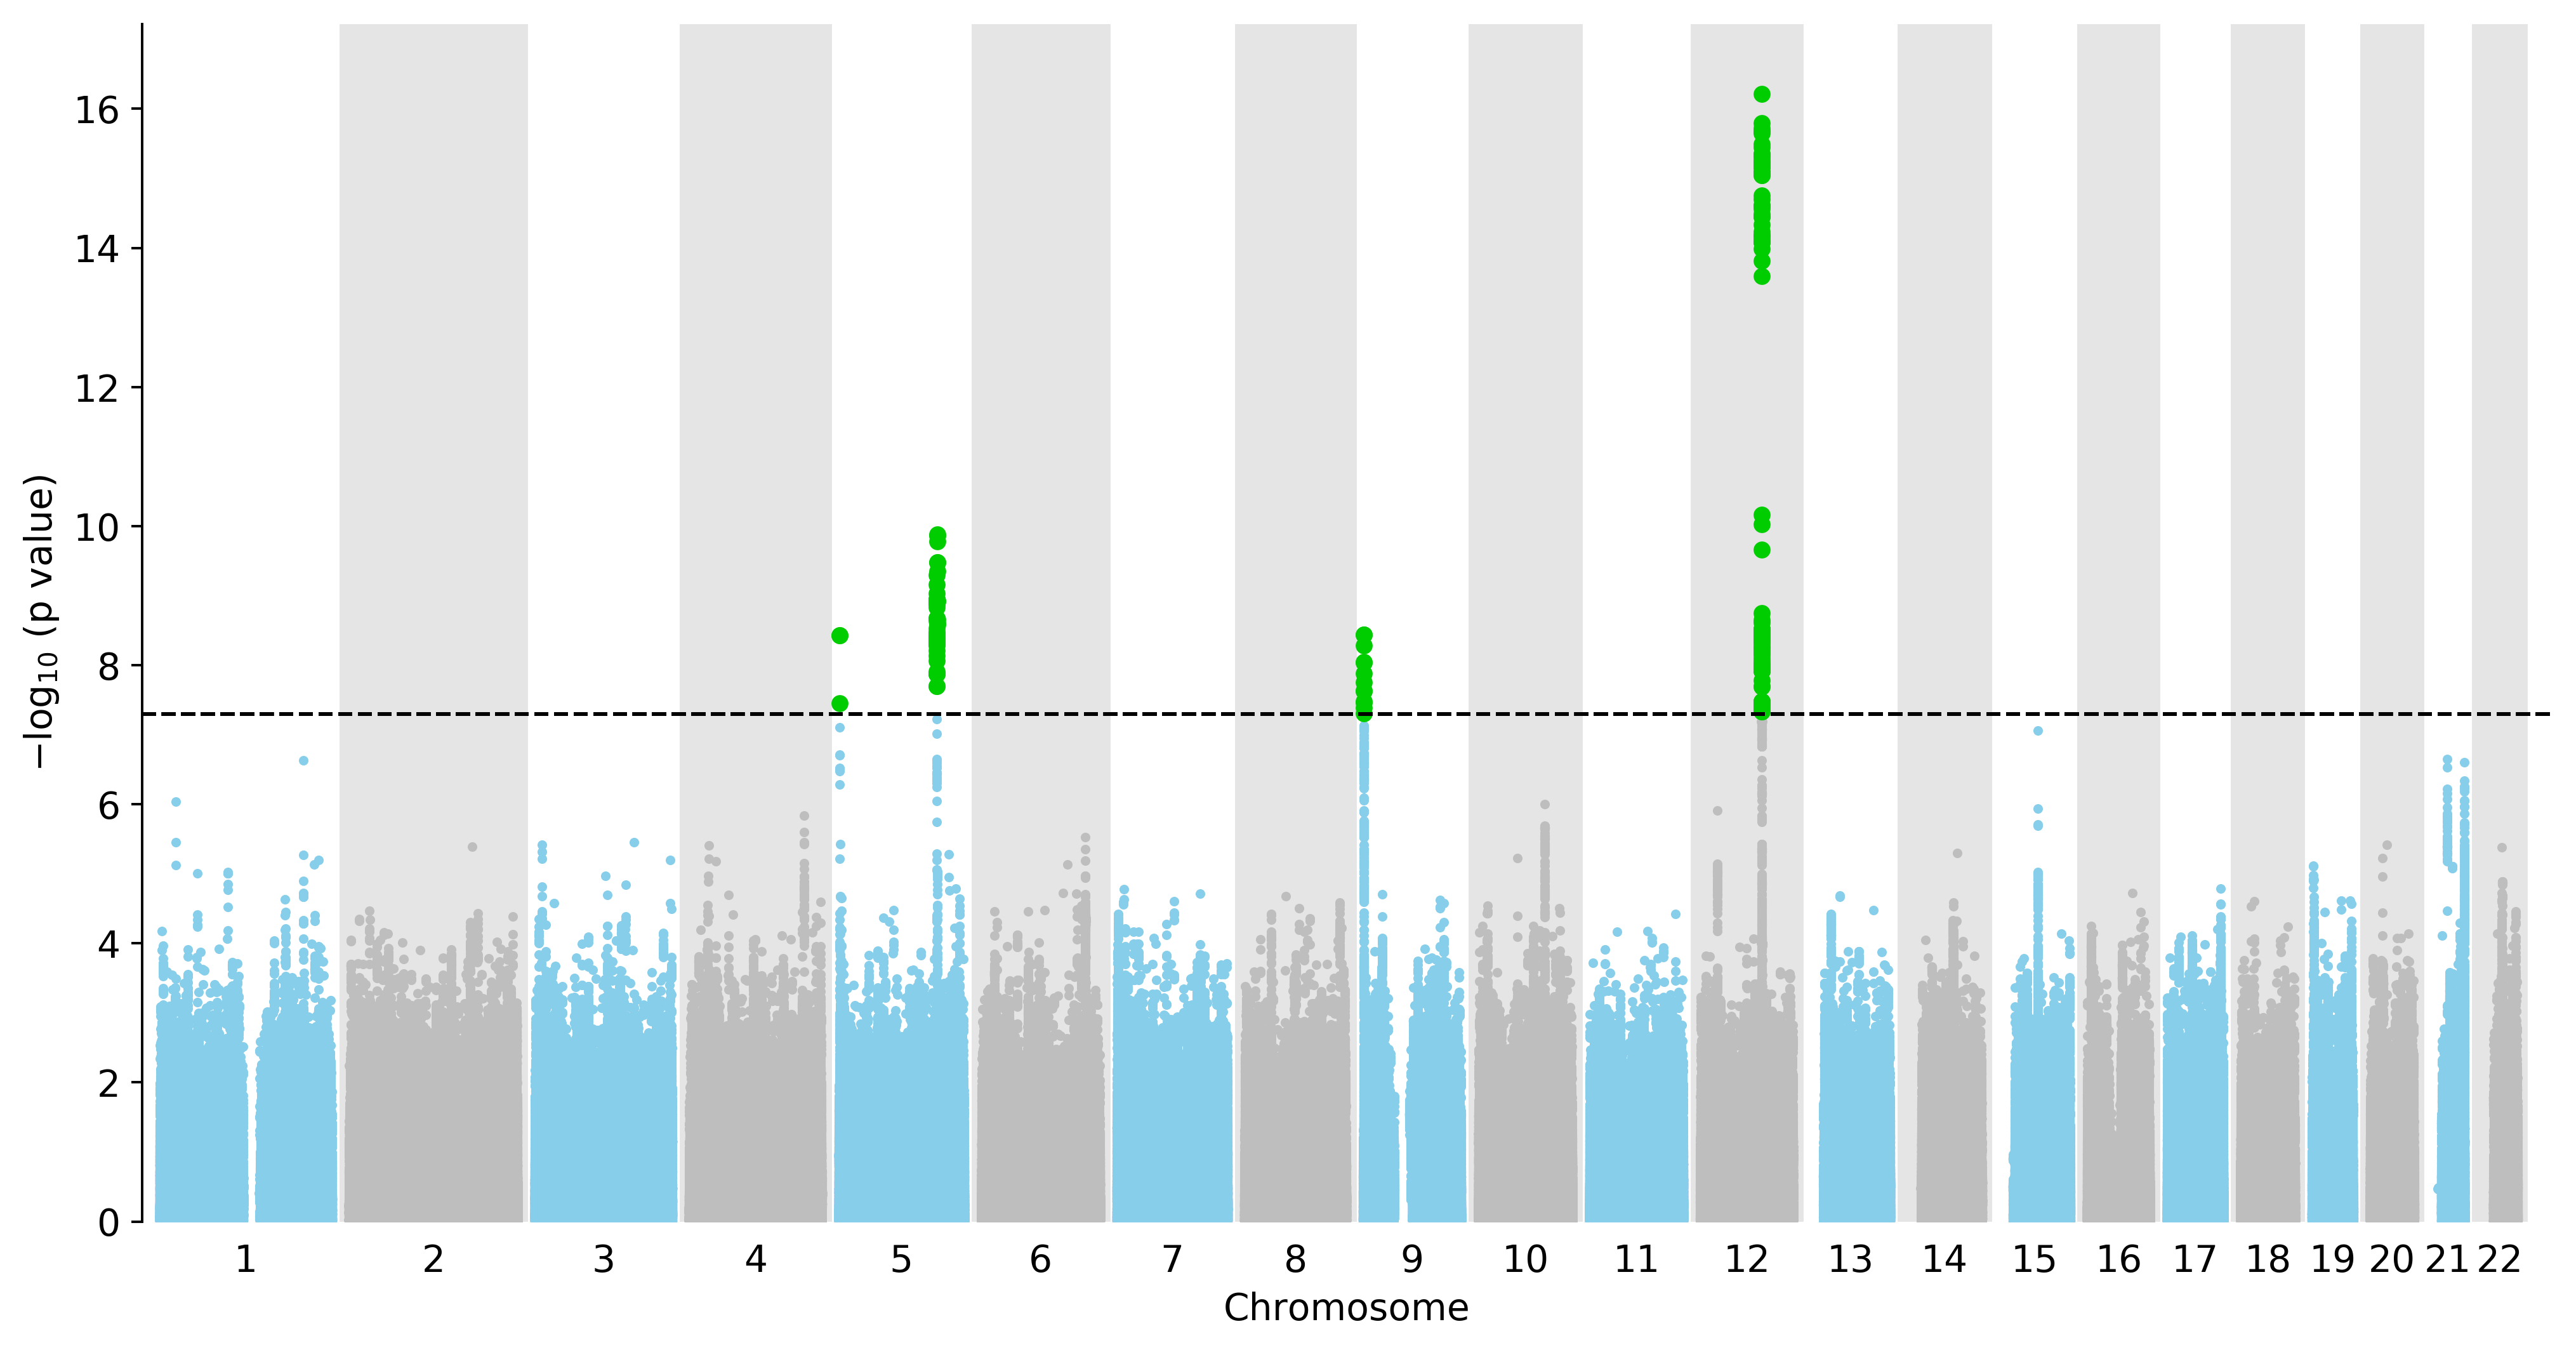
Manhattan Plot of All SNPs in the GWAS


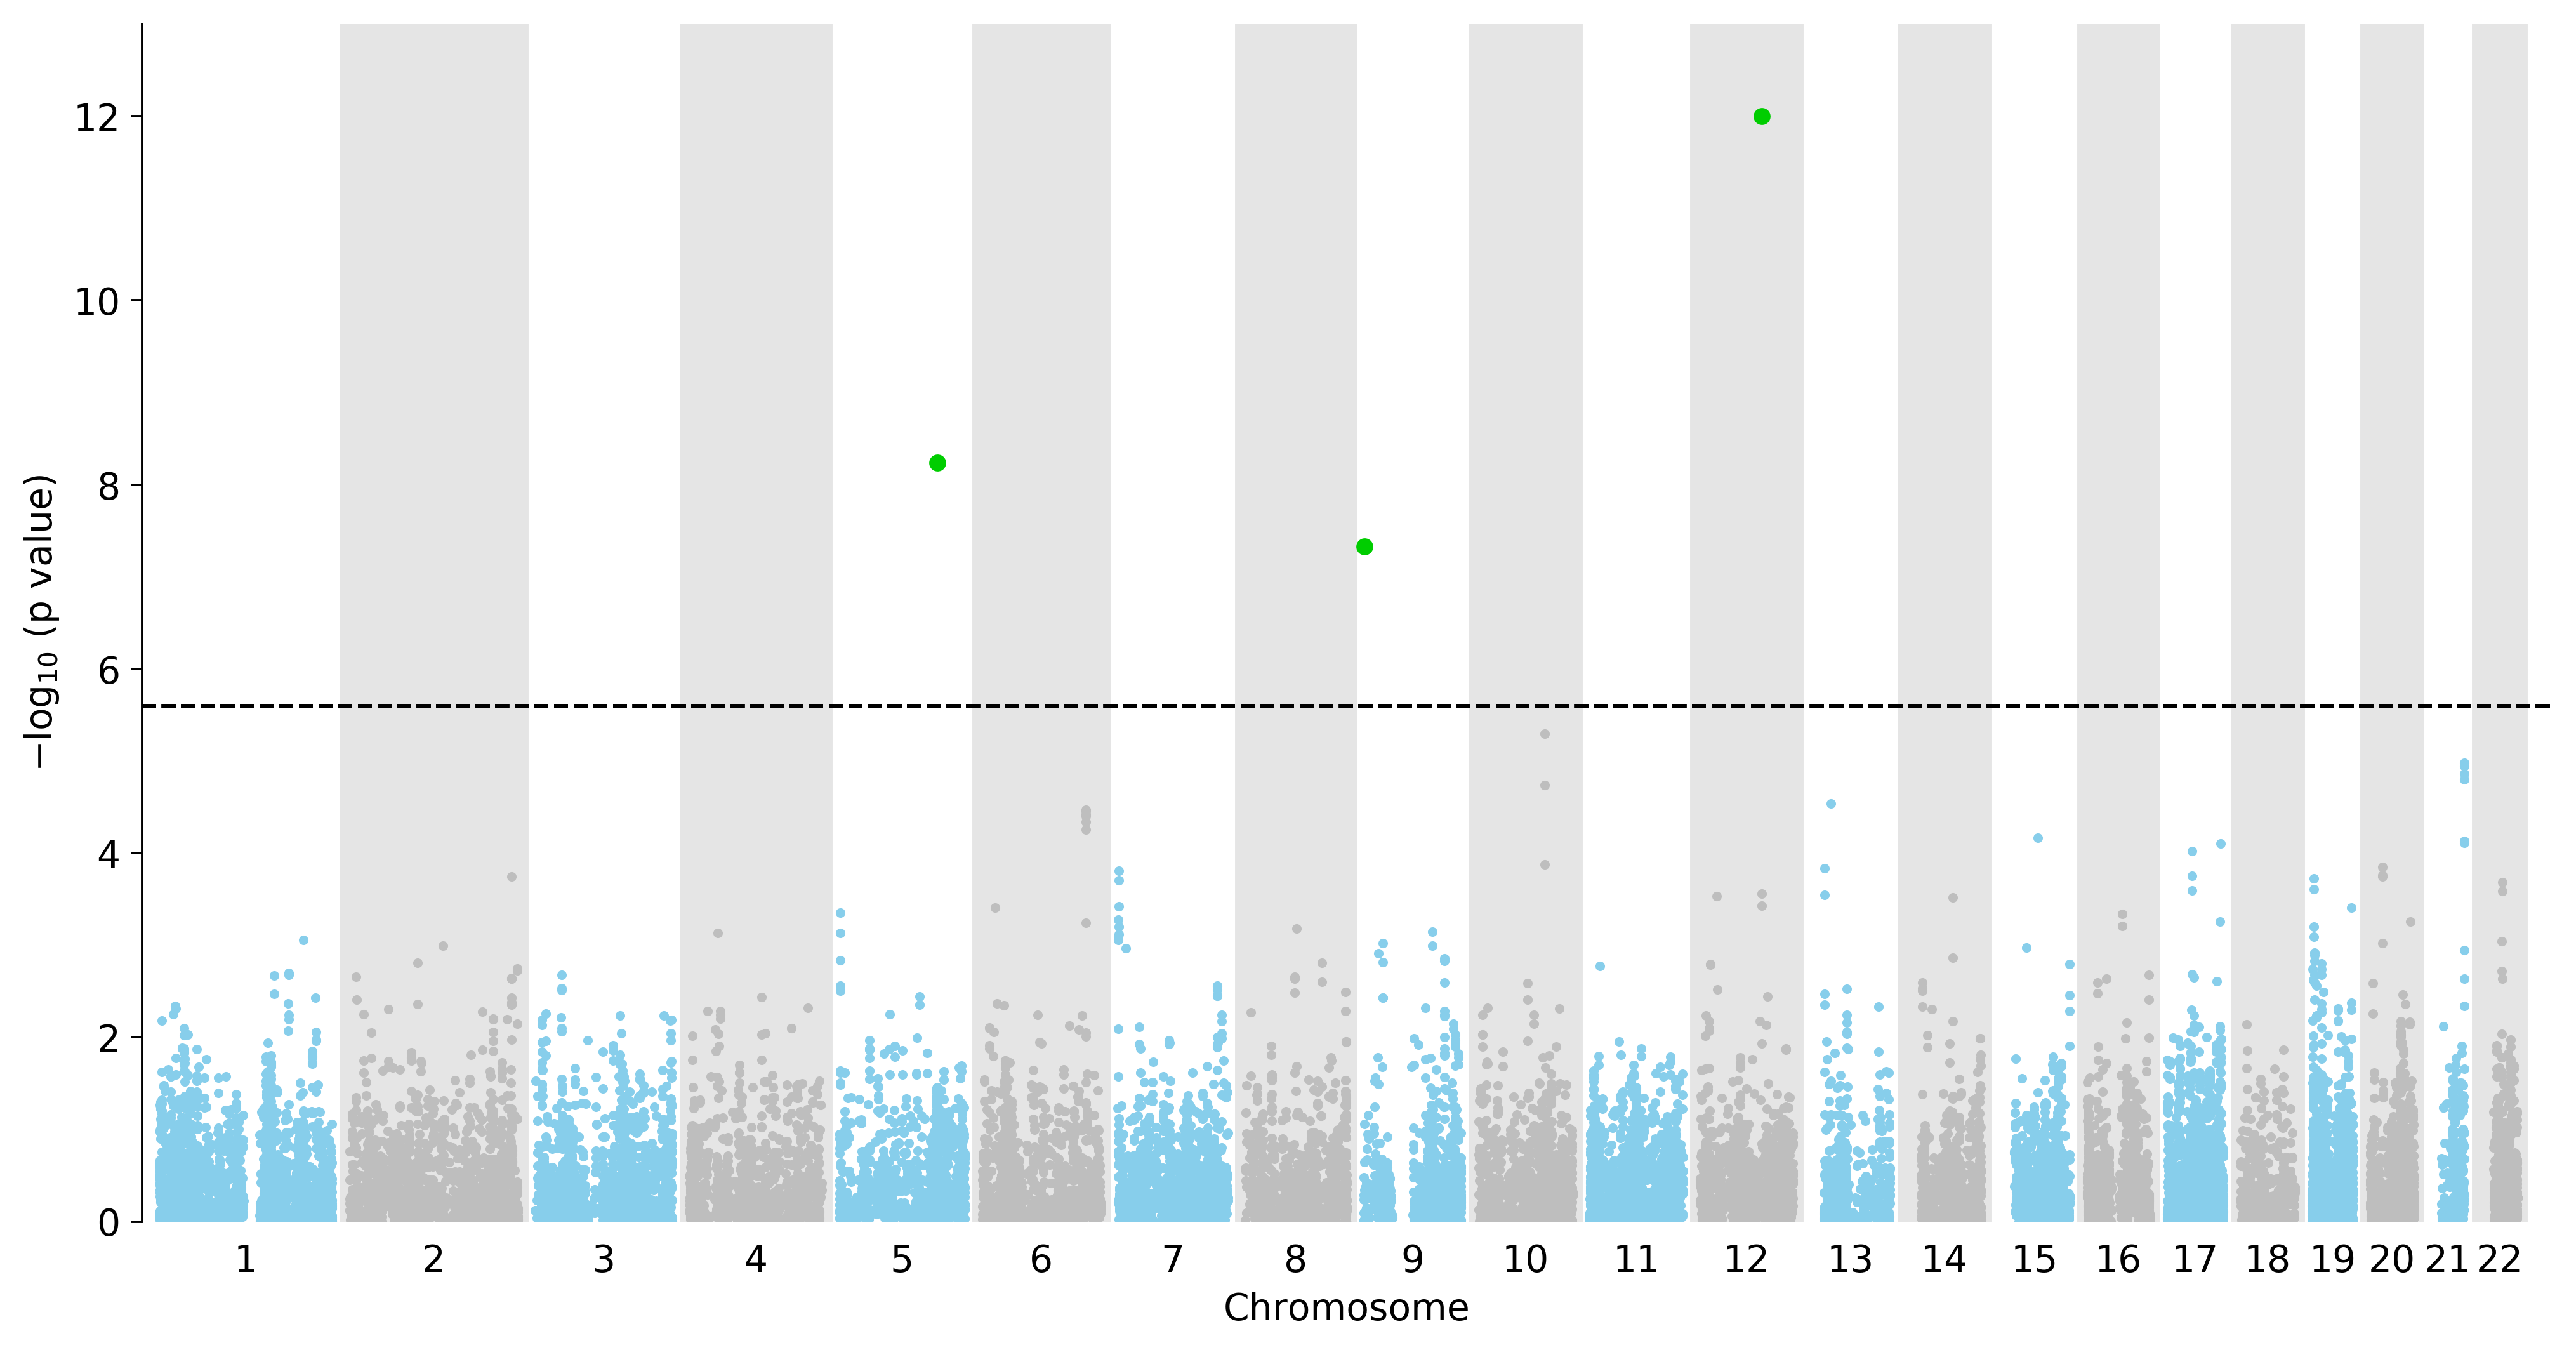
Manhattan Plot of All Genes in the GWAS


Image not ready !

deTS Enrichment Analysis Using the GTEx Panel


p < 0.05 p < 0.01 p < 0.001 p < 1.0E-4 0.7670.2760.6520.5890.3940.7670.5890.8160.9450.9750.7120.8160.7670.9230.8160.8940.3330.7670.5230.3940.110.03220.4580.180.7670.9840.9970.8160.110.4580.3940.2760.4580.3940.7120.06170.06170.7120.2760.3940.2230.3330.9230.180.7120.2250.180.4930.6260.3650.6260.6260.9230.750.9660.9880.9970.9660.9230.9230.9880.9660.9230.750.9230.6260.8510.4930.4930.2530.6260.4930.9230.9880.750.3650.9230.6260.3650.2530.2530.6260.1650.750.3650.4930.3650.3630.2530.6260.1650.9230.1650.2530.6150.6150.3370.1470.05220.8780.8781.01.01.00.8781.00.8781.01.01.00.6150.8780.3370.6150.6150.6150.3370.6150.1470.6150.8781.00.8780.8780.3370.3370.8780.6150.6150.8780.3370.3370.6150.6150.6140.1470.3370.6150.6150.3370.8781.00.4870.4870.4870.4871.01.01.01.01.01.01.01.01.01.01.01.01.01.00.4870.4870.4871.00.4871.01.01.01.01.00.4870.1351.00.4871.00.4871.00.1350.4871.01.01.00.4870.4870.4870.4871.01.0Adipose - SubcutaneousAdipose - Visceral (Omentum)Artery - AortaArtery - CoronaryArtery - TibialBrain - AmygdalaBrain - Anterior cingulate cortex (BA24)Brain - Caudate (basal ganglia)Brain - Cerebellar HemisphereBrain - CerebellumBrain - CortexBrain - Frontal Cortex (BA9)Brain - HippocampusBrain - HypothalamusBrain - Nucleus accumbens (basal ganglia)Brain - Putamen (basal ganglia)Brain - Spinal cord (cervical c-1)Brain - Substantia nigraBreast - Mammary TissueColon - SigmoidColon - TransverseEsophagus - Gastroesophageal JunctionEsophagus - MucosaEsophagus - MuscularisStomachHeart - Atrial AppendageHeart - Left VentricleAdrenal GlandKidney-CortexLiverLungMinor Salivary GlandMuscle - SkeletalNerve - TibialOvaryPancreasPituitaryProstateSkin - Not Sun Exposed (Suprapubic)Skin - Sun Exposed (Lower leg)Small Intestine - Terminal IleumSpleenTestisThyroidUterusVaginaWhole Blood

Download the Displayed SVG for the GTEx Panel


deTS Enrichment Analysis Using the ENCODE Panel


p < 0.05 p < 0.01 p < 0.001 p < 1.0E-4 0.5520.08770.08930.4850.08930.7930.002890.4810.01620.1940.4850.5520.9090.740.4190.1940.6180.6180.9990.9960.9710.4770.4850.4810.8380.840.1180.7930.7930.6810.8350.740.740.8380.4810.4150.2420.6810.2420.9370.2960.5520.5520.7930.8290.4540.4550.9590.2230.9990.220.8280.3280.9090.3290.720.9590.8290.8290.1410.4550.3290.9590.8290.9590.9080.2230.8280.8280.8290.08410.8290.3290.08410.7170.4550.4550.7180.5890.2220.3290.4550.720.9090.1410.5910.8290.8290.8770.1450.3351.00.8770.8770.6110.8770.8770.8770.3350.6131.00.1460.6130.3350.6130.3350.8770.3350.8771.00.3350.8770.8770.6130.6130.8770.8770.05160.6110.3350.8770.3340.3340.6120.3351.00.8770.6130.3351.00.8770.05160.4860.02410.4861.01.01.01.01.01.00.4861.01.01.00.4861.01.00.4861.01.01.01.01.00.4861.00.4850.4860.4861.00.4860.4861.00.02421.01.00.4851.01.01.01.00.4860.1351.01.00.0242Subcutaneous Adipose TissueOmental Fat PadThoracic AortaCerebellumFrontal CortexSpinal CordOccipital LobeParietal LobeTemporal LobeDiencephalonBreast EpitheliumCamera type eyeSigmoid ColonTransverse ColonEsophagus Muscularis MucosaEsophagus Squamous EpitheliumGastroesophageal SphincterStomachHeartHeart - Left VentricleRight Atrium Auricular RegionAdrenal GlandMetanephrosLiverRight Lobe of LiverLungUpper Lobe of Left LungSkeletal Muscle TissueGastrocnemius MedialisTongueTibial NerveOvaryBody of PancreasPeyer's PatchProstate GlandSuprapubic SkinLower Leg SkinSkin of BodySpleenTestisThyroid GlandUmbilical CordUrinary BladderUterus

Download the Displayed SVG for the ENCODE Panel