|
||||||||||||||||||||||||||||||||||||||||||||||||||||||||||||||||||||||||||||||||||||||||||||||||||||||||||||||||||||||||||||||||||||||||||||||||||||||||||||||||||||||||||||||||||||||||||||||||||||||||||||||||||||||||||||||||||||||||||||||||||||||||||||||||||||||||||||||||||||||||||||||||||||||||||||||||||||||||||
| |
| Phenotypic Information (metabolism pathway, cancer, disease, phenome) |
| |
| |
| Gene-Gene Network Information: Co-Expression Network, Interacting Genes & KEGG |
| |
|


| Gene Summary for GPC6 |
| Basic gene info. | Gene symbol | GPC6 |
| Gene name | glypican 6 | |
| Synonyms | OMIMD1 | |
| Cytomap | UCSC genome browser: 13q32 | |
| Genomic location | chr13 :93879077-95060273 | |
| Type of gene | protein-coding | |
| RefGenes | NM_005708.3, | |
| Ensembl id | ENSG00000183098 | |
| Description | glypican proteoglycan 6glypican-6 | |
| Modification date | 20141207 | |
| dbXrefs | MIM : 604404 | |
| HGNC : HGNC | ||
| Ensembl : ENSG00000183098 | ||
| HPRD : 05099 | ||
| Vega : OTTHUMG00000017205 | ||
| Protein | UniProt: Q9Y625 go to UniProt's Cross Reference DB Table | |
| Expression | CleanEX: HS_GPC6 | |
| BioGPS: 10082 | ||
| Gene Expression Atlas: ENSG00000183098 | ||
| The Human Protein Atlas: ENSG00000183098 | ||
| Pathway | NCI Pathway Interaction Database: GPC6 | |
| KEGG: GPC6 | ||
| REACTOME: GPC6 | ||
| ConsensusPathDB | ||
| Pathway Commons: GPC6 | ||
| Metabolism | MetaCyc: GPC6 | |
| HUMANCyc: GPC6 | ||
| Regulation | Ensembl's Regulation: ENSG00000183098 | |
| miRBase: chr13 :93,879,077-95,060,273 | ||
| TargetScan: NM_005708 | ||
| cisRED: ENSG00000183098 | ||
| Context | iHOP: GPC6 | |
| cancer metabolism search in PubMed: GPC6 | ||
| UCL Cancer Institute: GPC6 | ||
| Assigned class in ccmGDB | B - This gene belongs to cancer gene. | |
| Top |
| Phenotypic Information for GPC6(metabolism pathway, cancer, disease, phenome) |
| Cancer | CGAP: GPC6 |
| Familial Cancer Database: GPC6 | |
| * This gene is included in those cancer gene databases. |
|
|
|
|
|
| . | ||||||||||||||||||||||||||||||||||||||||||||||||||||||||||||||||||||||||||||||||||||||||||||||||||||||||||||||||||||||||||||||||||||||||||||||||||||||||||||||||||||||||||||||||||||||||||||||||||||||||||||||||||||||||||||||||||||||||||||||||||||||||||||||||||||||||||||||||||||||||||||||||||||||||||||||||||||
Oncogene 1 | Significant driver gene in COAD 6, | |||||||||||||||||||||||||||||||||||||||||||||||||||||||||||||||||||||||||||||||||||||||||||||||||||||||||||||||||||||||||||||||||||||||||||||||||||||||||||||||||||||||||||||||||||||||||||||||||||||||||||||||||||||||||||||||||||||||||||||||||||||||||||||||||||||||||||||||||||||||||||||||||||||||||||||||||||||||||
| cf) number; DB name 1 Oncogene; http://nar.oxfordjournals.org/content/35/suppl_1/D721.long, 2 Tumor Suppressor gene; https://bioinfo.uth.edu/TSGene/, 3 Cancer Gene Census; http://www.nature.com/nrc/journal/v4/n3/abs/nrc1299.html, 4 CancerGenes; http://nar.oxfordjournals.org/content/35/suppl_1/D721.long, 5 Network of Cancer Gene; http://ncg.kcl.ac.uk/index.php, 6 http://www.nature.com/nature/journal/v487/n7407/full/nature11252.html, 7Therapeutic Vulnerabilities in Cancer; http://cbio.mskcc.org/cancergenomics/statius/ |
| REACTOME_METABOLISM_OF_CARBOHYDRATES | |
| OMIM | 258315; phenotype. 604404; gene. |
| Orphanet | 93329; Autosomal recessive omodysplasia. |
| Disease | KEGG Disease: GPC6 |
| MedGen: GPC6 (Human Medical Genetics with Condition) | |
| ClinVar: GPC6 | |
| Phenotype | MGI: GPC6 (International Mouse Phenotyping Consortium) |
| PhenomicDB: GPC6 | |
| Mutations for GPC6 |
| * Under tables are showing count per each tissue to give us broad intuition about tissue specific mutation patterns.You can go to the detailed page for each mutation database's web site. |
| - Statistics for Tissue and Mutation type | Top |
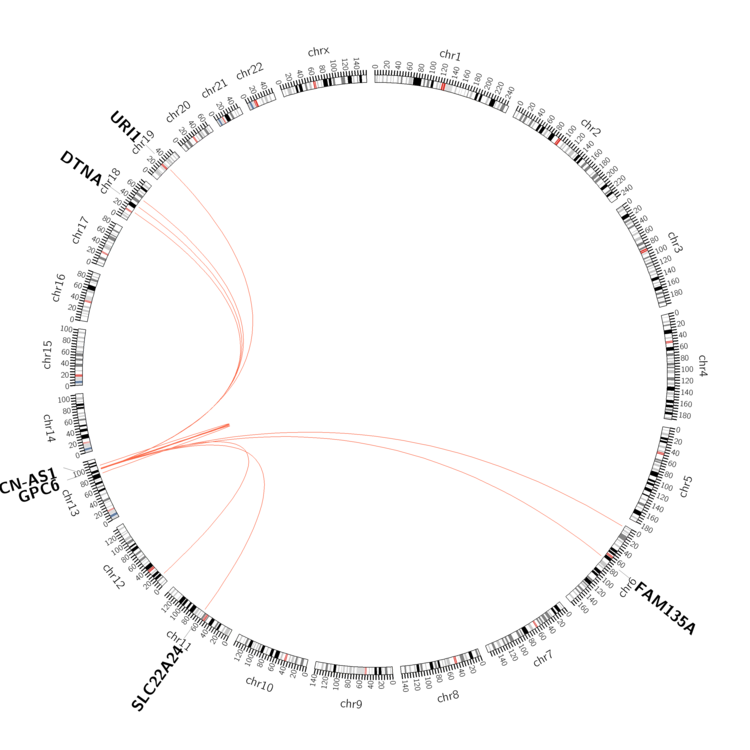 |
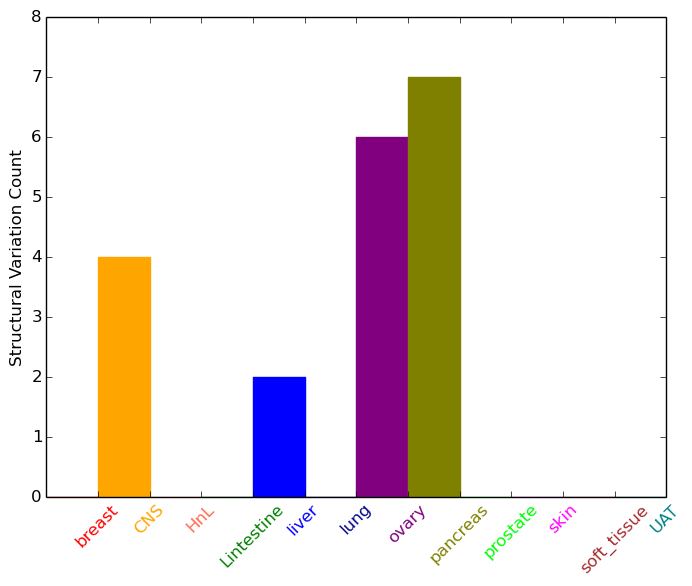
| - For Inter-chromosomal Variations |
| * Inter-chromosomal variantions includes 'interchromosomal amplicon to amplicon', 'interchromosomal amplicon to non-amplified dna', 'interchromosomal insertion', 'Interchromosomal unknown type'. |
 |
| - For Intra-chromosomal Variations |
| * Intra-chromosomal variantions includes 'intrachromosomal amplicon to amplicon', 'intrachromosomal amplicon to non-amplified dna', 'intrachromosomal deletion', 'intrachromosomal fold-back inversion', 'intrachromosomal inversion', 'intrachromosomal tandem duplication', 'Intrachromosomal unknown type', 'intrachromosomal with inverted orientation', 'intrachromosomal with non-inverted orientation'. |
 |
| Sample | Symbol_a | Chr_a | Start_a | End_a | Symbol_b | Chr_b | Start_b | End_b |
| central_nervous_system | GPC6 | chr13 | 94381774 | 94381774 | chr13 | 95594630 | 95594630 | |
| central_nervous_system | GPC6 | chr13 | 94408699 | 94408699 | GPC6 | chr13 | 94390607 | 94390607 |
| central_nervous_system | GPC6 | chr13 | 94573933 | 94573933 | chr18 | 47294416 | 47294416 | |
| central_nervous_system | GPC6 | chr13 | 94574042 | 94574042 | chr13 | 86113075 | 86113075 | |
| central_nervous_system | GPC6 | chr13 | 94607709 | 94607709 | chr18 | 19618267 | 19618267 | |
| central_nervous_system | GPC6 | chr13 | 94627765 | 94627765 | GPC6 | chr13 | 94627846 | 94627846 |
| haematopoietic_and_lymphoid_tissue | GPC6 | chr13 | 93923121 | 93923121 | FAM135A | chr6 | 71153727 | 71153727 |
| liver | GPC6 | chr13 | 94831079 | 94831079 | GPC6 | chr13 | 95018687 | 95018687 |
| liver | GPC6 | chr13 | 94992596 | 94992596 | GPC6 | chr13 | 95015494 | 95015494 |
| ovary | GPC6 | chr13 | 93936401 | 93936421 | GPC6 | chr13 | 93931351 | 93931371 |
| ovary | GPC6 | chr13 | 94118552 | 94118572 | URI1 | chr19 | 30477724 | 30477744 |
| ovary | GPC6 | chr13 | 94249183 | 94249203 | GPC6 | chr13 | 94225687 | 94225707 |
| ovary | GPC6 | chr13 | 94441649 | 94441669 | NALCN-AS1 | chr13 | 101383200 | 101383220 |
| ovary | GPC6 | chr13 | 94481397 | 94481417 | GPC6 | chr13 | 94645559 | 94645579 |
| ovary | GPC6 | chr13 | 94599593 | 94599613 | GPC6 | chr13 | 94599670 | 94599690 |
| ovary | GPC6 | chr13 | 94880485 | 94880505 | GPC6 | chr13 | 94967935 | 94967955 |
| pancreas | GPC6 | chr13 | 93973177 | 93973197 | GPC6 | chr13 | 94108599 | 94108619 |
| pancreas | GPC6 | chr13 | 94028065 | 94028085 | chr13 | 93871060 | 93871080 | |
| pancreas | GPC6 | chr13 | 94077292 | 94077312 | GPC6 | chr13 | 94356888 | 94356908 |
| pancreas | GPC6 | chr13 | 94139789 | 94139809 | GPC6 | chr13 | 94086051 | 94086071 |
| pancreas | GPC6 | chr13 | 94796790 | 94796810 | GPC6 | chr13 | 94878181 | 94878201 |
| pancreas | GPC6 | chr13 | 94925966 | 94925986 | GPC6 | chr13 | 94968355 | 94968375 |
| pancreas | GPC6 | chr13 | 95055440 | 95055460 | chr13 | 95060508 | 95060528 |
| cf) Tissue number; Tissue name (1;Breast, 2;Central_nervous_system, 3;Haematopoietic_and_lymphoid_tissue, 4;Large_intestine, 5;Liver, 6;Lung, 7;Ovary, 8;Pancreas, 9;Prostate, 10;Skin, 11;Soft_tissue, 12;Upper_aerodigestive_tract) |
| * From mRNA Sanger sequences, Chitars2.0 arranged chimeric transcripts. This table shows GPC6 related fusion information. |
| ID | Head Gene | Tail Gene | Accession | Gene_a | qStart_a | qEnd_a | Chromosome_a | tStart_a | tEnd_a | Gene_a | qStart_a | qEnd_a | Chromosome_a | tStart_a | tEnd_a |
| BF669457 | GPC6 | 1 | 373 | 13 | 94254769 | 94255143 | GPC6 | 373 | 642 | 13 | 94250660 | 94250938 | |
| DA568128 | GPC6 | 1 | 336 | 13 | 93926960 | 93927295 | GPC6 | 328 | 816 | 13 | 93906462 | 93906949 | |
| BF155598 | GPC6 | 38 | 118 | 13 | 94444959 | 94445040 | MPHOSPH8 | 114 | 224 | 13 | 20221321 | 20221432 | |
| Top |
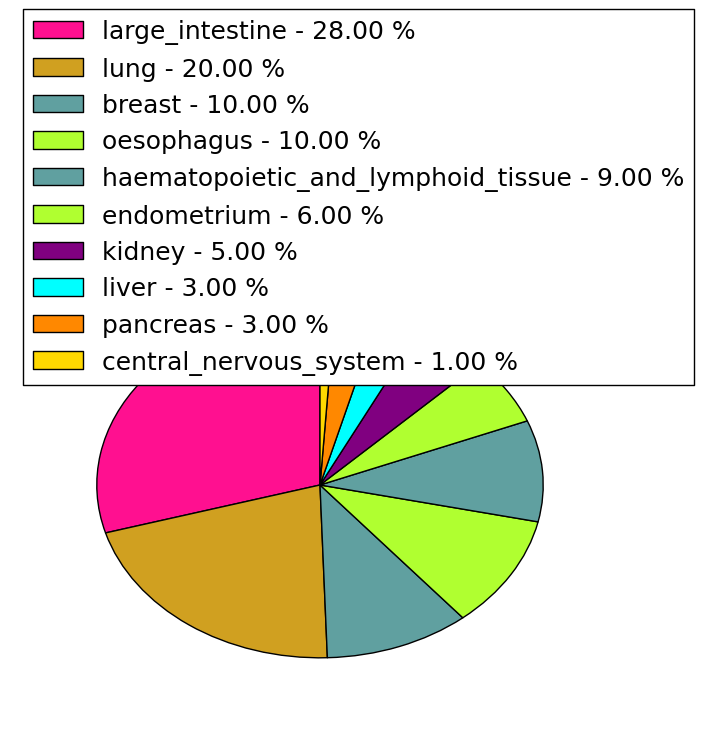
| Mutation type/ Tissue ID | brca | cns | cerv | endome | haematopo | kidn | Lintest | liver | lung | ns | ovary | pancre | prost | skin | stoma | thyro | urina | |||
| Total # sample | 12 | 4 | 1 | 3 | 2 | 1 | 22 | 11 | 11 | 1 | 5 | 1 | 2 | 4 | ||||||
| GAIN (# sample) | 5 | 2 | 1 | 20 | 6 | 4 | 1 | 3 | 1 | 3 | ||||||||||
| LOSS (# sample) | 7 | 4 | 1 | 1 | 1 | 1 | 2 | 5 | 7 | 2 | 2 | 1 |
| cf) Tissue ID; Tissue type (1; Breast, 2; Central_nervous_system, 3; Cervix, 4; Endometrium, 5; Haematopoietic_and_lymphoid_tissue, 6; Kidney, 7; Large_intestine, 8; Liver, 9; Lung, 10; NS, 11; Ovary, 12; Pancreas, 13; Prostate, 14; Skin, 15; Stomach, 16; Thyroid, 17; Urinary_tract) |
| Top |
|
 |
| Top |
| Stat. for Non-Synonymous SNVs (# total SNVs=77) | (# total SNVs=22) |
 |  |
(# total SNVs=0) | (# total SNVs=0) |
| Top |
| * When you move the cursor on each content, you can see more deailed mutation information on the Tooltip. Those are primary_site,primary_histology,mutation(aa),pubmedID. |
| GRCh37 position | Mutation(aa) | Unique sampleID count |
| chr13:94197638-94197638 | p.R95S | 4 |
| chr13:94482727-94482727 | p.A214T | 3 |
| chr13:93879767-93879767 | p.P20T | 2 |
| chr13:94482562-94482562 | p.E159K | 2 |
| chr13:94679992-94679992 | p.T241A | 2 |
| chr13:95050858-95050858 | p.N476N | 2 |
| chr13:94197591-94197591 | p.S79N | 2 |
| chr13:94482577-94482577 | p.F164L | 2 |
| chr13:94482694-94482694 | p.V203M | 2 |
| chr13:93879803-93879803 | p.E32K | 2 |
| Top |
|
 |
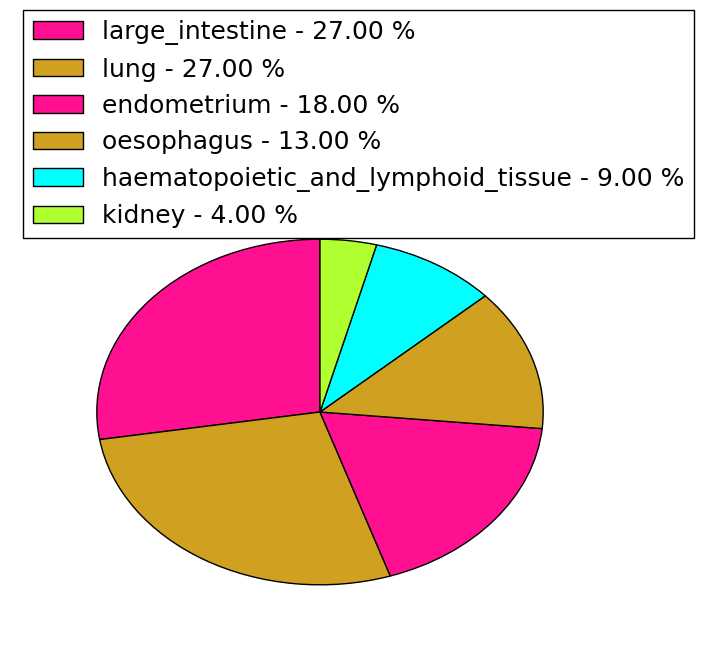
| Point Mutation/ Tissue ID | 1 | 2 | 3 | 4 | 5 | 6 | 7 | 8 | 9 | 10 | 11 | 12 | 13 | 14 | 15 | 16 | 17 | 18 | 19 | 20 |
| # sample | 4 | 4 | 18 | 1 | 3 | 2 | 1 | 14 | 2 | 1 | 1 | 12 | 13 | 1 | 8 | |||||
| # mutation | 4 | 4 | 17 | 1 | 3 | 2 | 1 | 14 | 2 | 1 | 1 | 12 | 14 | 1 | 9 | |||||
| nonsynonymous SNV | 4 | 4 | 15 | 1 | 2 | 1 | 1 | 10 | 2 | 1 | 1 | 7 | 13 | 1 | 5 | |||||
| synonymous SNV | 2 | 1 | 1 | 4 | 5 | 1 | 4 |
| cf) Tissue ID; Tissue type (1; BLCA[Bladder Urothelial Carcinoma], 2; BRCA[Breast invasive carcinoma], 3; CESC[Cervical squamous cell carcinoma and endocervical adenocarcinoma], 4; COAD[Colon adenocarcinoma], 5; GBM[Glioblastoma multiforme], 6; Glioma Low Grade, 7; HNSC[Head and Neck squamous cell carcinoma], 8; KICH[Kidney Chromophobe], 9; KIRC[Kidney renal clear cell carcinoma], 10; KIRP[Kidney renal papillary cell carcinoma], 11; LAML[Acute Myeloid Leukemia], 12; LUAD[Lung adenocarcinoma], 13; LUSC[Lung squamous cell carcinoma], 14; OV[Ovarian serous cystadenocarcinoma ], 15; PAAD[Pancreatic adenocarcinoma], 16; PRAD[Prostate adenocarcinoma], 17; SKCM[Skin Cutaneous Melanoma], 18:STAD[Stomach adenocarcinoma], 19:THCA[Thyroid carcinoma], 20:UCEC[Uterine Corpus Endometrial Carcinoma]) |
| Top |
| * We represented just top 10 SNVs. When you move the cursor on each content, you can see more deailed mutation information on the Tooltip. Those are primary_site, primary_histology, mutation(aa), pubmedID. |
| Genomic Position | Mutation(aa) | Unique sampleID count |
| chr13:94482724 | p.A377E | 2 |
| chr13:93879740 | p.V203M | 2 |
| chr13:94482727 | p.S79N | 2 |
| chr13:94482577 | p.R95C | 2 |
| chr13:94197591 | p.R213S | 2 |
| chr13:94958355 | p.P11S | 2 |
| chr13:94197638 | p.A214T | 2 |
| chr13:94482694 | p.F164I | 2 |
| chr13:94482698 | p.E32K | 1 |
| chr13:95034756 | p.R171R | 1 |
| * Copy number data were extracted from TCGA using R package TCGA-Assembler. The URLs of all public data files on TCGA DCC data server were gathered on Jan-05-2015. Function ProcessCNAData in TCGA-Assembler package was used to obtain gene-level copy number value which is calculated as the average copy number of the genomic region of a gene. |
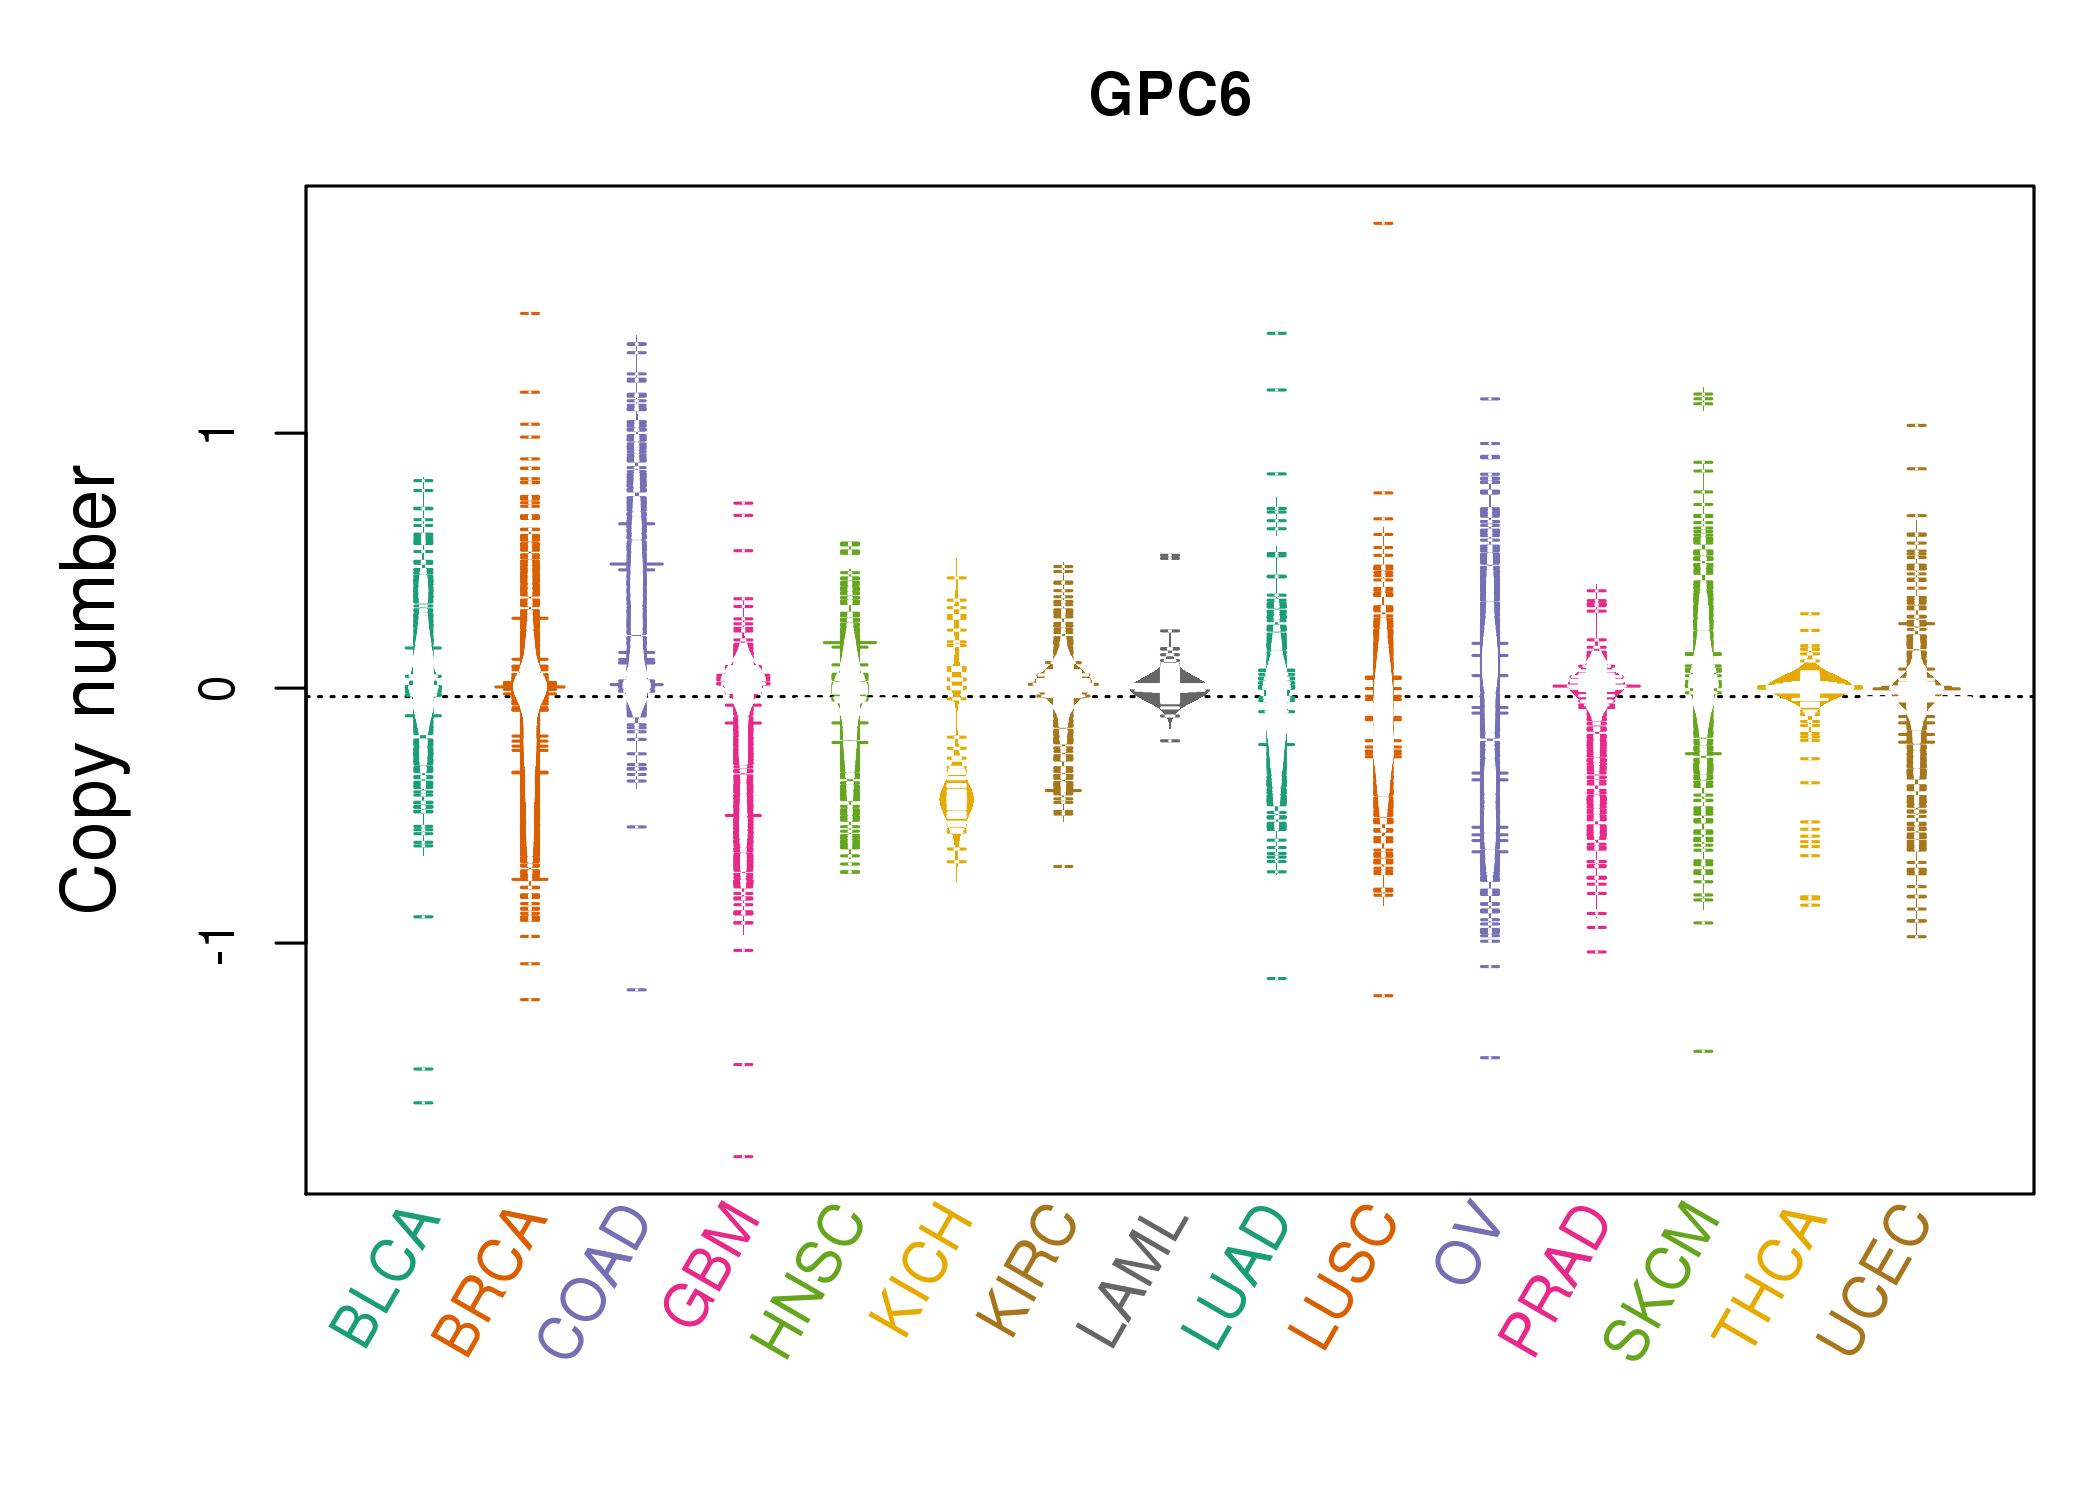 |
| cf) Tissue ID[Tissue type]: BLCA[Bladder Urothelial Carcinoma], BRCA[Breast invasive carcinoma], CESC[Cervical squamous cell carcinoma and endocervical adenocarcinoma], COAD[Colon adenocarcinoma], GBM[Glioblastoma multiforme], Glioma Low Grade, HNSC[Head and Neck squamous cell carcinoma], KICH[Kidney Chromophobe], KIRC[Kidney renal clear cell carcinoma], KIRP[Kidney renal papillary cell carcinoma], LAML[Acute Myeloid Leukemia], LUAD[Lung adenocarcinoma], LUSC[Lung squamous cell carcinoma], OV[Ovarian serous cystadenocarcinoma ], PAAD[Pancreatic adenocarcinoma], PRAD[Prostate adenocarcinoma], SKCM[Skin Cutaneous Melanoma], STAD[Stomach adenocarcinoma], THCA[Thyroid carcinoma], UCEC[Uterine Corpus Endometrial Carcinoma] |
| Top |
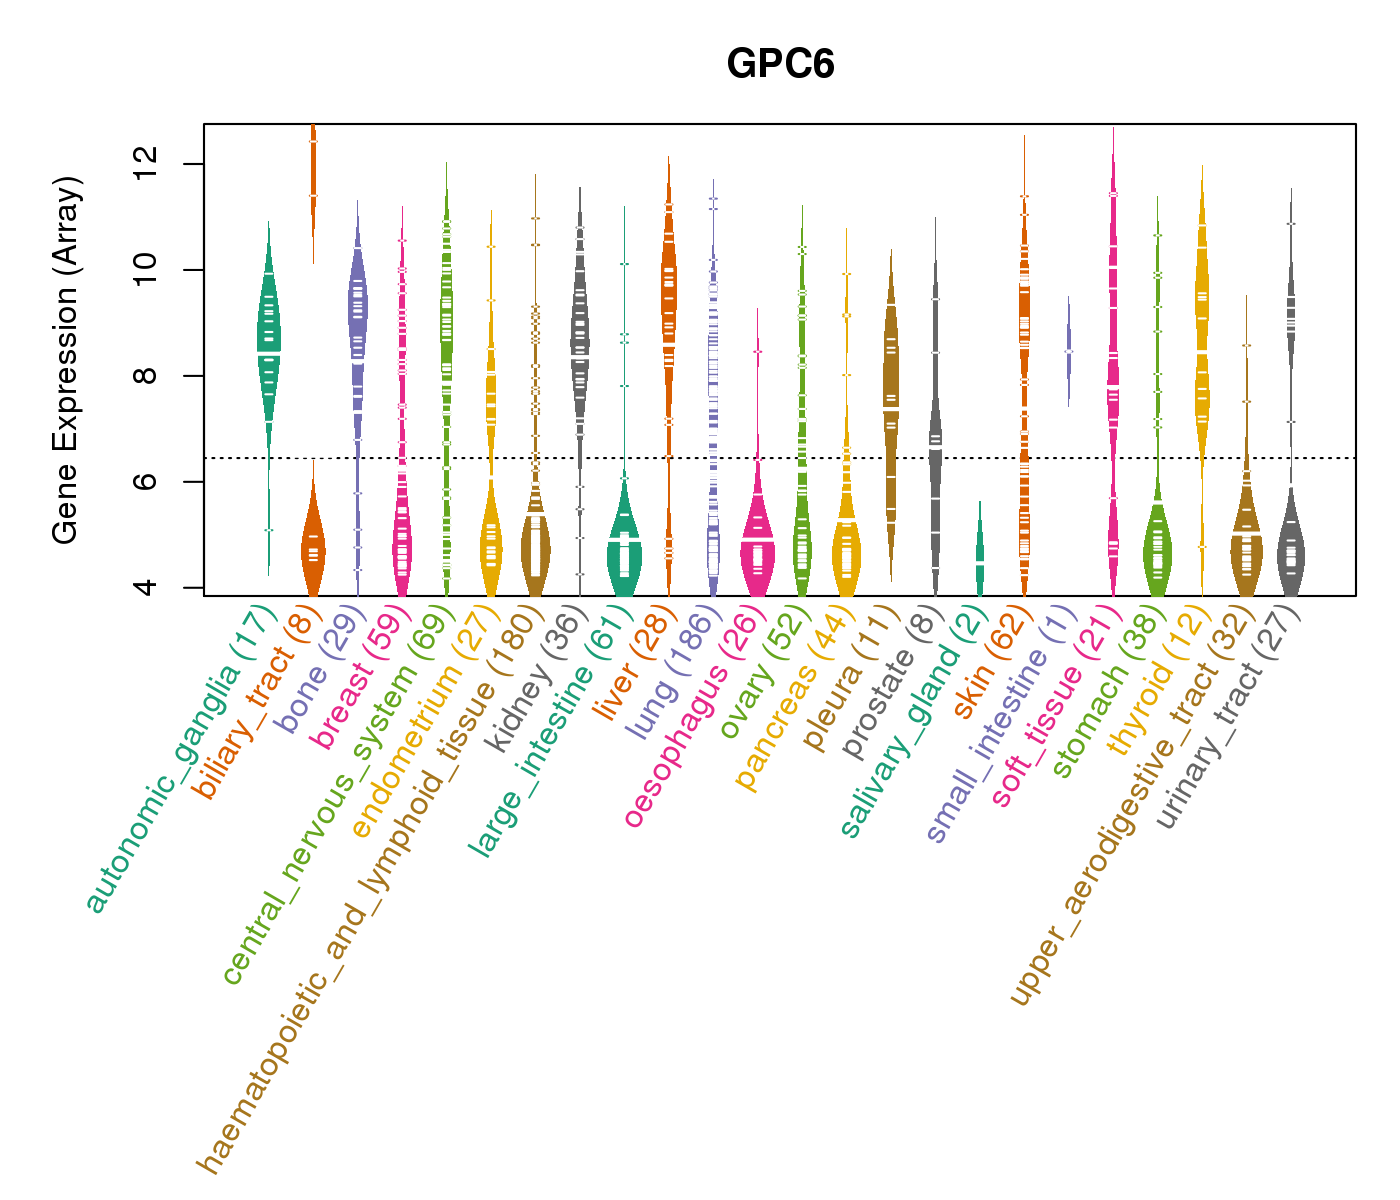
| Gene Expression for GPC6 |
| * CCLE gene expression data were extracted from CCLE_Expression_Entrez_2012-10-18.res: Gene-centric RMA-normalized mRNA expression data. |
 |
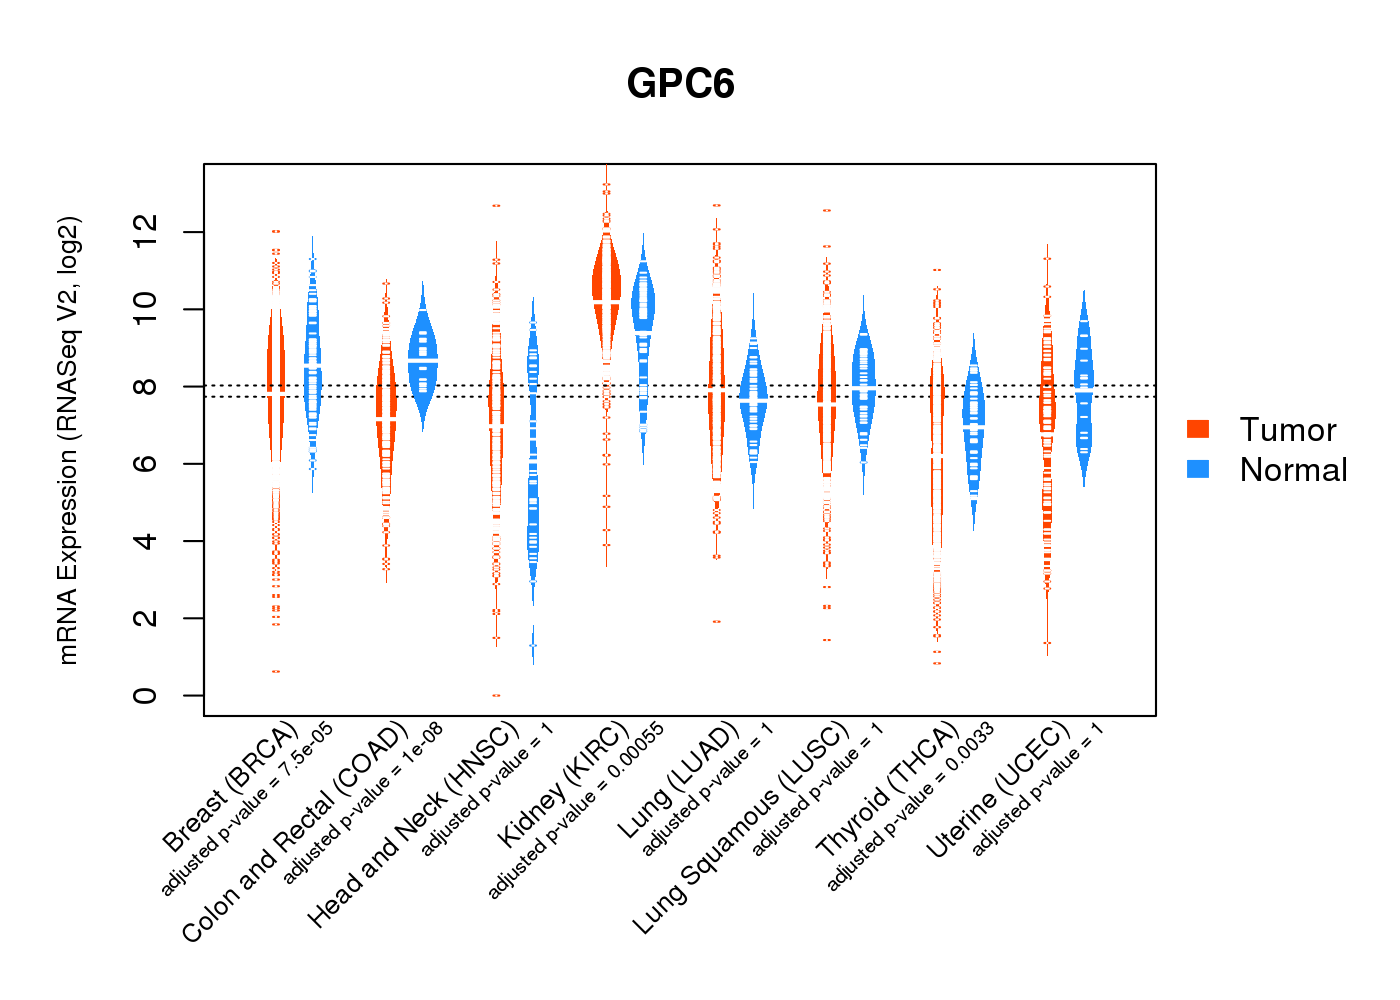
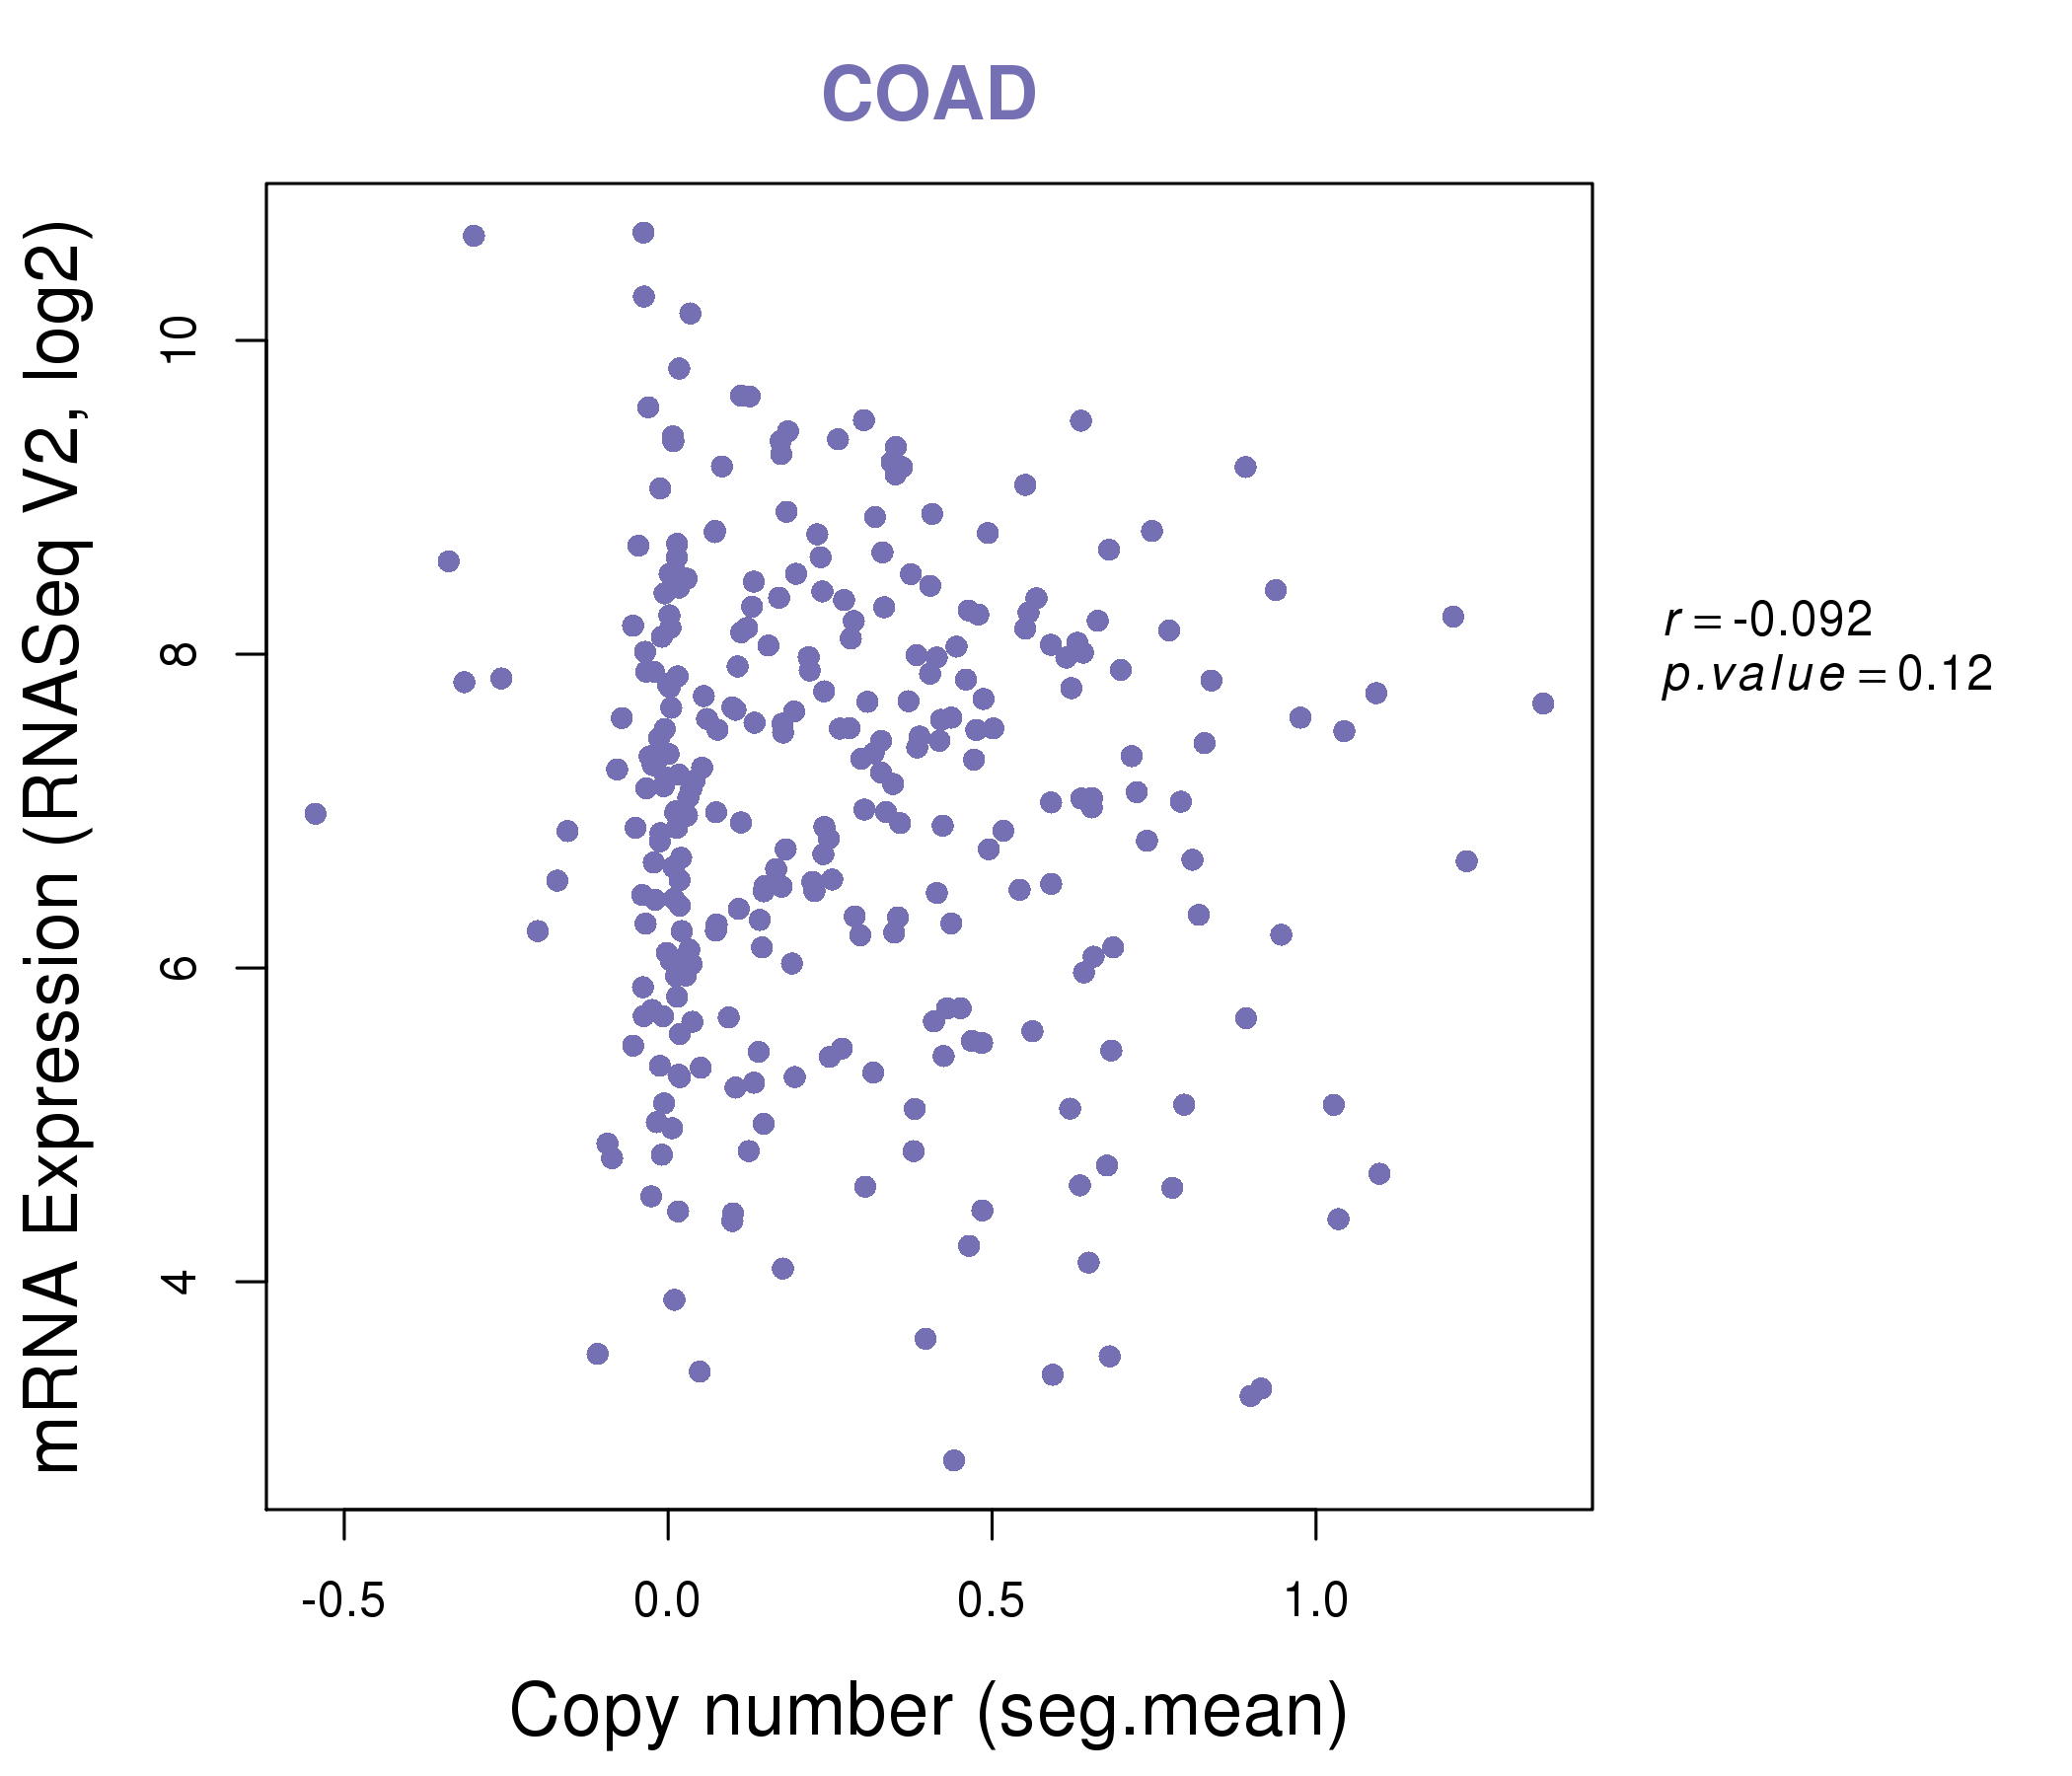
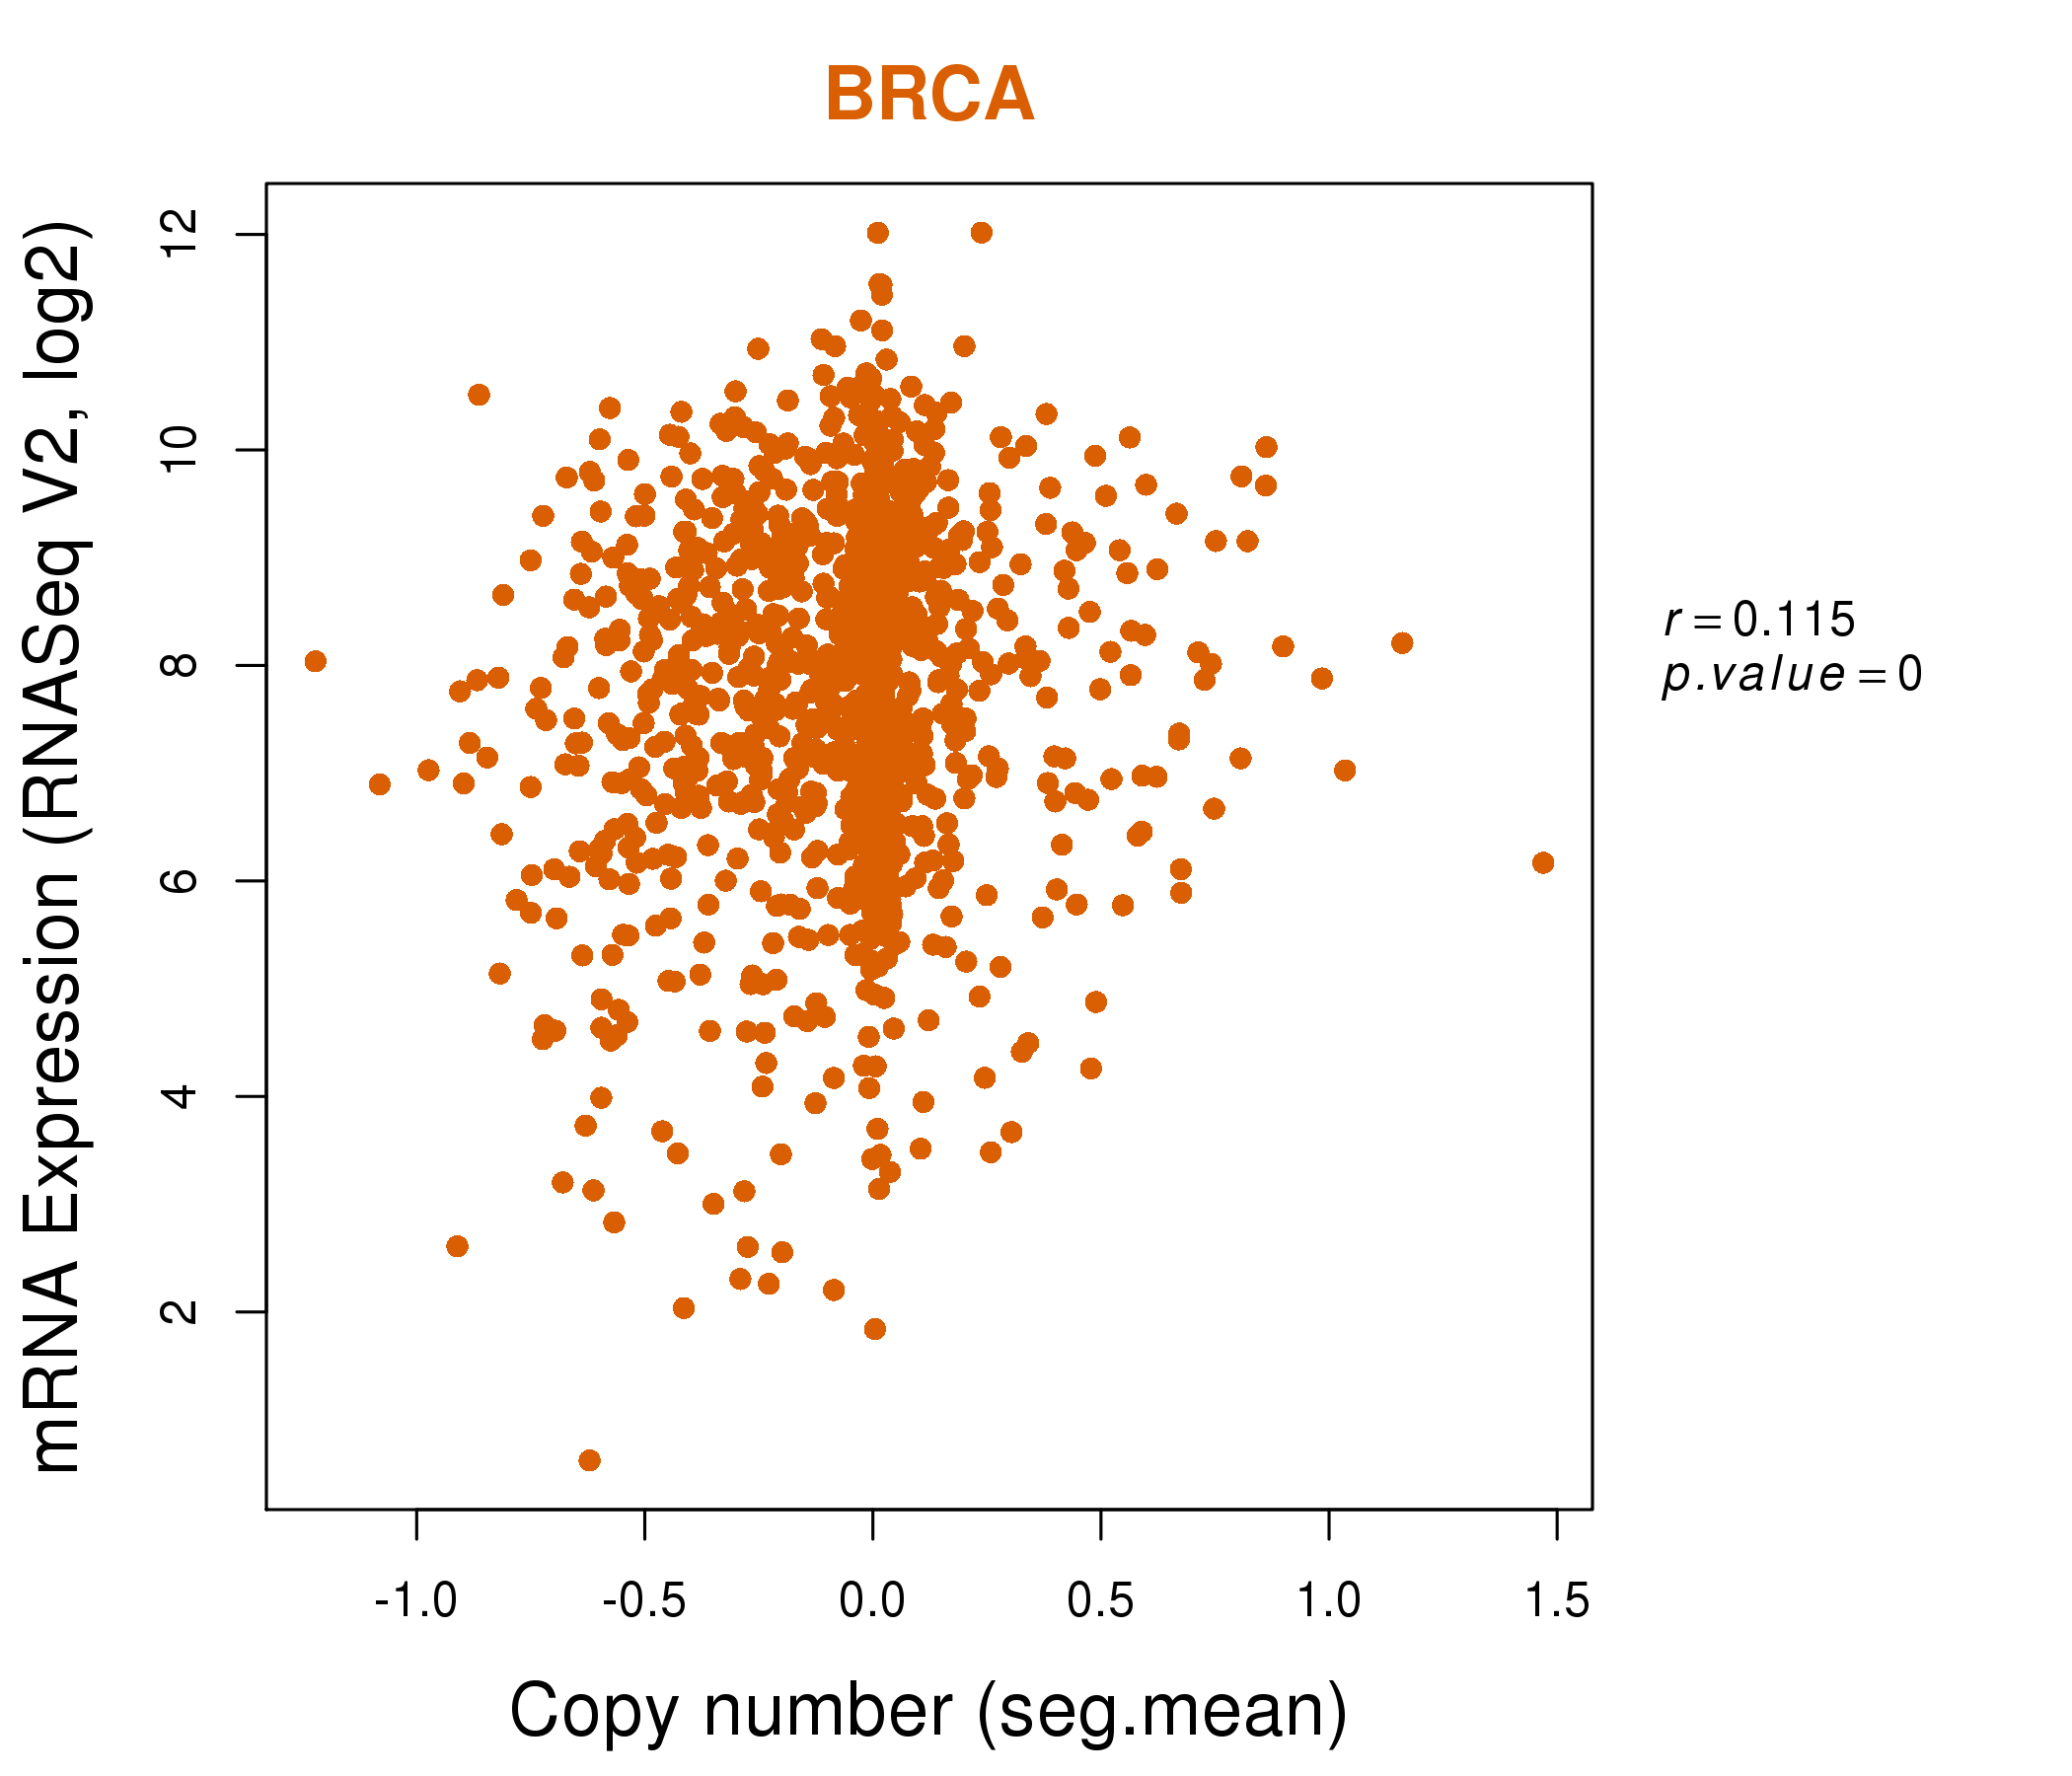
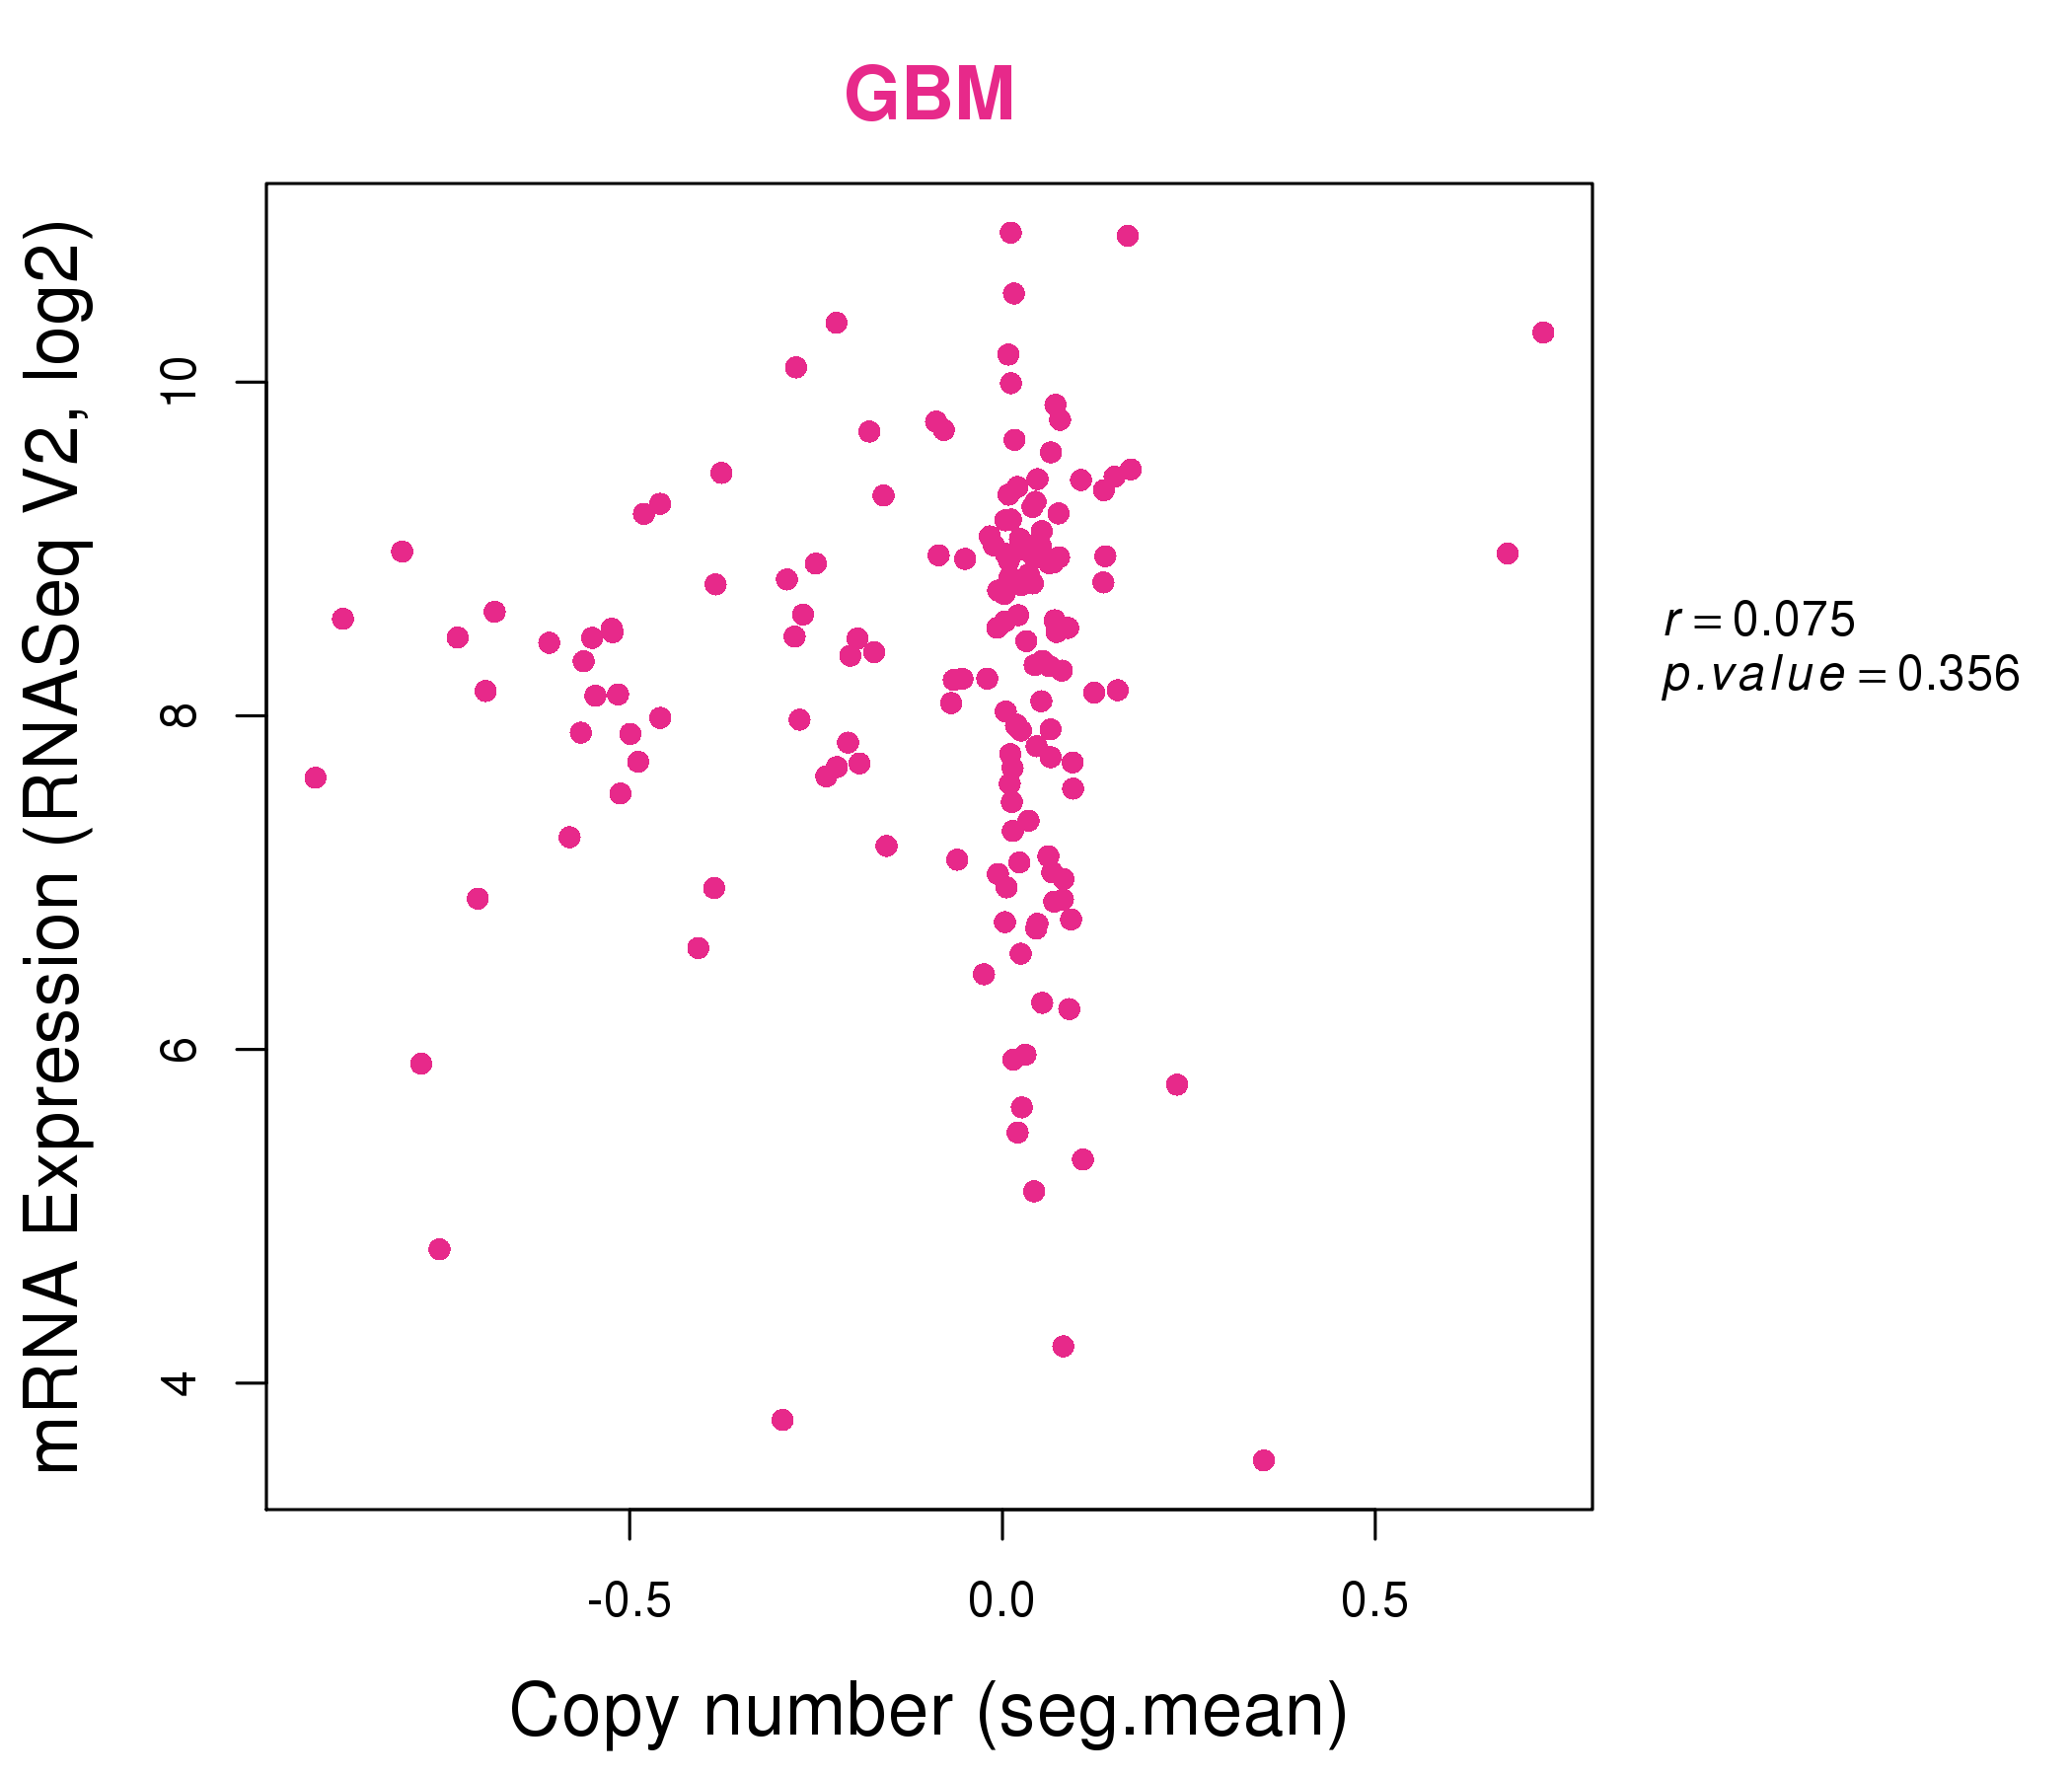
| * Normalized gene expression data of RNASeqV2 was extracted from TCGA using R package TCGA-Assembler. The URLs of all public data files on TCGA DCC data server were gathered at Jan-05-2015. Only eight cancer types have enough normal control samples for differential expression analysis. (t test, adjusted p<0.05 (using Benjamini-Hochberg FDR)) |
 |
| Top |
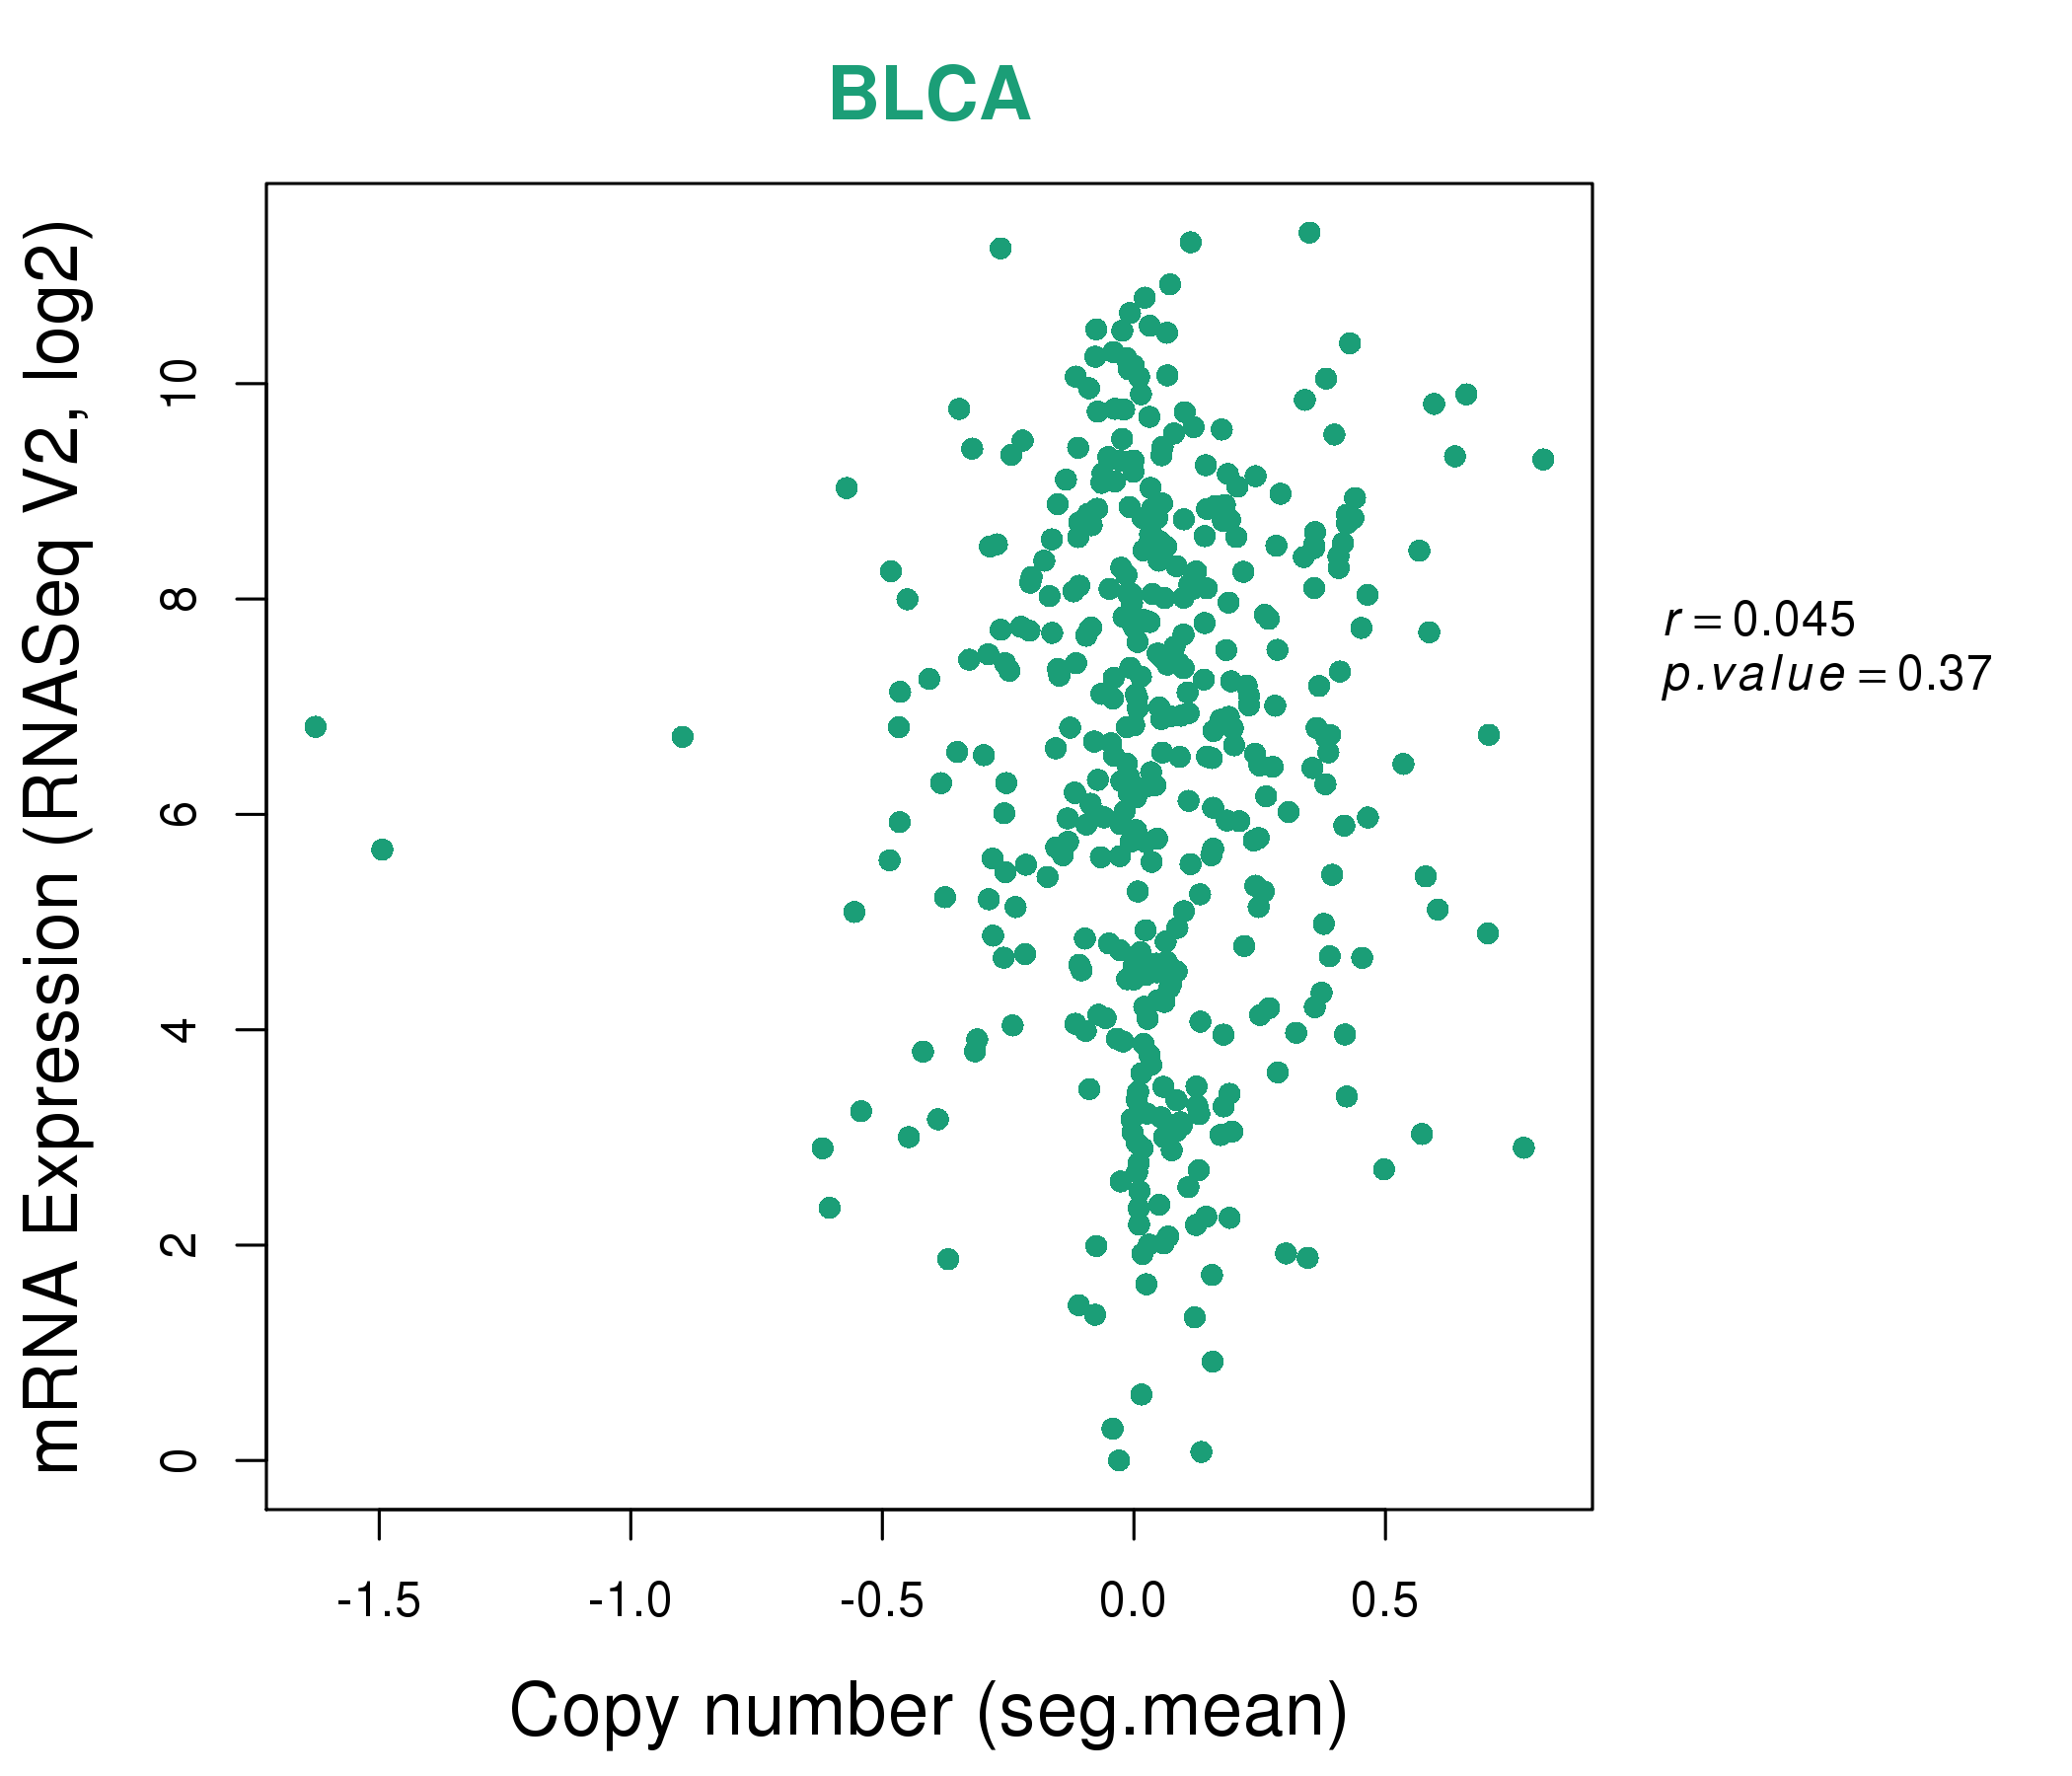
| * This plots show the correlation between CNV and gene expression. |
: Open all plots for all cancer types
 |
|
 |
|
| Top |
| Gene-Gene Network Information |
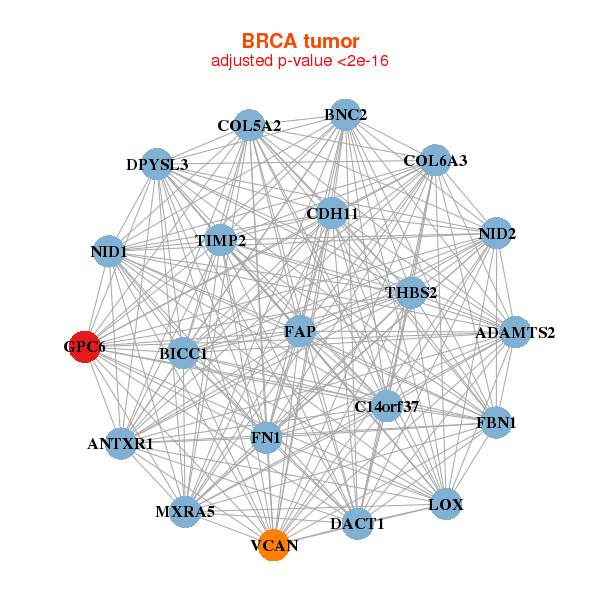
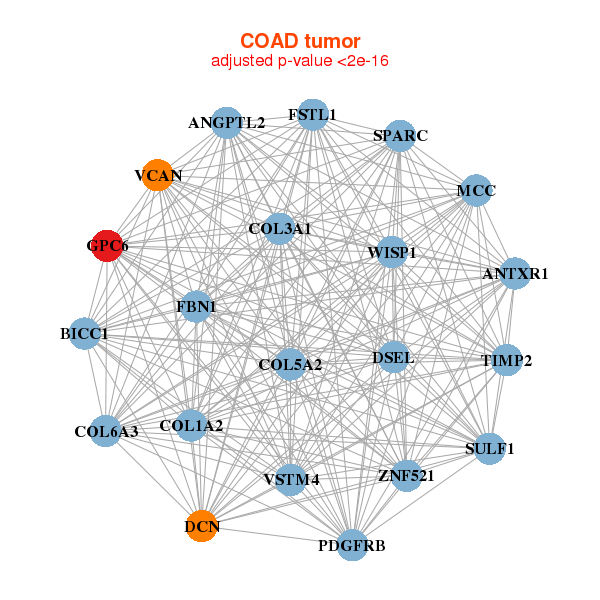
| * Co-Expression network figures were drawn using R package igraph. Only the top 20 genes with the highest correlations were shown. Red circle: input gene, orange circle: cell metabolism gene, sky circle: other gene |
: Open all plots for all cancer types
 |
|
| ADAMTS2,ANTXR1,BICC1,BNC2,C14orf37,CDH11,COL5A2, COL6A3,DACT1,DPYSL3,FAP,FBN1,FN1,GPC6, LOX,MXRA5,NID1,NID2,THBS2,TIMP2,VCAN | ACO1,ALDH2,PQLC2L,CALB2,CIDEC,ESYT1,FAH, FAM89A,FERMT2,GPC6,GPD1,HEPACAM,HEPN1,LIPE, MDFIC,MARC1,NPR1,PLIN1,PTGER3,SLC25A16,TSPAN3 |
 |
|
| ANGPTL2,ANTXR1,BICC1,VSTM4,COL1A2,COL3A1,COL5A2, COL6A3,DCN,DSEL,FBN1,FSTL1,GPC6,MCC, PDGFRB,SPARC,SULF1,TIMP2,VCAN,WISP1,ZNF521 | ATP1B2,C11orf95,DCLK1,DSEL,EBF3,EFS,FKBP10, GPC6,HTRA1,JAM2,NAV3,NFIA,NLGN2,NLGN3, OLFML1,PCDHGA11,PCDHGC3,SLC16A2,STXBP1,TGFBR3,TMTC1 |
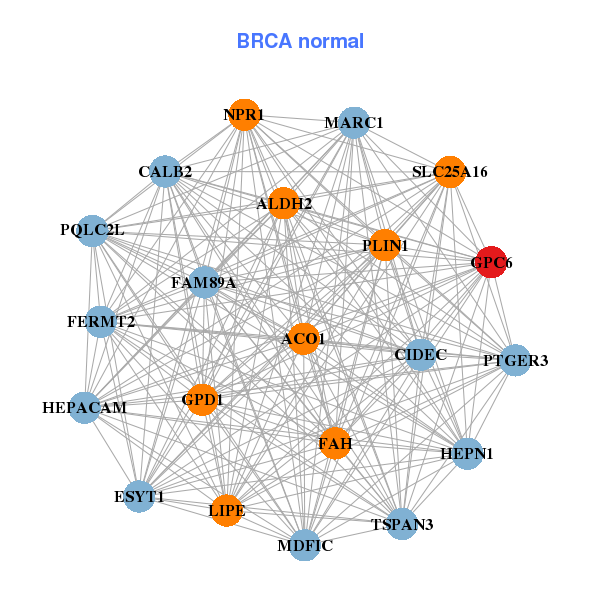
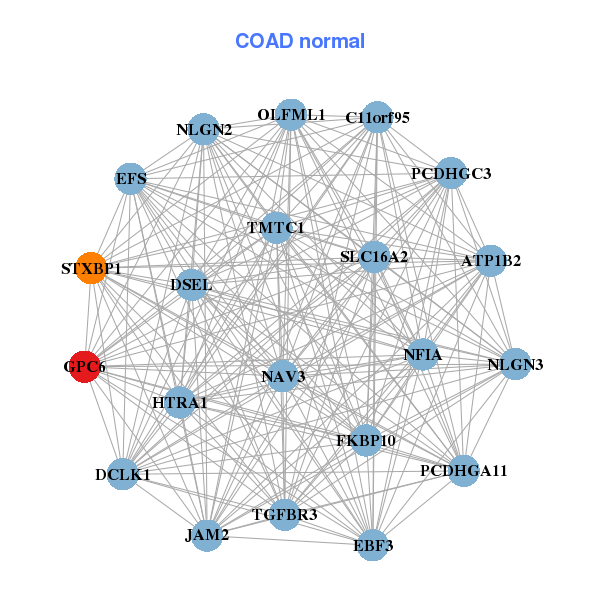
| * Co-Expression network figures were drawn using R package igraph. Only the top 20 genes with the highest correlations were shown. Red circle: input gene, orange circle: cell metabolism gene, sky circle: other gene |
: Open all plots for all cancer types
| Top |
: Open all interacting genes' information including KEGG pathway for all interacting genes from DAVID
| Top |
| Pharmacological Information for GPC6 |
| There's no related Drug. |
| Top |
| Cross referenced IDs for GPC6 |
| * We obtained these cross-references from Uniprot database. It covers 150 different DBs, 18 categories. http://www.uniprot.org/help/cross_references_section |
: Open all cross reference information
|
Copyright © 2016-Present - The Univsersity of Texas Health Science Center at Houston @ |