|
||||||||||||||||||||||||||||||||||||||||||||||||||||||||||||||||||||||||||||||||||||||||||||||||||||||||||||||||||||||||||||||||||||||||||||||||||||||||||||||||||||||||||||||||||||||||||||||||||||||||||||||||||||||||||||||||||||||||||||||||||||||||||||||||||||||||||||||||||||||||||||||||||||||||||||||||||||||||||
| |
| Phenotypic Information (metabolism pathway, cancer, disease, phenome) |
| |
| |
| Gene-Gene Network Information: Co-Expression Network, Interacting Genes & KEGG |
| |
|


| Gene Summary for COL4A3BP |
| Basic gene info. | Gene symbol | COL4A3BP |
| Gene name | collagen, type IV, alpha 3 (Goodpasture antigen) binding protein | |
| Synonyms | CERT|CERTL|GPBP|STARD11 | |
| Cytomap | UCSC genome browser: 5q13.3 | |
| Genomic location | chr5 :74666927-74807806 | |
| Type of gene | protein-coding | |
| RefGenes | NM_001130105.1, NM_005713.2,NM_031361.2, | |
| Ensembl id | ENSG00000113163 | |
| Description | StAR-related lipid transfer (START) domain containing 11ceramide transfer proteinceramide transportercollagen type IV alpha-3-binding proteinhCERTlipid-transfer protein CERTL | |
| Modification date | 20141207 | |
| dbXrefs | MIM : 604677 | |
| HGNC : HGNC | ||
| Ensembl : ENSG00000113163 | ||
| HPRD : 05246 | ||
| Vega : OTTHUMG00000102068 | ||
| Protein | UniProt: Q9Y5P4 go to UniProt's Cross Reference DB Table | |
| Expression | CleanEX: HS_COL4A3BP | |
| BioGPS: 10087 | ||
| Gene Expression Atlas: ENSG00000113163 | ||
| The Human Protein Atlas: ENSG00000113163 | ||
| Pathway | NCI Pathway Interaction Database: COL4A3BP | |
| KEGG: COL4A3BP | ||
| REACTOME: COL4A3BP | ||
| ConsensusPathDB | ||
| Pathway Commons: COL4A3BP | ||
| Metabolism | MetaCyc: COL4A3BP | |
| HUMANCyc: COL4A3BP | ||
| Regulation | Ensembl's Regulation: ENSG00000113163 | |
| miRBase: chr5 :74,666,927-74,807,806 | ||
| TargetScan: NM_001130105 | ||
| cisRED: ENSG00000113163 | ||
| Context | iHOP: COL4A3BP | |
| cancer metabolism search in PubMed: COL4A3BP | ||
| UCL Cancer Institute: COL4A3BP | ||
| Assigned class in ccmGDB | A - This gene has a literature evidence and it belongs to cancer gene. | |
| References showing role of COL4A3BP in cancer cell metabolism | 1. Heering J, Weis N, Holeiter M, Neugart F, Staebler A, et al. (2012) Loss of the ceramide transfer protein augments EGF receptor signaling in breast cancer. Cancer Res 72: 2855-2866. doi: 10.1158/0008-5472.CAN-11-3069. go to article 2. Rao RP, Scheffer L, Srideshikan SM, Parthibane V, Kosakowska-Cholody T, et al. (2014) Ceramide transfer protein deficiency compromises organelle function and leads to senescence in primary cells. PLoS One 9: e92142. doi: 10.1371/journal.pone.0092142. pmid: 3958450. go to article 3. Lee AJ, Roylance R, Sander J, Gorman P, Endesfelder D, et al. (2012) CERT depletion predicts chemotherapy benefit and mediates cytotoxic and polyploid-specific cancer cell death through autophagy induction. J Pathol 226: 482-494. doi: 10.1002/path.2998. go to article 4. Hullin-Matsuda F, Tomishige N, Sakai S, Ishitsuka R, Ishii K, et al. (2012) Limonoid compounds inhibit sphingomyelin biosynthesis by preventing CERT protein-dependent extraction of ceramides from the endoplasmic reticulum. J Biol Chem 287: 24397-24411. doi: 10.1074/jbc.M112.356733. pmid: 3397866. go to article 5. Swanton C, Marani M, Pardo O, Warne PH, Kelly G, et al. (2007) Regulators of mitotic arrest and ceramide metabolism are determinants of sensitivity to paclitaxel and other chemotherapeutic drugs. Cancer Cell 11: 498-512. doi: 10.1016/j.ccr.2007.04.011. go to article | |
| Top |
| Phenotypic Information for COL4A3BP(metabolism pathway, cancer, disease, phenome) |
| Cancer | CGAP: COL4A3BP |
| Familial Cancer Database: COL4A3BP | |
| * This gene is included in those cancer gene databases. |
|
|
|
|
|
|
| ||||||||||||||||||||||||||||||||||||||||||||||||||||||||||||||||||||||||||||||||||||||||||||||||||||||||||||||||||||||||||||||||||||||||||||||||||||||||||||||||||||||||||||||||||||||||||||||||||||||||||||||||||||||||||||||||||||||||||||||||||||||||||||||||||||||||||||||||||||||||||||||||||||||||||||||||||||
Oncogene 1 | Significant driver gene in | |||||||||||||||||||||||||||||||||||||||||||||||||||||||||||||||||||||||||||||||||||||||||||||||||||||||||||||||||||||||||||||||||||||||||||||||||||||||||||||||||||||||||||||||||||||||||||||||||||||||||||||||||||||||||||||||||||||||||||||||||||||||||||||||||||||||||||||||||||||||||||||||||||||||||||||||||||||||||
| cf) number; DB name 1 Oncogene; http://nar.oxfordjournals.org/content/35/suppl_1/D721.long, 2 Tumor Suppressor gene; https://bioinfo.uth.edu/TSGene/, 3 Cancer Gene Census; http://www.nature.com/nrc/journal/v4/n3/abs/nrc1299.html, 4 CancerGenes; http://nar.oxfordjournals.org/content/35/suppl_1/D721.long, 5 Network of Cancer Gene; http://ncg.kcl.ac.uk/index.php, 1Therapeutic Vulnerabilities in Cancer; http://cbio.mskcc.org/cancergenomics/statius/ |
| REACTOME_PHOSPHOLIPID_METABOLISM REACTOME_SPHINGOLIPID_METABOLISM REACTOME_METABOLISM_OF_LIPIDS_AND_LIPOPROTEINS | |
| OMIM | 604677; gene. 604677; gene. |
| Orphanet | |
| Disease | KEGG Disease: COL4A3BP |
| MedGen: COL4A3BP (Human Medical Genetics with Condition) | |
| ClinVar: COL4A3BP | |
| Phenotype | MGI: COL4A3BP (International Mouse Phenotyping Consortium) |
| PhenomicDB: COL4A3BP | |
| Mutations for COL4A3BP |
| * Under tables are showing count per each tissue to give us broad intuition about tissue specific mutation patterns.You can go to the detailed page for each mutation database's web site. |
| There's no structural variation information in COSMIC data for this gene. |
| * From mRNA Sanger sequences, Chitars2.0 arranged chimeric transcripts. This table shows COL4A3BP related fusion information. |
| ID | Head Gene | Tail Gene | Accession | Gene_a | qStart_a | qEnd_a | Chromosome_a | tStart_a | tEnd_a | Gene_a | qStart_a | qEnd_a | Chromosome_a | tStart_a | tEnd_a |
| Top |
| Mutation type/ Tissue ID | brca | cns | cerv | endome | haematopo | kidn | Lintest | liver | lung | ns | ovary | pancre | prost | skin | stoma | thyro | urina | |||
| Total # sample | 2 | |||||||||||||||||||
| GAIN (# sample) | 1 | |||||||||||||||||||
| LOSS (# sample) | 1 |
| cf) Tissue ID; Tissue type (1; Breast, 2; Central_nervous_system, 3; Cervix, 4; Endometrium, 5; Haematopoietic_and_lymphoid_tissue, 6; Kidney, 7; Large_intestine, 8; Liver, 9; Lung, 10; NS, 11; Ovary, 12; Pancreas, 13; Prostate, 14; Skin, 15; Stomach, 16; Thyroid, 17; Urinary_tract) |
| Top |
|
 |
| Top |
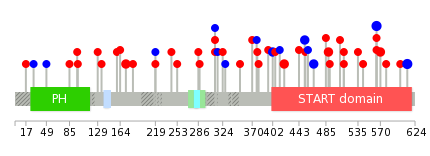
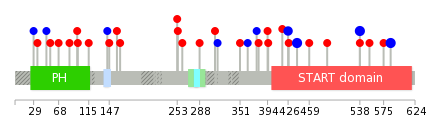
| Stat. for Non-Synonymous SNVs (# total SNVs=32) | (# total SNVs=14) |
 |  |
(# total SNVs=1) | (# total SNVs=0) |
 |
| Top |
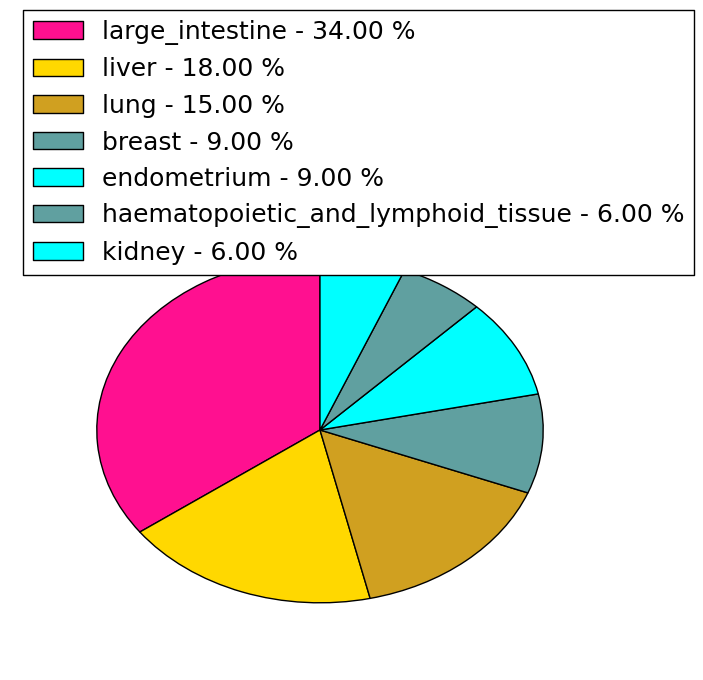
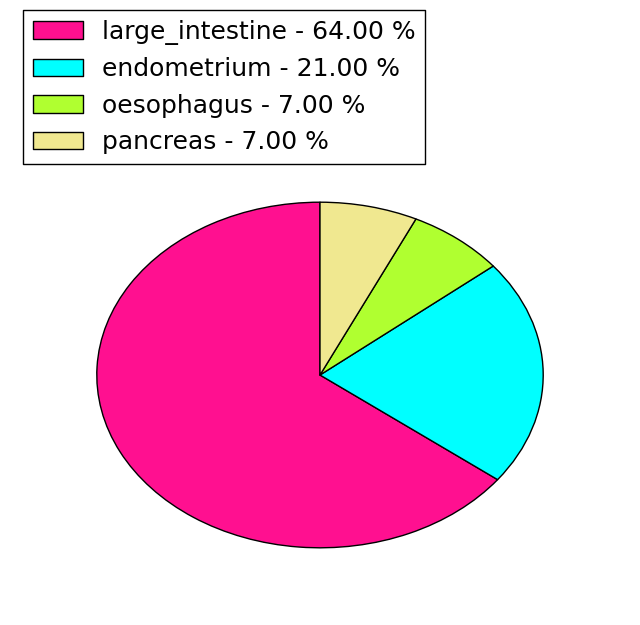
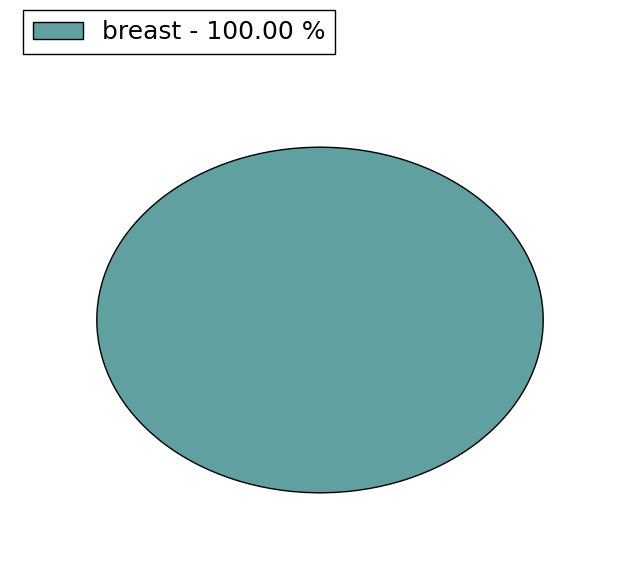
| * When you move the cursor on each content, you can see more deailed mutation information on the Tooltip. Those are primary_site,primary_histology,mutation(aa),pubmedID. |
| GRCh37 position | Mutation(aa) | Unique sampleID count |
| chr5:74675210-74675210 | p.Y612Y | 3 |
| chr5:74676952-74676952 | p.G564G | 3 |
| chr5:74681746-74681746 | p.D466D | 2 |
| chr5:74681788-74681788 | p.G452G | 2 |
| chr5:74685443-74685443 | p.L420V | 2 |
| chr5:74685495-74685495 | p.Q402Q | 2 |
| chr5:74680490-74680490 | p.I489V | 2 |
| chr5:74721264-74721264 | p.R173G | 2 |
| chr5:74676936-74676936 | p.R570G | 2 |
| chr5:74721304-74721304 | p.E159D | 1 |
| Top |
|
 |
| Point Mutation/ Tissue ID | 1 | 2 | 3 | 4 | 5 | 6 | 7 | 8 | 9 | 10 | 11 | 12 | 13 | 14 | 15 | 16 | 17 | 18 | 19 | 20 |
| # sample | 2 | 12 | 6 | 2 | 1 | 3 | 5 | 5 | 5 | |||||||||||
| # mutation | 2 | 10 | 6 | 2 | 1 | 3 | 5 | 5 | 5 | |||||||||||
| nonsynonymous SNV | 1 | 5 | 4 | 2 | 1 | 3 | 4 | 3 | 3 | |||||||||||
| synonymous SNV | 1 | 5 | 2 | 1 | 2 | 2 |
| cf) Tissue ID; Tissue type (1; BLCA[Bladder Urothelial Carcinoma], 2; BRCA[Breast invasive carcinoma], 3; CESC[Cervical squamous cell carcinoma and endocervical adenocarcinoma], 4; COAD[Colon adenocarcinoma], 5; GBM[Glioblastoma multiforme], 6; Glioma Low Grade, 7; HNSC[Head and Neck squamous cell carcinoma], 8; KICH[Kidney Chromophobe], 9; KIRC[Kidney renal clear cell carcinoma], 10; KIRP[Kidney renal papillary cell carcinoma], 11; LAML[Acute Myeloid Leukemia], 12; LUAD[Lung adenocarcinoma], 13; LUSC[Lung squamous cell carcinoma], 14; OV[Ovarian serous cystadenocarcinoma ], 15; PAAD[Pancreatic adenocarcinoma], 16; PRAD[Prostate adenocarcinoma], 17; SKCM[Skin Cutaneous Melanoma], 18:STAD[Stomach adenocarcinoma], 19:THCA[Thyroid carcinoma], 20:UCEC[Uterine Corpus Endometrial Carcinoma]) |
| Top |
| * We represented just top 10 SNVs. When you move the cursor on each content, you can see more deailed mutation information on the Tooltip. Those are primary_site, primary_histology, mutation(aa), pubmedID. |
| Genomic Position | Mutation(aa) | Unique sampleID count |
| chr5:74681746 | p.Y586Y,COL4A3BP | 3 |
| chr5:74675210 | p.G538G,COL4A3BP | 3 |
| chr5:74676952 | p.D440D,COL4A3BP | 3 |
| chr5:74681788 | p.G426G,COL4A3BP | 2 |
| chr5:74696088 | p.V427I,COL4A3BP | 1 |
| chr5:74754945 | p.E159D,COL4A3BP | 1 |
| chr5:74680502 | p.S147C,COL4A3BP | 1 |
| chr5:74698866 | p.P417H,COL4A3BP | 1 |
| chr5:74754949 | p.S144S,COL4A3BP | 1 |
| chr5:74698880 | p.L394V,COL4A3BP | 1 |
| * Copy number data were extracted from TCGA using R package TCGA-Assembler. The URLs of all public data files on TCGA DCC data server were gathered on Jan-05-2015. Function ProcessCNAData in TCGA-Assembler package was used to obtain gene-level copy number value which is calculated as the average copy number of the genomic region of a gene. |
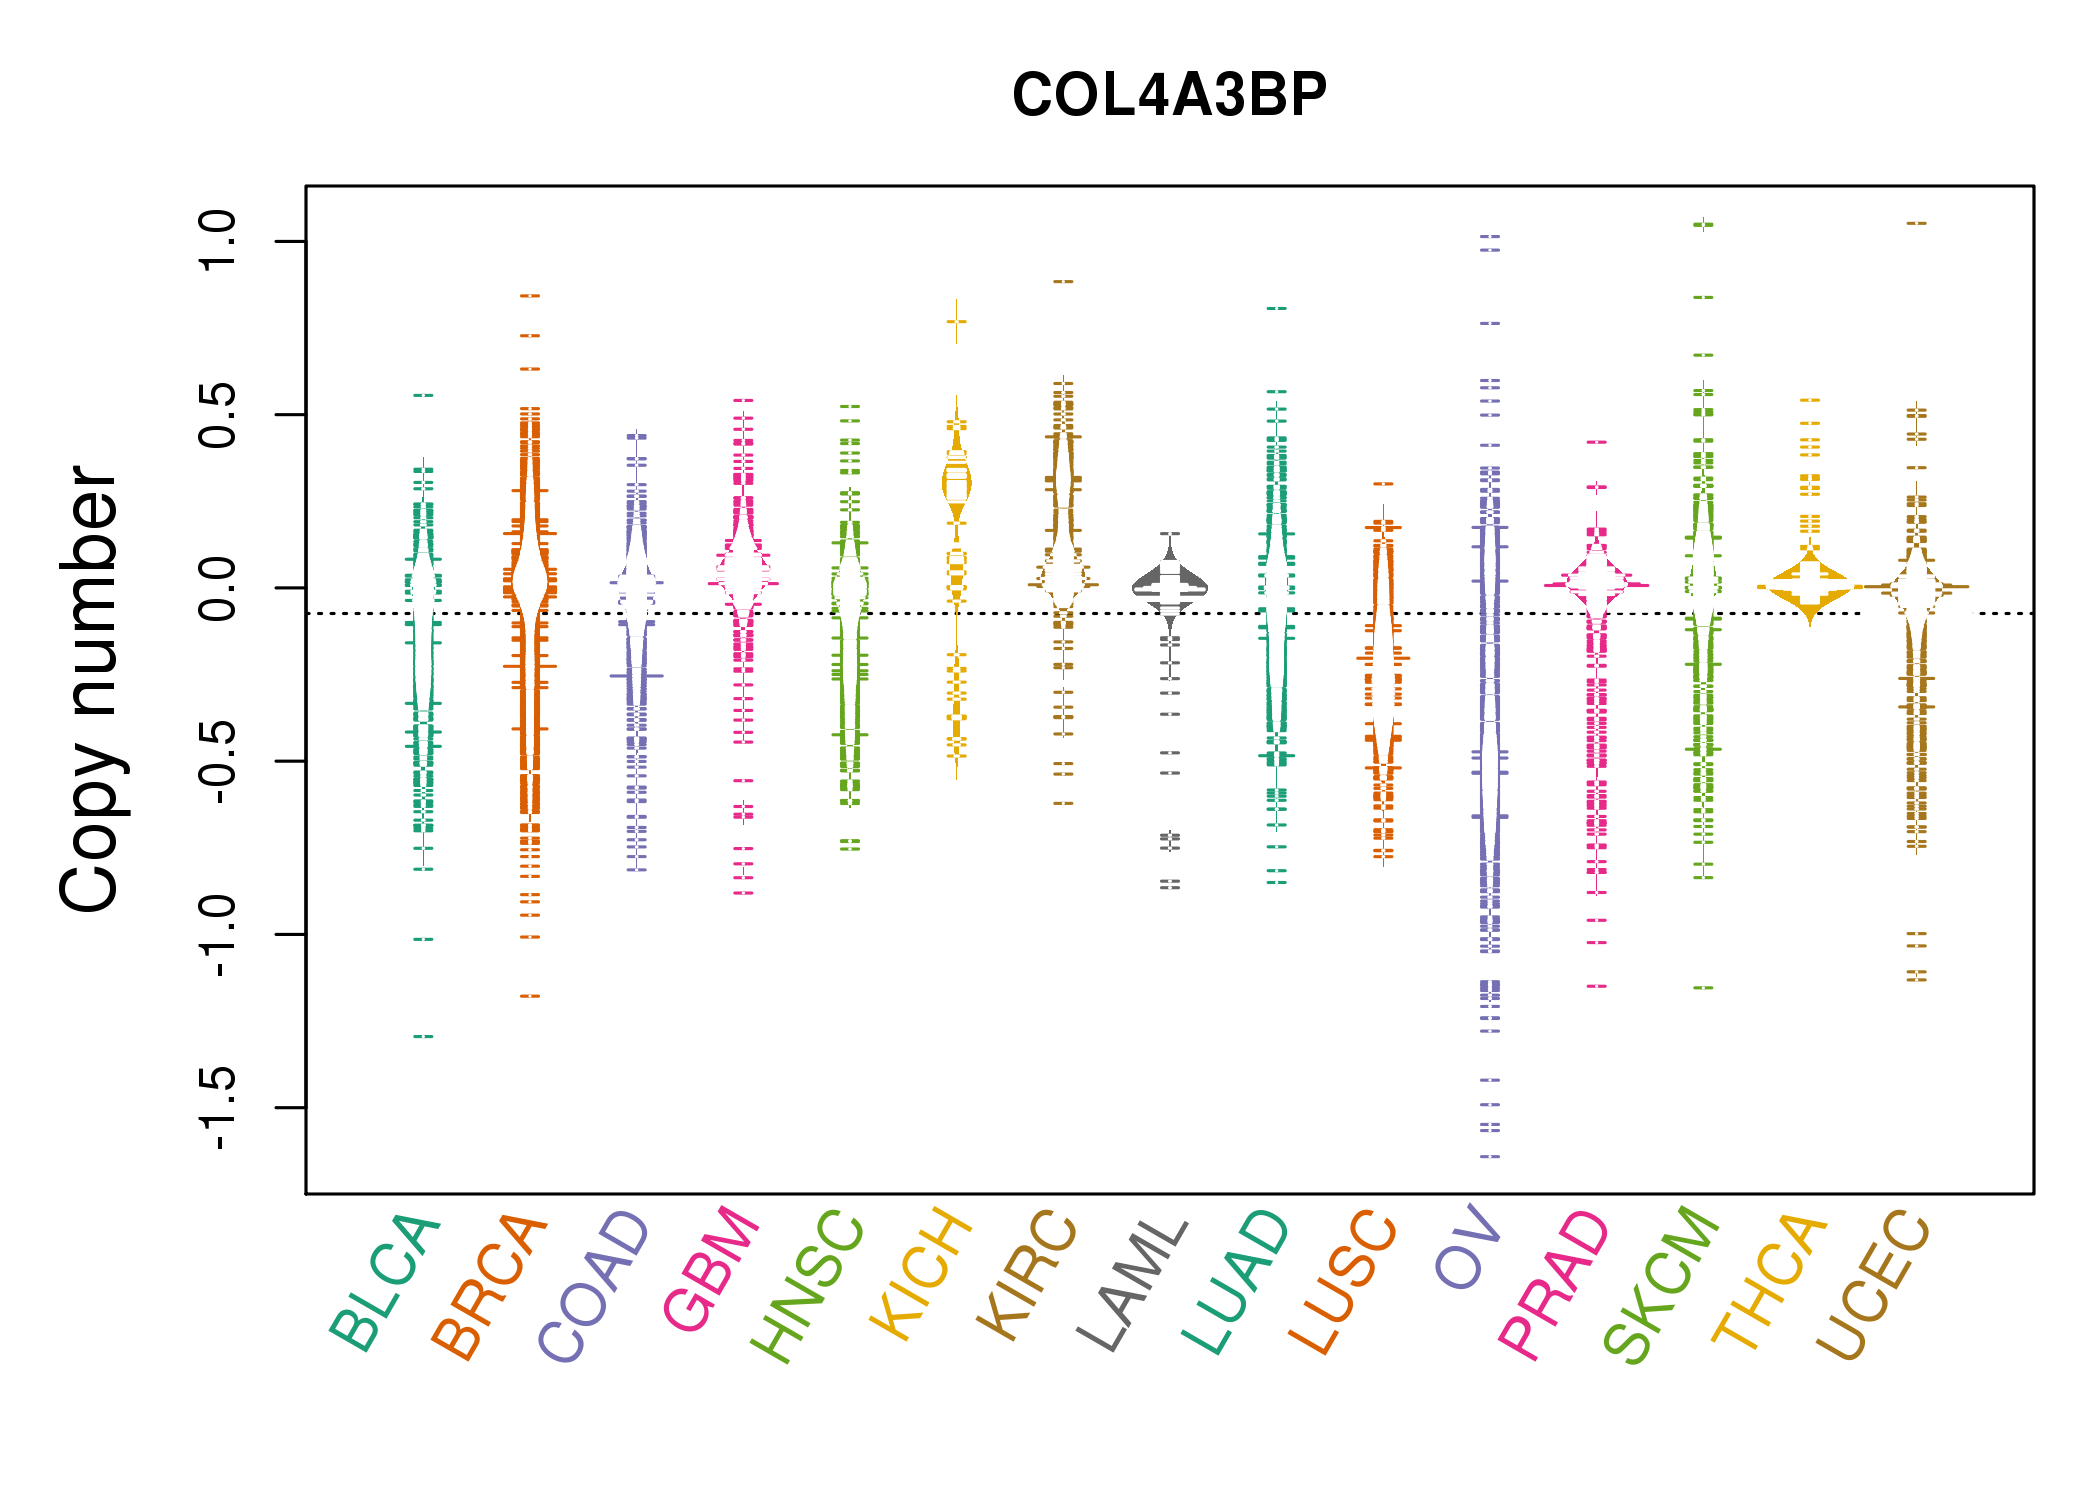 |
| cf) Tissue ID[Tissue type]: BLCA[Bladder Urothelial Carcinoma], BRCA[Breast invasive carcinoma], CESC[Cervical squamous cell carcinoma and endocervical adenocarcinoma], COAD[Colon adenocarcinoma], GBM[Glioblastoma multiforme], Glioma Low Grade, HNSC[Head and Neck squamous cell carcinoma], KICH[Kidney Chromophobe], KIRC[Kidney renal clear cell carcinoma], KIRP[Kidney renal papillary cell carcinoma], LAML[Acute Myeloid Leukemia], LUAD[Lung adenocarcinoma], LUSC[Lung squamous cell carcinoma], OV[Ovarian serous cystadenocarcinoma ], PAAD[Pancreatic adenocarcinoma], PRAD[Prostate adenocarcinoma], SKCM[Skin Cutaneous Melanoma], STAD[Stomach adenocarcinoma], THCA[Thyroid carcinoma], UCEC[Uterine Corpus Endometrial Carcinoma] |
| Top |
| Gene Expression for COL4A3BP |
| * CCLE gene expression data were extracted from CCLE_Expression_Entrez_2012-10-18.res: Gene-centric RMA-normalized mRNA expression data. |
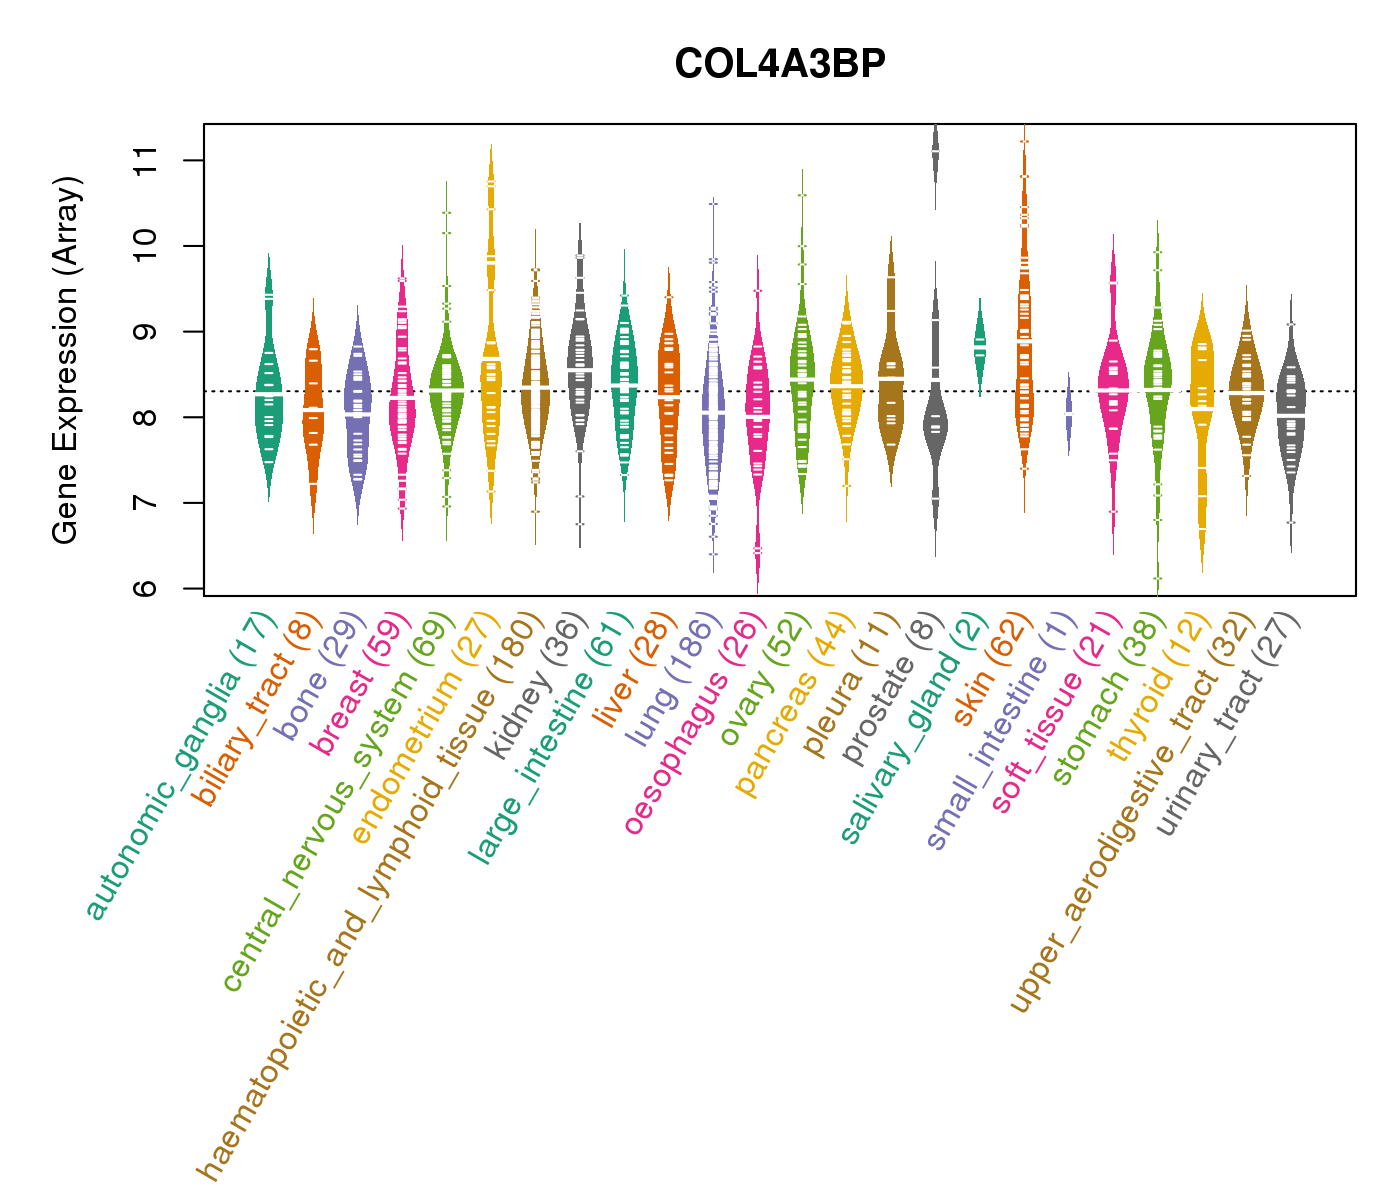 |
| * Normalized gene expression data of RNASeqV2 was extracted from TCGA using R package TCGA-Assembler. The URLs of all public data files on TCGA DCC data server were gathered at Jan-05-2015. Only eight cancer types have enough normal control samples for differential expression analysis. (t test, adjusted p<0.05 (using Benjamini-Hochberg FDR)) |
 |
| Top |
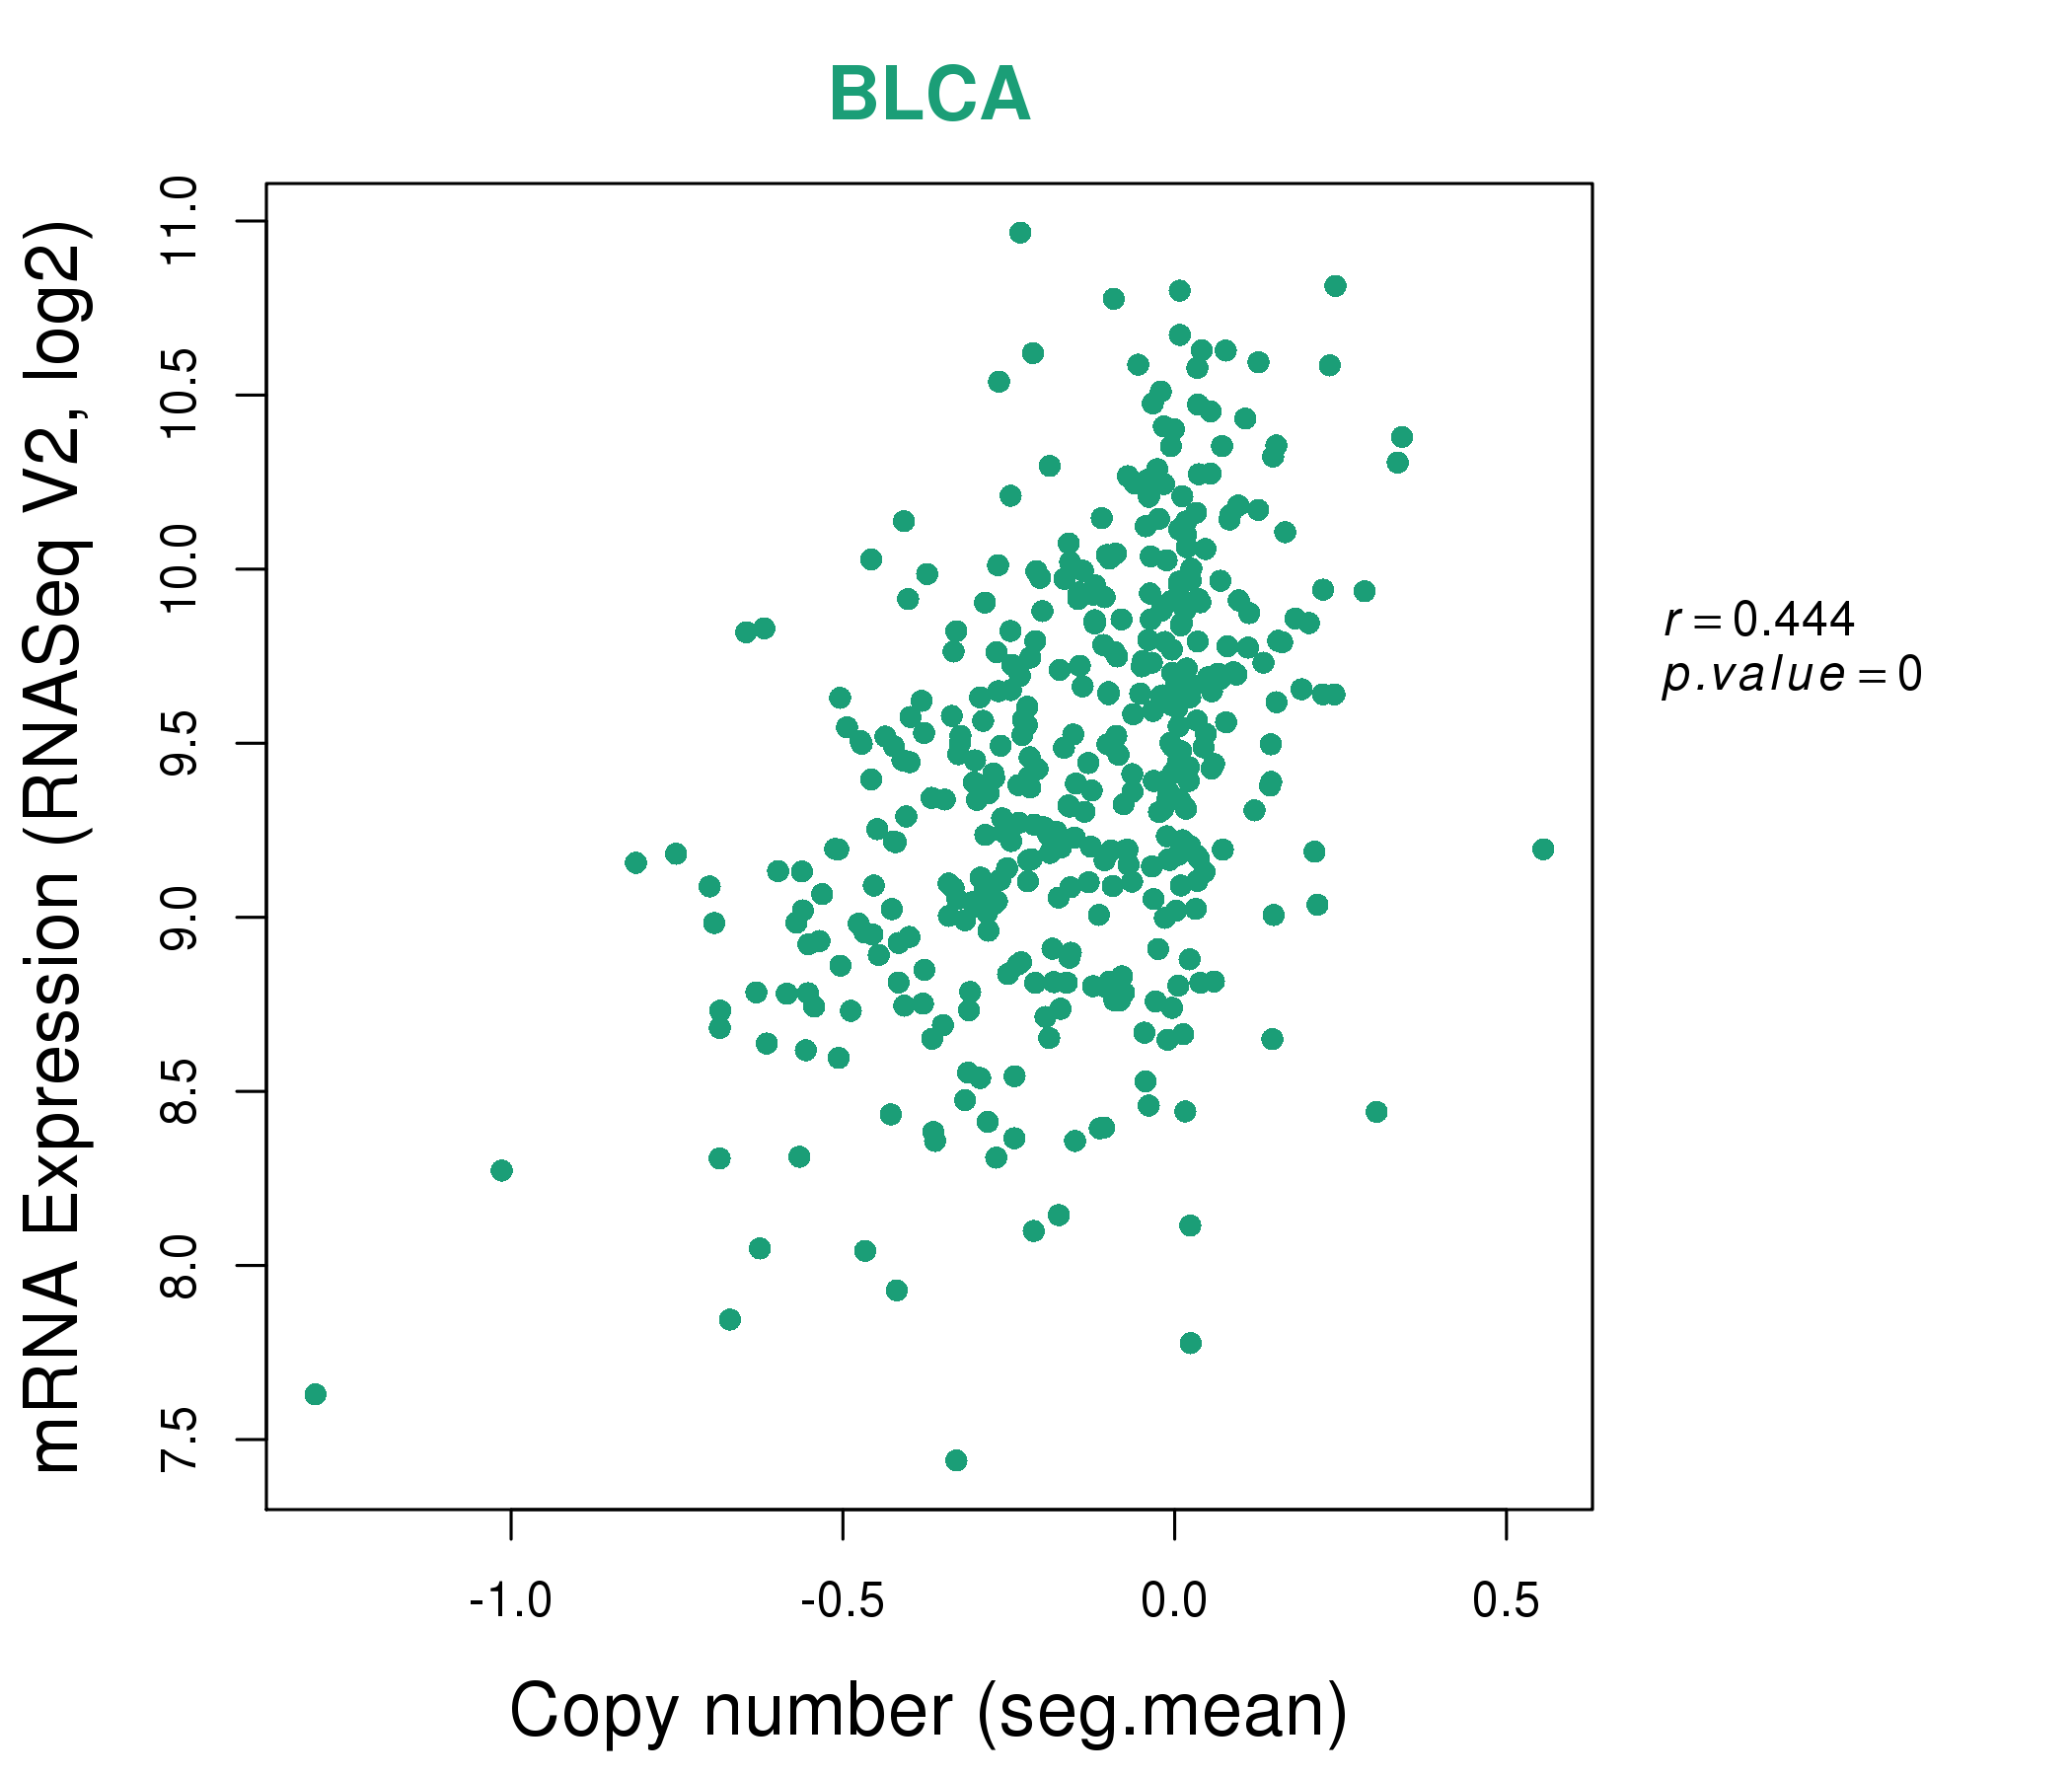
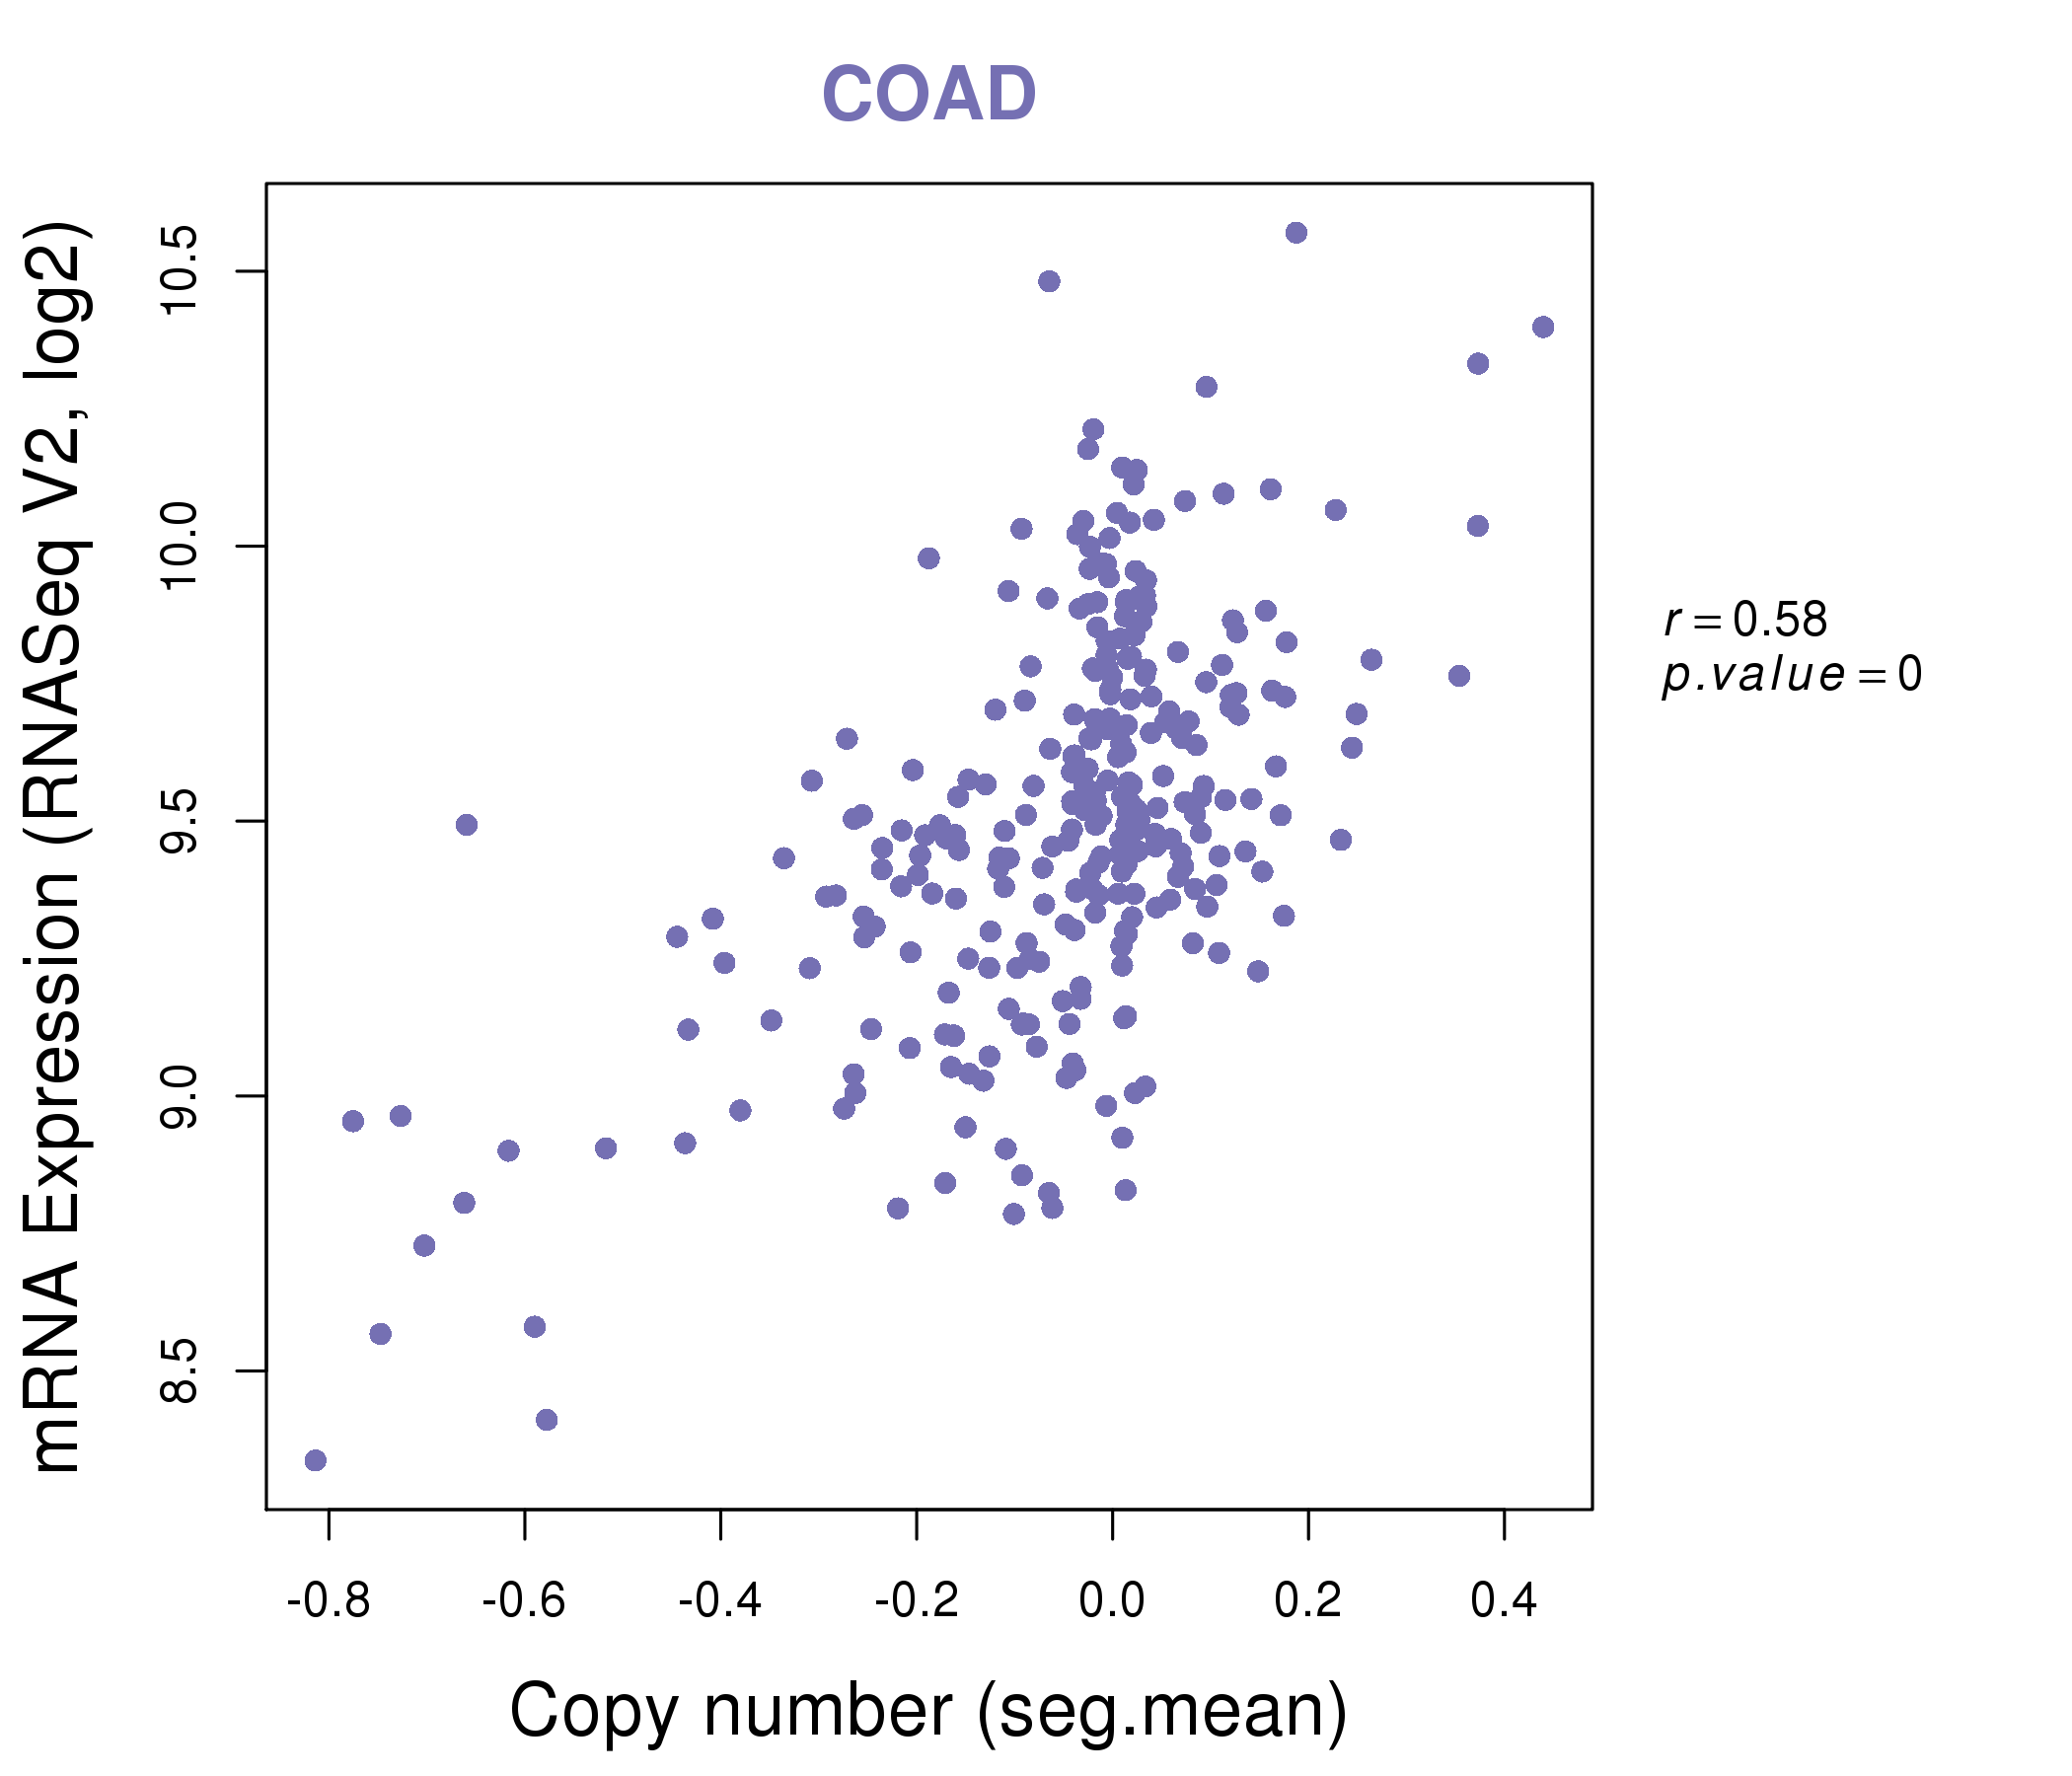
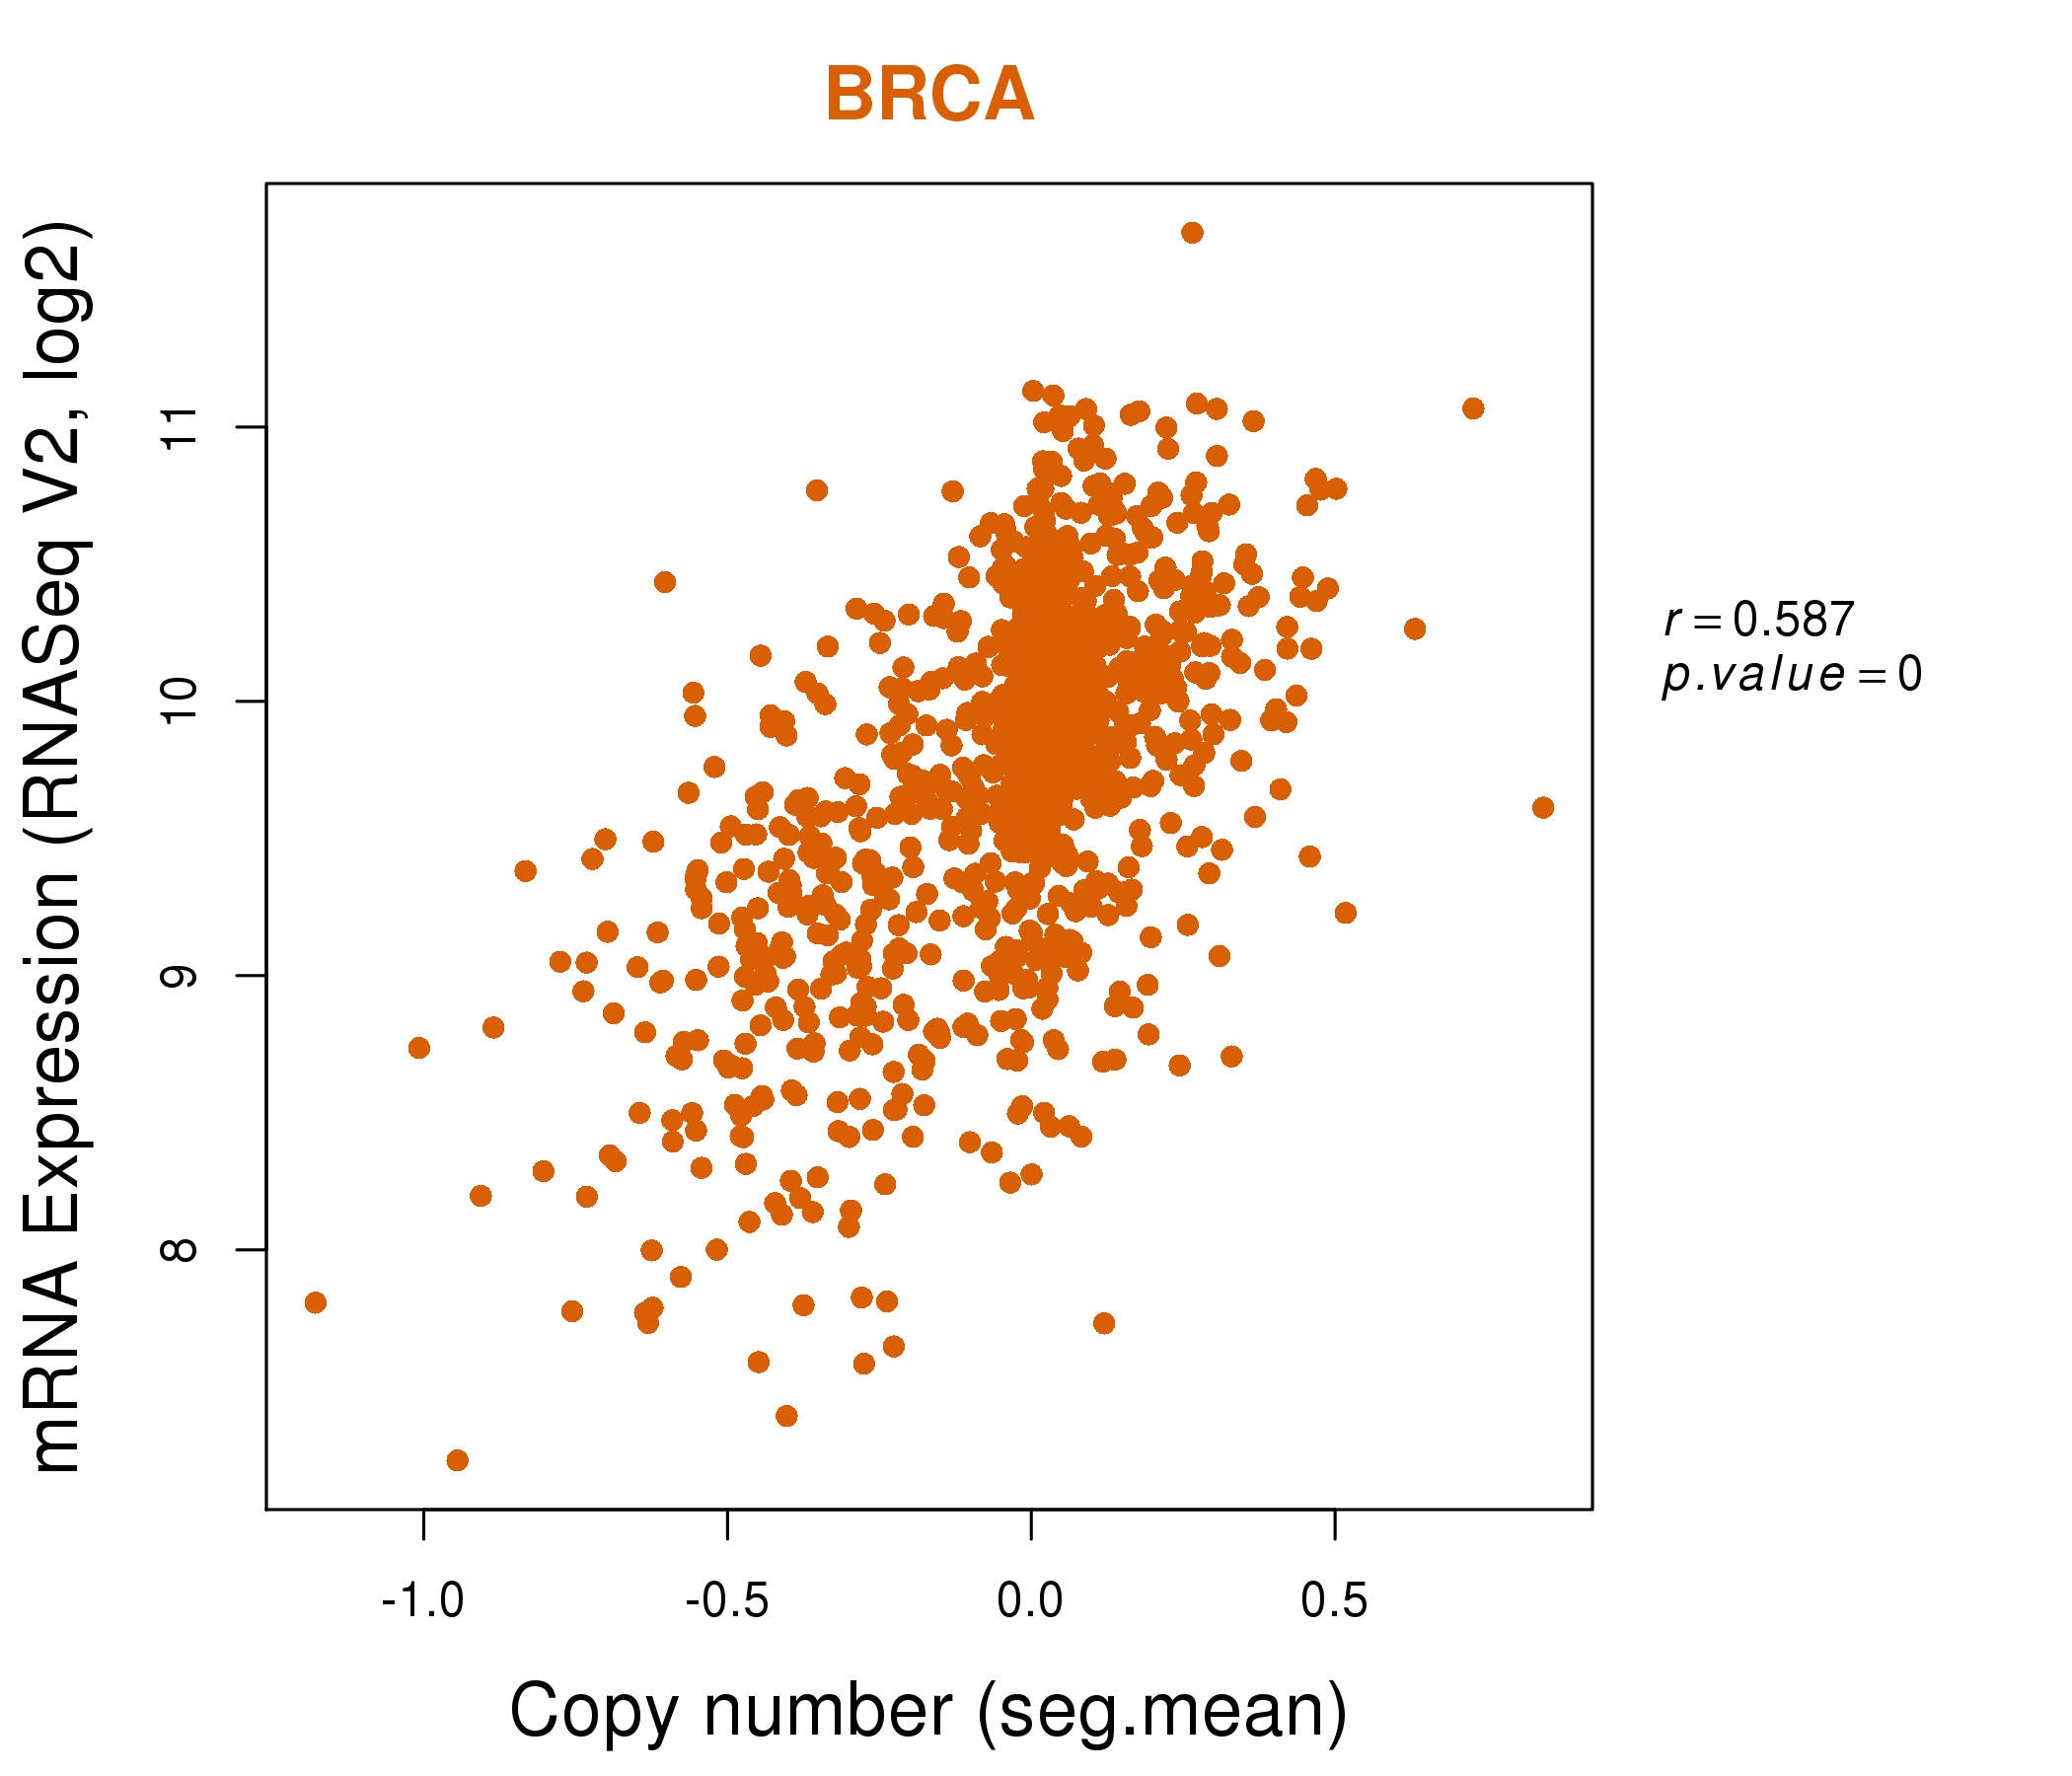
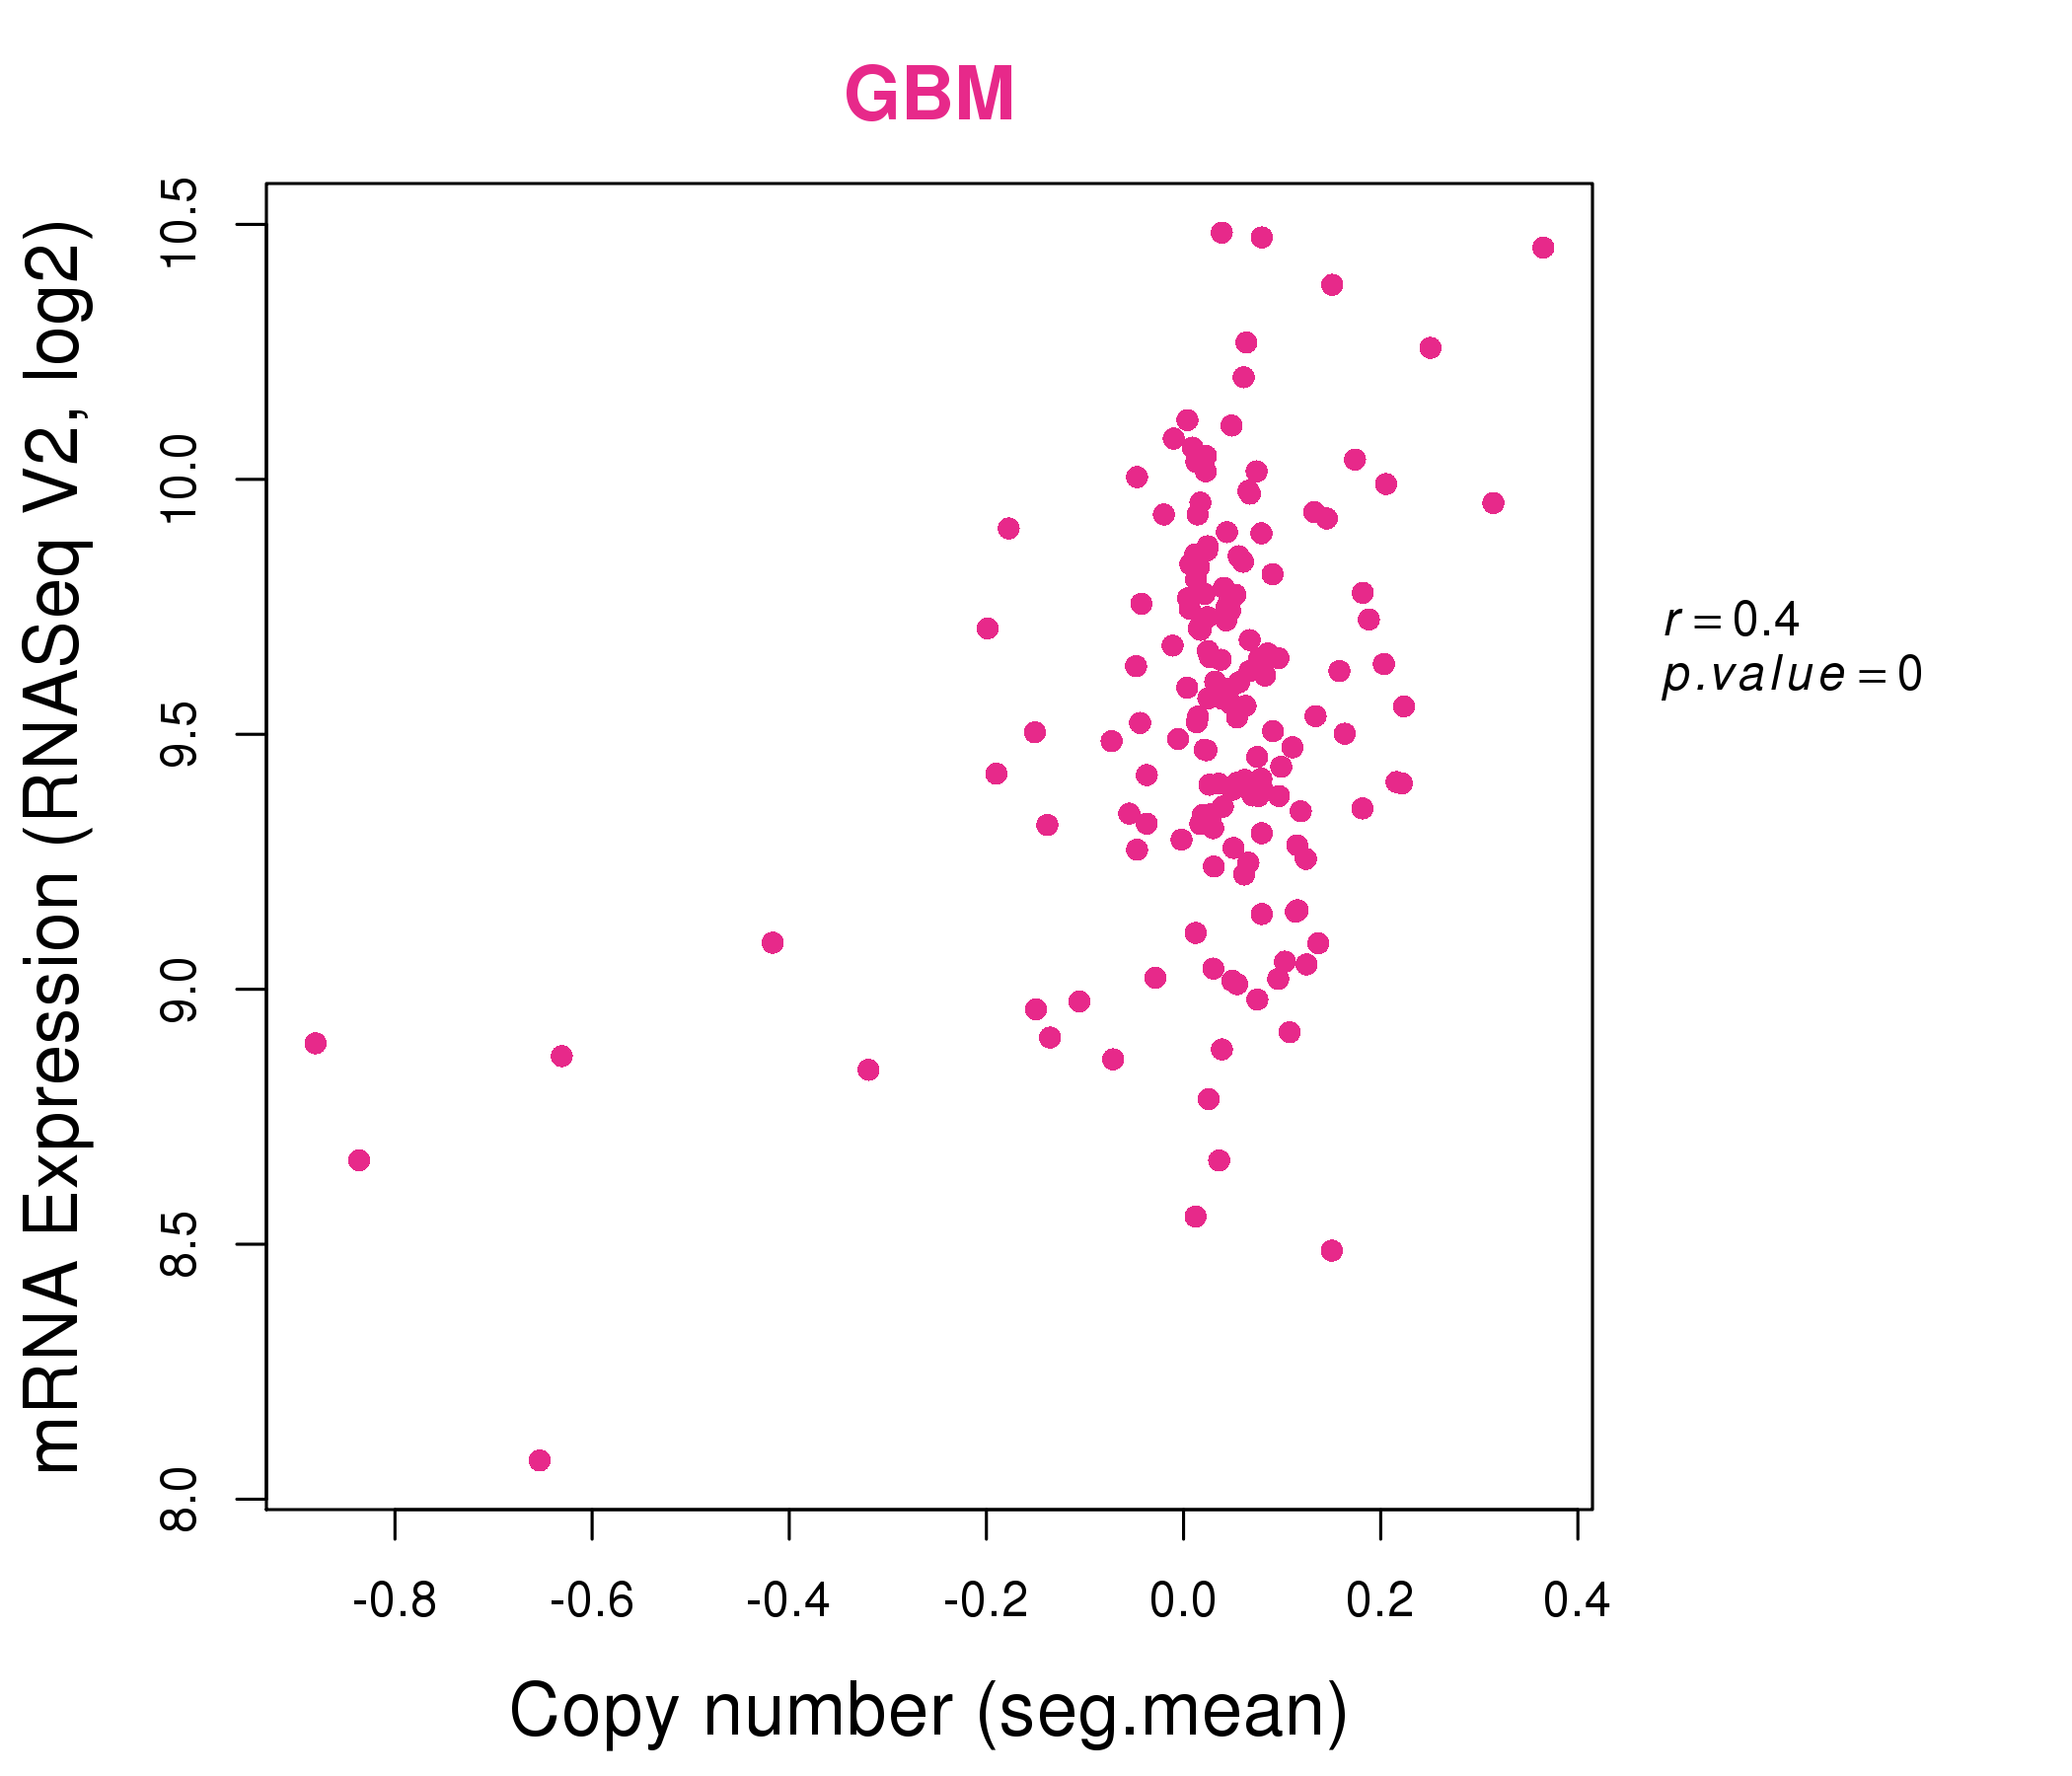
| * This plots show the correlation between CNV and gene expression. |
: Open all plots for all cancer types
 |
|
 |
|
| Top |
| Gene-Gene Network Information |
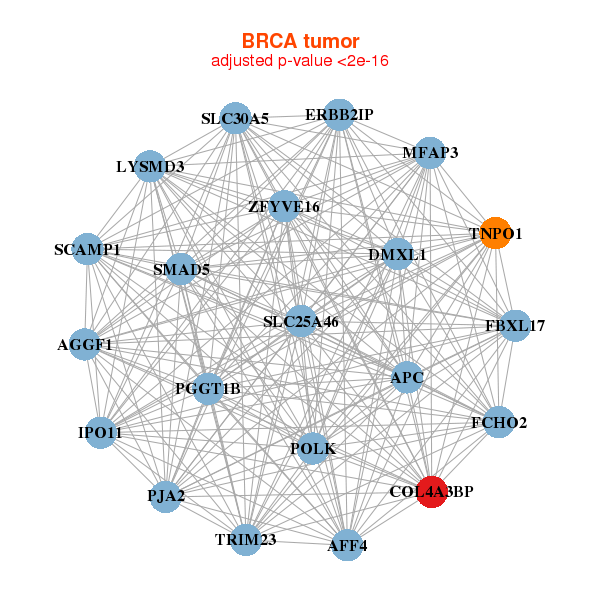
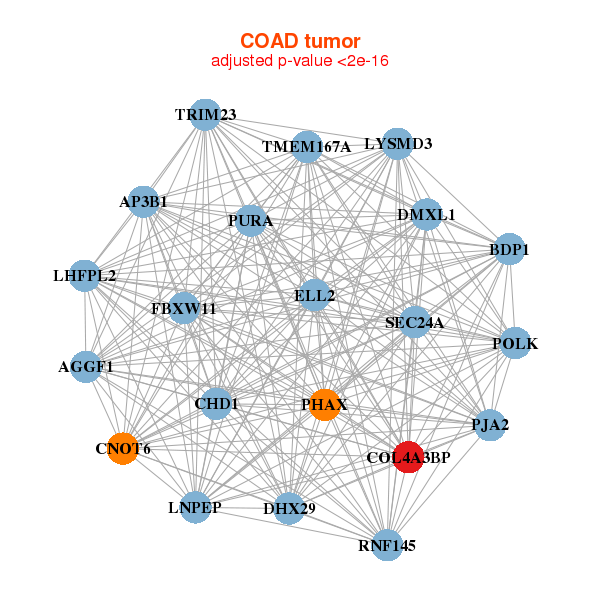
| * Co-Expression network figures were drawn using R package igraph. Only the top 20 genes with the highest correlations were shown. Red circle: input gene, orange circle: cell metabolism gene, sky circle: other gene |
: Open all plots for all cancer types
 |
|
| AFF4,AGGF1,APC,COL4A3BP,DMXL1,ERBB2IP,FBXL17, FCHO2,IPO11,LYSMD3,MFAP3,PGGT1B,PJA2,POLK, SCAMP1,SLC25A46,SLC30A5,SMAD5,TNPO1,TRIM23,ZFYVE16 | ACER3,ANO6,GPATCH11,COL4A3BP,CRYBG3,DDHD2,EIF4EBP2, FERMT2,GNAI1,JAK1,MDFIC,MTMR10,PCYOX1,PDE8A, PEX19,PPP2R5A,RRAGC,SIK2,SLC25A16,SORT1,UBA2 |
 |
|
| AGGF1,AP3B1,BDP1,CHD1,CNOT6,COL4A3BP,DHX29, DMXL1,ELL2,FBXW11,LHFPL2,LNPEP,LYSMD3,PHAX, PJA2,POLK,PURA,RNF145,SEC24A,TMEM167A,TRIM23 | BTBD7,COL4A3BP,DDX6,DNAJC13,FBXO11,FBXW11,GLG1, IPO8,JAK1,GLTSCR1L,KIAA0430,KIDINS220,KIF1B,LOC647979, MKLN1,KAT7,PHF3,PUM2,RPRD2,SIN3A,TNRC6B |
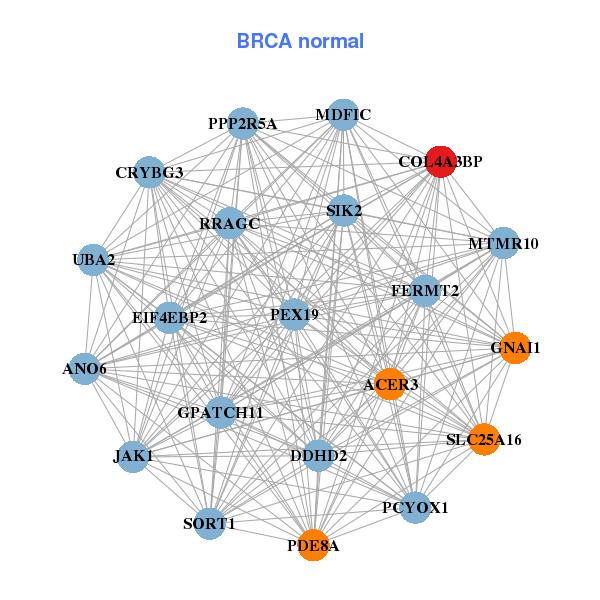
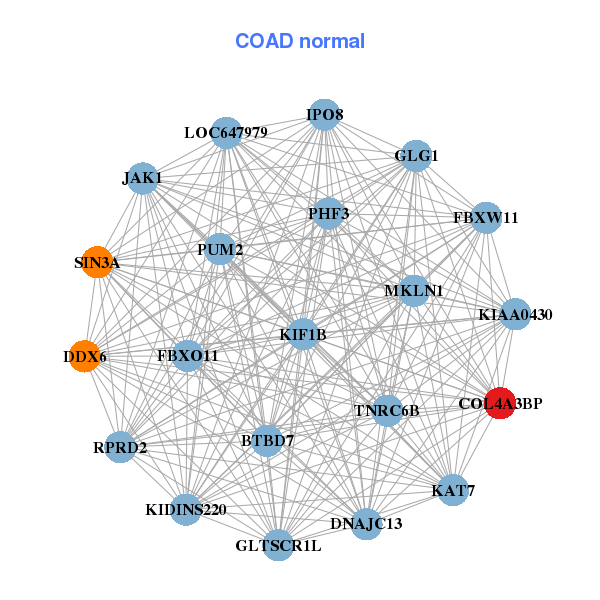
| * Co-Expression network figures were drawn using R package igraph. Only the top 20 genes with the highest correlations were shown. Red circle: input gene, orange circle: cell metabolism gene, sky circle: other gene |
: Open all plots for all cancer types
| Top |
: Open all interacting genes' information including KEGG pathway for all interacting genes from DAVID
| Top |
| Pharmacological Information for COL4A3BP |
| There's no related Drug. |
| Top |
| Cross referenced IDs for COL4A3BP |
| * We obtained these cross-references from Uniprot database. It covers 150 different DBs, 18 categories. http://www.uniprot.org/help/cross_references_section |
: Open all cross reference information
|
Copyright © 2016-Present - The Univsersity of Texas Health Science Center at Houston @ |