|
||||||||||||||||||||||||||||||||||||||||||||||||||||||||||||||||||||||||||||||||||||||||||||||||||||||||||||||||||||||||||||||||||||||||||||||||||||||||||||||||||||||||||||||||||||||||||||||||||||||||||||||||||||||||||||||||||||||||||||||||||||||||||||||||||||||||||||||||||||||||||||||||||||||||||||||||||||||||||
| |
| Phenotypic Information (metabolism pathway, cancer, disease, phenome) |
| |
| |
| Gene-Gene Network Information: Co-Expression Network, Interacting Genes & KEGG |
| |
|


| Gene Summary for GLIPR1 |
| Basic gene info. | Gene symbol | GLIPR1 |
| Gene name | GLI pathogenesis-related 1 | |
| Synonyms | CRISP7|GLIPR|RTVP1 | |
| Cytomap | UCSC genome browser: 12q21.2 | |
| Genomic location | chr12 :75874512-75895716 | |
| Type of gene | protein-coding | |
| RefGenes | NM_006851.2, | |
| Ensembl id | ENSG00000139278 | |
| Description | GLI pathogenesis-related 1 (glioma)gliPR 1glioma pathogenesis-related protein 1protein RTVP-1related to testis-specific, vespid, and pathogenesis proteins 1testes-specific vespid and pathogenesis protein 1 | |
| Modification date | 20141207 | |
| dbXrefs | MIM : 602692 | |
| HGNC : HGNC | ||
| HPRD : 04071 | ||
| Protein | UniProt: P48060 go to UniProt's Cross Reference DB Table | |
| Expression | CleanEX: HS_GLIPR1 | |
| BioGPS: 11010 | ||
| Gene Expression Atlas: ENSG00000139278 | ||
| The Human Protein Atlas: ENSG00000139278 | ||
| Pathway | NCI Pathway Interaction Database: GLIPR1 | |
| KEGG: GLIPR1 | ||
| REACTOME: GLIPR1 | ||
| ConsensusPathDB | ||
| Pathway Commons: GLIPR1 | ||
| Metabolism | MetaCyc: GLIPR1 | |
| HUMANCyc: GLIPR1 | ||
| Regulation | Ensembl's Regulation: ENSG00000139278 | |
| miRBase: chr12 :75,874,512-75,895,716 | ||
| TargetScan: NM_006851 | ||
| cisRED: ENSG00000139278 | ||
| Context | iHOP: GLIPR1 | |
| cancer metabolism search in PubMed: GLIPR1 | ||
| UCL Cancer Institute: GLIPR1 | ||
| Assigned class in ccmGDB | B - This gene belongs to cancer gene. | |
| Top |
| Phenotypic Information for GLIPR1(metabolism pathway, cancer, disease, phenome) |
| Cancer | CGAP: GLIPR1 |
| Familial Cancer Database: GLIPR1 | |
| * This gene is included in those cancer gene databases. |
|
|
|
|
|
| . | ||||||||||||||||||||||||||||||||||||||||||||||||||||||||||||||||||||||||||||||||||||||||||||||||||||||||||||||||||||||||||||||||||||||||||||||||||||||||||||||||||||||||||||||||||||||||||||||||||||||||||||||||||||||||||||||||||||||||||||||||||||||||||||||||||||||||||||||||||||||||||||||||||||||||||||||||||||
Oncogene 1 | Significant driver gene in | |||||||||||||||||||||||||||||||||||||||||||||||||||||||||||||||||||||||||||||||||||||||||||||||||||||||||||||||||||||||||||||||||||||||||||||||||||||||||||||||||||||||||||||||||||||||||||||||||||||||||||||||||||||||||||||||||||||||||||||||||||||||||||||||||||||||||||||||||||||||||||||||||||||||||||||||||||||||||
| cf) number; DB name 1 Oncogene; http://nar.oxfordjournals.org/content/35/suppl_1/D721.long, 2 Tumor Suppressor gene; https://bioinfo.uth.edu/TSGene/, 3 Cancer Gene Census; http://www.nature.com/nrc/journal/v4/n3/abs/nrc1299.html, 4 CancerGenes; http://nar.oxfordjournals.org/content/35/suppl_1/D721.long, 5 Network of Cancer Gene; http://ncg.kcl.ac.uk/index.php, 1Therapeutic Vulnerabilities in Cancer; http://cbio.mskcc.org/cancergenomics/statius/ |
| REACTOME_METABOLISM_OF_LIPIDS_AND_LIPOPROTEINS | |
| OMIM | 602692; gene. |
| Orphanet | |
| Disease | KEGG Disease: GLIPR1 |
| MedGen: GLIPR1 (Human Medical Genetics with Condition) | |
| ClinVar: GLIPR1 | |
| Phenotype | MGI: GLIPR1 (International Mouse Phenotyping Consortium) |
| PhenomicDB: GLIPR1 | |
| Mutations for GLIPR1 |
| * Under tables are showing count per each tissue to give us broad intuition about tissue specific mutation patterns.You can go to the detailed page for each mutation database's web site. |
| There's no structural variation information in COSMIC data for this gene. |
| * From mRNA Sanger sequences, Chitars2.0 arranged chimeric transcripts. This table shows GLIPR1 related fusion information. |
| ID | Head Gene | Tail Gene | Accession | Gene_a | qStart_a | qEnd_a | Chromosome_a | tStart_a | tEnd_a | Gene_a | qStart_a | qEnd_a | Chromosome_a | tStart_a | tEnd_a |
| Top |
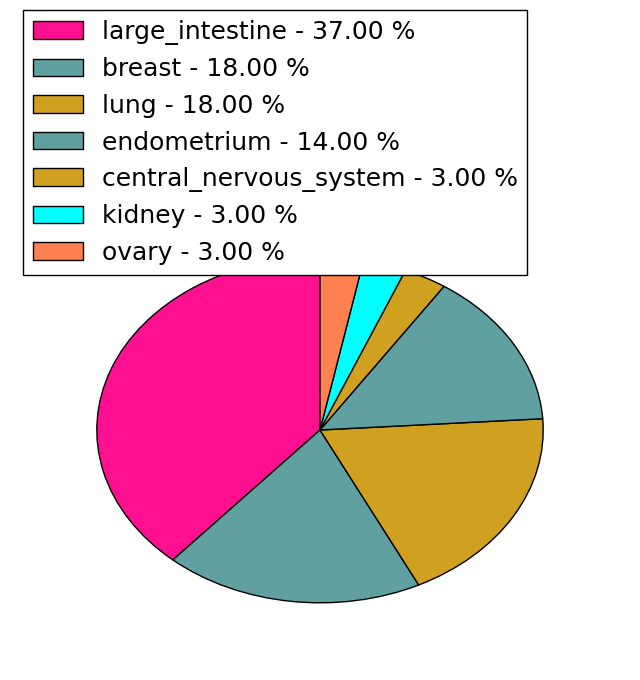
| Mutation type/ Tissue ID | brca | cns | cerv | endome | haematopo | kidn | Lintest | liver | lung | ns | ovary | pancre | prost | skin | stoma | thyro | urina | |||
| Total # sample | 1 | 1 | 1 | |||||||||||||||||
| GAIN (# sample) | 1 | 1 | 1 | |||||||||||||||||
| LOSS (# sample) |
| cf) Tissue ID; Tissue type (1; Breast, 2; Central_nervous_system, 3; Cervix, 4; Endometrium, 5; Haematopoietic_and_lymphoid_tissue, 6; Kidney, 7; Large_intestine, 8; Liver, 9; Lung, 10; NS, 11; Ovary, 12; Pancreas, 13; Prostate, 14; Skin, 15; Stomach, 16; Thyroid, 17; Urinary_tract) |
| Top |
|
 |
| Top |
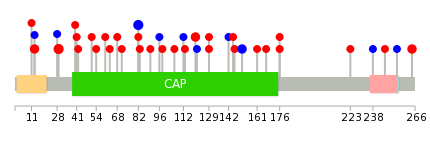
| Stat. for Non-Synonymous SNVs (# total SNVs=27) | (# total SNVs=11) |
 |  |
(# total SNVs=0) | (# total SNVs=2) |
 |
| Top |
| * When you move the cursor on each content, you can see more deailed mutation information on the Tooltip. Those are primary_site,primary_histology,mutation(aa),pubmedID. |
| GRCh37 position | Mutation(aa) | Unique sampleID count |
| chr12:75874745-75874745 | p.E29K | 3 |
| chr12:75875683-75875683 | p.R82R | 3 |
| chr12:75875797-75875797 | p.E120K | 2 |
| chr12:75892747-75892747 | p.L264I | 2 |
| chr12:75874698-75874698 | p.S13Y | 2 |
| chr12:75884218-75884218 | p.C151C | 2 |
| chr12:75874775-75874775 | p.R39* | 1 |
| chr12:75884291-75884291 | p.G176R | 1 |
| chr12:75875685-75875685 | p.R82R | 1 |
| chr12:75875802-75875802 | p.I121I | 1 |
| Top |
|
 |
| Point Mutation/ Tissue ID | 1 | 2 | 3 | 4 | 5 | 6 | 7 | 8 | 9 | 10 | 11 | 12 | 13 | 14 | 15 | 16 | 17 | 18 | 19 | 20 |
| # sample | 1 | 2 | 5 | 1 | 2 | 2 | 6 | 1 | 8 | 1 | 7 | |||||||||
| # mutation | 1 | 2 | 5 | 1 | 2 | 2 | 6 | 1 | 6 | 1 | 7 | |||||||||
| nonsynonymous SNV | 1 | 2 | 4 | 1 | 2 | 1 | 5 | 1 | 5 | 1 | 4 | |||||||||
| synonymous SNV | 1 | 1 | 1 | 1 | 3 |
| cf) Tissue ID; Tissue type (1; BLCA[Bladder Urothelial Carcinoma], 2; BRCA[Breast invasive carcinoma], 3; CESC[Cervical squamous cell carcinoma and endocervical adenocarcinoma], 4; COAD[Colon adenocarcinoma], 5; GBM[Glioblastoma multiforme], 6; Glioma Low Grade, 7; HNSC[Head and Neck squamous cell carcinoma], 8; KICH[Kidney Chromophobe], 9; KIRC[Kidney renal clear cell carcinoma], 10; KIRP[Kidney renal papillary cell carcinoma], 11; LAML[Acute Myeloid Leukemia], 12; LUAD[Lung adenocarcinoma], 13; LUSC[Lung squamous cell carcinoma], 14; OV[Ovarian serous cystadenocarcinoma ], 15; PAAD[Pancreatic adenocarcinoma], 16; PRAD[Prostate adenocarcinoma], 17; SKCM[Skin Cutaneous Melanoma], 18:STAD[Stomach adenocarcinoma], 19:THCA[Thyroid carcinoma], 20:UCEC[Uterine Corpus Endometrial Carcinoma]) |
| Top |
| * We represented just top 10 SNVs. When you move the cursor on each content, you can see more deailed mutation information on the Tooltip. Those are primary_site, primary_histology, mutation(aa), pubmedID. |
| Genomic Position | Mutation(aa) | Unique sampleID count |
| chr12:75874745 | p.E29K | 3 |
| chr12:75875797 | p.E120K | 2 |
| chr12:75884247 | p.A63P | 1 |
| chr12:75874782 | p.S146G | 1 |
| chr12:75875733 | p.A68V | 1 |
| chr12:75884265 | p.C151C | 1 |
| chr12:75874820 | p.W71R | 1 |
| chr12:75875739 | p.G161V | 1 |
| chr12:75884292 | p.Q76K | 1 |
| chr12:75875617 | p.N167S | 1 |
| * Copy number data were extracted from TCGA using R package TCGA-Assembler. The URLs of all public data files on TCGA DCC data server were gathered on Jan-05-2015. Function ProcessCNAData in TCGA-Assembler package was used to obtain gene-level copy number value which is calculated as the average copy number of the genomic region of a gene. |
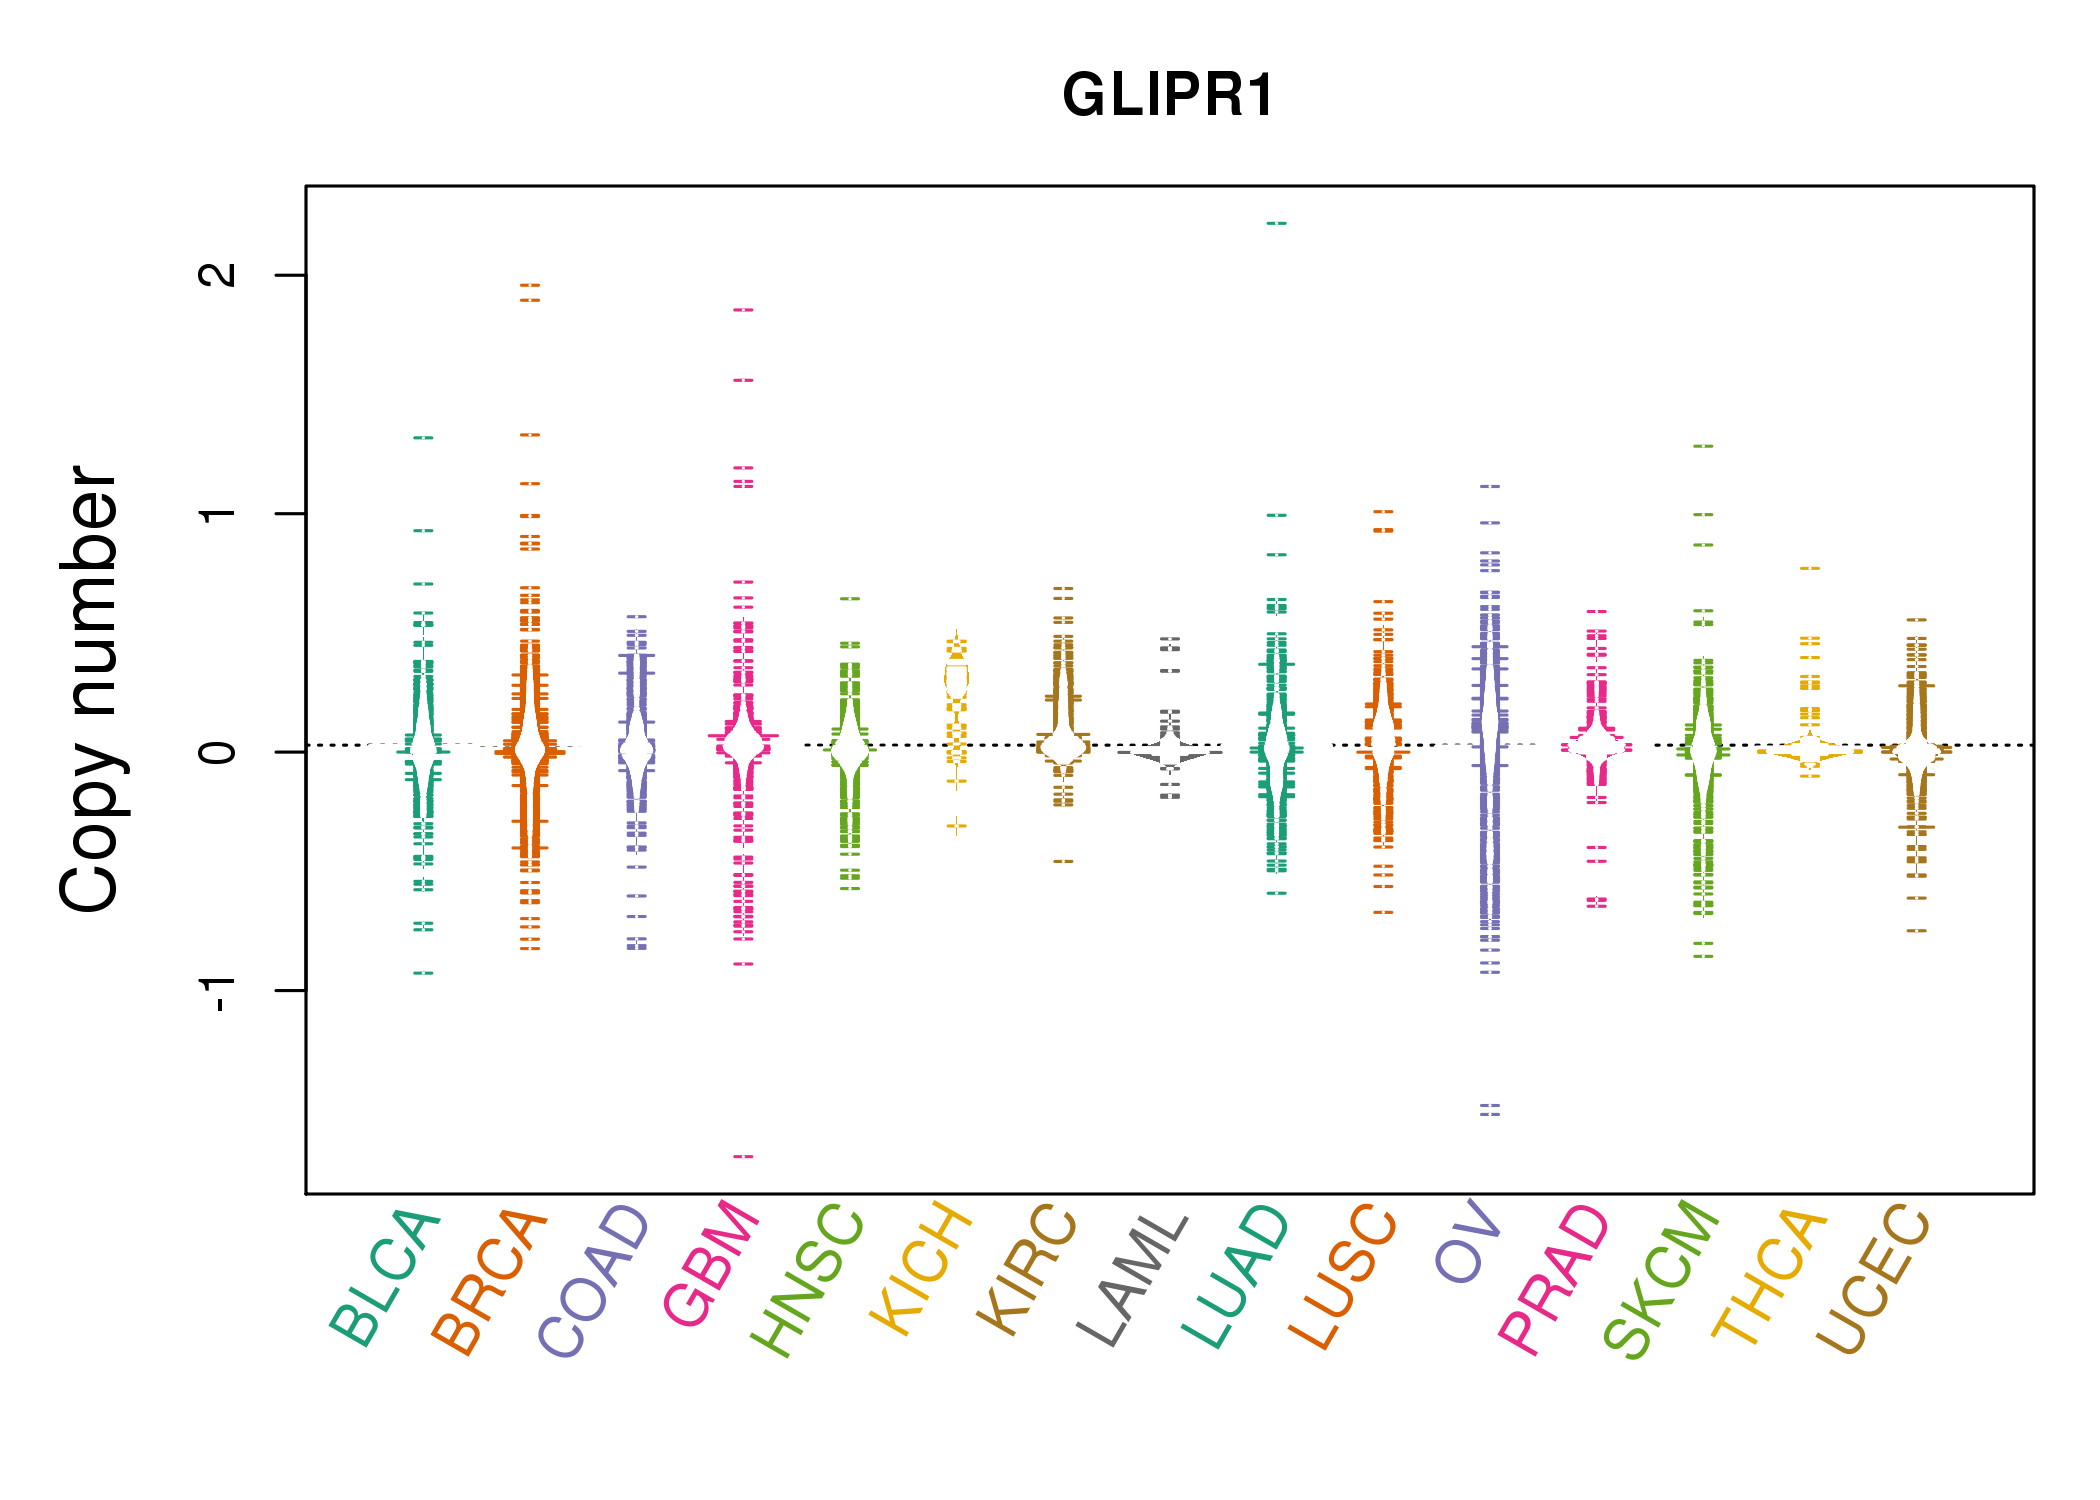 |
| cf) Tissue ID[Tissue type]: BLCA[Bladder Urothelial Carcinoma], BRCA[Breast invasive carcinoma], CESC[Cervical squamous cell carcinoma and endocervical adenocarcinoma], COAD[Colon adenocarcinoma], GBM[Glioblastoma multiforme], Glioma Low Grade, HNSC[Head and Neck squamous cell carcinoma], KICH[Kidney Chromophobe], KIRC[Kidney renal clear cell carcinoma], KIRP[Kidney renal papillary cell carcinoma], LAML[Acute Myeloid Leukemia], LUAD[Lung adenocarcinoma], LUSC[Lung squamous cell carcinoma], OV[Ovarian serous cystadenocarcinoma ], PAAD[Pancreatic adenocarcinoma], PRAD[Prostate adenocarcinoma], SKCM[Skin Cutaneous Melanoma], STAD[Stomach adenocarcinoma], THCA[Thyroid carcinoma], UCEC[Uterine Corpus Endometrial Carcinoma] |
| Top |
| Gene Expression for GLIPR1 |
| * CCLE gene expression data were extracted from CCLE_Expression_Entrez_2012-10-18.res: Gene-centric RMA-normalized mRNA expression data. |
 |
| * Normalized gene expression data of RNASeqV2 was extracted from TCGA using R package TCGA-Assembler. The URLs of all public data files on TCGA DCC data server were gathered at Jan-05-2015. Only eight cancer types have enough normal control samples for differential expression analysis. (t test, adjusted p<0.05 (using Benjamini-Hochberg FDR)) |
 |
| Top |
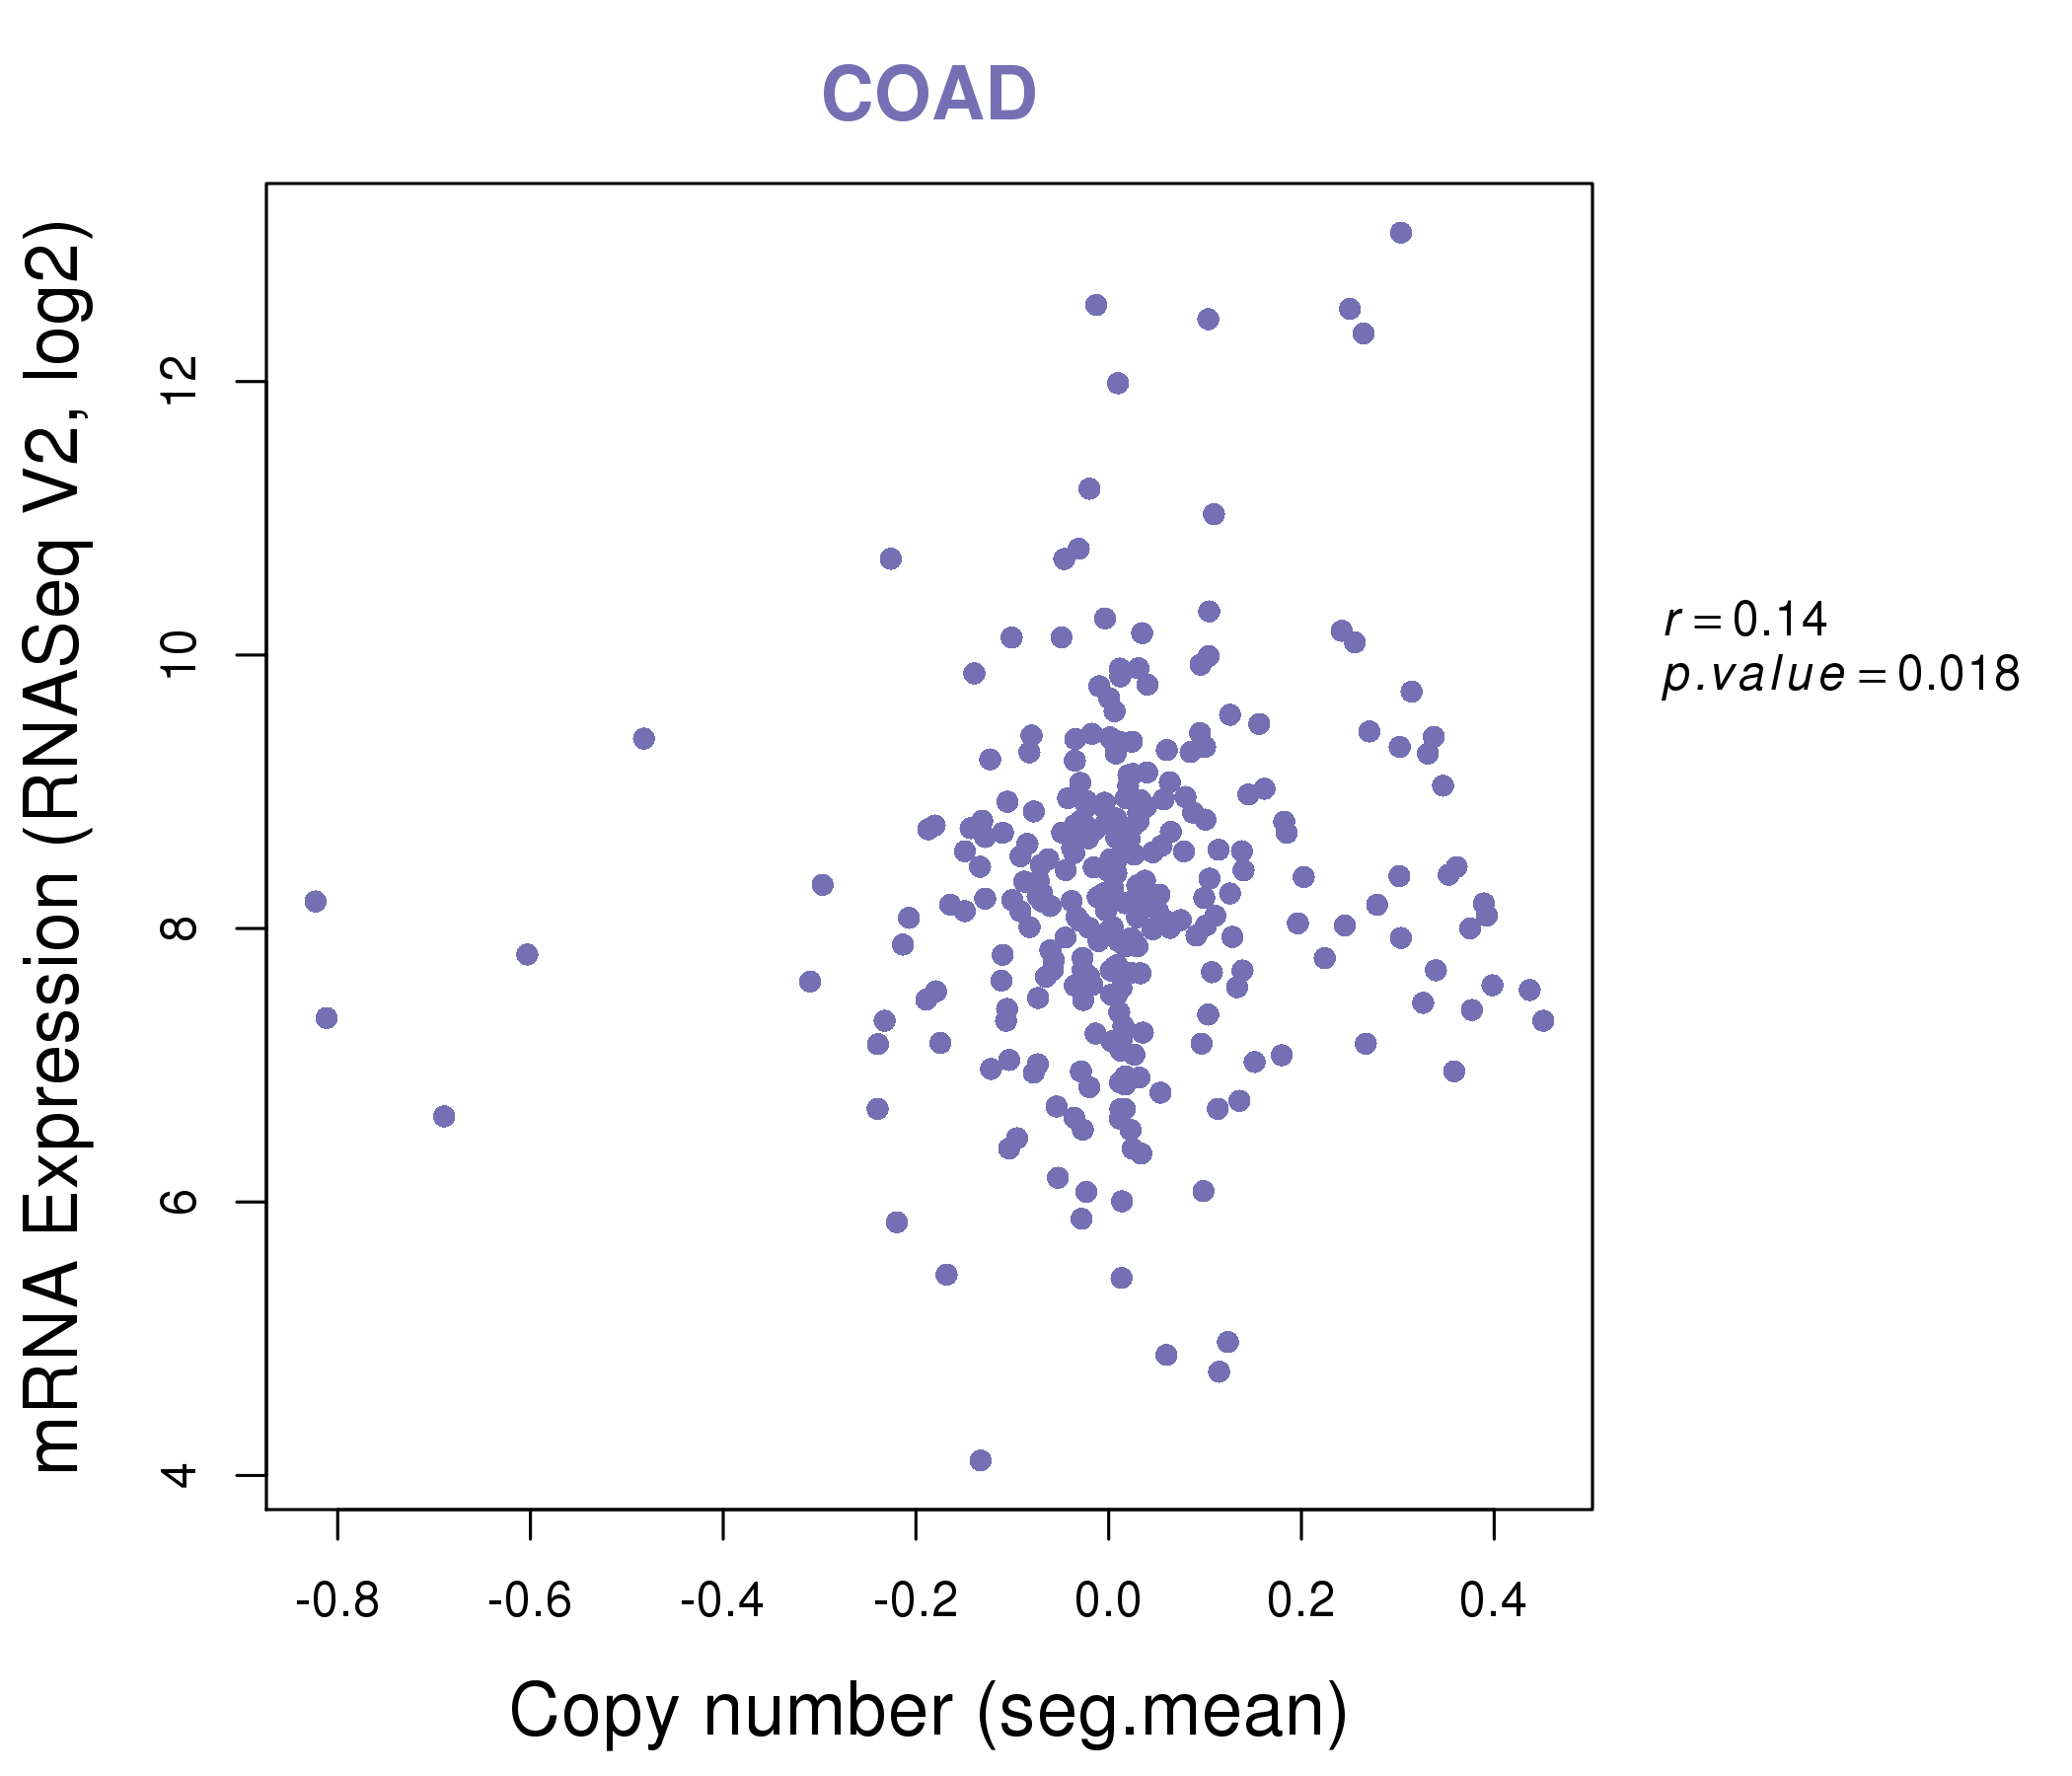
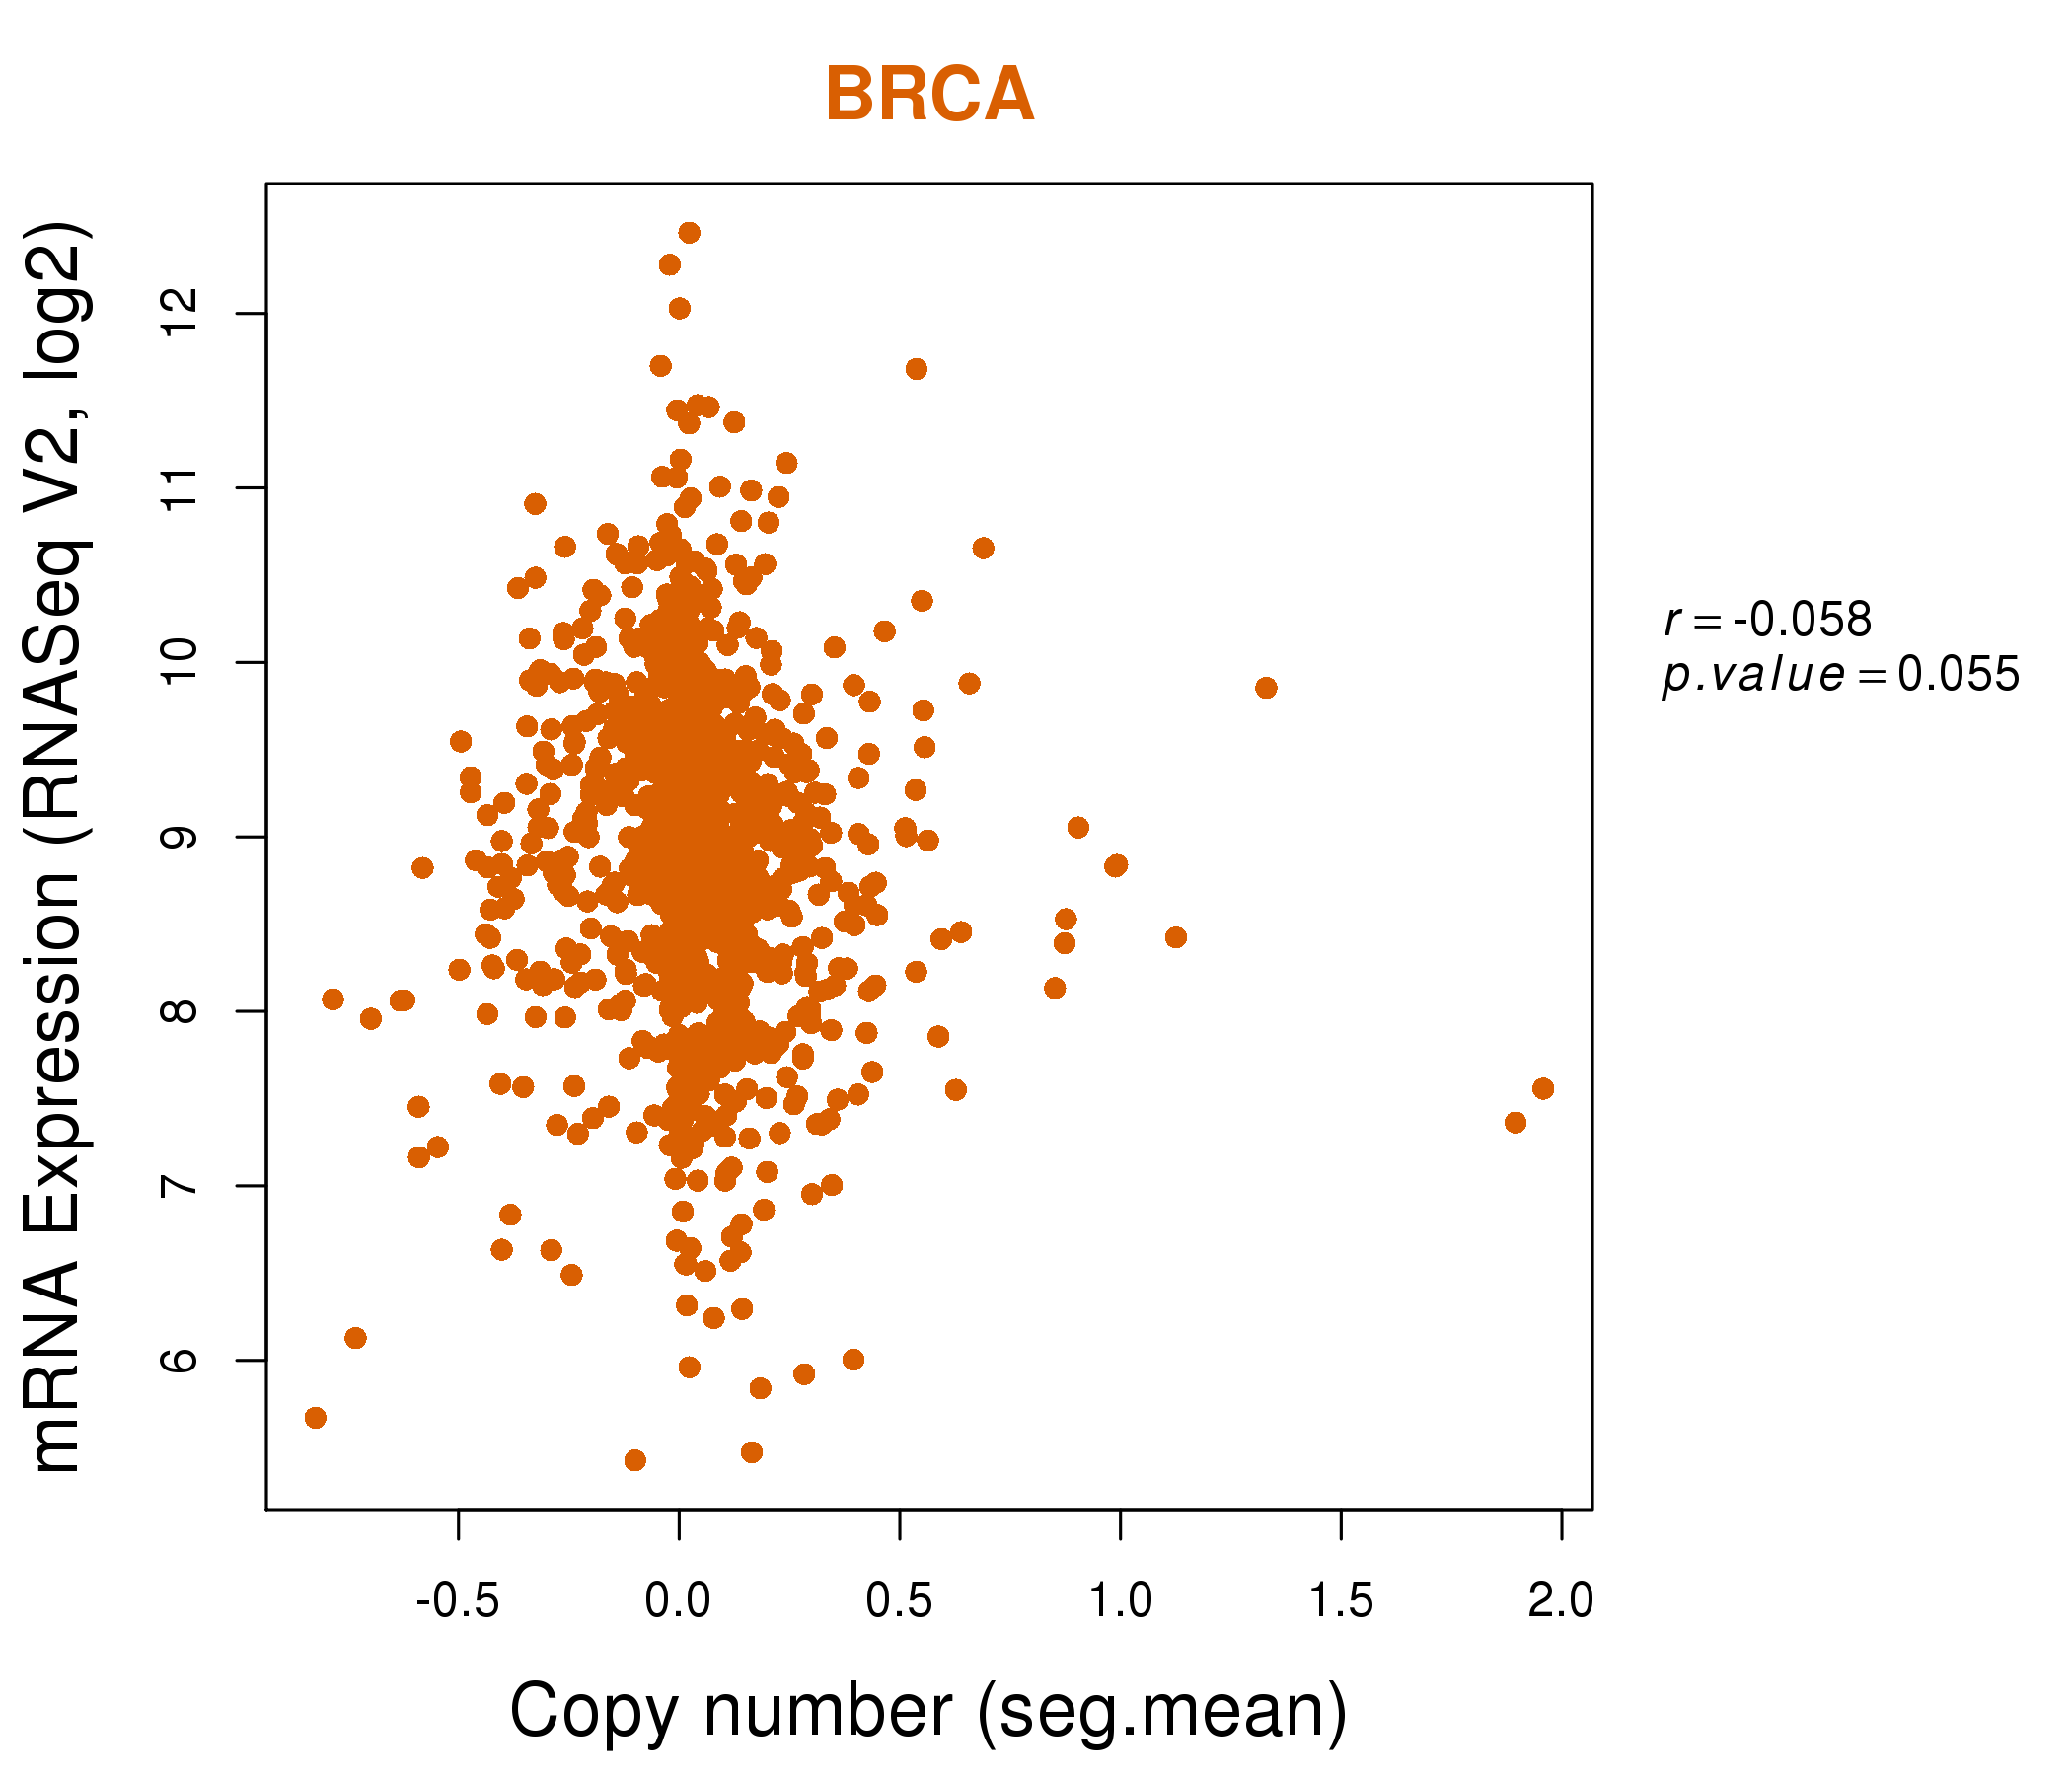
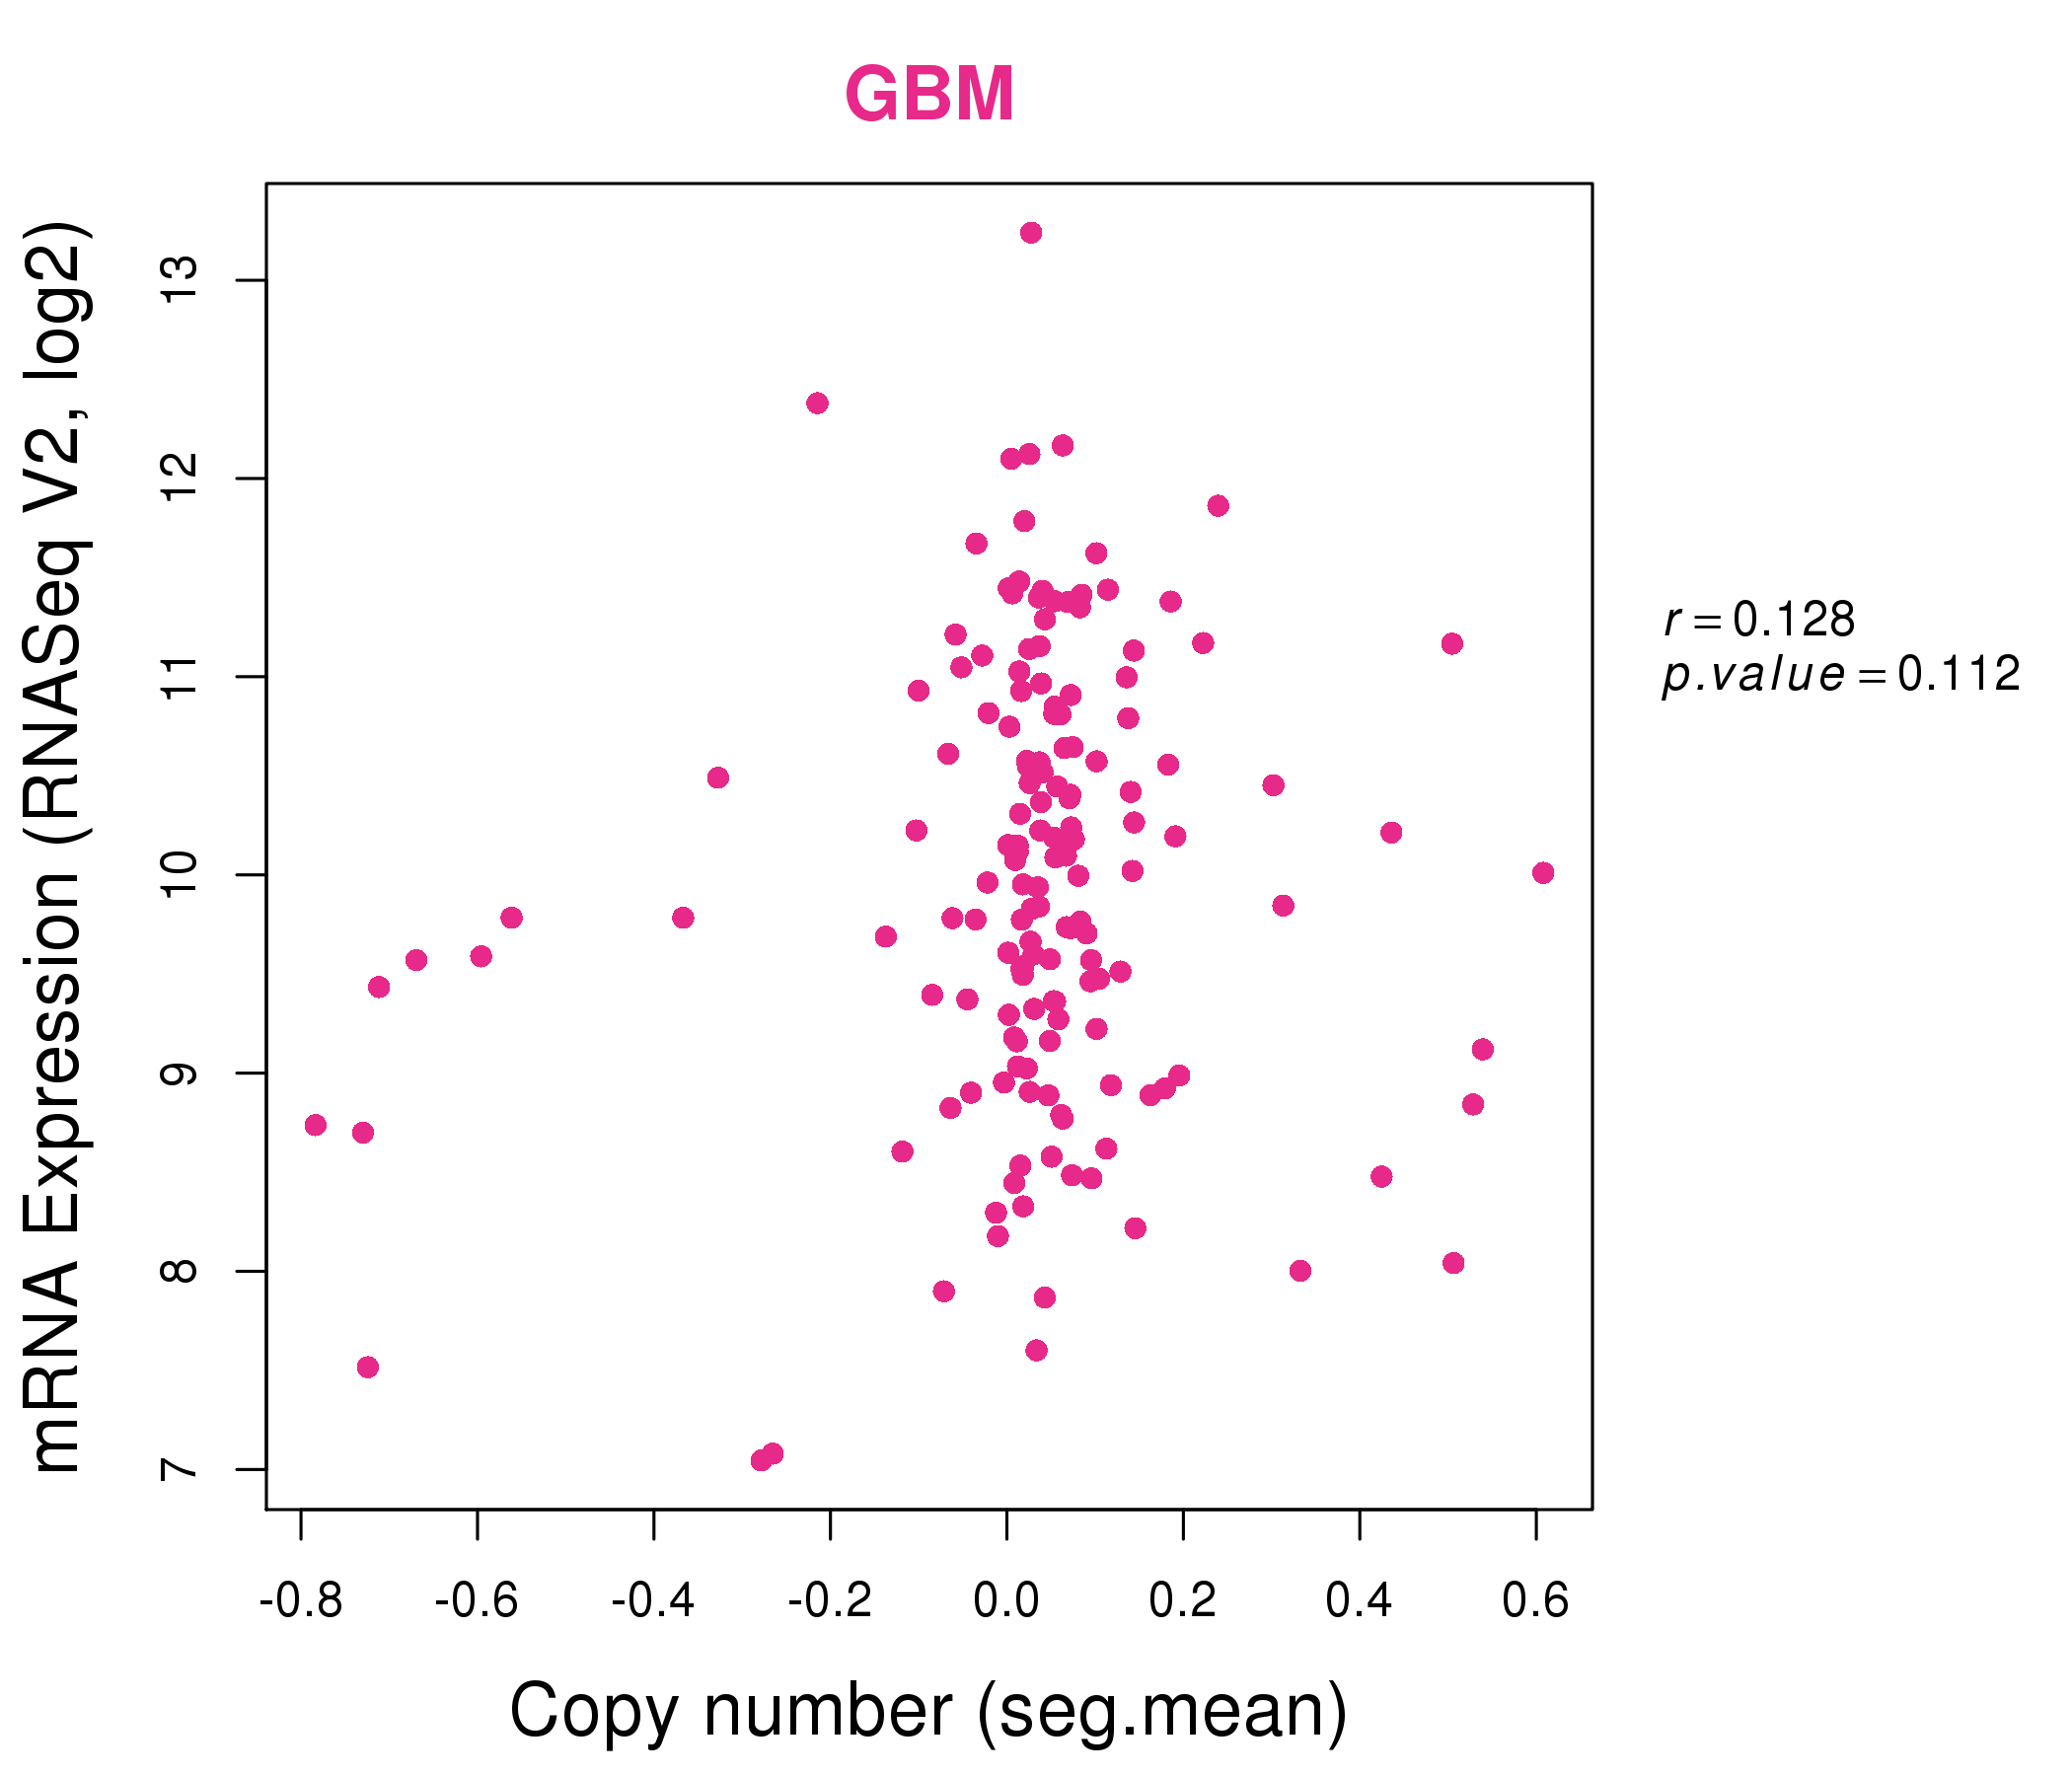
| * This plots show the correlation between CNV and gene expression. |
: Open all plots for all cancer types
 |
|
 |
|
| Top |
| Gene-Gene Network Information |
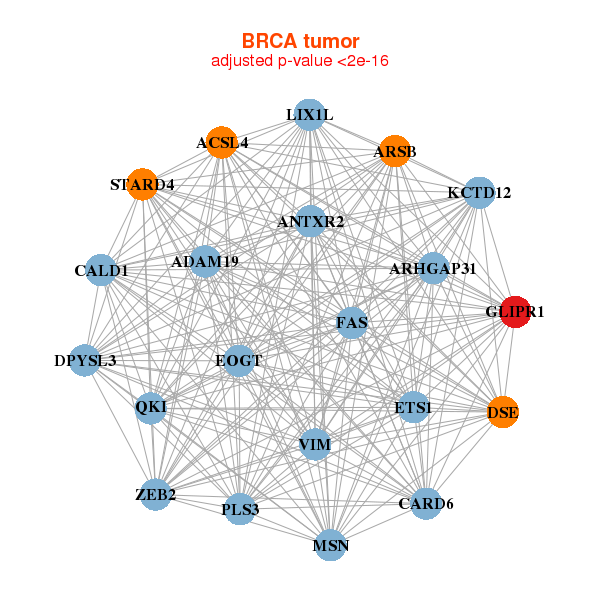
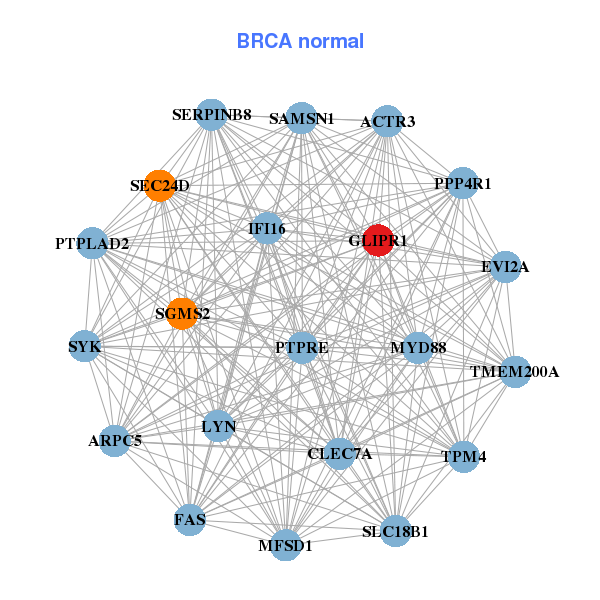
| * Co-Expression network figures were drawn using R package igraph. Only the top 20 genes with the highest correlations were shown. Red circle: input gene, orange circle: cell metabolism gene, sky circle: other gene |
: Open all plots for all cancer types
 |
|
| ACSL4,ADAM19,ANTXR2,ARHGAP31,ARSB,EOGT,CALD1, CARD6,DPYSL3,DSE,ETS1,FAS,GLIPR1,KCTD12, LIX1L,MSN,PLS3,QKI,STARD4,VIM,ZEB2 | ACTR3,ARPC5,SLC18B1,CLEC7A,EVI2A,FAS,GLIPR1, IFI16,LYN,MFSD1,MYD88,PPP4R1,PTPLAD2,PTPRE, SAMSN1,SEC24D,SERPINB8,SGMS2,SYK,TMEM200A,TPM4 |
 |
|
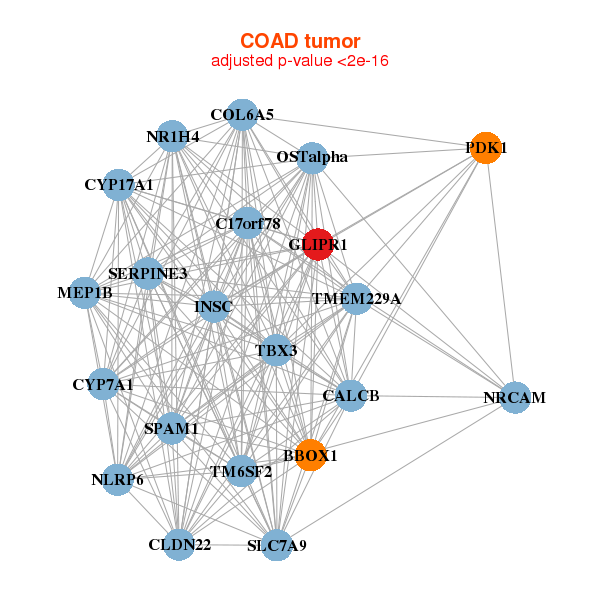
| BBOX1,C17orf78,CALCB,CLDN22,COL6A5,CYP17A1,CYP7A1, GLIPR1,INSC,MEP1B,NLRP6,NR1H4,NRCAM,OSTalpha, PDK1,SERPINE3,SLC7A9,SPAM1,TBX3,TM6SF2,TMEM229A | ANXA1,BBS4,C11orf73,FAM216A,C1orf54,C20orf27,CAMK1, CYB5R1,FAM92A1,GLIPR1,GNG11,IGFBP7,IKBIP,ITGB1BP1, MPV17,PPT1,SGTB,SNAPIN,TMSB15B,TRMT112,TTC8 |
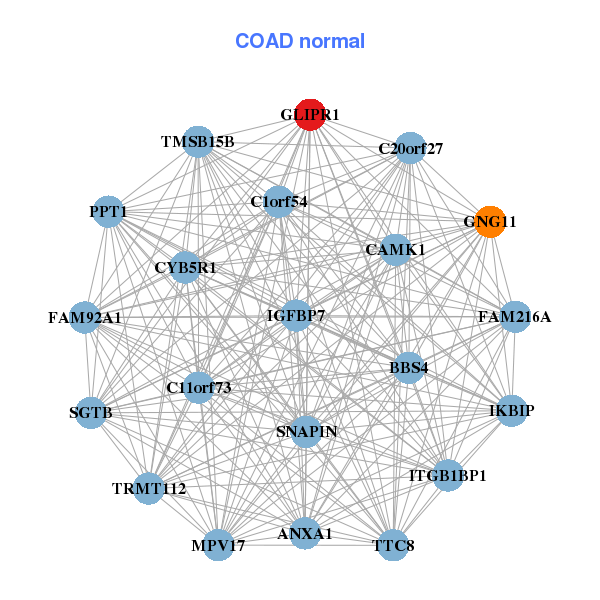
| * Co-Expression network figures were drawn using R package igraph. Only the top 20 genes with the highest correlations were shown. Red circle: input gene, orange circle: cell metabolism gene, sky circle: other gene |
: Open all plots for all cancer types
| Top |
: Open all interacting genes' information including KEGG pathway for all interacting genes from DAVID
| Top |
| Pharmacological Information for GLIPR1 |
| There's no related Drug. |
| Top |
| Cross referenced IDs for GLIPR1 |
| * We obtained these cross-references from Uniprot database. It covers 150 different DBs, 18 categories. http://www.uniprot.org/help/cross_references_section |
: Open all cross reference information
|
Copyright © 2016-Present - The Univsersity of Texas Health Science Center at Houston @ |