|
||||||||||||||||||||||||||||||||||||||||||||||||||||||||||||||||||||||||||||||||||||||||||||||||||||||||||||||||||||||||||||||||||||||||||||||||||||||||||||||||||||||||||||||||||||||||||||||||||||||||||||||||||||||||||||||||||||||||||||||||||||||||||||||||||||||||||||||||||||||||||||||||||||||||||||||||||||||||||
| |
| Phenotypic Information (metabolism pathway, cancer, disease, phenome) |
| |
| |
| Gene-Gene Network Information: Co-Expression Network, Interacting Genes & KEGG |
| |
|


| Gene Summary for VCAN |
| Basic gene info. | Gene symbol | VCAN |
| Gene name | versican | |
| Synonyms | CSPG2|ERVR|GHAP|PG-M|WGN|WGN1 | |
| Cytomap | UCSC genome browser: 5q14.3 | |
| Genomic location | chr5 :82767492-82878122 | |
| Type of gene | protein-coding | |
| RefGenes | NM_001126336.2, NM_001164097.1,NM_001164098.1,NM_004385.4, | |
| Ensembl id | ENSG00000038427 | |
| Description | chondroitin sulfate proteoglycan 2chondroitin sulfate proteoglycan core protein 2glial hyaluronate-binding proteinlarge fibroblast proteoglycanversican core proteinversican proteoglycan | |
| Modification date | 20141222 | |
| dbXrefs | MIM : 118661 | |
| HGNC : HGNC | ||
| Ensembl : ENSG00000038427 | ||
| HPRD : 00340 | ||
| Vega : OTTHUMG00000131321 | ||
| Protein | UniProt: P13611 go to UniProt's Cross Reference DB Table | |
| Expression | CleanEX: HS_VCAN | |
| BioGPS: 1462 | ||
| Gene Expression Atlas: ENSG00000038427 | ||
| The Human Protein Atlas: ENSG00000038427 | ||
| Pathway | NCI Pathway Interaction Database: VCAN | |
| KEGG: VCAN | ||
| REACTOME: VCAN | ||
| ConsensusPathDB | ||
| Pathway Commons: VCAN | ||
| Metabolism | MetaCyc: VCAN | |
| HUMANCyc: VCAN | ||
| Regulation | Ensembl's Regulation: ENSG00000038427 | |
| miRBase: chr5 :82,767,492-82,878,122 | ||
| TargetScan: NM_001126336 | ||
| cisRED: ENSG00000038427 | ||
| Context | iHOP: VCAN | |
| cancer metabolism search in PubMed: VCAN | ||
| UCL Cancer Institute: VCAN | ||
| Assigned class in ccmGDB | B - This gene belongs to cancer gene. | |
| Top |
| Phenotypic Information for VCAN(metabolism pathway, cancer, disease, phenome) |
| Cancer | CGAP: VCAN |
| Familial Cancer Database: VCAN | |
| * This gene is included in those cancer gene databases. |
|
|
|
|
|
| . | ||||||||||||||||||||||||||||||||||||||||||||||||||||||||||||||||||||||||||||||||||||||||||||||||||||||||||||||||||||||||||||||||||||||||||||||||||||||||||||||||||||||||||||||||||||||||||||||||||||||||||||||||||||||||||||||||||||||||||||||||||||||||||||||||||||||||||||||||||||||||||||||||||||||||||||||||||||
Oncogene 1 | Significant driver gene in | |||||||||||||||||||||||||||||||||||||||||||||||||||||||||||||||||||||||||||||||||||||||||||||||||||||||||||||||||||||||||||||||||||||||||||||||||||||||||||||||||||||||||||||||||||||||||||||||||||||||||||||||||||||||||||||||||||||||||||||||||||||||||||||||||||||||||||||||||||||||||||||||||||||||||||||||||||||||||
| cf) number; DB name 1 Oncogene; http://nar.oxfordjournals.org/content/35/suppl_1/D721.long, 2 Tumor Suppressor gene; https://bioinfo.uth.edu/TSGene/, 3 Cancer Gene Census; http://www.nature.com/nrc/journal/v4/n3/abs/nrc1299.html, 4 CancerGenes; http://nar.oxfordjournals.org/content/35/suppl_1/D721.long, 5 Network of Cancer Gene; http://ncg.kcl.ac.uk/index.php, 1Therapeutic Vulnerabilities in Cancer; http://cbio.mskcc.org/cancergenomics/statius/ |
| REACTOME_METABOLISM_OF_CARBOHYDRATES | |
| OMIM | 118661; gene. 143200; phenotype. |
| Orphanet | 898; Wagner disease. |
| Disease | KEGG Disease: VCAN |
| MedGen: VCAN (Human Medical Genetics with Condition) | |
| ClinVar: VCAN | |
| Phenotype | MGI: VCAN (International Mouse Phenotyping Consortium) |
| PhenomicDB: VCAN | |
| Mutations for VCAN |
| * Under tables are showing count per each tissue to give us broad intuition about tissue specific mutation patterns.You can go to the detailed page for each mutation database's web site. |
| - Statistics for Tissue and Mutation type | Top |
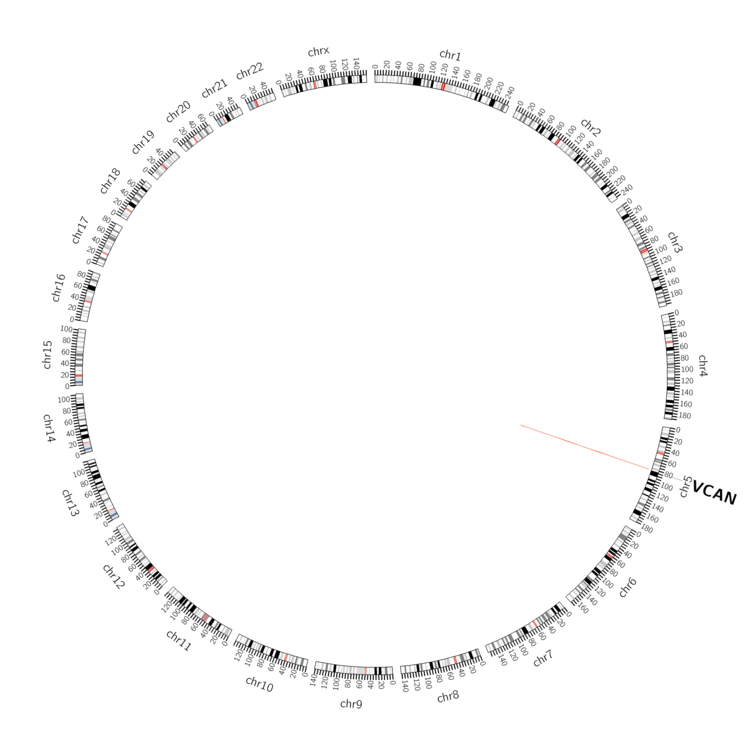 |
| - For Inter-chromosomal Variations |
| There's no inter-chromosomal structural variation. |
| - For Intra-chromosomal Variations |
| There's no intra-chromosomal structural variation. |
| Sample | Symbol_a | Chr_a | Start_a | End_a | Symbol_b | Chr_b | Start_b | End_b |
| ovary | VCAN | chr5 | 82873206 | 82873226 | VCAN | chr5 | 82873284 | 82873304 |
| pancreas | VCAN | chr5 | 82769383 | 82769403 | VCAN | chr5 | 82769477 | 82769497 |
| cf) Tissue number; Tissue name (1;Breast, 2;Central_nervous_system, 3;Haematopoietic_and_lymphoid_tissue, 4;Large_intestine, 5;Liver, 6;Lung, 7;Ovary, 8;Pancreas, 9;Prostate, 10;Skin, 11;Soft_tissue, 12;Upper_aerodigestive_tract) |
| * From mRNA Sanger sequences, Chitars2.0 arranged chimeric transcripts. This table shows VCAN related fusion information. |
| ID | Head Gene | Tail Gene | Accession | Gene_a | qStart_a | qEnd_a | Chromosome_a | tStart_a | tEnd_a | Gene_a | qStart_a | qEnd_a | Chromosome_a | tStart_a | tEnd_a |
| BP392190 | LGMN | 1 | 113 | 14 | 93176154 | 93178052 | VCAN | 113 | 501 | 5 | 82876748 | 82877136 | |
| AA234873 | VCAN | 1 | 205 | 5 | 82814674 | 82814878 | ST6GALNAC2 | 200 | 483 | 17 | 74562133 | 74563598 | |
| Top |
| Mutation type/ Tissue ID | brca | cns | cerv | endome | haematopo | kidn | Lintest | liver | lung | ns | ovary | pancre | prost | skin | stoma | thyro | urina | |||
| Total # sample | 1 | 1 | ||||||||||||||||||
| GAIN (# sample) | 1 | |||||||||||||||||||
| LOSS (# sample) | 1 |
| cf) Tissue ID; Tissue type (1; Breast, 2; Central_nervous_system, 3; Cervix, 4; Endometrium, 5; Haematopoietic_and_lymphoid_tissue, 6; Kidney, 7; Large_intestine, 8; Liver, 9; Lung, 10; NS, 11; Ovary, 12; Pancreas, 13; Prostate, 14; Skin, 15; Stomach, 16; Thyroid, 17; Urinary_tract) |
| Top |
|
 |
| Top |
| Stat. for Non-Synonymous SNVs (# total SNVs=401) | (# total SNVs=116) |
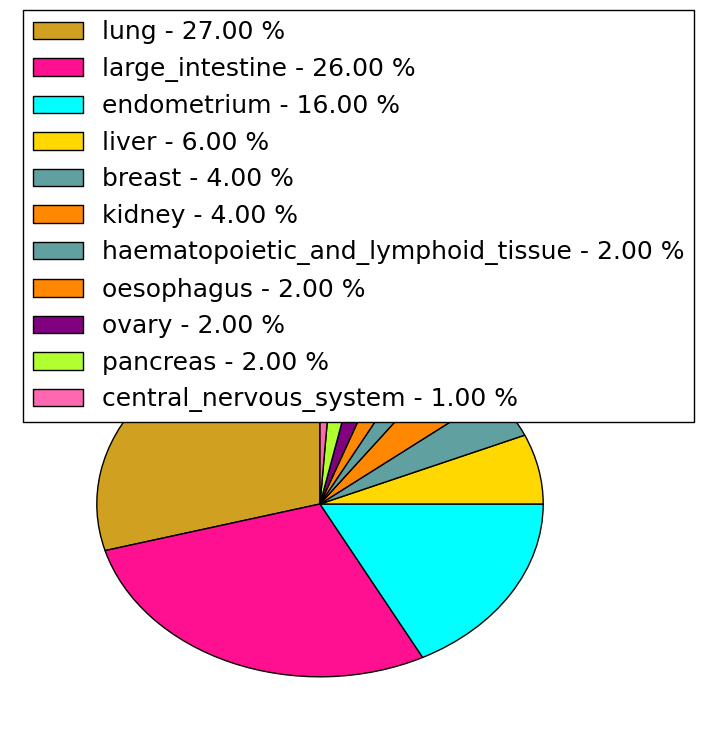 | 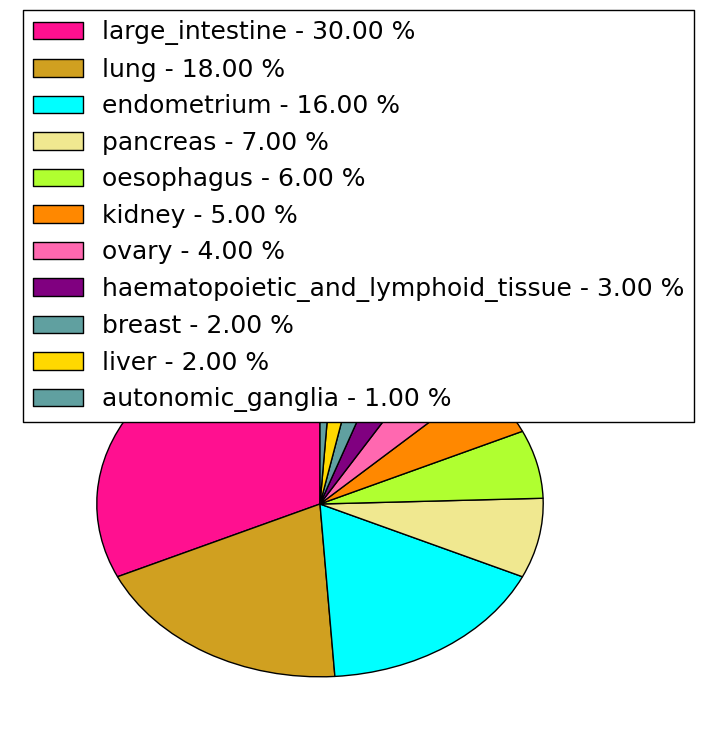 |
(# total SNVs=8) | (# total SNVs=4) |
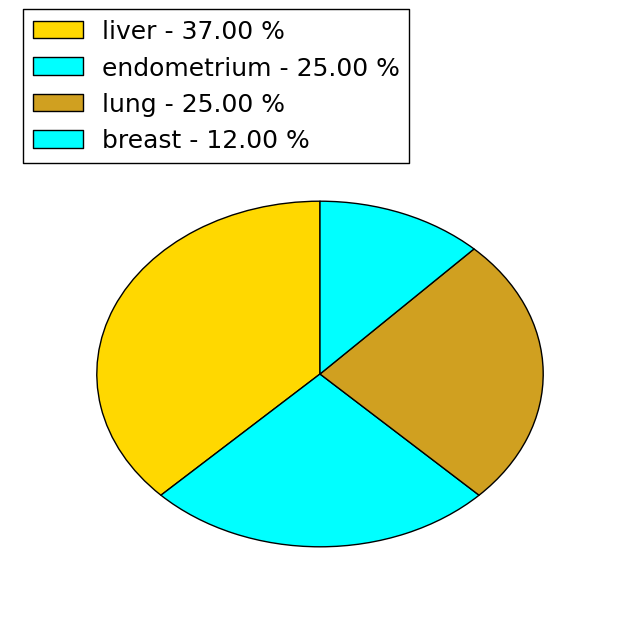 |  |
| Top |
| * When you move the cursor on each content, you can see more deailed mutation information on the Tooltip. Those are primary_site,primary_histology,mutation(aa),pubmedID. |
| GRCh37 position | Mutation(aa) | Unique sampleID count |
| chr5:82815203-82815203 | p.A360T | 4 |
| chr5:82875963-82875963 | p.K3349E | 3 |
| chr5:82836376-82836376 | p.G2518G | 3 |
| chr5:82817419-82817419 | p.I1098M | 3 |
| chr5:82817231-82817231 | p.P1036S | 3 |
| chr5:82817499-82817499 | p.R1125H | 3 |
| chr5:82834217-82834217 | p.L1799L | 3 |
| chr5:82836059-82836059 | p.E2413K | 3 |
| chr5:82834109-82834109 | p.T1763A | 3 |
| chr5:82849282-82849282 | p.R3198L | 2 |
| Top |
|
 |
| Point Mutation/ Tissue ID | 1 | 2 | 3 | 4 | 5 | 6 | 7 | 8 | 9 | 10 | 11 | 12 | 13 | 14 | 15 | 16 | 17 | 18 | 19 | 20 |
| # sample | 11 | 10 | 51 | 4 | 15 | 10 | 2 | 2 | 54 | 21 | 12 | 1 | 2 | 32 | 36 | 1 | 31 | |||
| # mutation | 13 | 10 | 90 | 4 | 15 | 10 | 2 | 2 | 71 | 27 | 12 | 1 | 2 | 47 | 53 | 1 | 71 | |||
| nonsynonymous SNV | 9 | 8 | 63 | 3 | 14 | 6 | 2 | 1 | 60 | 23 | 7 | 1 | 1 | 31 | 35 | 1 | 53 | |||
| synonymous SNV | 4 | 2 | 27 | 1 | 1 | 4 | 1 | 11 | 4 | 5 | 1 | 16 | 18 | 18 |
| cf) Tissue ID; Tissue type (1; BLCA[Bladder Urothelial Carcinoma], 2; BRCA[Breast invasive carcinoma], 3; CESC[Cervical squamous cell carcinoma and endocervical adenocarcinoma], 4; COAD[Colon adenocarcinoma], 5; GBM[Glioblastoma multiforme], 6; Glioma Low Grade, 7; HNSC[Head and Neck squamous cell carcinoma], 8; KICH[Kidney Chromophobe], 9; KIRC[Kidney renal clear cell carcinoma], 10; KIRP[Kidney renal papillary cell carcinoma], 11; LAML[Acute Myeloid Leukemia], 12; LUAD[Lung adenocarcinoma], 13; LUSC[Lung squamous cell carcinoma], 14; OV[Ovarian serous cystadenocarcinoma ], 15; PAAD[Pancreatic adenocarcinoma], 16; PRAD[Prostate adenocarcinoma], 17; SKCM[Skin Cutaneous Melanoma], 18:STAD[Stomach adenocarcinoma], 19:THCA[Thyroid carcinoma], 20:UCEC[Uterine Corpus Endometrial Carcinoma]) |
| Top |
| * We represented just top 10 SNVs. When you move the cursor on each content, you can see more deailed mutation information on the Tooltip. Those are primary_site, primary_histology, mutation(aa), pubmedID. |
| Genomic Position | Mutation(aa) | Unique sampleID count |
| chr5:82815203 | p.R1125H,VCAN | 3 |
| chr5:82817499 | p.A360T,VCAN | 3 |
| chr5:82834217 | p.L812L,VCAN | 3 |
| chr5:82836404 | p.F1219F,VCAN | 2 |
| chr5:82817945 | p.D1977N,VCAN | 2 |
| chr5:82816704 | p.S860I,VCAN | 2 |
| chr5:82815255 | p.R377K,VCAN | 2 |
| chr5:82834109 | p.S653L,VCAN | 2 |
| chr5:82843820 | p.R446Q,VCAN | 2 |
| chr5:82816285 | p.G290S,VCAN | 2 |
| * Copy number data were extracted from TCGA using R package TCGA-Assembler. The URLs of all public data files on TCGA DCC data server were gathered on Jan-05-2015. Function ProcessCNAData in TCGA-Assembler package was used to obtain gene-level copy number value which is calculated as the average copy number of the genomic region of a gene. |
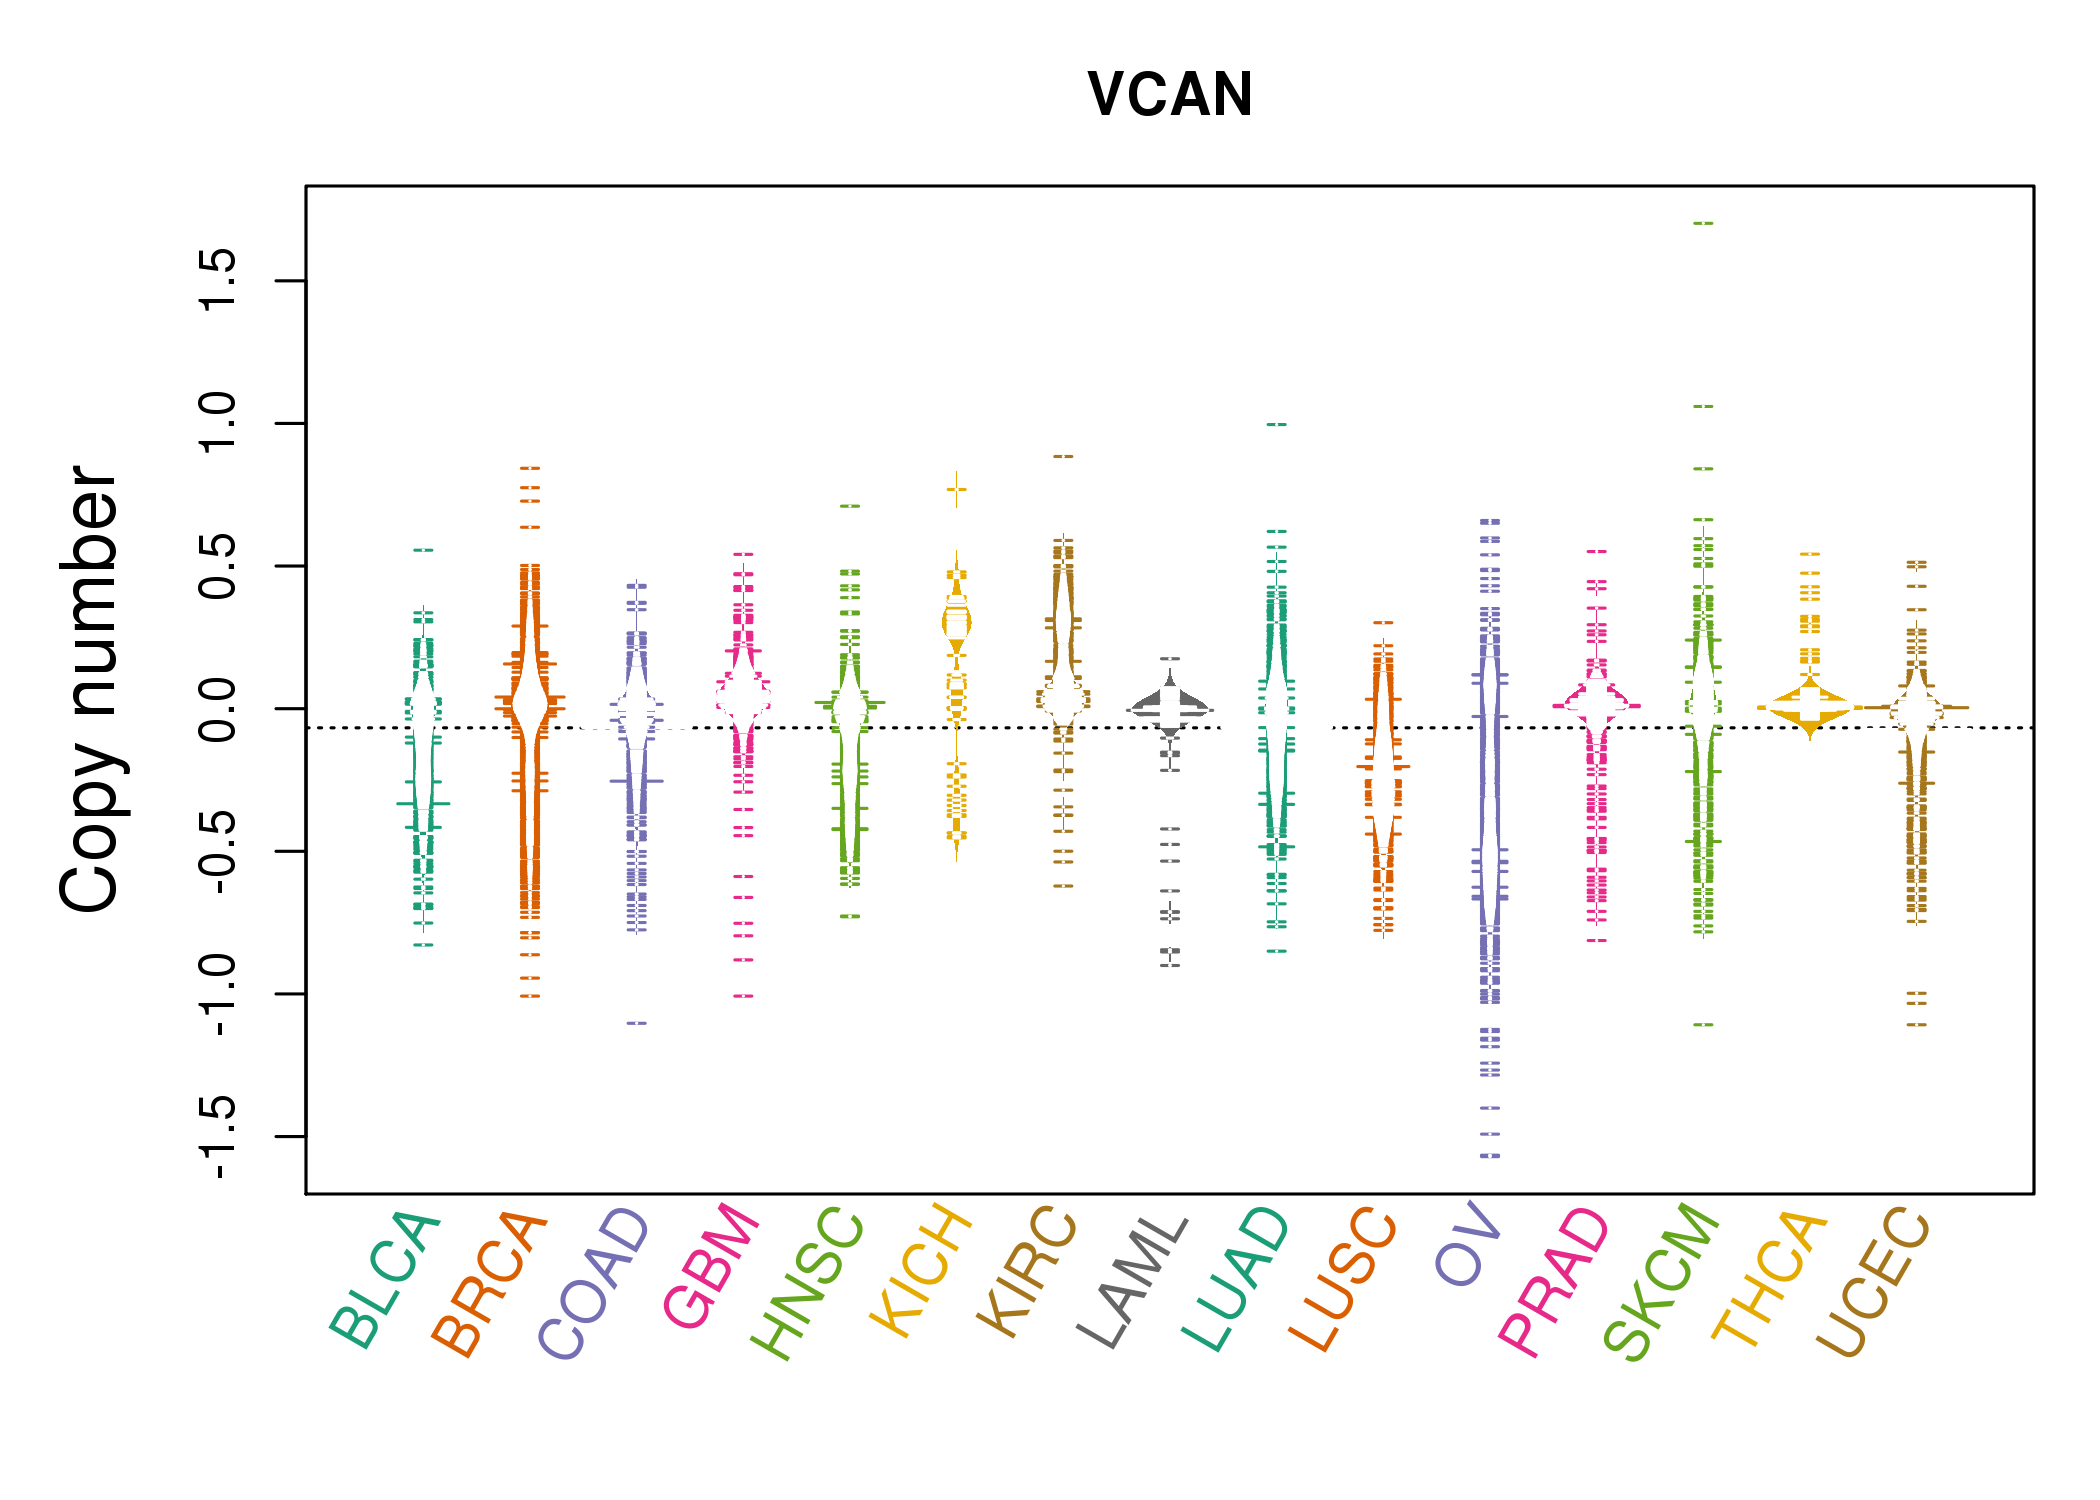 |
| cf) Tissue ID[Tissue type]: BLCA[Bladder Urothelial Carcinoma], BRCA[Breast invasive carcinoma], CESC[Cervical squamous cell carcinoma and endocervical adenocarcinoma], COAD[Colon adenocarcinoma], GBM[Glioblastoma multiforme], Glioma Low Grade, HNSC[Head and Neck squamous cell carcinoma], KICH[Kidney Chromophobe], KIRC[Kidney renal clear cell carcinoma], KIRP[Kidney renal papillary cell carcinoma], LAML[Acute Myeloid Leukemia], LUAD[Lung adenocarcinoma], LUSC[Lung squamous cell carcinoma], OV[Ovarian serous cystadenocarcinoma ], PAAD[Pancreatic adenocarcinoma], PRAD[Prostate adenocarcinoma], SKCM[Skin Cutaneous Melanoma], STAD[Stomach adenocarcinoma], THCA[Thyroid carcinoma], UCEC[Uterine Corpus Endometrial Carcinoma] |
| Top |
| Gene Expression for VCAN |
| * CCLE gene expression data were extracted from CCLE_Expression_Entrez_2012-10-18.res: Gene-centric RMA-normalized mRNA expression data. |
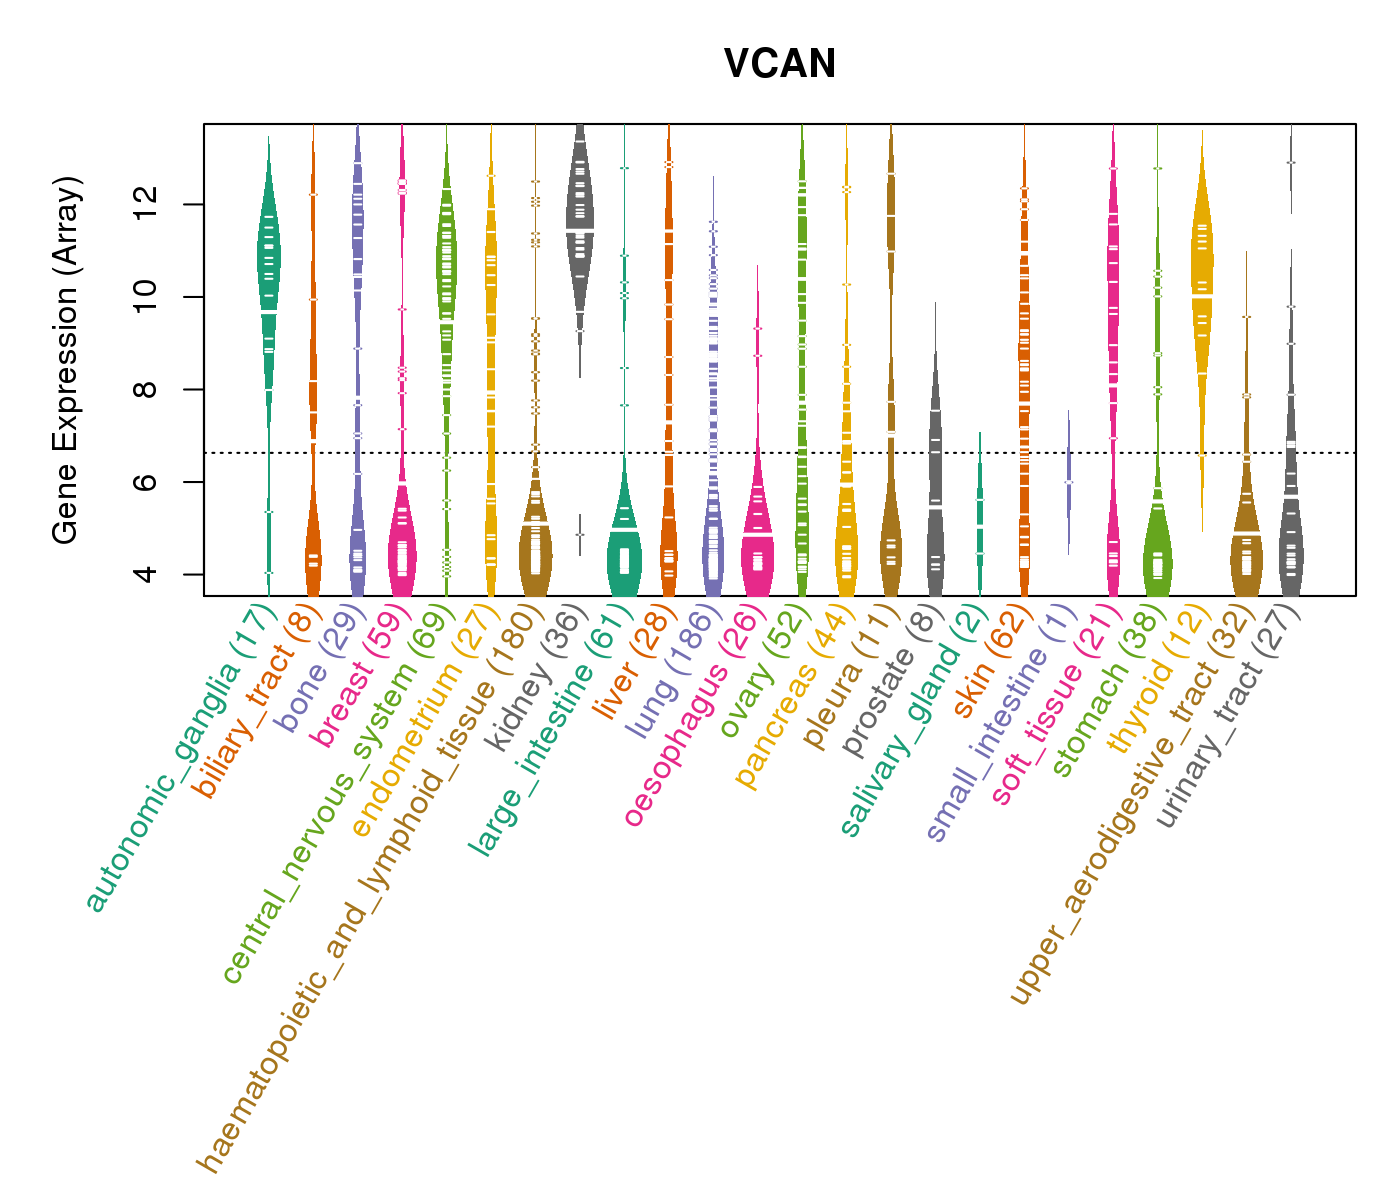 |
| * Normalized gene expression data of RNASeqV2 was extracted from TCGA using R package TCGA-Assembler. The URLs of all public data files on TCGA DCC data server were gathered at Jan-05-2015. Only eight cancer types have enough normal control samples for differential expression analysis. (t test, adjusted p<0.05 (using Benjamini-Hochberg FDR)) |
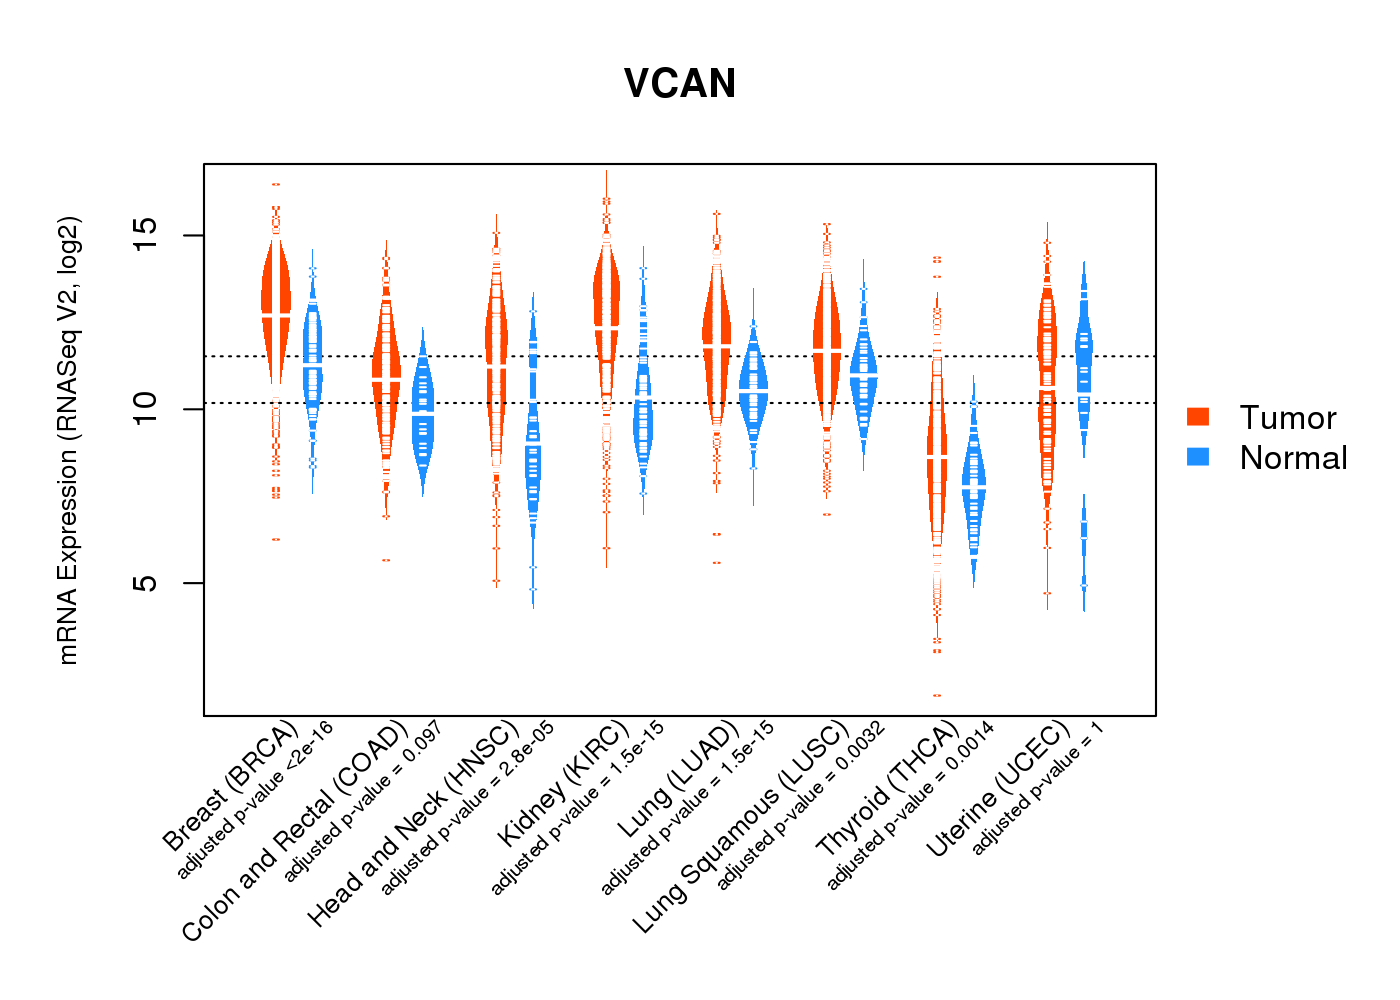 |
| Top |
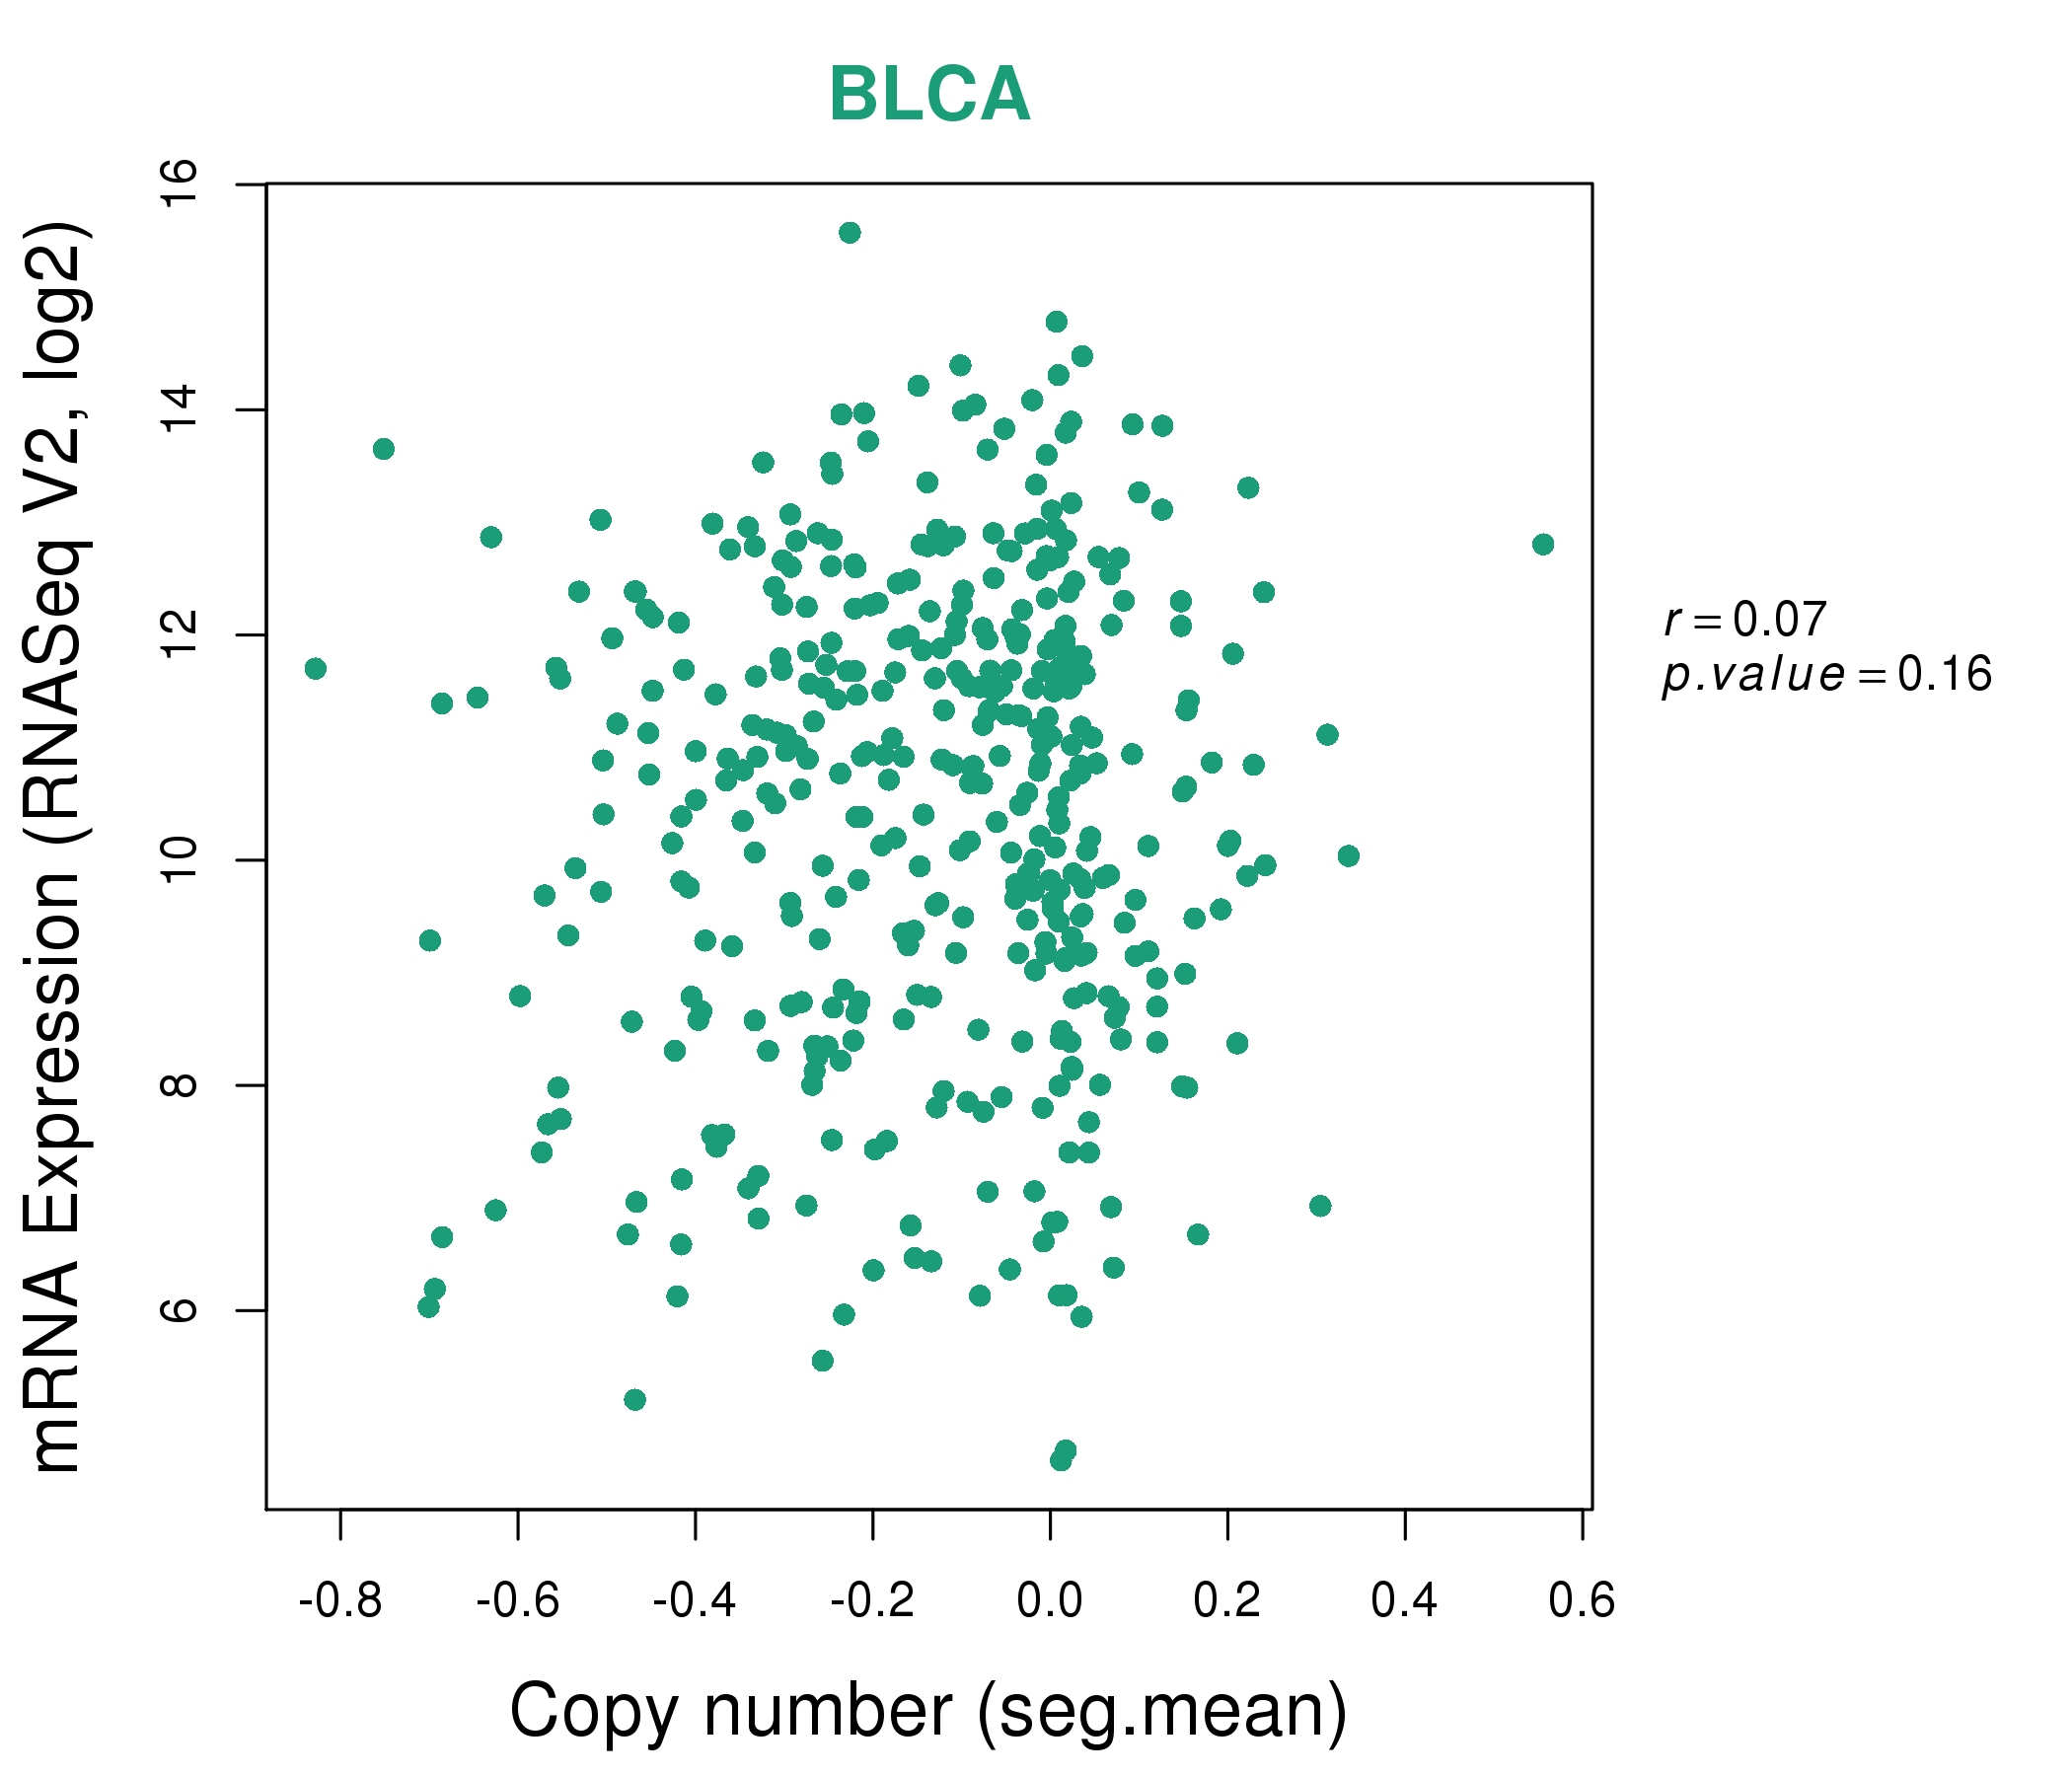
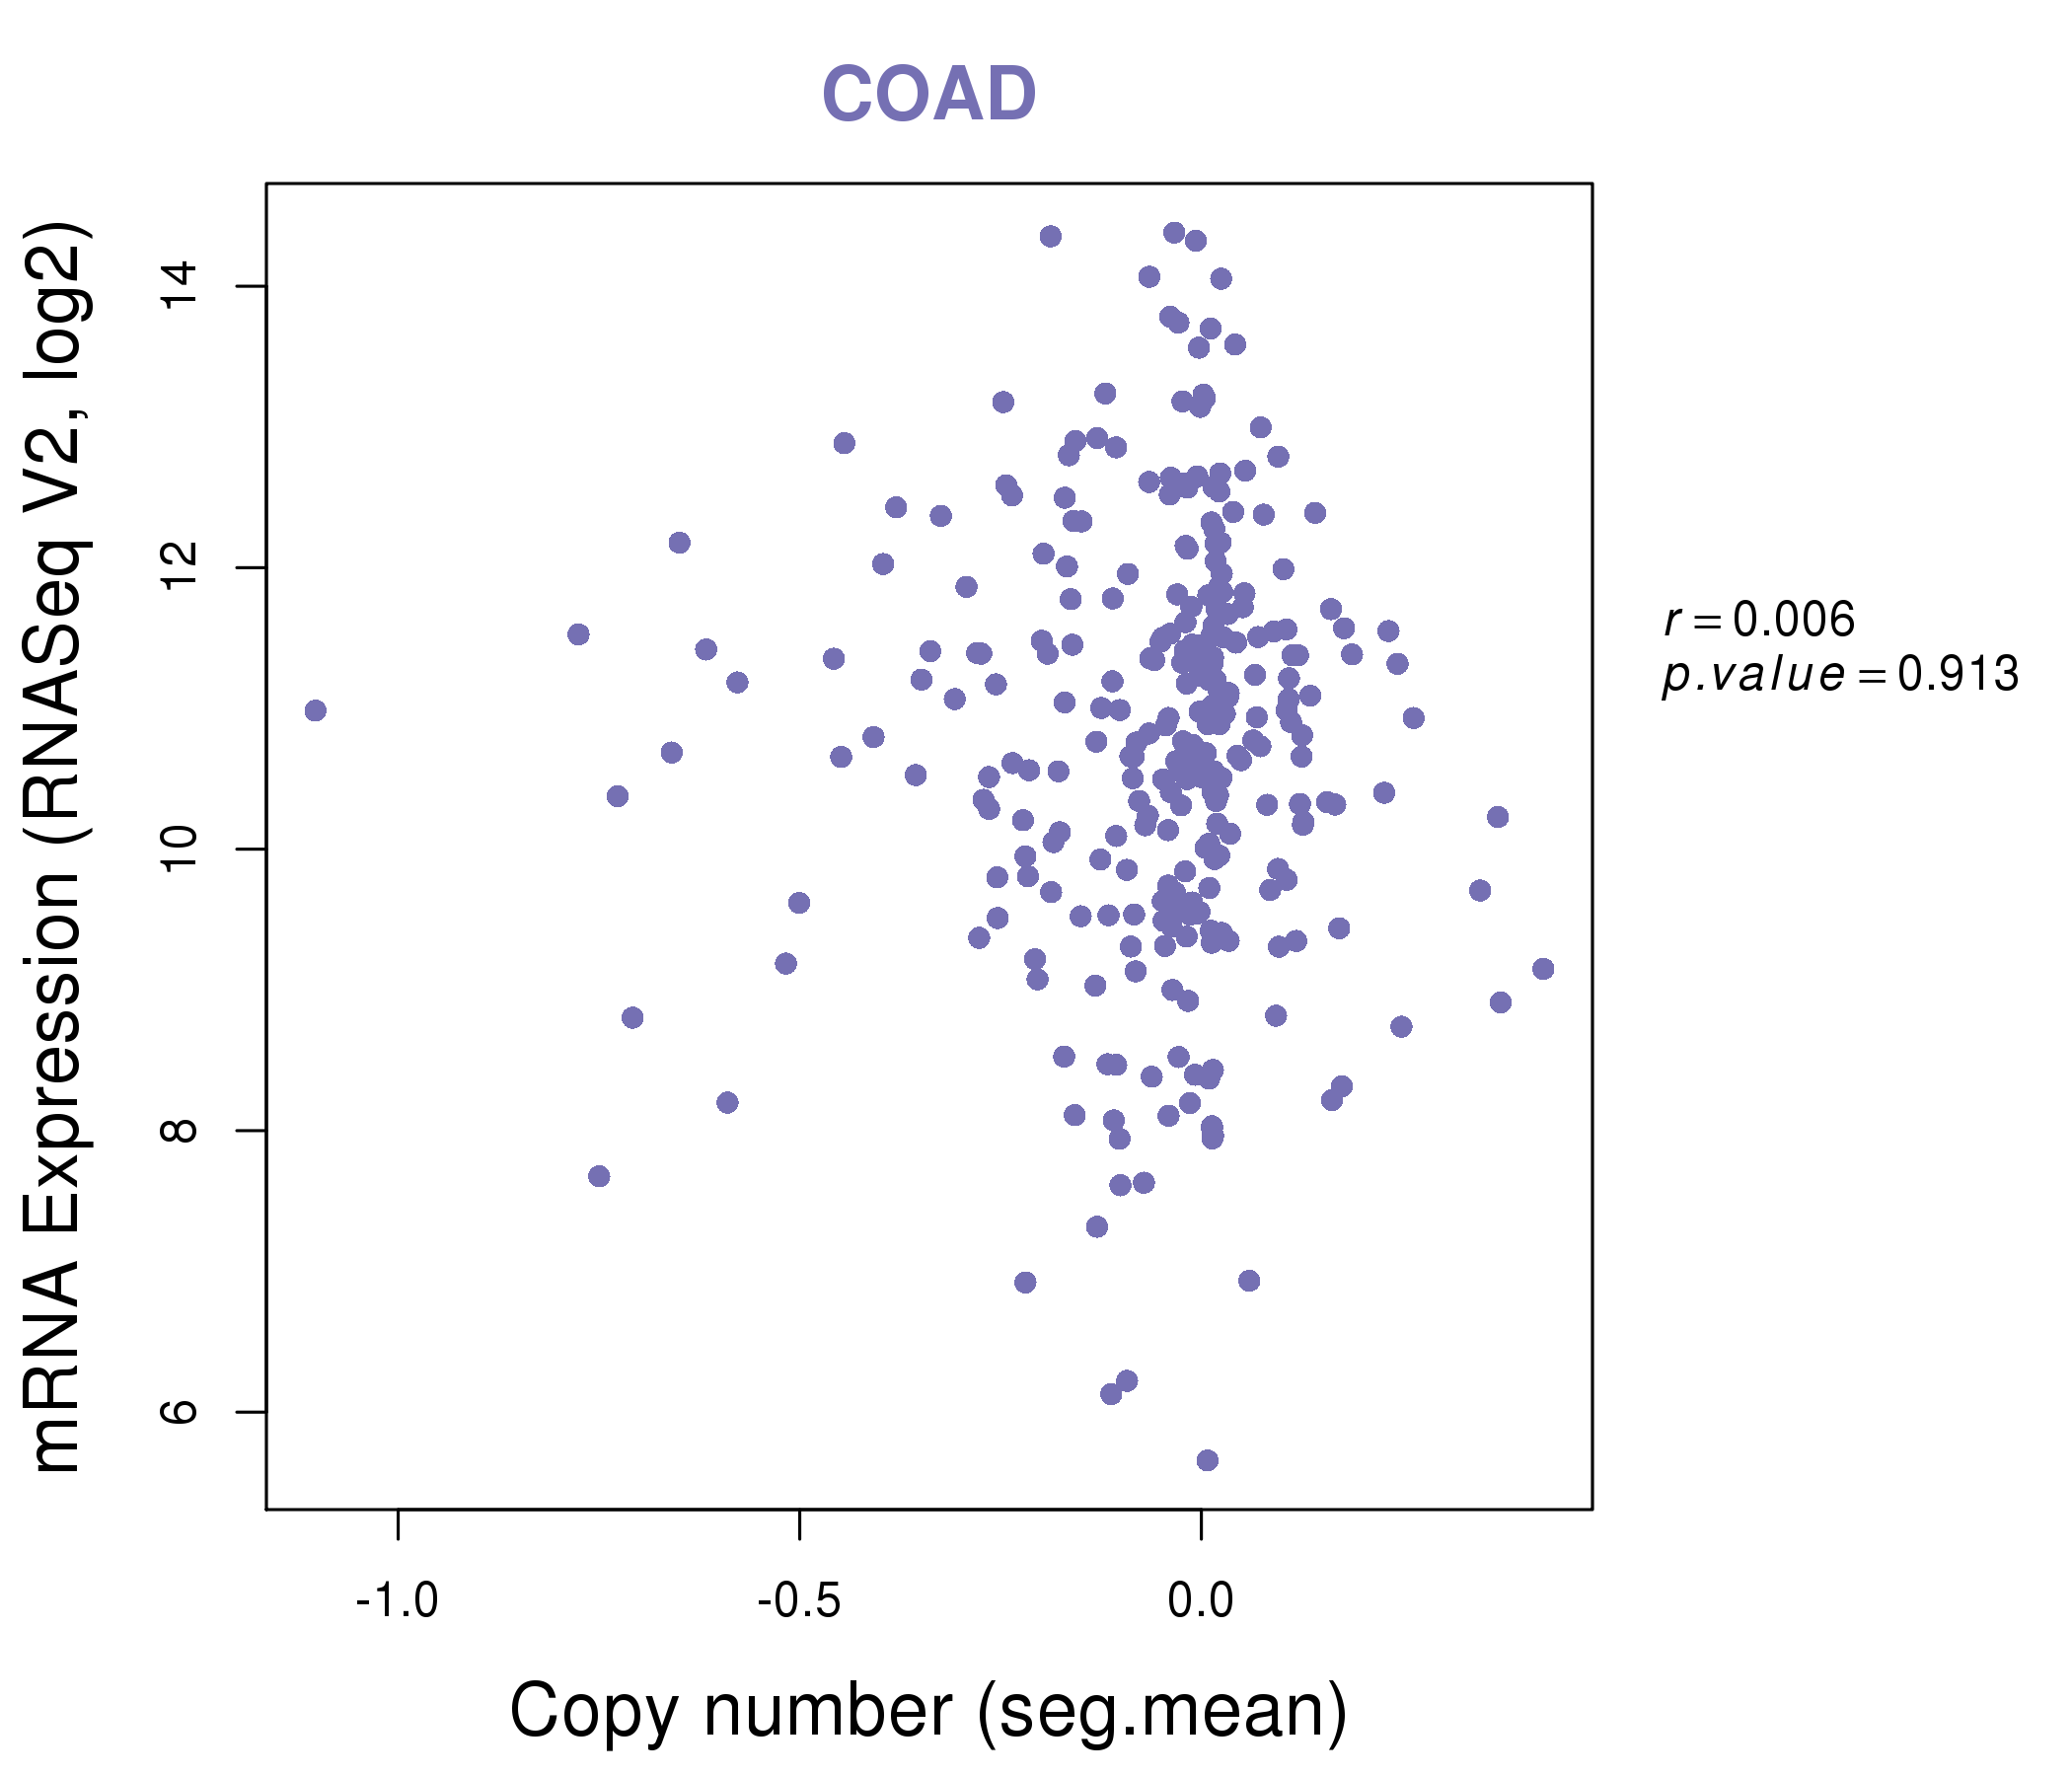
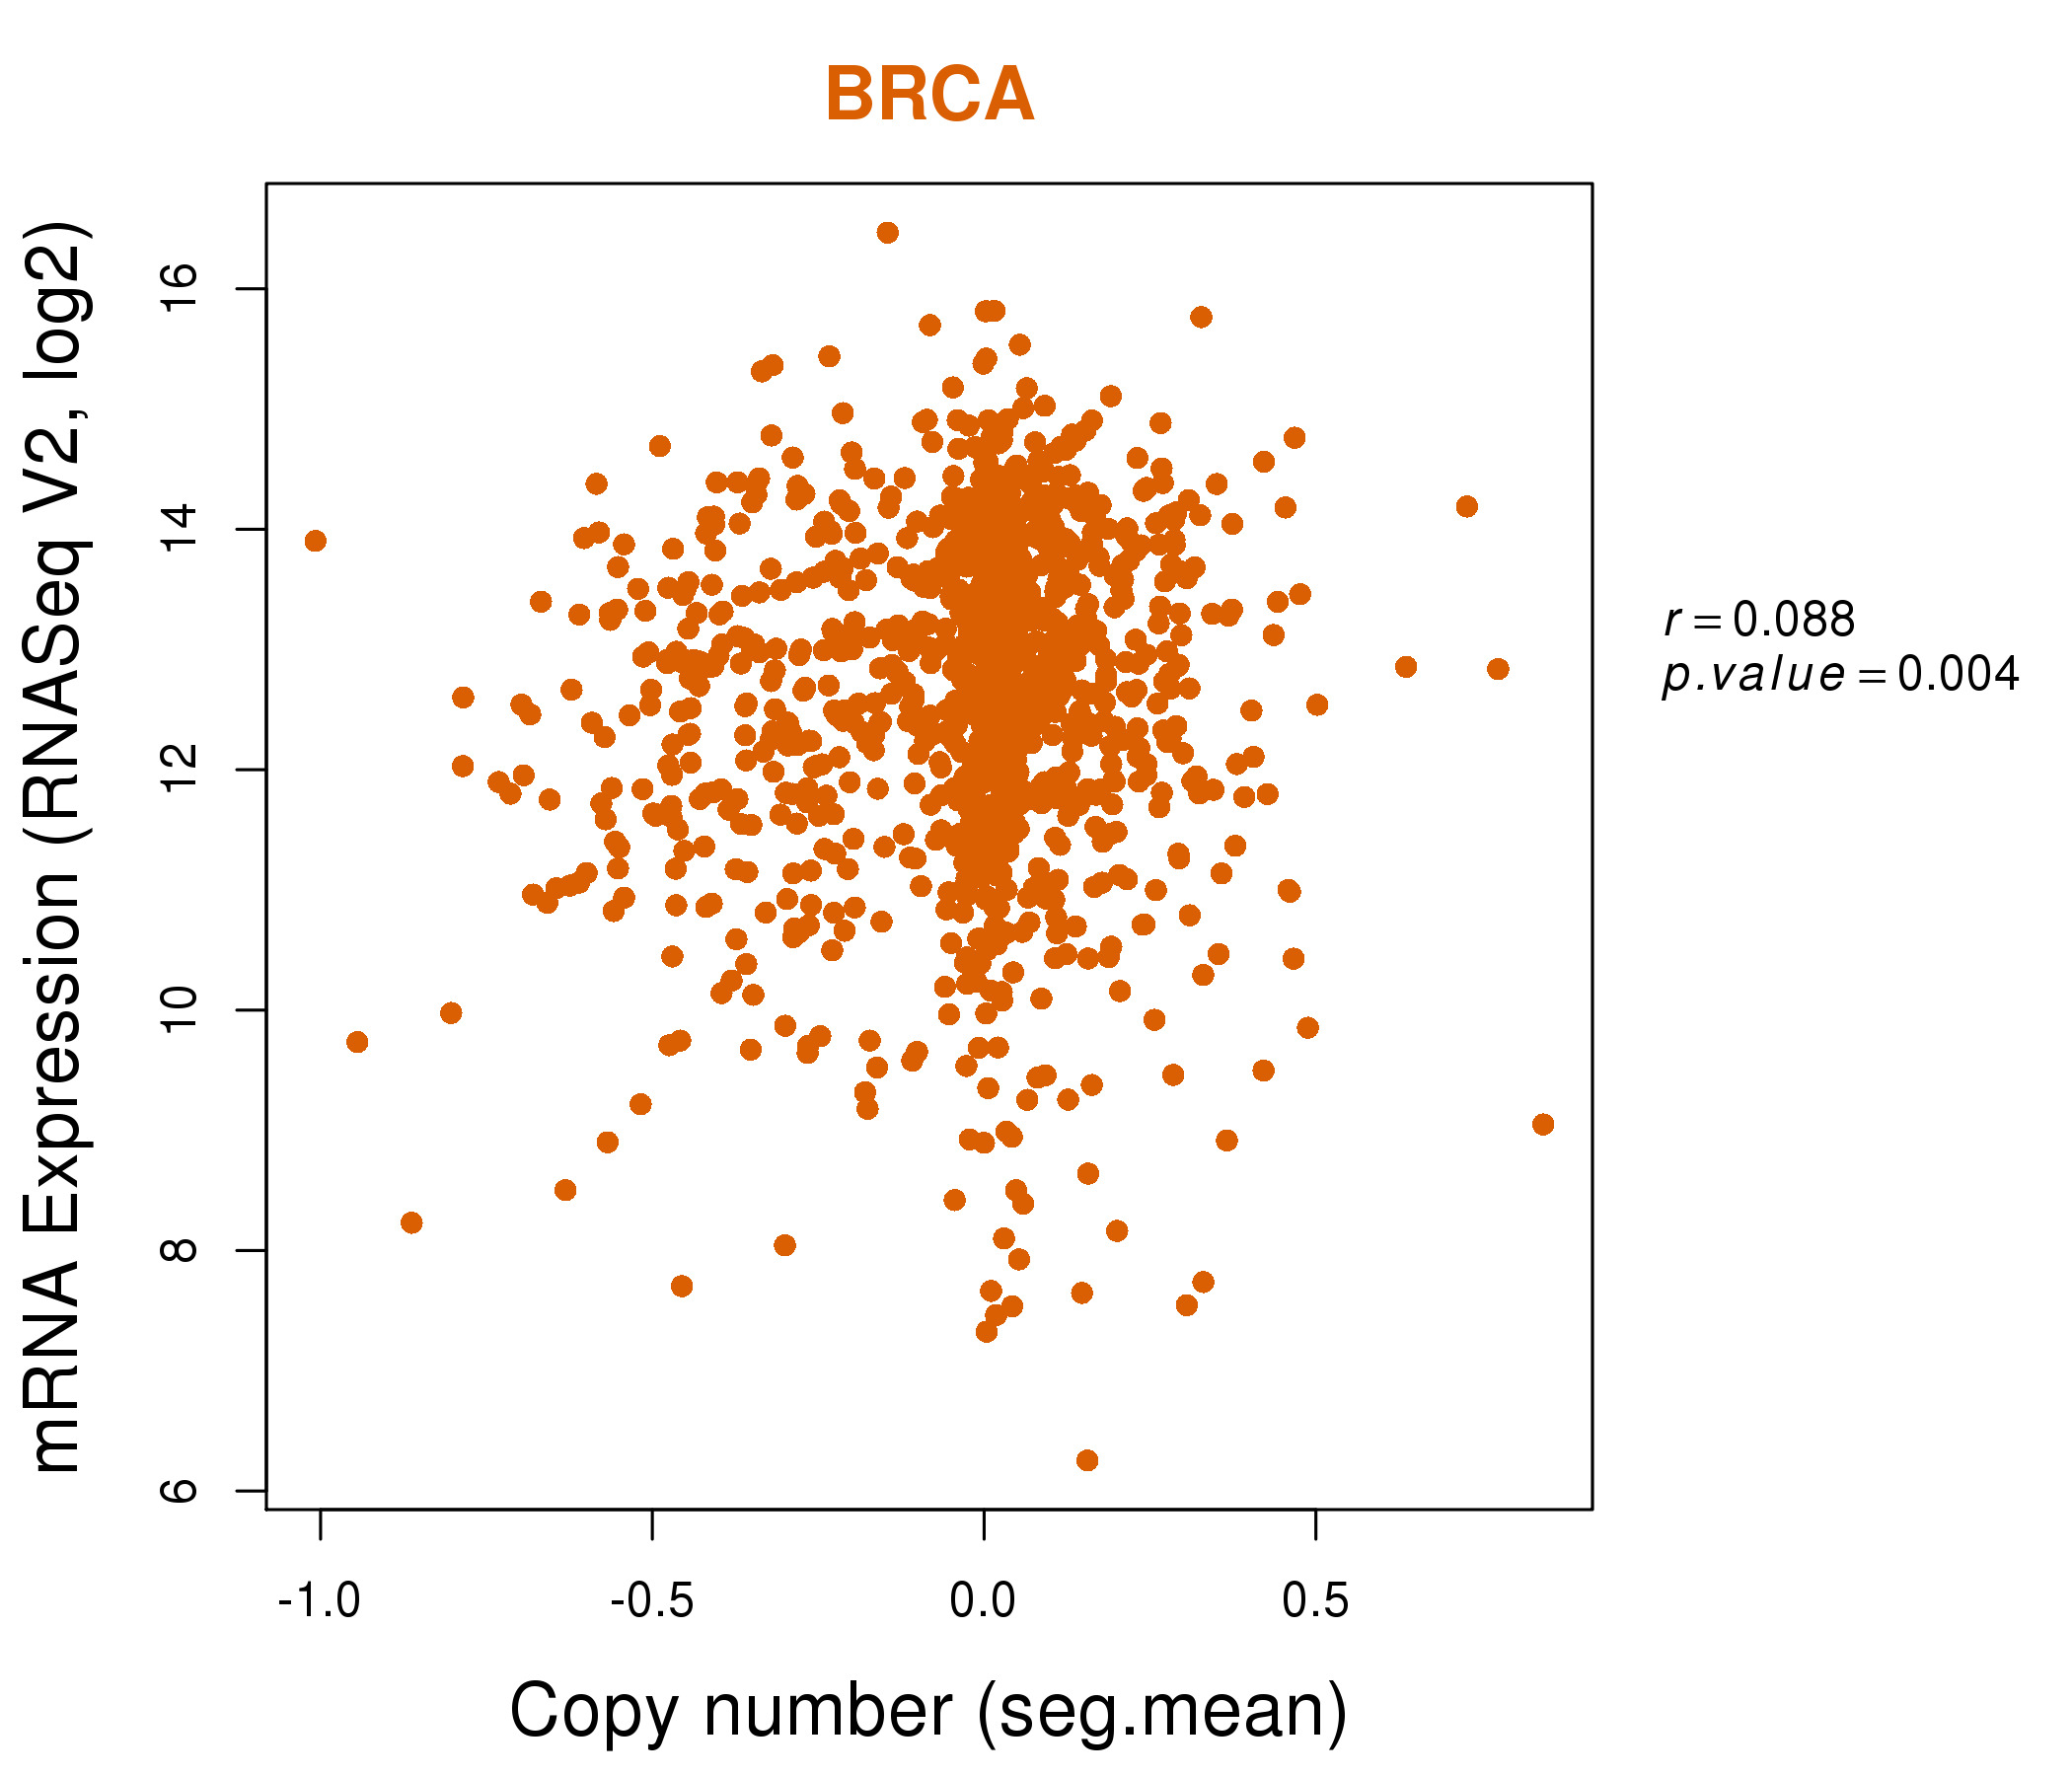
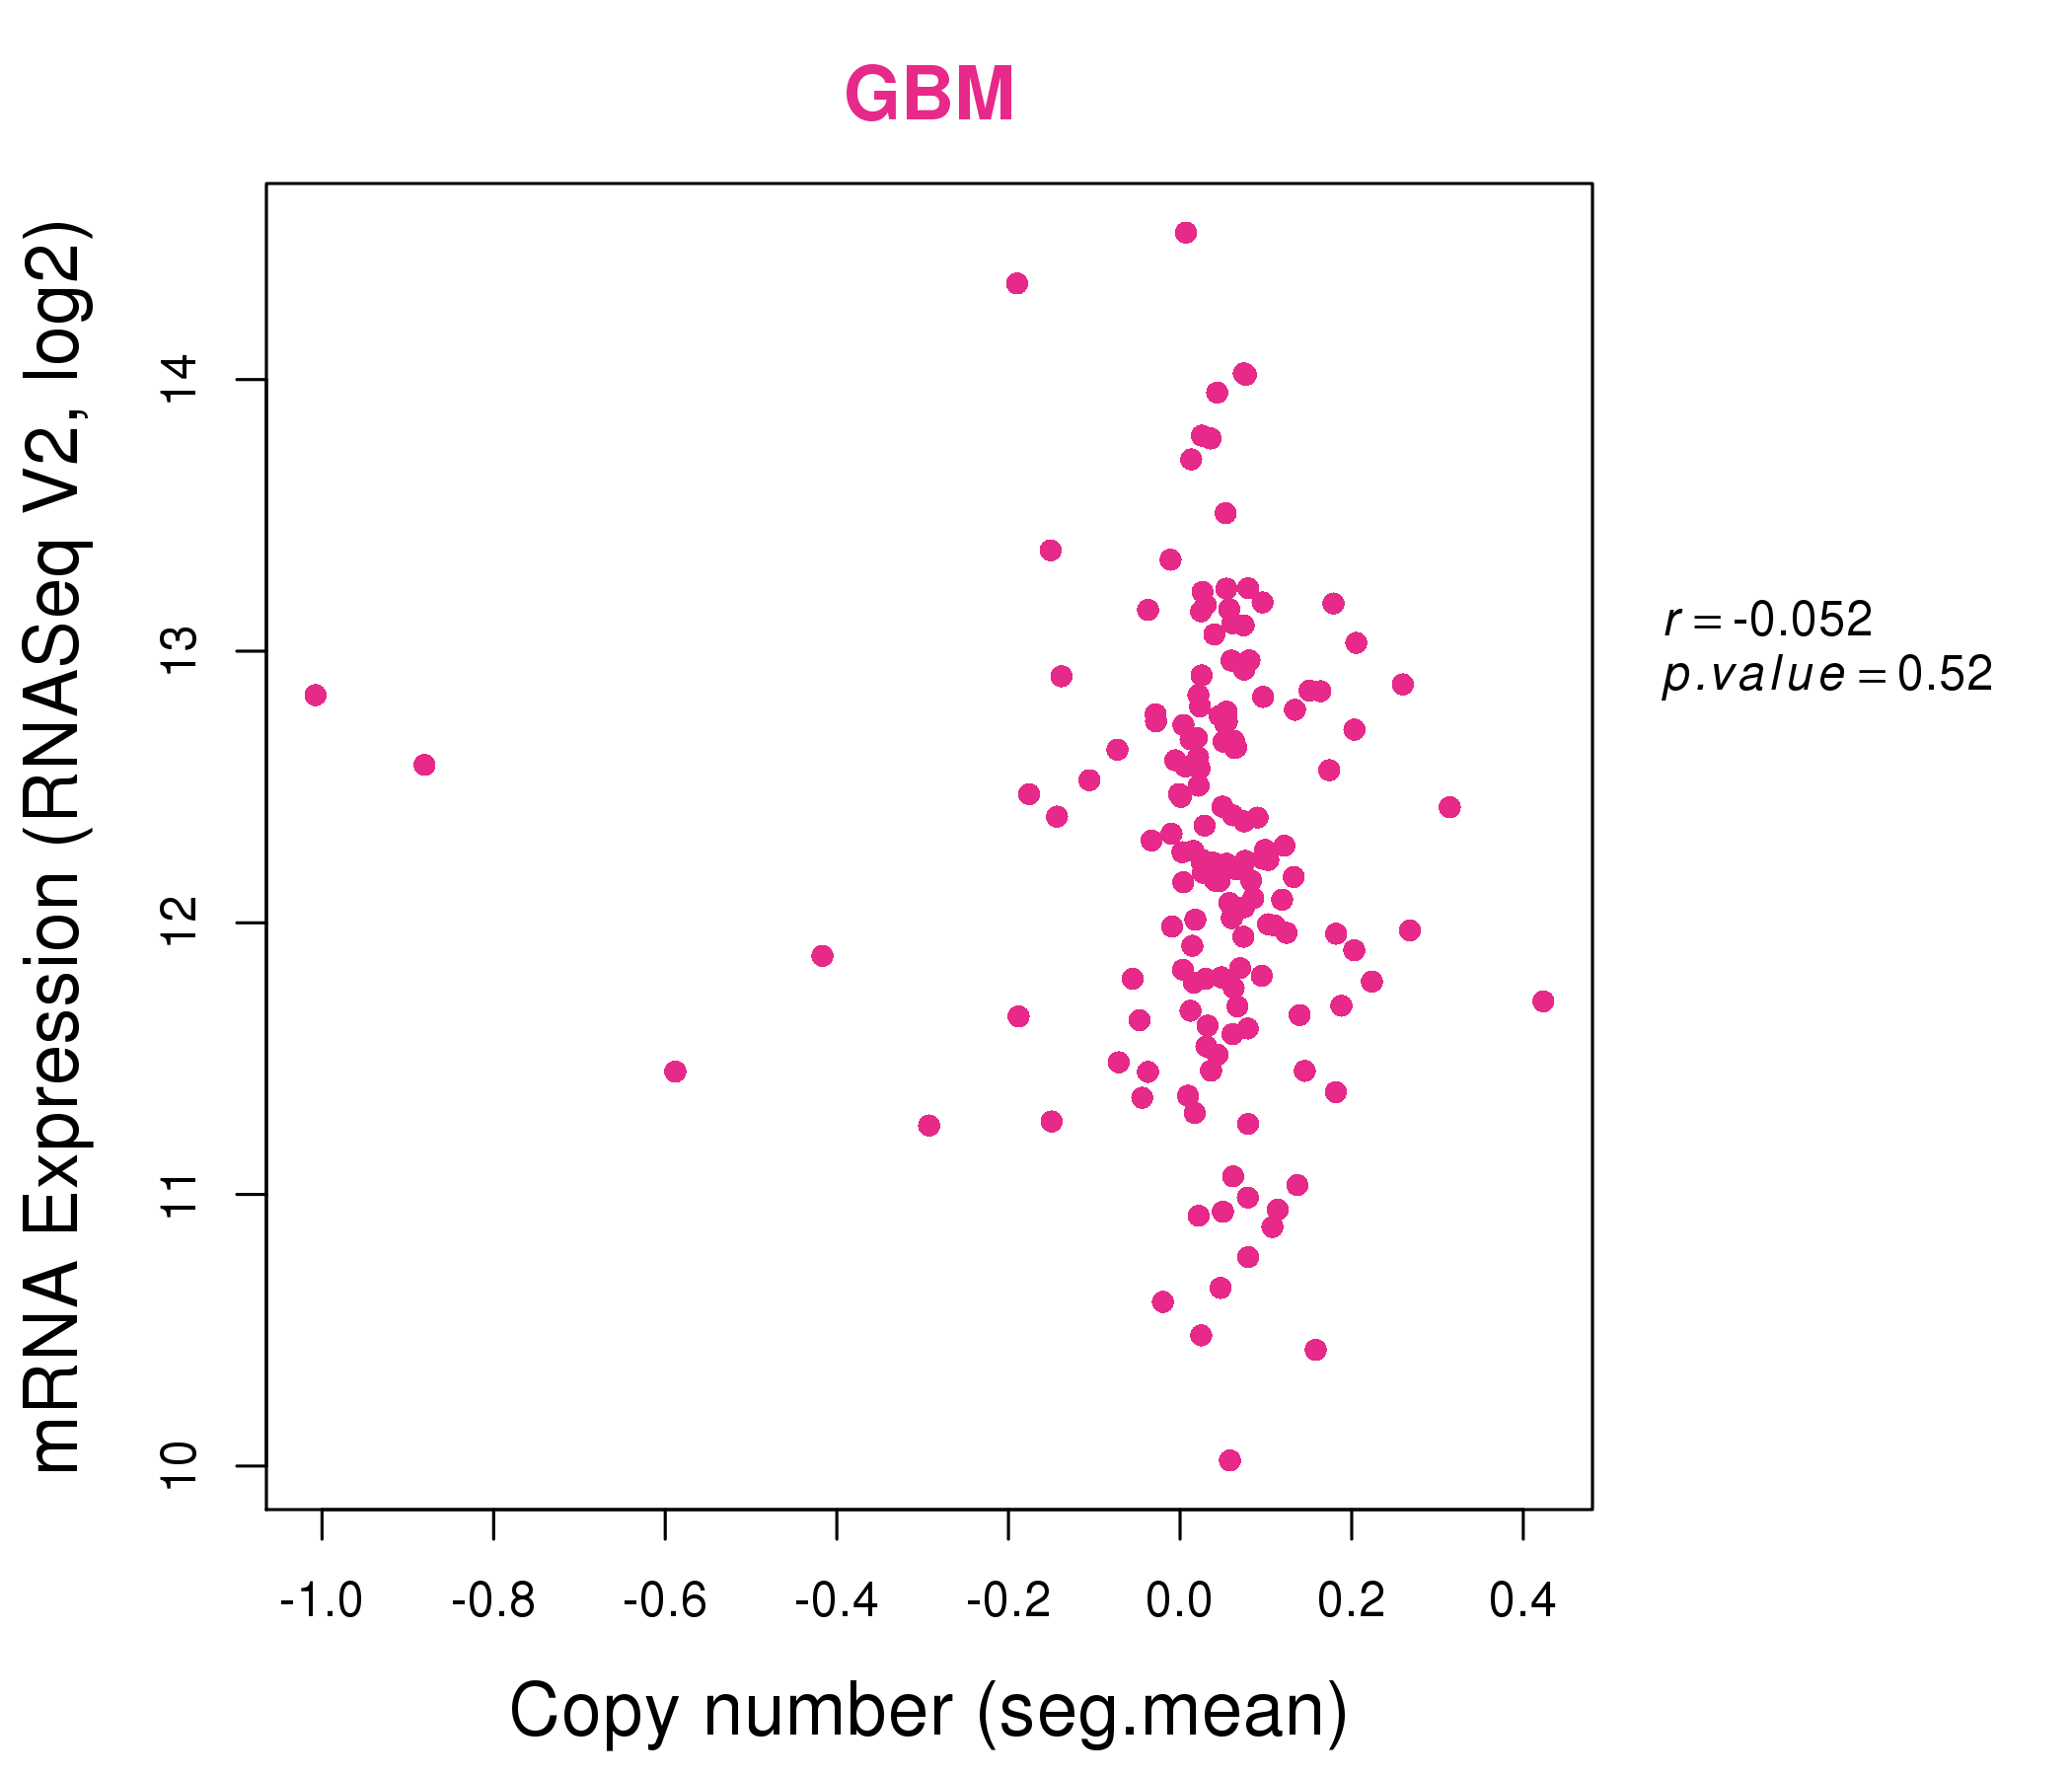
| * This plots show the correlation between CNV and gene expression. |
: Open all plots for all cancer types
 |
|
 |
|
| Top |
| Gene-Gene Network Information |
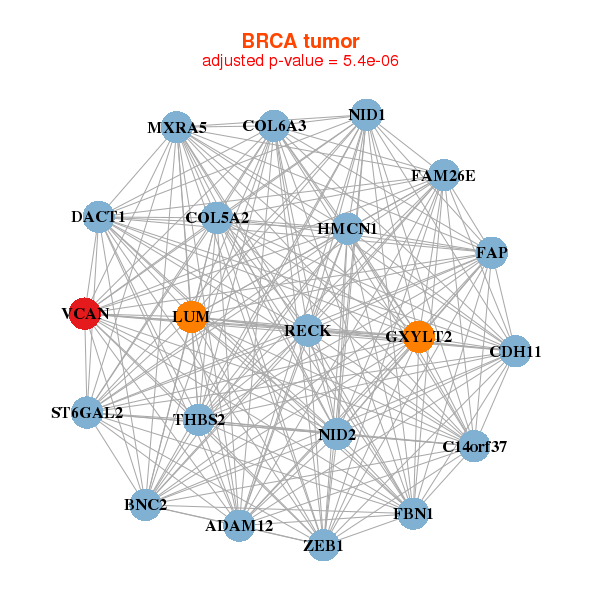
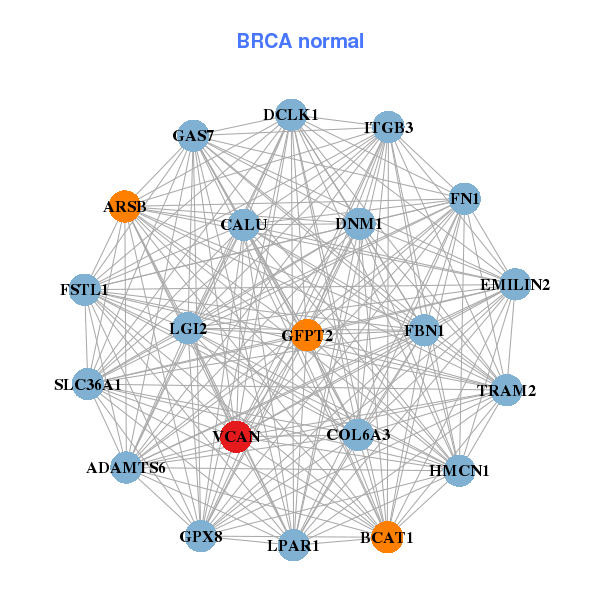
| * Co-Expression network figures were drawn using R package igraph. Only the top 20 genes with the highest correlations were shown. Red circle: input gene, orange circle: cell metabolism gene, sky circle: other gene |
: Open all plots for all cancer types
 |
|
| ADAM12,BNC2,C14orf37,CDH11,COL5A2,COL6A3,DACT1, FAM26E,FAP,FBN1,GXYLT2,HMCN1,LUM,MXRA5, NID1,NID2,RECK,ST6GAL2,THBS2,VCAN,ZEB1 | ADAMTS6,ARSB,BCAT1,CALU,COL6A3,DCLK1,DNM1, EMILIN2,FBN1,FN1,FSTL1,GAS7,GFPT2,GPX8, HMCN1,ITGB3,LGI2,LPAR1,SLC36A1,TRAM2,VCAN |
 |
|
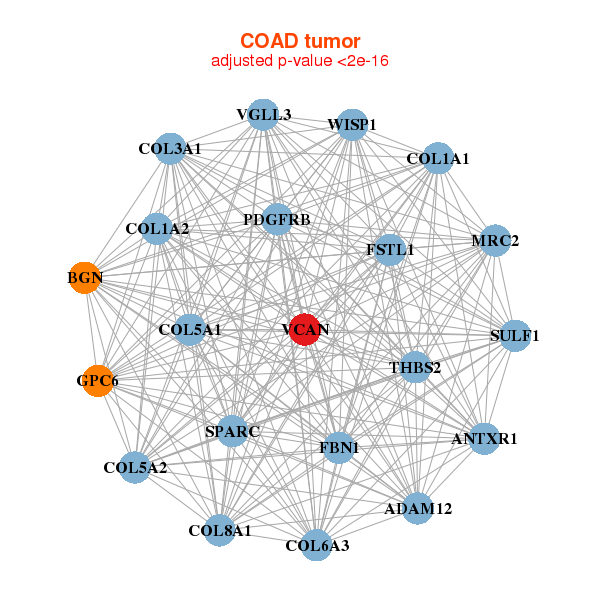
| ADAM12,ANTXR1,BGN,COL1A1,COL1A2,COL3A1,COL5A1, COL5A2,COL6A3,COL8A1,FBN1,FSTL1,GPC6,MRC2, PDGFRB,SPARC,SULF1,THBS2,VCAN,VGLL3,WISP1 | ATP8B2,BGN,CHRD,CHST3,COL5A2,COL6A3,FBN1, GPR116,HIP1,HMCN1,KIRREL,LAMC1,LDLRAD3,MCC, PCDHGC3,PDGFRB,RPS6KA2,SH3PXD2B,THSD7A,TMTC1,VCAN |
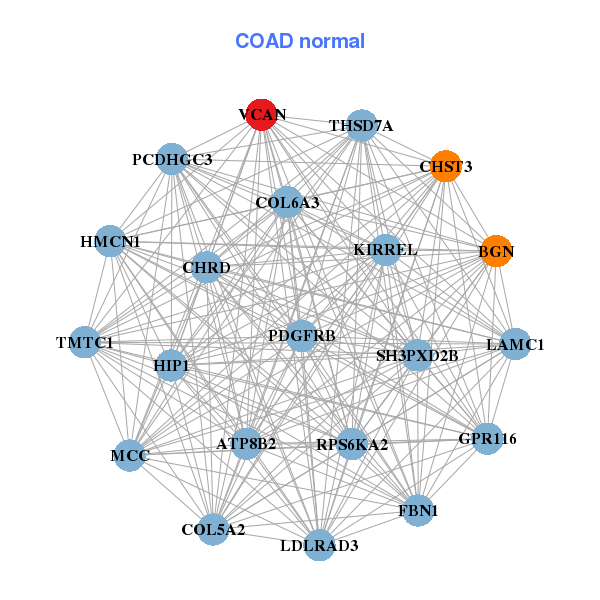
| * Co-Expression network figures were drawn using R package igraph. Only the top 20 genes with the highest correlations were shown. Red circle: input gene, orange circle: cell metabolism gene, sky circle: other gene |
: Open all plots for all cancer types
| Top |
: Open all interacting genes' information including KEGG pathway for all interacting genes from DAVID
| Top |
| Pharmacological Information for VCAN |
| There's no related Drug. |
| Top |
| Cross referenced IDs for VCAN |
| * We obtained these cross-references from Uniprot database. It covers 150 different DBs, 18 categories. http://www.uniprot.org/help/cross_references_section |
: Open all cross reference information
|
Copyright © 2016-Present - The Univsersity of Texas Health Science Center at Houston @ |