|
||||||||||||||||||||||||||||||||||||||||||||||||||||||||||||||||||||||||||||||||||||||||||||||||||||||||||||||||||||||||||||||||||||||||||||||||||||||||||||||||||||||||||||||||||||||||||||||||||||||||||||||||||||||||||||||||||||||||||||||||||||||||||||||||||||||||||||||||||||||||||||||||||||||||||||||||||||||||||
| |
| Phenotypic Information (metabolism pathway, cancer, disease, phenome) |
| |
| |
| Gene-Gene Network Information: Co-Expression Network, Interacting Genes & KEGG |
| |
|


| Gene Summary for DNMT3B |
| Basic gene info. | Gene symbol | DNMT3B |
| Gene name | DNA (cytosine-5-)-methyltransferase 3 beta | |
| Synonyms | ICF|ICF1|M.HsaIIIB | |
| Cytomap | UCSC genome browser: 20q11.2 | |
| Genomic location | chr20 :31350190-31397162 | |
| Type of gene | protein-coding | |
| RefGenes | NM_001207055.1, NM_001207056.1,NM_006892.3,NM_175848.1,NM_175849.1, NM_175850.2, | |
| Ensembl id | ENSG00000088305 | |
| Description | DNA (cytosine-5)-methyltransferase 3BDNA MTase HsaIIIBDNA methyltransferase HsaIIIB | |
| Modification date | 20141221 | |
| dbXrefs | MIM : 602900 | |
| HGNC : HGNC | ||
| Ensembl : ENSG00000088305 | ||
| HPRD : 04209 | ||
| Vega : OTTHUMG00000032226 | ||
| Protein | UniProt: Q9UBC3 go to UniProt's Cross Reference DB Table | |
| Expression | CleanEX: HS_DNMT3B | |
| BioGPS: 1789 | ||
| Gene Expression Atlas: ENSG00000088305 | ||
| The Human Protein Atlas: ENSG00000088305 | ||
| Pathway | NCI Pathway Interaction Database: DNMT3B | |
| KEGG: DNMT3B | ||
| REACTOME: DNMT3B | ||
| ConsensusPathDB | ||
| Pathway Commons: DNMT3B | ||
| Metabolism | MetaCyc: DNMT3B | |
| HUMANCyc: DNMT3B | ||
| Regulation | Ensembl's Regulation: ENSG00000088305 | |
| miRBase: chr20 :31,350,190-31,397,162 | ||
| TargetScan: NM_001207055 | ||
| cisRED: ENSG00000088305 | ||
| Context | iHOP: DNMT3B | |
| cancer metabolism search in PubMed: DNMT3B | ||
| UCL Cancer Institute: DNMT3B | ||
| Assigned class in ccmGDB | A - This gene has a literature evidence and it belongs to cancer gene. | |
| References showing role of DNMT3B in cancer cell metabolism | 1. Sin-Chan P, Huang A (2014) DNMTs as potential therapeutic targets in high-risk pediatric embryonal brain tumors. Expert Opin Ther Targets 18: 1103-1107. doi: 10.1517/14728222.2014.938052. go to article 2. Cheng TD, Makar KW, Neuhouser ML, Miller JW, Song X, et al. (2015) Folate-mediated one-carbon metabolism genes and interactions with nutritional factors on colorectal cancer risk: Women's Health Initiative Observational Study. Cancer. doi: 10.1002/cncr.29465. go to article | |
| Top |
| Phenotypic Information for DNMT3B(metabolism pathway, cancer, disease, phenome) |
| Cancer | CGAP: DNMT3B |
| Familial Cancer Database: DNMT3B | |
| * This gene is included in those cancer gene databases. |
|
|
|
|
|
|
| ||||||||||||||||||||||||||||||||||||||||||||||||||||||||||||||||||||||||||||||||||||||||||||||||||||||||||||||||||||||||||||||||||||||||||||||||||||||||||||||||||||||||||||||||||||||||||||||||||||||||||||||||||||||||||||||||||||||||||||||||||||||||||||||||||||||||||||||||||||||||||||||||||||||||||||||||||||
Oncogene 1 | Significant driver gene in | |||||||||||||||||||||||||||||||||||||||||||||||||||||||||||||||||||||||||||||||||||||||||||||||||||||||||||||||||||||||||||||||||||||||||||||||||||||||||||||||||||||||||||||||||||||||||||||||||||||||||||||||||||||||||||||||||||||||||||||||||||||||||||||||||||||||||||||||||||||||||||||||||||||||||||||||||||||||||
| cf) number; DB name 1 Oncogene; http://nar.oxfordjournals.org/content/35/suppl_1/D721.long, 2 Tumor Suppressor gene; https://bioinfo.uth.edu/TSGene/, 3 Cancer Gene Census; http://www.nature.com/nrc/journal/v4/n3/abs/nrc1299.html, 4 CancerGenes; http://nar.oxfordjournals.org/content/35/suppl_1/D721.long, 5 Network of Cancer Gene; http://ncg.kcl.ac.uk/index.php, 1Therapeutic Vulnerabilities in Cancer; http://cbio.mskcc.org/cancergenomics/statius/ |
| KEGG_CYSTEINE_AND_METHIONINE_METABOLISM | |
| OMIM | 242860; phenotype. 242860; phenotype. 602900; gene. 602900; gene. |
| Orphanet | 2268; ICF syndrome. 2268; ICF syndrome. |
| Disease | KEGG Disease: DNMT3B |
| MedGen: DNMT3B (Human Medical Genetics with Condition) | |
| ClinVar: DNMT3B | |
| Phenotype | MGI: DNMT3B (International Mouse Phenotyping Consortium) |
| PhenomicDB: DNMT3B | |
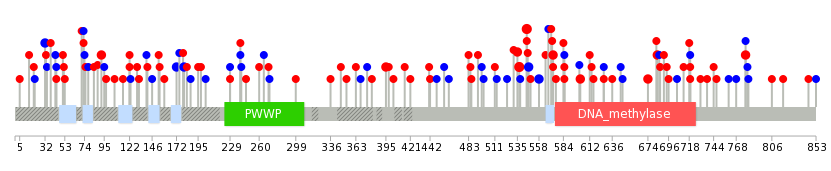
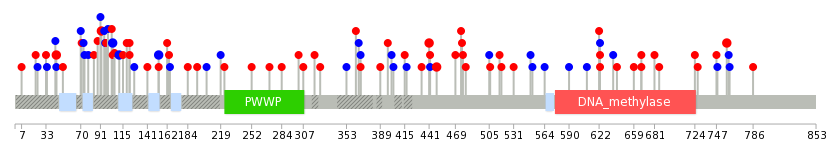
| Mutations for DNMT3B |
| * Under tables are showing count per each tissue to give us broad intuition about tissue specific mutation patterns.You can go to the detailed page for each mutation database's web site. |
| There's no structural variation information in COSMIC data for this gene. |
| * From mRNA Sanger sequences, Chitars2.0 arranged chimeric transcripts. This table shows DNMT3B related fusion information. |
| ID | Head Gene | Tail Gene | Accession | Gene_a | qStart_a | qEnd_a | Chromosome_a | tStart_a | tEnd_a | Gene_a | qStart_a | qEnd_a | Chromosome_a | tStart_a | tEnd_a |
| DB451208 | FUK | 1 | 409 | 16 | 70488328 | 70497624 | DNMT3B | 407 | 477 | 20 | 31390240 | 31390310 | |
| AW794433 | DNMT3B | 1 | 142 | 20 | 31396475 | 31396615 | SYK | 131 | 210 | 9 | 93657968 | 93658047 | |
| Top |
| Mutation type/ Tissue ID | brca | cns | cerv | endome | haematopo | kidn | Lintest | liver | lung | ns | ovary | pancre | prost | skin | stoma | thyro | urina | |||
| Total # sample | 1 | 2 | 1 | |||||||||||||||||
| GAIN (# sample) | 2 | 1 | ||||||||||||||||||
| LOSS (# sample) | 1 |
| cf) Tissue ID; Tissue type (1; Breast, 2; Central_nervous_system, 3; Cervix, 4; Endometrium, 5; Haematopoietic_and_lymphoid_tissue, 6; Kidney, 7; Large_intestine, 8; Liver, 9; Lung, 10; NS, 11; Ovary, 12; Pancreas, 13; Prostate, 14; Skin, 15; Stomach, 16; Thyroid, 17; Urinary_tract) |
| Top |
|
 |
| Top |
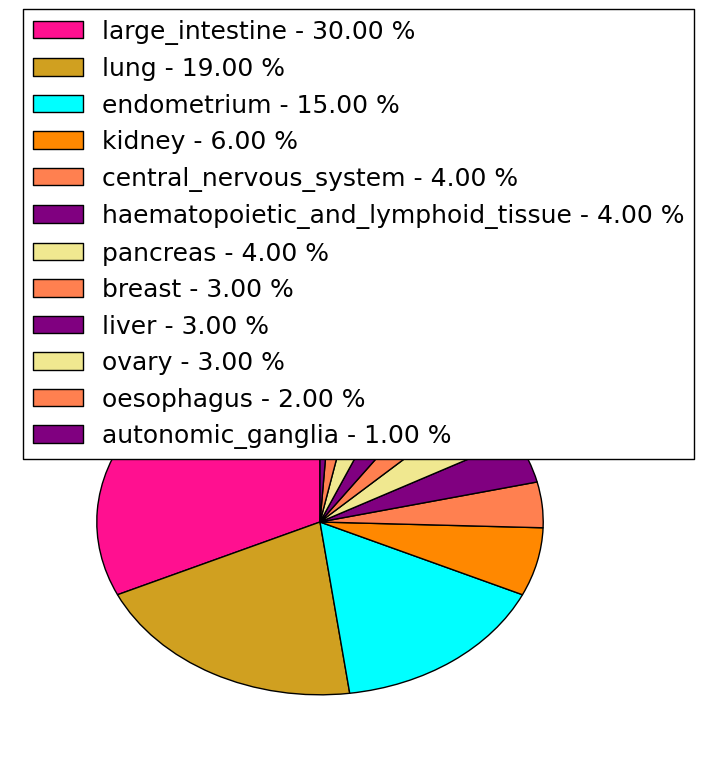
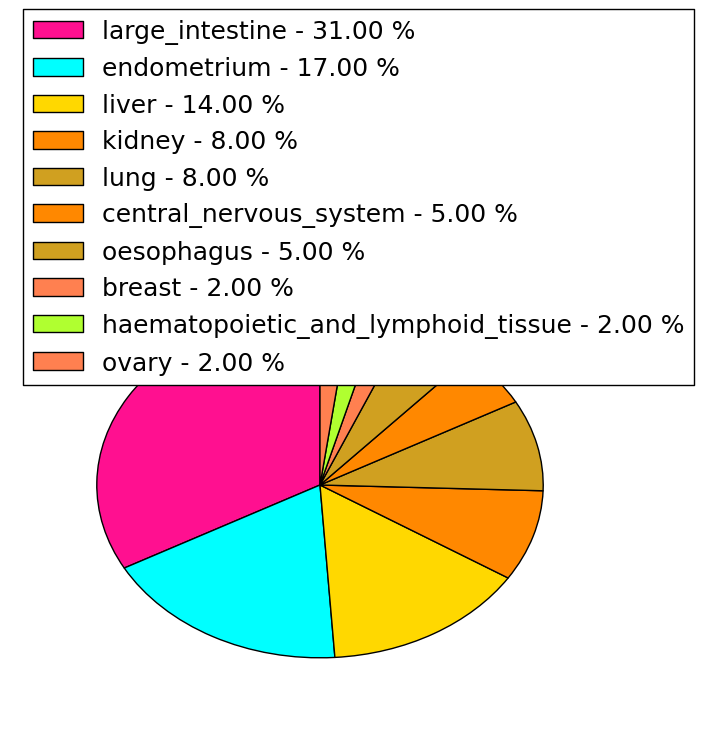
| Stat. for Non-Synonymous SNVs (# total SNVs=83) | (# total SNVs=35) |
 |  |
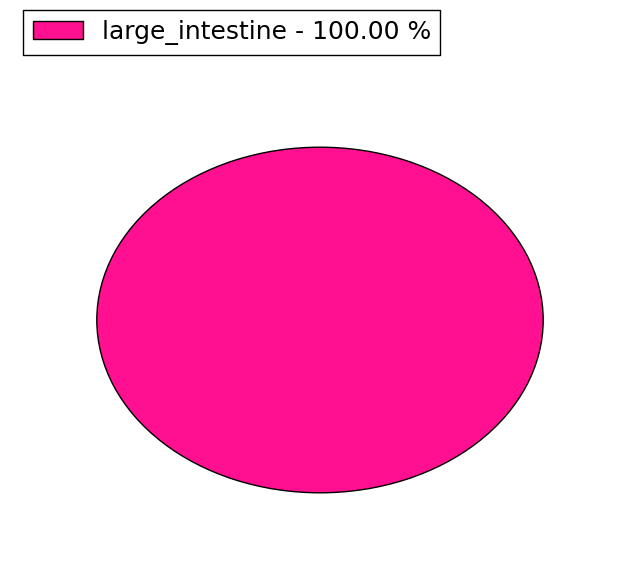
(# total SNVs=3) | (# total SNVs=1) |
 |  |
| Top |
| * When you move the cursor on each content, you can see more deailed mutation information on the Tooltip. Those are primary_site,primary_histology,mutation(aa),pubmedID. |
| GRCh37 position | Mutation(aa) | Unique sampleID count |
| chr20:31386384-31386384 | p.R537W | 3 |
| chr20:31386409-31386409 | p.R545H | 3 |
| chr20:31368225-31368225 | p.S32S | 2 |
| chr20:31386378-31386378 | p.V535I | 2 |
| chr20:31389107-31389107 | p.E674K | 2 |
| chr20:31394046-31394046 | p.S778L | 2 |
| chr20:31388003-31388003 | p.V602I | 2 |
| chr20:31389138-31389138 | p.P684L | 2 |
| chr20:31383226-31383226 | p.R380* | 2 |
| chr20:31387093-31387093 | p.R573L | 2 |
| Top |
|
 |
| Point Mutation/ Tissue ID | 1 | 2 | 3 | 4 | 5 | 6 | 7 | 8 | 9 | 10 | 11 | 12 | 13 | 14 | 15 | 16 | 17 | 18 | 19 | 20 |
| # sample | 1 | 3 | 22 | 2 | 6 | 2 | 2 | 1 | 9 | 5 | 3 | 11 | 13 | 12 | ||||||
| # mutation | 1 | 3 | 23 | 2 | 6 | 2 | 2 | 1 | 11 | 5 | 3 | 10 | 15 | 16 | ||||||
| nonsynonymous SNV | 1 | 2 | 14 | 1 | 5 | 1 | 1 | 1 | 7 | 4 | 2 | 6 | 7 | 10 | ||||||
| synonymous SNV | 1 | 9 | 1 | 1 | 1 | 1 | 4 | 1 | 1 | 4 | 8 | 6 |
| cf) Tissue ID; Tissue type (1; BLCA[Bladder Urothelial Carcinoma], 2; BRCA[Breast invasive carcinoma], 3; CESC[Cervical squamous cell carcinoma and endocervical adenocarcinoma], 4; COAD[Colon adenocarcinoma], 5; GBM[Glioblastoma multiforme], 6; Glioma Low Grade, 7; HNSC[Head and Neck squamous cell carcinoma], 8; KICH[Kidney Chromophobe], 9; KIRC[Kidney renal clear cell carcinoma], 10; KIRP[Kidney renal papillary cell carcinoma], 11; LAML[Acute Myeloid Leukemia], 12; LUAD[Lung adenocarcinoma], 13; LUSC[Lung squamous cell carcinoma], 14; OV[Ovarian serous cystadenocarcinoma ], 15; PAAD[Pancreatic adenocarcinoma], 16; PRAD[Prostate adenocarcinoma], 17; SKCM[Skin Cutaneous Melanoma], 18:STAD[Stomach adenocarcinoma], 19:THCA[Thyroid carcinoma], 20:UCEC[Uterine Corpus Endometrial Carcinoma]) |
| Top |
| * We represented just top 10 SNVs. When you move the cursor on each content, you can see more deailed mutation information on the Tooltip. Those are primary_site, primary_histology, mutation(aa), pubmedID. |
| Genomic Position | Mutation(aa) | Unique sampleID count |
| chr20:31372633 | p.T104T,DNMT3B | 2 |
| chr20:31394046 | p.P111P,DNMT3B | 2 |
| chr20:31368260 | p.R441W,DNMT3B | 2 |
| chr20:31375143 | p.R92W,DNMT3B | 2 |
| chr20:31375164 | p.R449H,DNMT3B | 2 |
| chr20:31386384 | p.V153V,DNMT3B | 2 |
| chr20:31374365 | p.R122G,DNMT3B | 2 |
| chr20:31386409 | p.P44L,DNMT3B | 2 |
| chr20:31376692 | p.S758L,DNMT3B | 2 |
| chr20:31372622 | p.S760S,DNMT3B | 1 |
| * Copy number data were extracted from TCGA using R package TCGA-Assembler. The URLs of all public data files on TCGA DCC data server were gathered on Jan-05-2015. Function ProcessCNAData in TCGA-Assembler package was used to obtain gene-level copy number value which is calculated as the average copy number of the genomic region of a gene. |
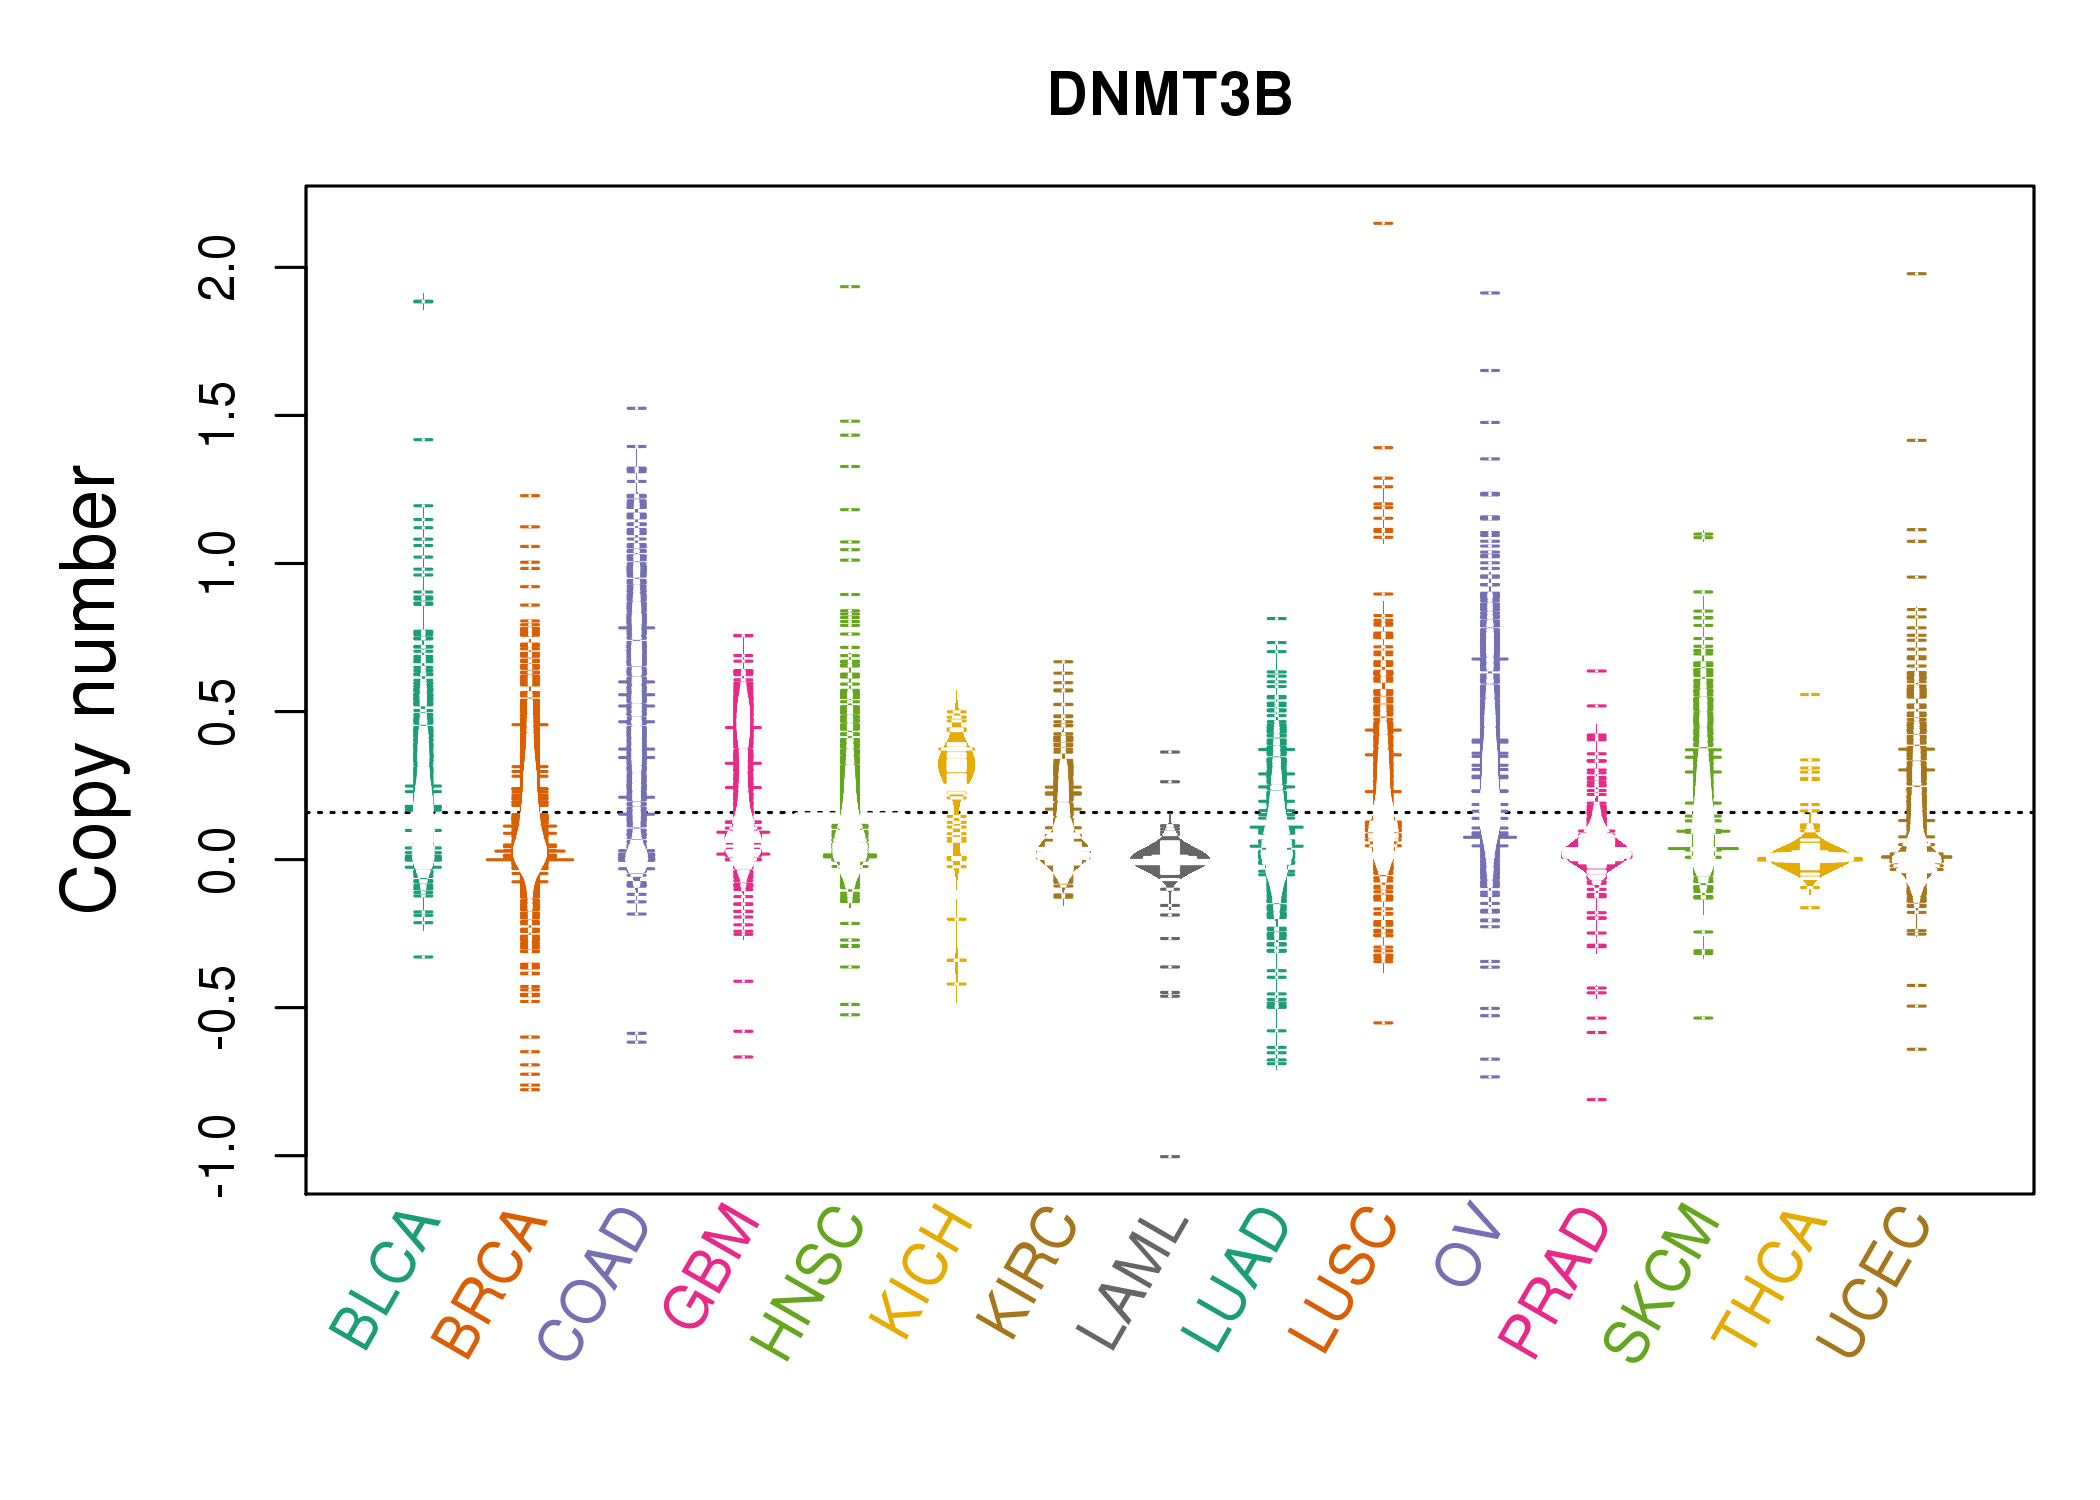 |
| cf) Tissue ID[Tissue type]: BLCA[Bladder Urothelial Carcinoma], BRCA[Breast invasive carcinoma], CESC[Cervical squamous cell carcinoma and endocervical adenocarcinoma], COAD[Colon adenocarcinoma], GBM[Glioblastoma multiforme], Glioma Low Grade, HNSC[Head and Neck squamous cell carcinoma], KICH[Kidney Chromophobe], KIRC[Kidney renal clear cell carcinoma], KIRP[Kidney renal papillary cell carcinoma], LAML[Acute Myeloid Leukemia], LUAD[Lung adenocarcinoma], LUSC[Lung squamous cell carcinoma], OV[Ovarian serous cystadenocarcinoma ], PAAD[Pancreatic adenocarcinoma], PRAD[Prostate adenocarcinoma], SKCM[Skin Cutaneous Melanoma], STAD[Stomach adenocarcinoma], THCA[Thyroid carcinoma], UCEC[Uterine Corpus Endometrial Carcinoma] |
| Top |
| Gene Expression for DNMT3B |
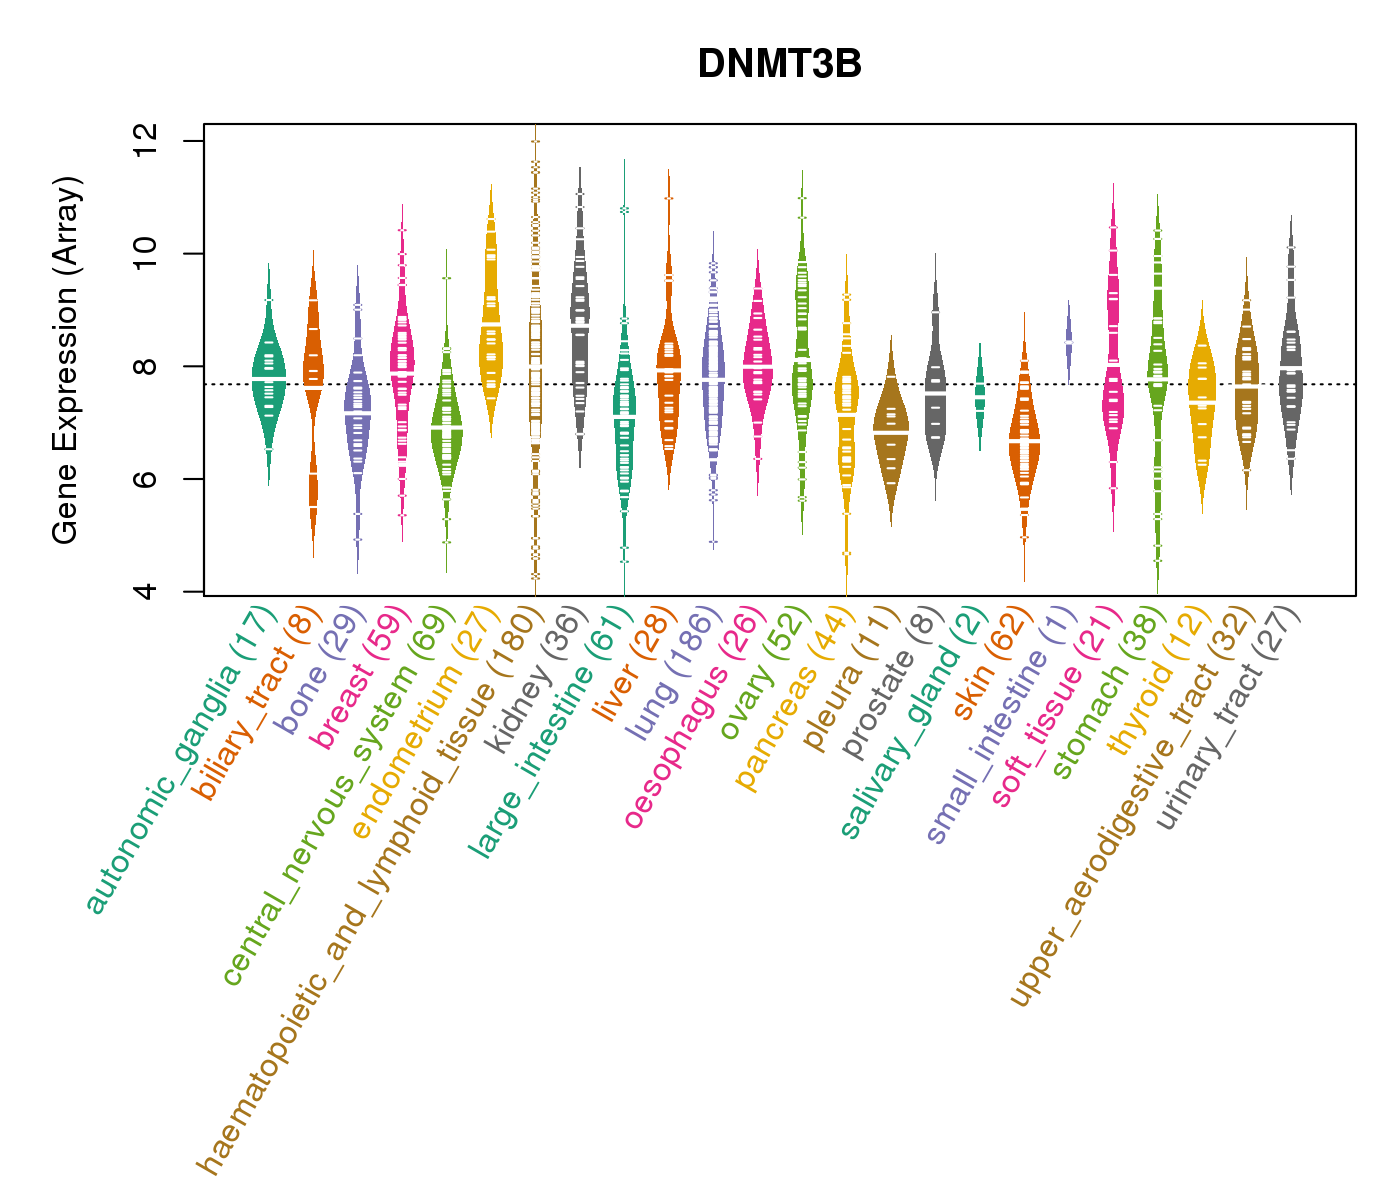
| * CCLE gene expression data were extracted from CCLE_Expression_Entrez_2012-10-18.res: Gene-centric RMA-normalized mRNA expression data. |
 |
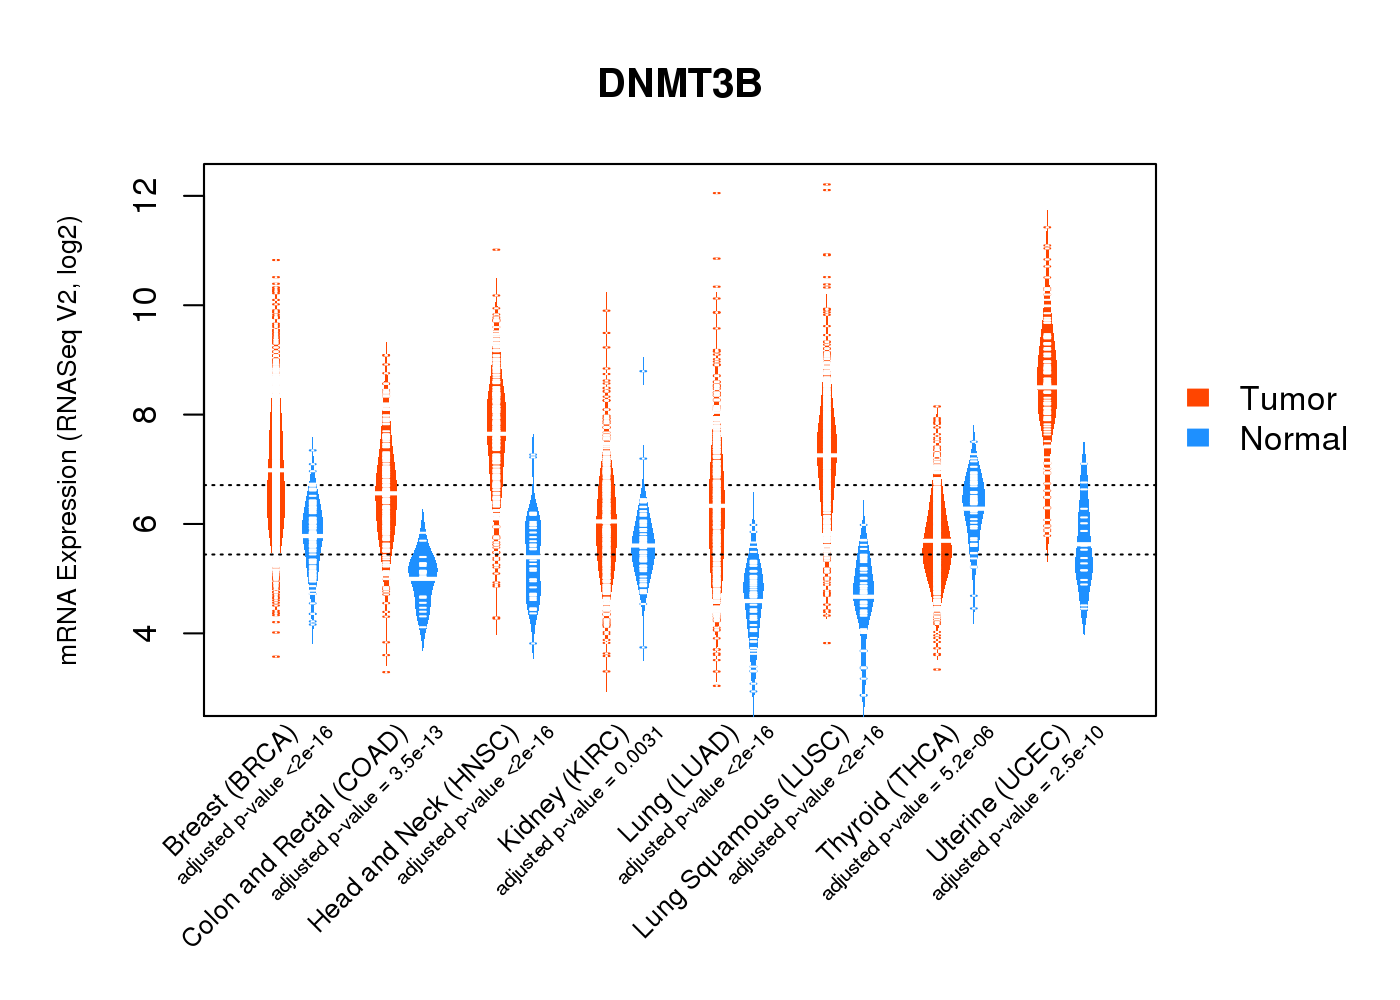
| * Normalized gene expression data of RNASeqV2 was extracted from TCGA using R package TCGA-Assembler. The URLs of all public data files on TCGA DCC data server were gathered at Jan-05-2015. Only eight cancer types have enough normal control samples for differential expression analysis. (t test, adjusted p<0.05 (using Benjamini-Hochberg FDR)) |
 |
| Top |
| * This plots show the correlation between CNV and gene expression. |
: Open all plots for all cancer types
 |
|
 |
|


| Top |
| Gene-Gene Network Information |
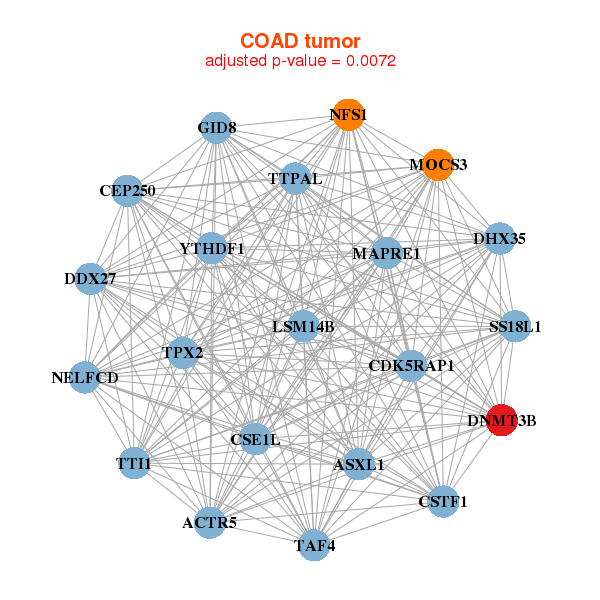
| * Co-Expression network figures were drawn using R package igraph. Only the top 20 genes with the highest correlations were shown. Red circle: input gene, orange circle: cell metabolism gene, sky circle: other gene |
: Open all plots for all cancer types
 |
|
| AURKB,CBX2,CENPA,DNMT3B,ERCC6L,FAM171A2,GINS1, KIF20A,KIF4A,MELK,MEX3A,MYBL2,NCAPH,ORC6, PDSS1,SOX11,SUV39H2,TPX2,TUBB,UBE2T,ZNF695 | DNMT3B,EZH2,FANCD2,HELLS,KDM5B,KIAA1549,KIF24, MYO19,NAA40,NBEAL2,PGBD2,PHF12,PLCH1,PLEKHG4B, PRDM15,SLC12A8,STIL,TET3,VANGL2,ZMYM3,ZFP69B |
 |
|
| ACTR5,ASXL1,GID8,CDK5RAP1,CEP250,CSE1L,CSTF1, DDX27,DHX35,DNMT3B,TTI1,LSM14B,MAPRE1,MOCS3, NFS1,SS18L1,TAF4,NELFCD,TPX2,TTPAL,YTHDF1 | KIAA1456,DCP2,DNMT3B,FGF11,FKTN,FNBP1L,KREMEN1, LIMD1,MDM2,MTSS1,PHF14,PLAGL1,PPM1H,PVRL1, RASA1,RPS6KA6,STX6,TAF5,TBC1D4,USP46,ZBTB10 |
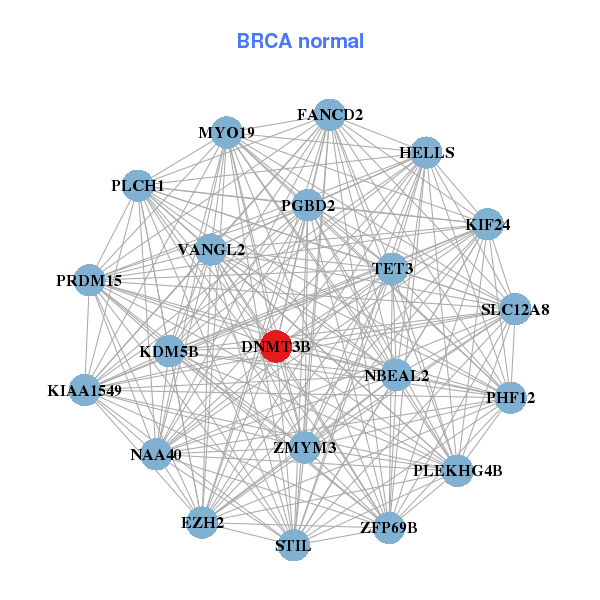
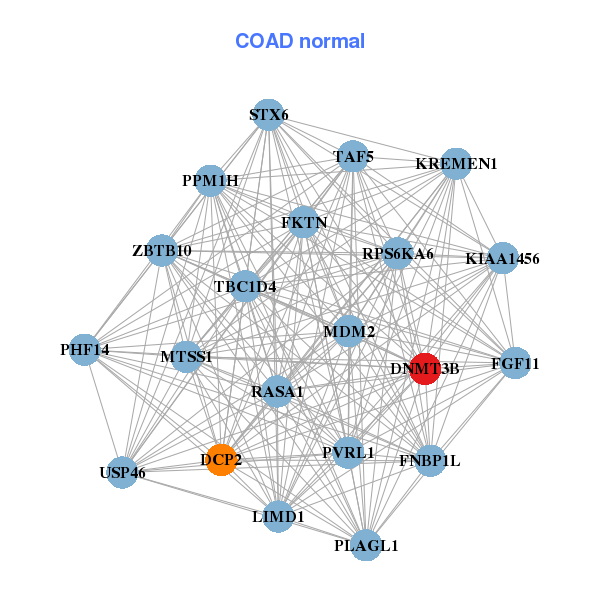
| * Co-Expression network figures were drawn using R package igraph. Only the top 20 genes with the highest correlations were shown. Red circle: input gene, orange circle: cell metabolism gene, sky circle: other gene |
: Open all plots for all cancer types
| Top |
: Open all interacting genes' information including KEGG pathway for all interacting genes from DAVID
| Top |
| Pharmacological Information for DNMT3B |
| There's no related Drug. |
| Top |
| Cross referenced IDs for DNMT3B |
| * We obtained these cross-references from Uniprot database. It covers 150 different DBs, 18 categories. http://www.uniprot.org/help/cross_references_section |
: Open all cross reference information
|
Copyright © 2016-Present - The Univsersity of Texas Health Science Center at Houston @ |