|
||||||||||||||||||||
| |
| Phenotypic Information (metabolism pathway, cancer, disease, phenome) |
| |
| |
| Gene-Gene Network Information: Co-Expression Network, Interacting Genes & KEGG |
| |
|


| Gene Summary for GSPT2 |
| Top |
| Phenotypic Information for GSPT2(metabolism pathway, cancer, disease, phenome) |
| Cancer | CGAP: GSPT2 |
| Familial Cancer Database: GSPT2 | |
| * This gene is included in those cancer gene databases. |
|
|
|
|
|
| . | ||||||||||||||
Oncogene 1 | Significant driver gene in | |||||||||||||||||||
| cf) number; DB name 1 Oncogene; http://nar.oxfordjournals.org/content/35/suppl_1/D721.long, 2 Tumor Suppressor gene; https://bioinfo.uth.edu/TSGene/, 3 Cancer Gene Census; http://www.nature.com/nrc/journal/v4/n3/abs/nrc1299.html, 4 CancerGenes; http://nar.oxfordjournals.org/content/35/suppl_1/D721.long, 5 Network of Cancer Gene; http://ncg.kcl.ac.uk/index.php, 1Therapeutic Vulnerabilities in Cancer; http://cbio.mskcc.org/cancergenomics/statius/ |
| REACTOME_METABOLISM_OF_PROTEINS REACTOME_METABOLISM_OF_MRNA REACTOME_METABOLISM_OF_RNA | |
| OMIM | 300418; gene. |
| Orphanet | |
| Disease | KEGG Disease: GSPT2 |
| MedGen: GSPT2 (Human Medical Genetics with Condition) | |
| ClinVar: GSPT2 | |
| Phenotype | MGI: GSPT2 (International Mouse Phenotyping Consortium) |
| PhenomicDB: GSPT2 | |
| Mutations for GSPT2 |
| * Under tables are showing count per each tissue to give us broad intuition about tissue specific mutation patterns.You can go to the detailed page for each mutation database's web site. |
| There's no structural variation information in COSMIC data for this gene. |
| * From mRNA Sanger sequences, Chitars2.0 arranged chimeric transcripts. This table shows GSPT2 related fusion information. |
| ID | Head Gene | Tail Gene | Accession | Gene_a | qStart_a | qEnd_a | Chromosome_a | tStart_a | tEnd_a | Gene_a | qStart_a | qEnd_a | Chromosome_a | tStart_a | tEnd_a |
| BQ008176 | SBSN | 18 | 212 | 19 | 36014269 | 36015640 | GSPT2 | 210 | 669 | X | 51487145 | 51487604 | |
| Top |
| There's no copy number variation information in COSMIC data for this gene. |
| Top |
|
 |
| Top |
| Stat. for Non-Synonymous SNVs (# total SNVs=49) | (# total SNVs=18) |
 |  |
(# total SNVs=1) | (# total SNVs=0) |
 |
| Top |
| * When you move the cursor on each content, you can see more deailed mutation information on the Tooltip. Those are primary_site,primary_histology,mutation(aa),pubmedID. |
| GRCh37 position | Mutation(aa) | Unique sampleID count |
| chr23:51488456-51488456 | p.Q578H | 2 |
| chr23:51487904-51487904 | p.T394T | 2 |
| chr23:51487261-51487261 | p.M180T | 2 |
| chr23:51487452-51487452 | p.E244K | 2 |
| chr23:51487973-51487973 | p.L417F | 2 |
| chr23:51487530-51487530 | p.E270K | 2 |
| chr23:51488443-51488443 | p.R574H | 2 |
| chr23:51487832-51487832 | p.L370L | 1 |
| chr23:51487184-51487184 | p.K154K | 1 |
| chr23:51487366-51487366 | p.G215D | 1 |
| Top |
|
 |
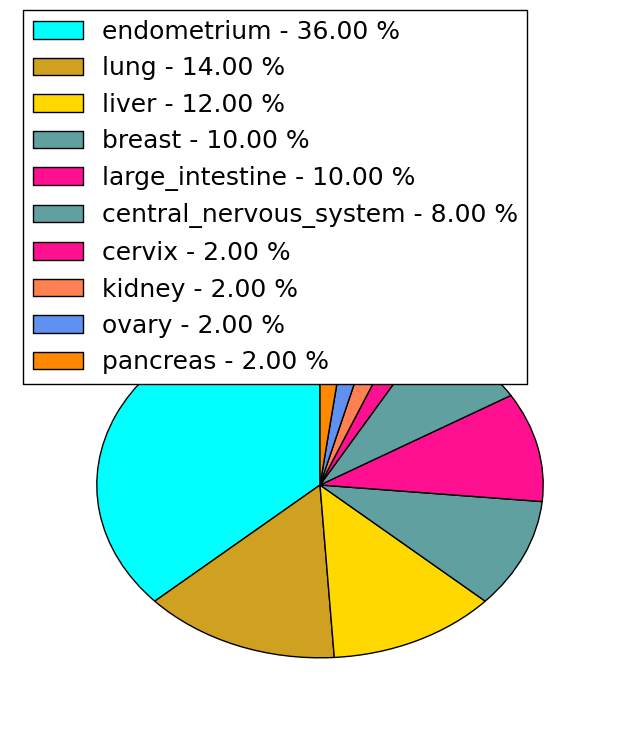
| Point Mutation/ Tissue ID | 1 | 2 | 3 | 4 | 5 | 6 | 7 | 8 | 9 | 10 | 11 | 12 | 13 | 14 | 15 | 16 | 17 | 18 | 19 | 20 |
| # sample | 2 | 1 | 5 | 2 | 4 | 2 | 5 | 3 | 2 | 9 | 4 | 12 | ||||||||
| # mutation | 2 | 1 | 6 | 2 | 4 | 2 | 5 | 3 | 2 | 9 | 4 | 17 | ||||||||
| nonsynonymous SNV | 2 | 1 | 5 | 2 | 4 | 4 | 1 | 1 | 6 | 1 | 14 | |||||||||
| synonymous SNV | 1 | 2 | 1 | 2 | 1 | 3 | 3 | 3 |
| cf) Tissue ID; Tissue type (1; BLCA[Bladder Urothelial Carcinoma], 2; BRCA[Breast invasive carcinoma], 3; CESC[Cervical squamous cell carcinoma and endocervical adenocarcinoma], 4; COAD[Colon adenocarcinoma], 5; GBM[Glioblastoma multiforme], 6; Glioma Low Grade, 7; HNSC[Head and Neck squamous cell carcinoma], 8; KICH[Kidney Chromophobe], 9; KIRC[Kidney renal clear cell carcinoma], 10; KIRP[Kidney renal papillary cell carcinoma], 11; LAML[Acute Myeloid Leukemia], 12; LUAD[Lung adenocarcinoma], 13; LUSC[Lung squamous cell carcinoma], 14; OV[Ovarian serous cystadenocarcinoma ], 15; PAAD[Pancreatic adenocarcinoma], 16; PRAD[Prostate adenocarcinoma], 17; SKCM[Skin Cutaneous Melanoma], 18:STAD[Stomach adenocarcinoma], 19:THCA[Thyroid carcinoma], 20:UCEC[Uterine Corpus Endometrial Carcinoma]) |
| Top |
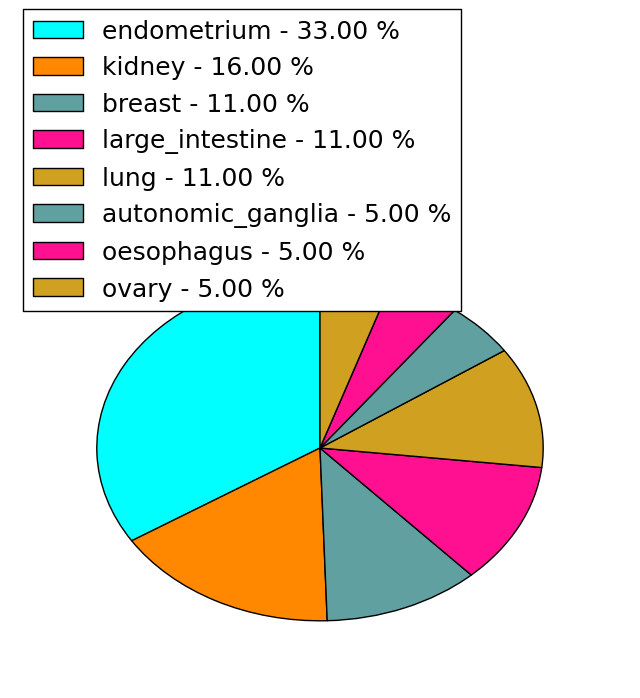
| * We represented just top 10 SNVs. When you move the cursor on each content, you can see more deailed mutation information on the Tooltip. Those are primary_site, primary_histology, mutation(aa), pubmedID. |
| Genomic Position | Mutation(aa) | Unique sampleID count |
| chrX:51487530 | p.E270K | 2 |
| chrX:51488390 | p.E361K | 1 |
| chrX:51487450 | p.V524V | 1 |
| chrX:51487831 | p.K627K | 1 |
| chrX:51488138 | p.E184D | 1 |
| chrX:51487184 | p.L370R | 1 |
| chrX:51488437 | p.Q525P | 1 |
| chrX:51487452 | p.V206I | 1 |
| chrX:51487832 | p.L370L | 1 |
| chrX:51488235 | p.I534I | 1 |
| * Copy number data were extracted from TCGA using R package TCGA-Assembler. The URLs of all public data files on TCGA DCC data server were gathered on Jan-05-2015. Function ProcessCNAData in TCGA-Assembler package was used to obtain gene-level copy number value which is calculated as the average copy number of the genomic region of a gene. |
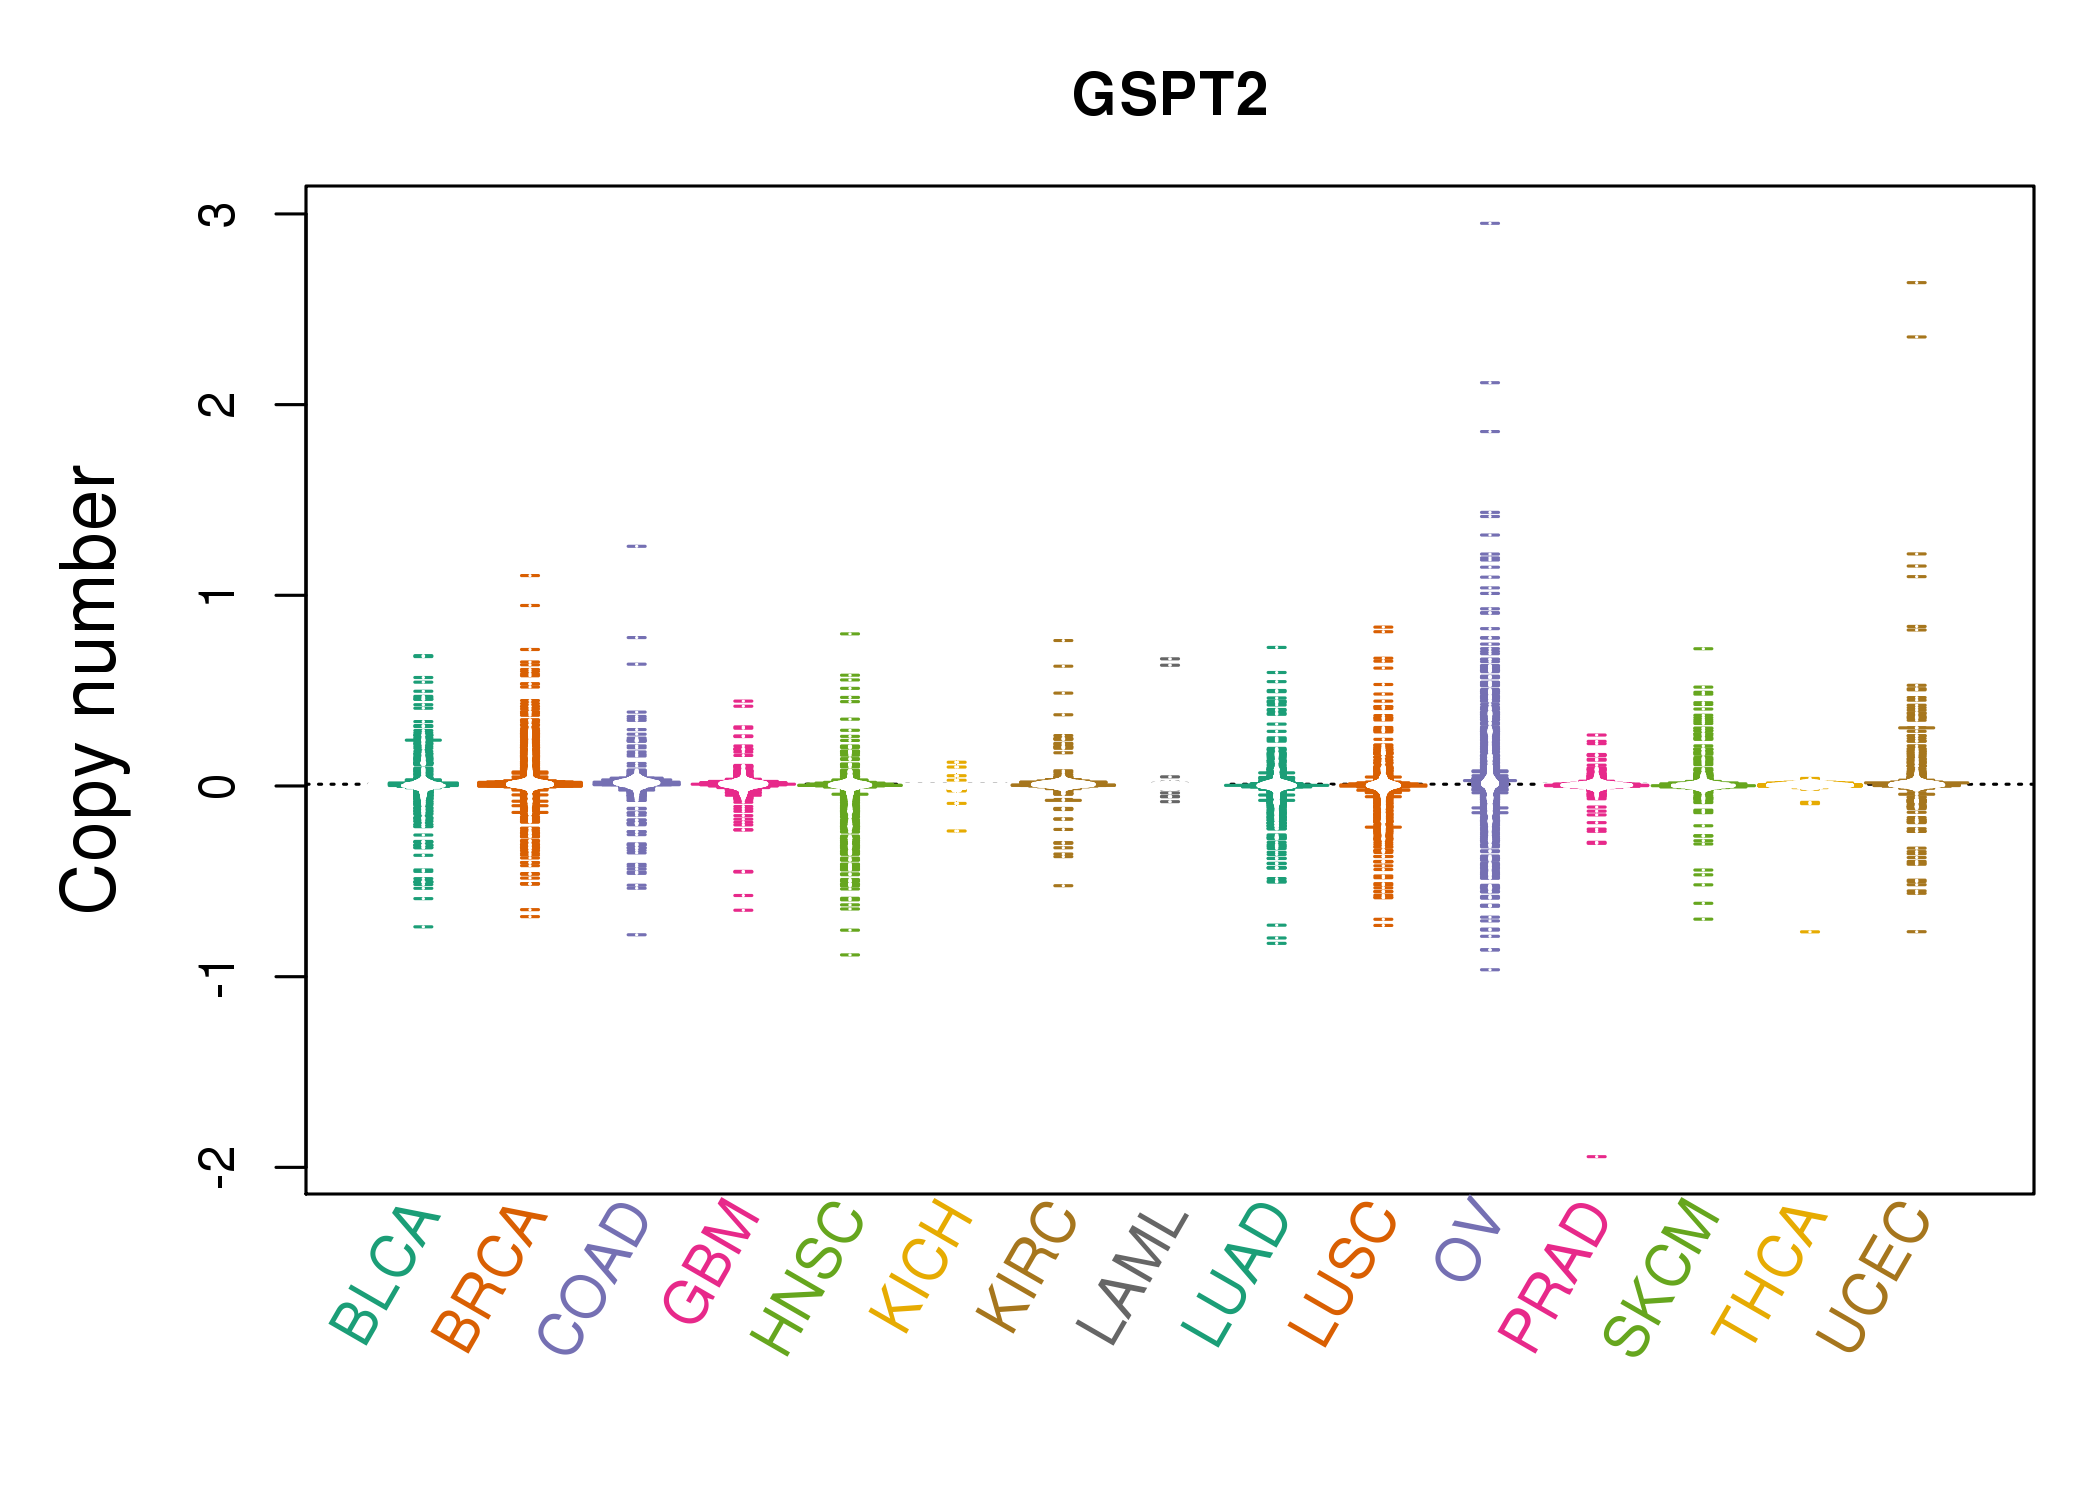 |
| cf) Tissue ID[Tissue type]: BLCA[Bladder Urothelial Carcinoma], BRCA[Breast invasive carcinoma], CESC[Cervical squamous cell carcinoma and endocervical adenocarcinoma], COAD[Colon adenocarcinoma], GBM[Glioblastoma multiforme], Glioma Low Grade, HNSC[Head and Neck squamous cell carcinoma], KICH[Kidney Chromophobe], KIRC[Kidney renal clear cell carcinoma], KIRP[Kidney renal papillary cell carcinoma], LAML[Acute Myeloid Leukemia], LUAD[Lung adenocarcinoma], LUSC[Lung squamous cell carcinoma], OV[Ovarian serous cystadenocarcinoma ], PAAD[Pancreatic adenocarcinoma], PRAD[Prostate adenocarcinoma], SKCM[Skin Cutaneous Melanoma], STAD[Stomach adenocarcinoma], THCA[Thyroid carcinoma], UCEC[Uterine Corpus Endometrial Carcinoma] |
| Top |
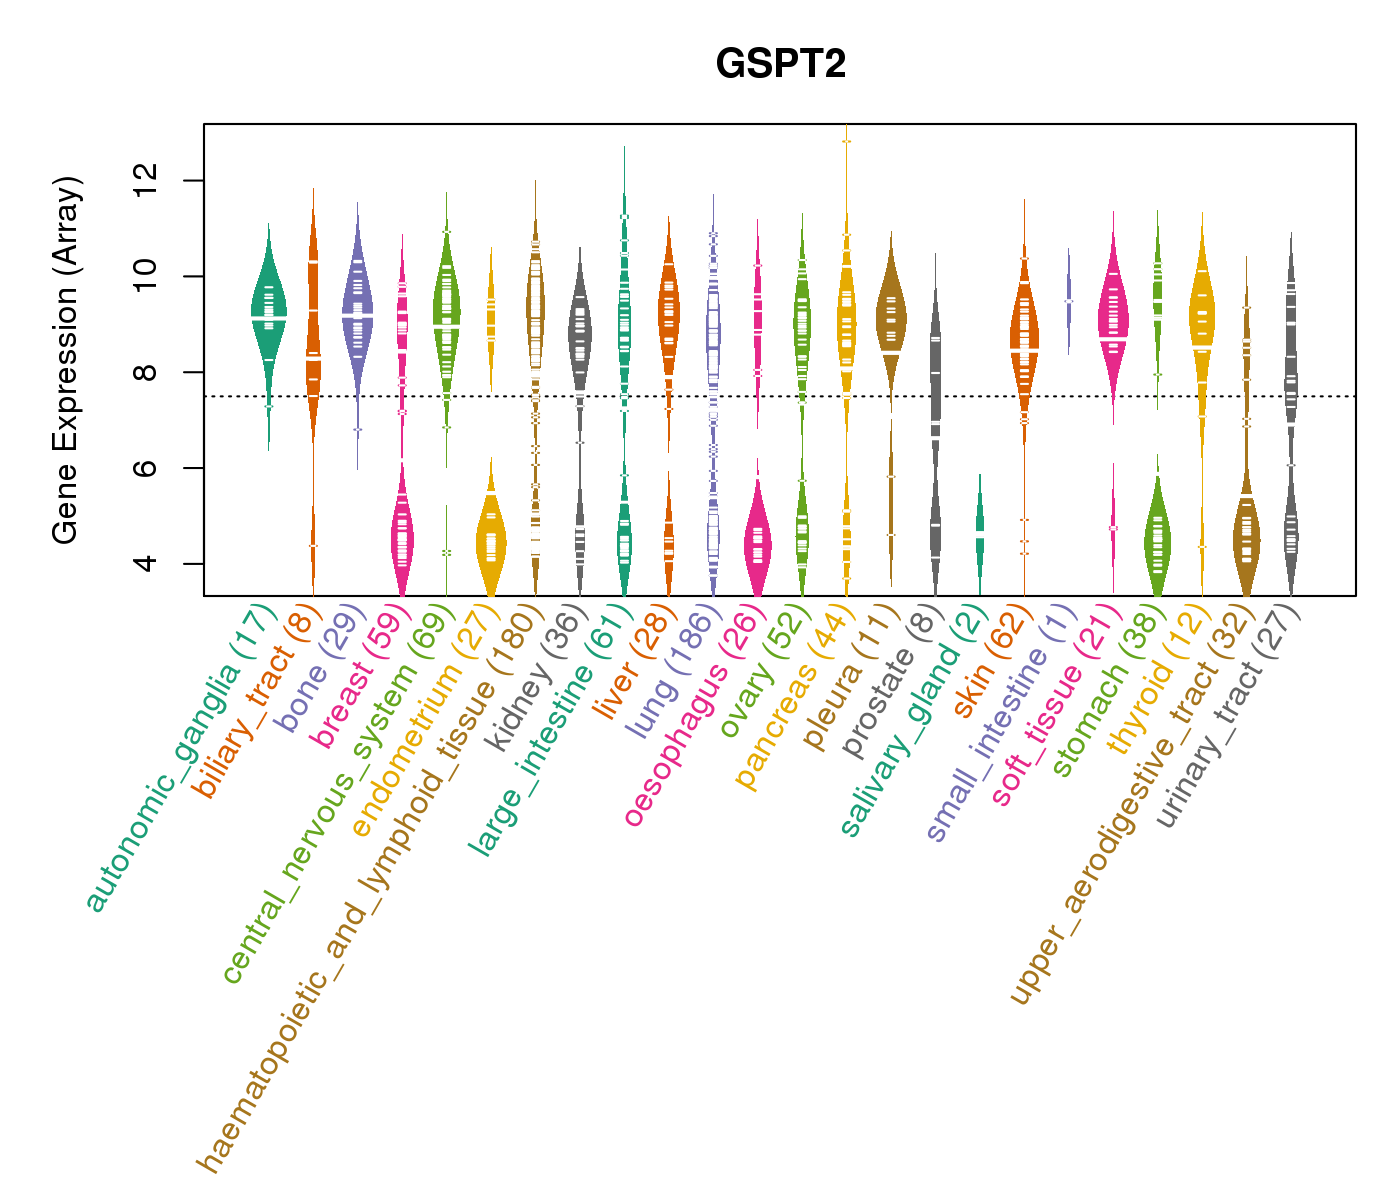
| Gene Expression for GSPT2 |
| * CCLE gene expression data were extracted from CCLE_Expression_Entrez_2012-10-18.res: Gene-centric RMA-normalized mRNA expression data. |
 |
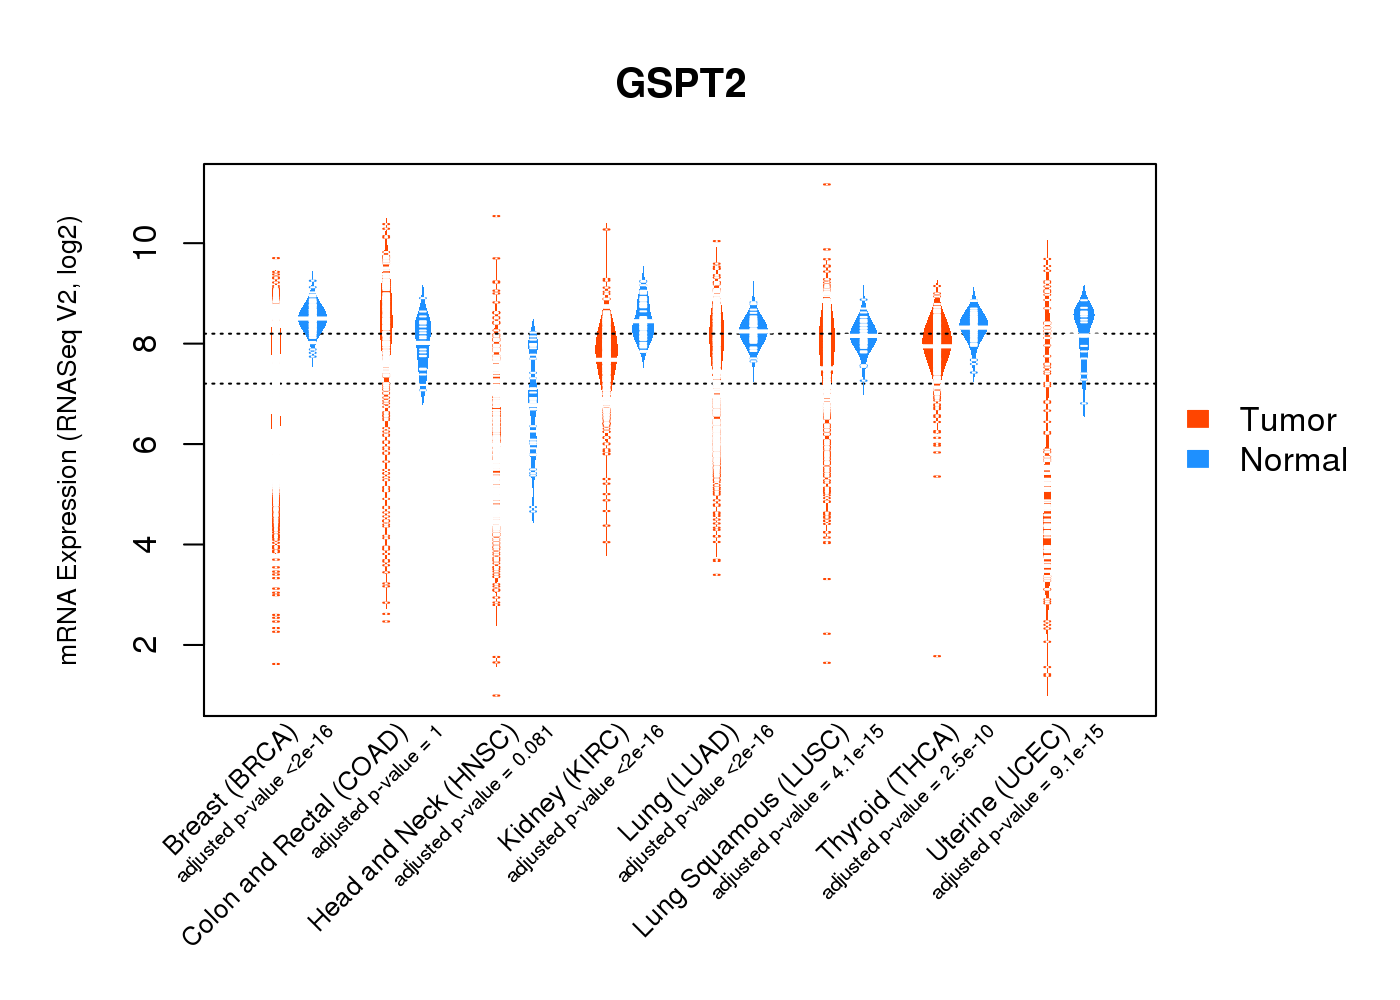
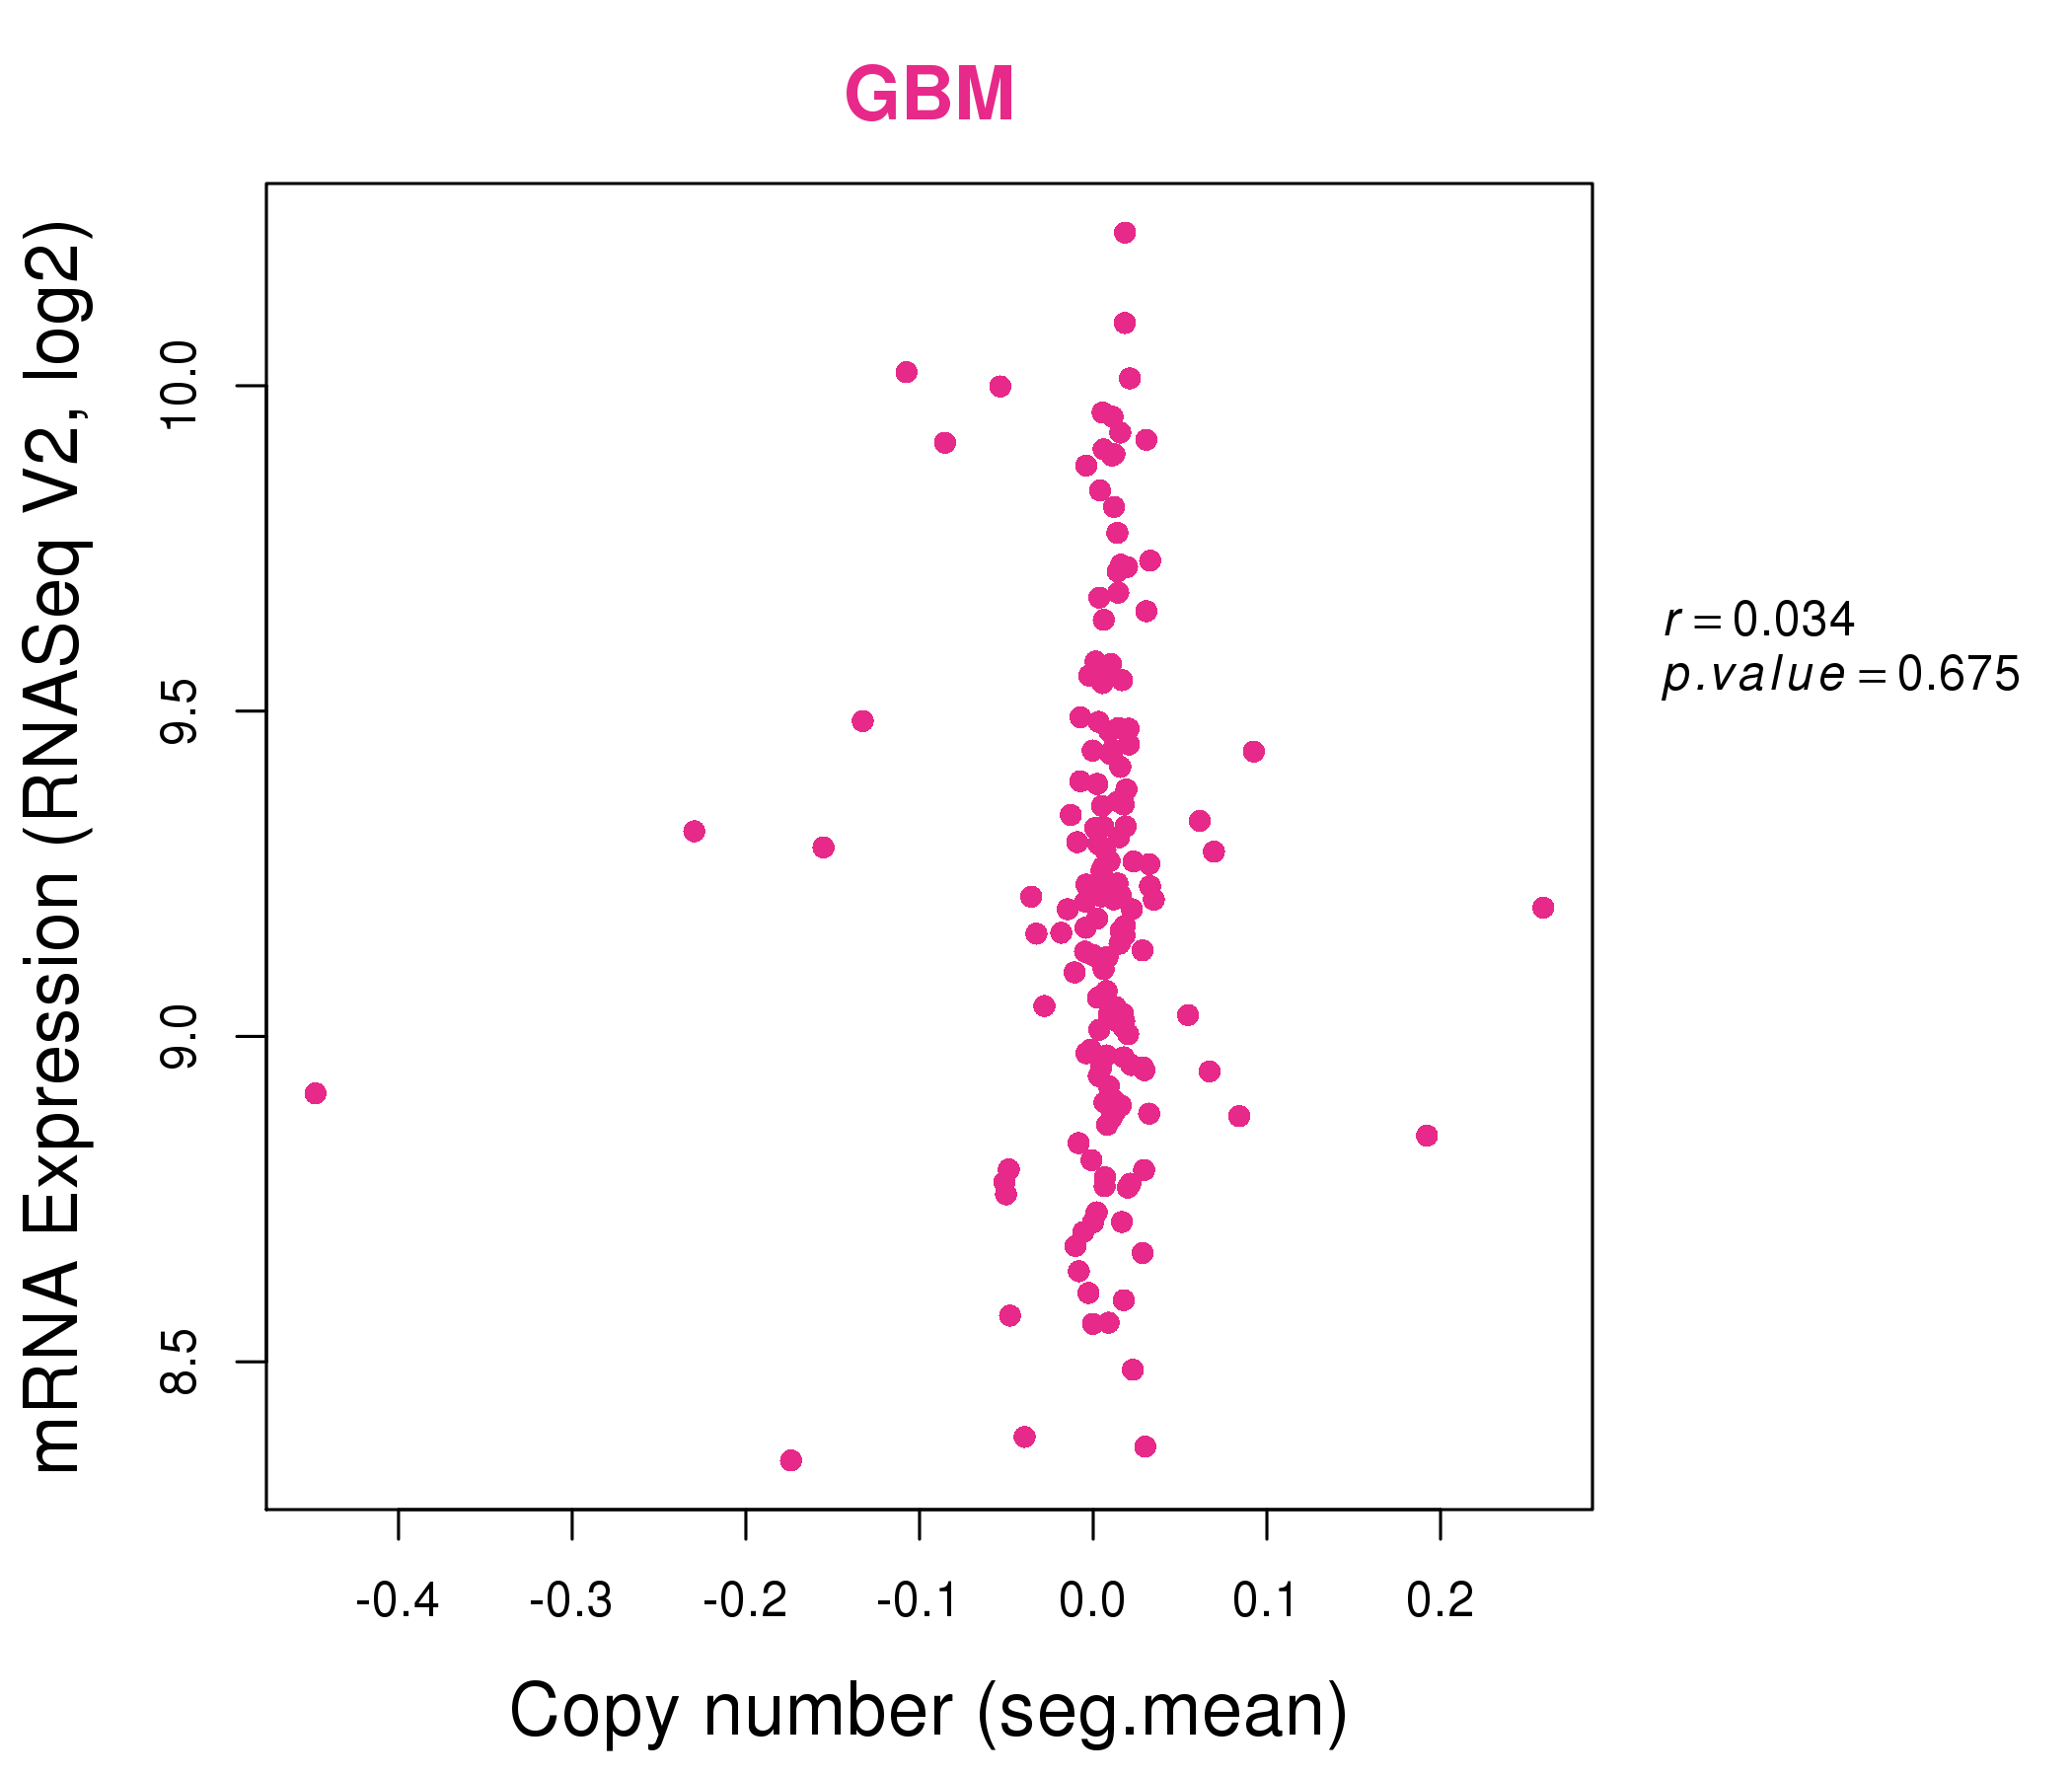
| * Normalized gene expression data of RNASeqV2 was extracted from TCGA using R package TCGA-Assembler. The URLs of all public data files on TCGA DCC data server were gathered at Jan-05-2015. Only eight cancer types have enough normal control samples for differential expression analysis. (t test, adjusted p<0.05 (using Benjamini-Hochberg FDR)) |
 |
| Top |
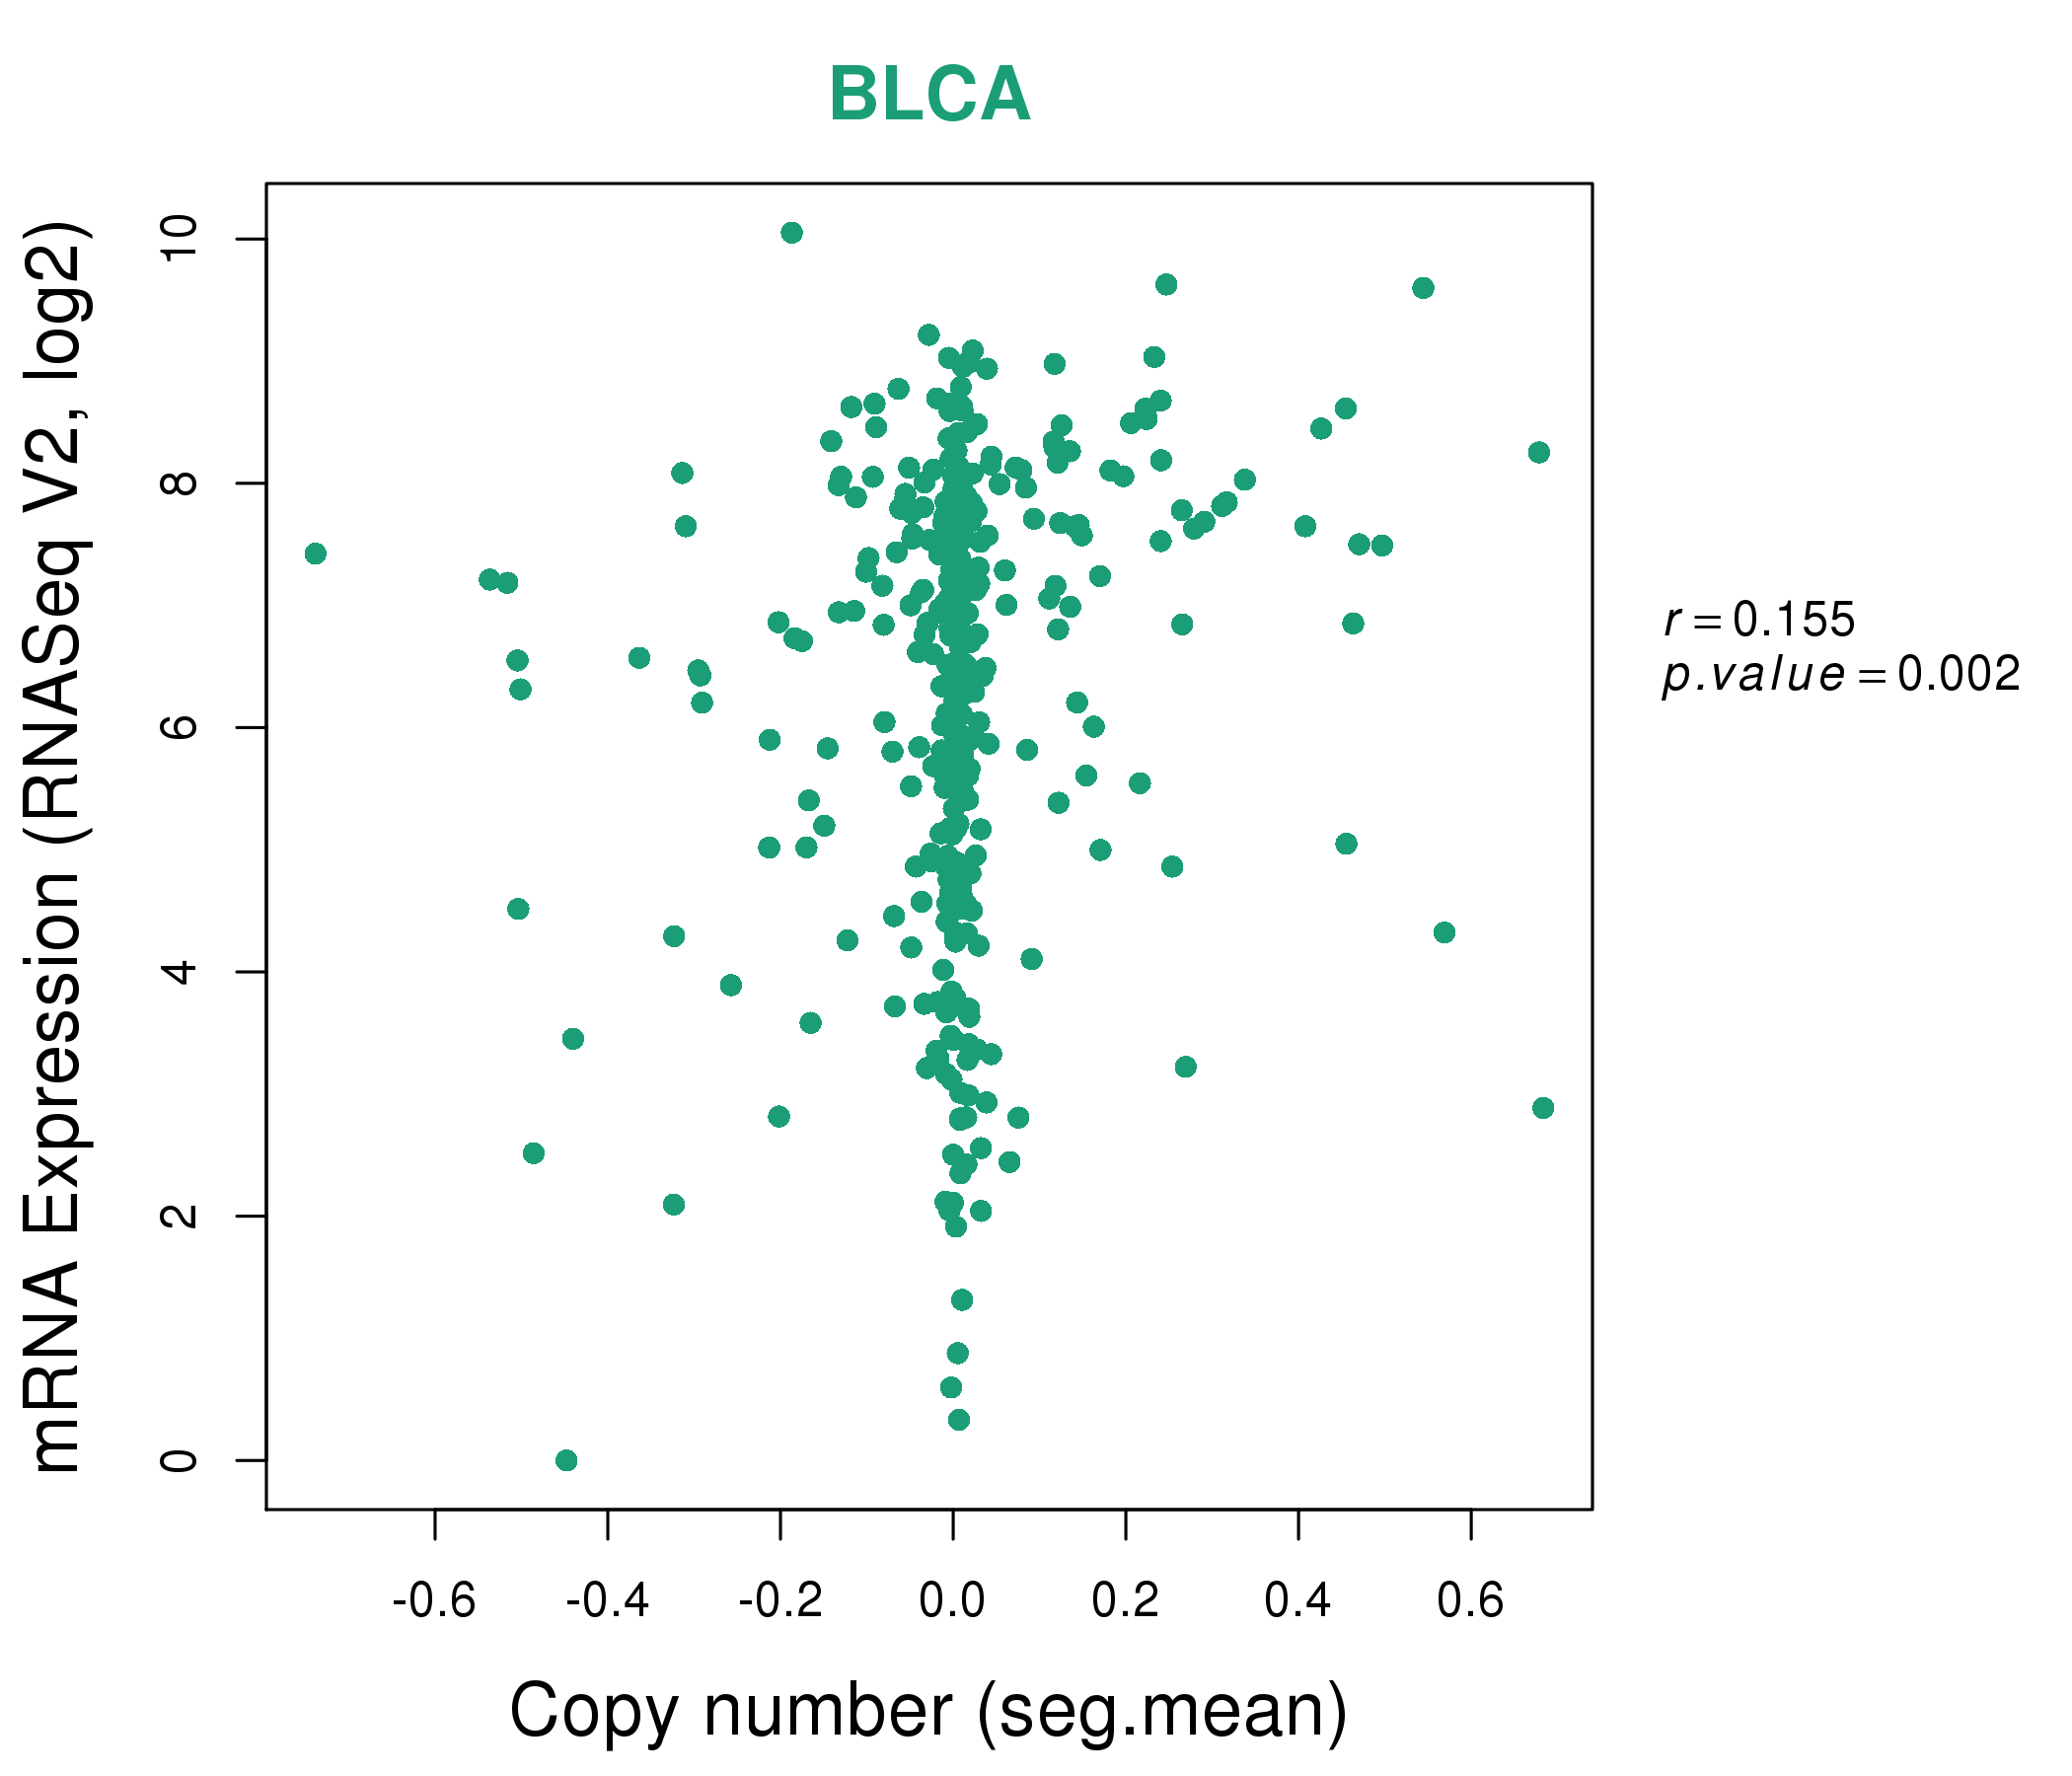
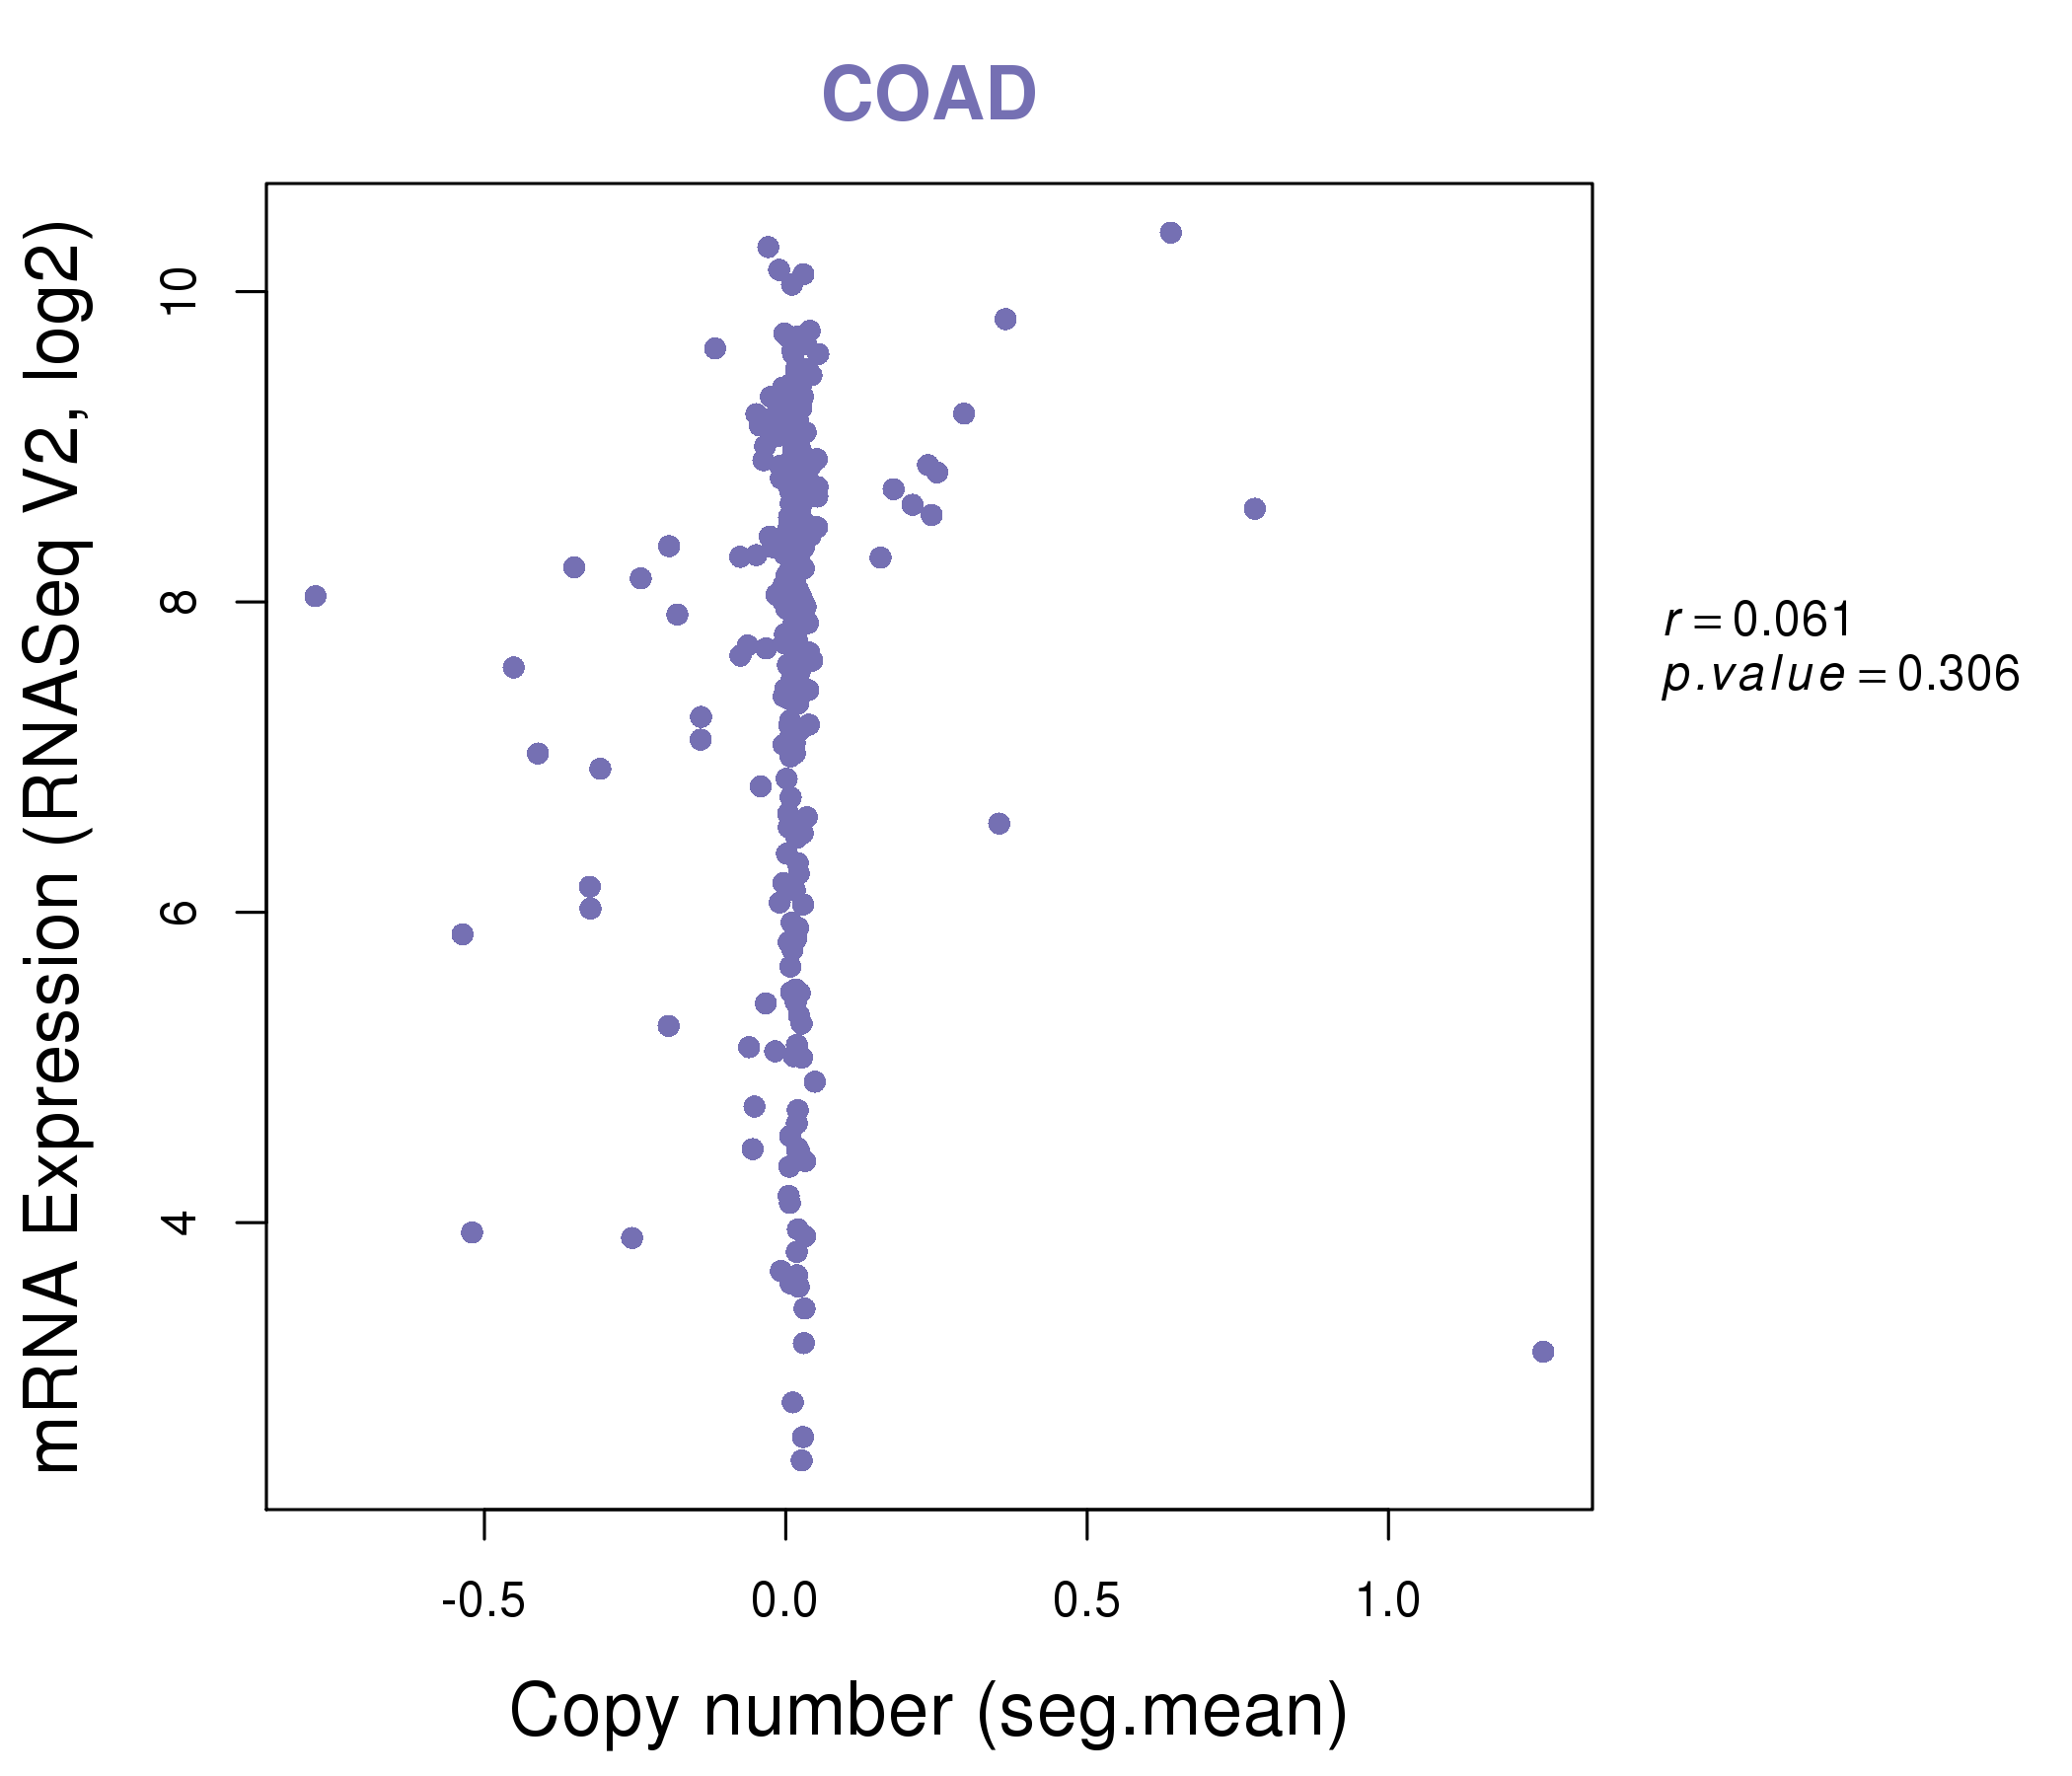
| * This plots show the correlation between CNV and gene expression. |
: Open all plots for all cancer types
 |
|
 |
|

| Top |
| Gene-Gene Network Information |
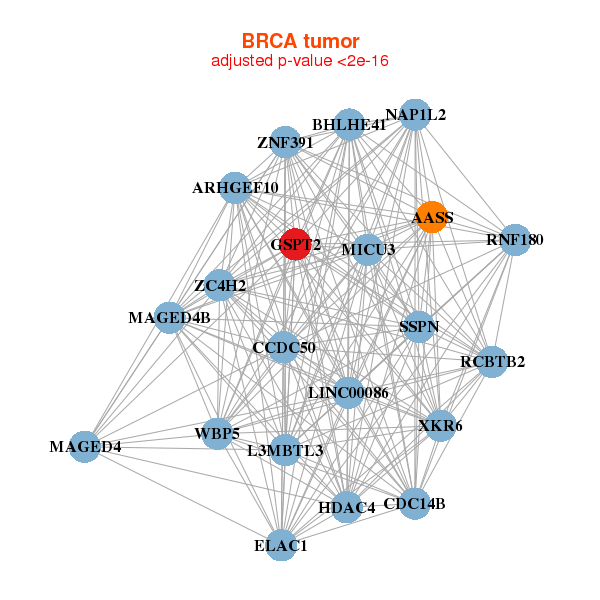
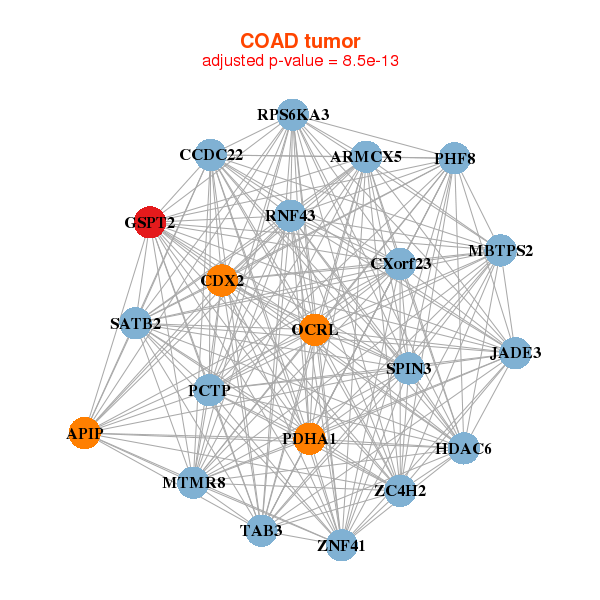
| * Co-Expression network figures were drawn using R package igraph. Only the top 20 genes with the highest correlations were shown. Red circle: input gene, orange circle: cell metabolism gene, sky circle: other gene |
: Open all plots for all cancer types
 |
|
| AASS,ARHGEF10,BHLHE41,CCDC50,CDC14B,MICU3,ELAC1, GSPT2,HDAC4,L3MBTL3,MAGED4,MAGED4B,NAP1L2,LINC00086, RCBTB2,RNF180,SSPN,WBP5,XKR6,ZC4H2,ZNF391 | C11orf57,YAE1D1,EAPP,GNRHR2,GSPT2,HOXA2,NAP1L2, PIGC,RBM22,RBM4B,RPL15,RPL22,SRSF8,SFT2D3, TMEM216,TRAM1L1,ZBTB9,ZCCHC3,ZNF20,ZNF22,ZNF416 |
 |
|
| APIP,ARMCX5,CCDC22,CDX2,CXorf23,GSPT2,HDAC6, MBTPS2,MTMR8,OCRL,PCTP,PDHA1,JADE3,PHF8, RNF43,RPS6KA3,SATB2,SPIN3,TAB3,ZC4H2,ZNF41 | ARHGAP20,ATF7IP2,XXYLT1,CABP1,EDA,EXOC4,FECH, GSPT2,HOXA10,LRP12,MAT1A,MEGF9,MEIS3P1,MTMR2, OGDHL,PHAX,RANBP6,SCUBE2,SMU1,SUOX,TANGO6 |
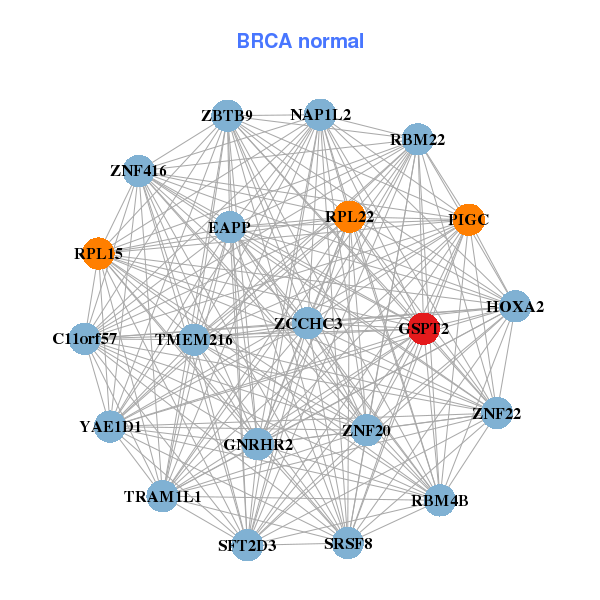
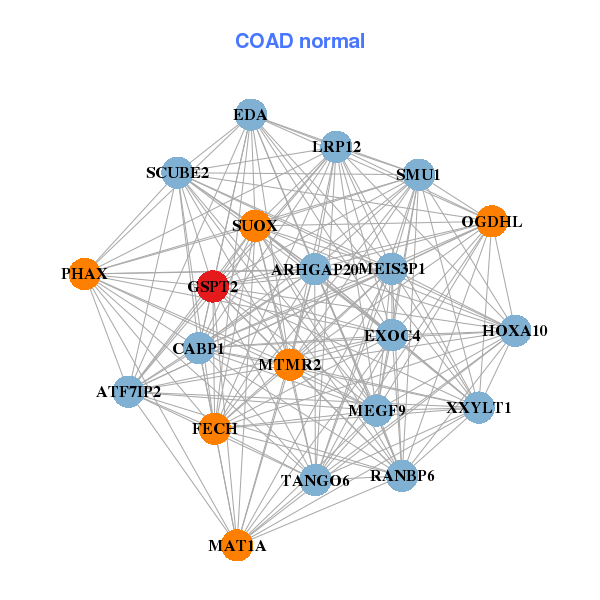
| * Co-Expression network figures were drawn using R package igraph. Only the top 20 genes with the highest correlations were shown. Red circle: input gene, orange circle: cell metabolism gene, sky circle: other gene |
: Open all plots for all cancer types
| Top |
: Open all interacting genes' information including KEGG pathway for all interacting genes from DAVID
| Top |
| Pharmacological Information for GSPT2 |
| There's no related Drug. |
| Top |
| Cross referenced IDs for GSPT2 |
| * We obtained these cross-references from Uniprot database. It covers 150 different DBs, 18 categories. http://www.uniprot.org/help/cross_references_section |
: Open all cross reference information
|
Copyright © 2016-Present - The Univsersity of Texas Health Science Center at Houston @ |