|
||||||||||||||||||||||||||||||||||||||||||||||||||||||||||||||||||||||||||||||||||||||||||||||||||||||||||||||||||||||||||||||||||||||||||||||||||||||||||||||||||||||||||||||||||||||||||||||||||||||||||||||||||||||||||||||||||||||||||||||||||||||||||||||||||||||||||||||||||||||||||||||||||||||||||||||||||||||||||||||||||||||||||||||||||||||||||||||||||||||||||||||
| |
| Phenotypic Information (metabolism pathway, cancer, disease, phenome) |
| |
| |
| Gene-Gene Network Information: Co-Expression Network, Interacting Genes & KEGG |
| |
|


| Gene Summary for MTOR |
| Basic gene info. | Gene symbol | MTOR |
| Gene name | mechanistic target of rapamycin (serine/threonine kinase) | |
| Synonyms | FRAP|FRAP1|FRAP2|RAFT1|RAPT1 | |
| Cytomap | UCSC genome browser: 1p36.2 | |
| Genomic location | chr1 :11166587-11322608 | |
| Type of gene | protein-coding | |
| RefGenes | NM_004958.3, | |
| Ensembl id | ENSG00000198793 | |
| Description | FK506 binding protein 12-rapamycin associated protein 2FK506-binding protein 12-rapamycin complex-associated protein 1FKBP-rapamycin associated proteinFKBP12-rapamycin complex-associated protein 1mammalian target of rapamycinrapamycin and FKBP12 targ | |
| Modification date | 20141222 | |
| dbXrefs | MIM : 601231 | |
| HGNC : HGNC | ||
| Ensembl : ENSG00000198793 | ||
| HPRD : 03134 | ||
| Vega : OTTHUMG00000002001 | ||
| Protein | UniProt: P42345 go to UniProt's Cross Reference DB Table | |
| Expression | CleanEX: HS_MTOR | |
| BioGPS: 2475 | ||
| Gene Expression Atlas: ENSG00000198793 | ||
| The Human Protein Atlas: ENSG00000198793 | ||
| Pathway | NCI Pathway Interaction Database: MTOR | |
| KEGG: MTOR | ||
| REACTOME: MTOR | ||
| ConsensusPathDB | ||
| Pathway Commons: MTOR | ||
| Metabolism | MetaCyc: MTOR | |
| HUMANCyc: MTOR | ||
| Regulation | Ensembl's Regulation: ENSG00000198793 | |
| miRBase: chr1 :11,166,587-11,322,608 | ||
| TargetScan: NM_004958 | ||
| cisRED: ENSG00000198793 | ||
| Context | iHOP: MTOR | |
| cancer metabolism search in PubMed: MTOR | ||
| UCL Cancer Institute: MTOR | ||
| Assigned class in ccmGDB | A - This gene has a literature evidence and it belongs to cancer gene. | |
| References showing role of MTOR in cancer cell metabolism | 1. Yuan L, Sheng X, Willson AK, Roque DR, Stine JE, et al. (2015) Glutamine promotes ovarian cancer cell proliferation through the mTOR/S6 pathway. Endocrine-related cancer 22: 577-591. go to article 2. Hsu C-C, Wu L-C, Hsia C-Y, Yin P-H, Chi CW, et al. (2015) Energy metabolism determines the sensitivity of human hepatocellular carcinoma cells to mitochondrial inhibitors and biguanide drugs. Oncology reports. go to article 3. Demel H-R, Feuerecker B, Piontek G, Seidl C, Blechert B, et al. (2015) Effects of topoisomerase inhibitors that induce DNA damage response on glucose metabolism and PI3K/Akt/mTOR signaling in multiple myeloma cells. American Journal of Cancer Research 5: 1649. go to article | |
| Top |
| Phenotypic Information for MTOR(metabolism pathway, cancer, disease, phenome) |
| Cancer | CGAP: MTOR |
| Familial Cancer Database: MTOR | |
| * This gene is included in those cancer gene databases. |
|
|
|
|
|
| . | ||||||||||||||||||||||||||||||||||||||||||||||||||||||||||||||||||||||||||||||||||||||||||||||||||||||||||||||||||||||||||||||||||||||||||||||||||||||||||||||||||||||||||||||||||||||||||||||||||||||||||||||||||||||||||||||||||||||||||||||||||||||||||||||||||||||||||||||||||||||||||||||||||||||||||||||||||||||||||||||||||||||||||||||||||||||||||||||||||||||||
Oncogene 1 | Significant driver gene in KIRC 6, | |||||||||||||||||||||||||||||||||||||||||||||||||||||||||||||||||||||||||||||||||||||||||||||||||||||||||||||||||||||||||||||||||||||||||||||||||||||||||||||||||||||||||||||||||||||||||||||||||||||||||||||||||||||||||||||||||||||||||||||||||||||||||||||||||||||||||||||||||||||||||||||||||||||||||||||||||||||||||||||||||||||||||||||||||||||||||||||||||||||||||||||
| cf) number; DB name 1 Oncogene; http://nar.oxfordjournals.org/content/35/suppl_1/D721.long, 2 Tumor Suppressor gene; https://bioinfo.uth.edu/TSGene/, 3 Cancer Gene Census; http://www.nature.com/nrc/journal/v4/n3/abs/nrc1299.html, 4 CancerGenes; http://nar.oxfordjournals.org/content/35/suppl_1/D721.long, 5 Network of Cancer Gene; http://ncg.kcl.ac.uk/index.php, 6 http://www.nature.com/nature/journal/v499/n7456/full/nature12222.html, 7Therapeutic Vulnerabilities in Cancer; http://cbio.mskcc.org/cancergenomics/statius/ |
| Nat Rev Drug Discovery, 2013, 12: 829, doi: 10.1038/nrd4145 | |
| OMIM | 601231; gene. |
| Orphanet | |
| Disease | KEGG Disease: MTOR |
| MedGen: MTOR (Human Medical Genetics with Condition) | |
| ClinVar: MTOR | |
| Phenotype | MGI: MTOR (International Mouse Phenotyping Consortium) |
| PhenomicDB: MTOR | |
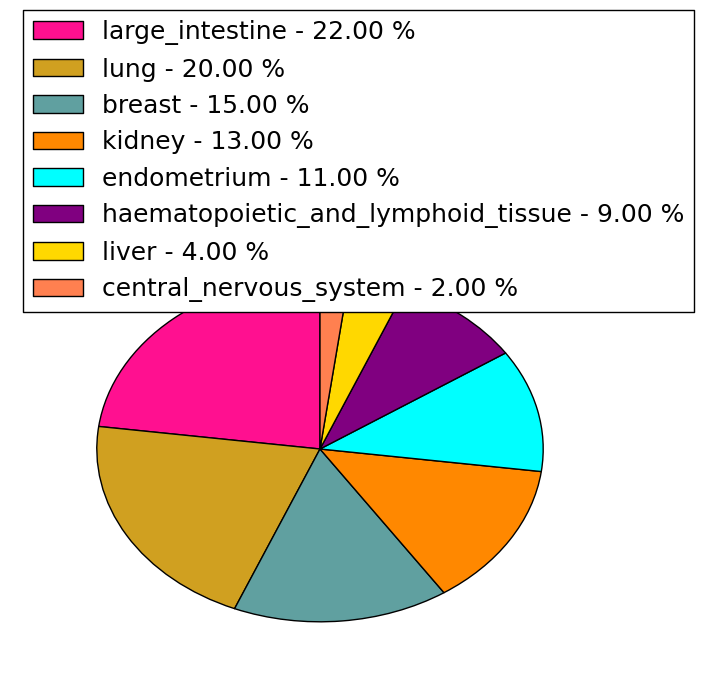
| Mutations for MTOR |
| * Under tables are showing count per each tissue to give us broad intuition about tissue specific mutation patterns.You can go to the detailed page for each mutation database's web site. |
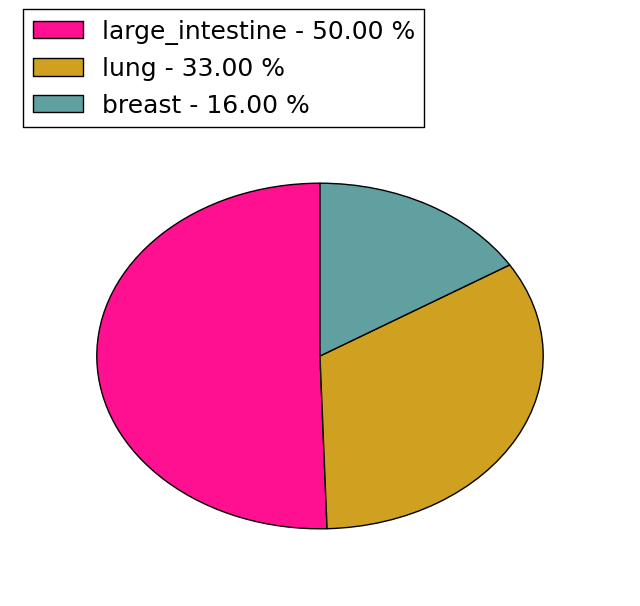
| - Statistics for Tissue and Mutation type | Top |
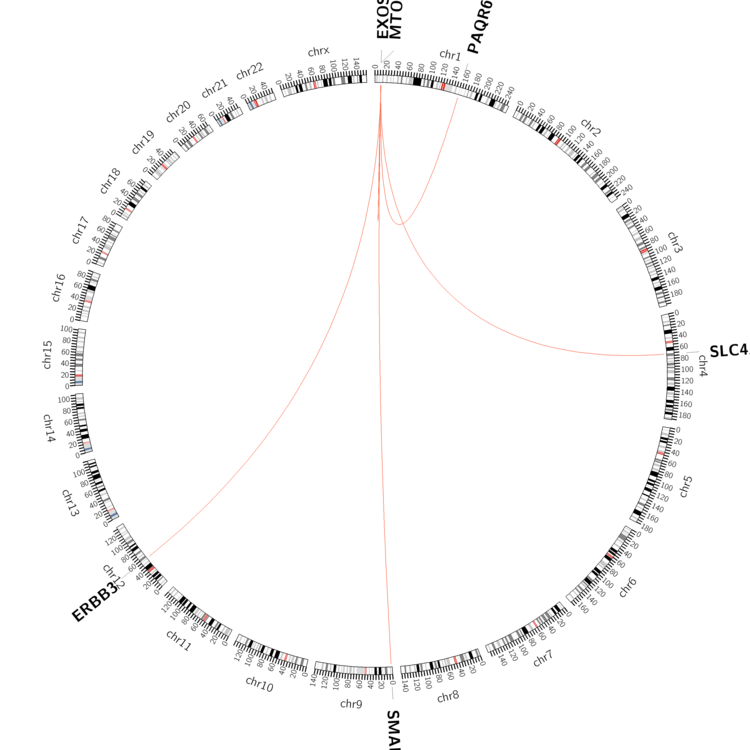 |
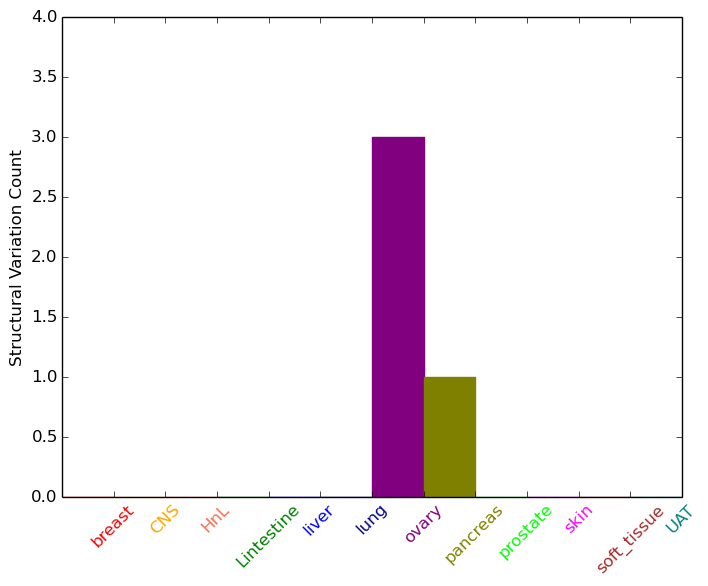
| - For Inter-chromosomal Variations |
| * Inter-chromosomal variantions includes 'interchromosomal amplicon to amplicon', 'interchromosomal amplicon to non-amplified dna', 'interchromosomal insertion', 'Interchromosomal unknown type'. |
 |
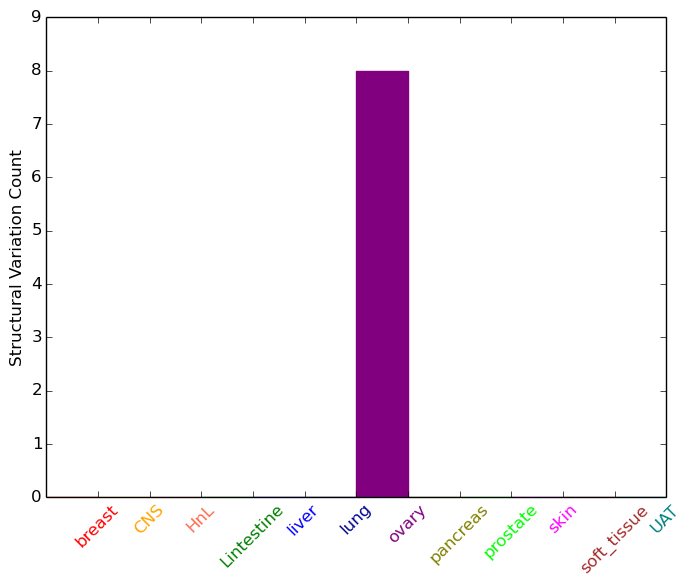
| - For Intra-chromosomal Variations |
| * Intra-chromosomal variantions includes 'intrachromosomal amplicon to amplicon', 'intrachromosomal amplicon to non-amplified dna', 'intrachromosomal deletion', 'intrachromosomal fold-back inversion', 'intrachromosomal inversion', 'intrachromosomal tandem duplication', 'Intrachromosomal unknown type', 'intrachromosomal with inverted orientation', 'intrachromosomal with non-inverted orientation'. |
 |
| Sample | Symbol_a | Chr_a | Start_a | End_a | Symbol_b | Chr_b | Start_b | End_b |
| ovary | MTOR | chr1 | 11171032 | 11171052 | MTOR | chr1 | 11171210 | 11171230 |
| ovary | MTOR | chr1 | 11173881 | 11173901 | EXOSC10 | chr1 | 11153362 | 11153382 |
| ovary | MTOR | chr1 | 11174480 | 11174500 | SMARCA2 | chr9 | 2087254 | 2087274 |
| ovary | MTOR | chr1 | 11244837 | 11244857 | ERBB3 | chr12 | 56494895 | 56494915 |
| ovary | MTOR | chr1 | 11249948 | 11249968 | PAQR6 | chr1 | 156217772 | 156217792 |
| ovary | MTOR | chr1 | 11251881 | 11251901 | MTOR | chr1 | 11247244 | 11247264 |
| ovary | MTOR | chr1 | 11283672 | 11283692 | chr1 | 10695499 | 10695519 | |
| ovary | MTOR | chr1 | 11313852 | 11313872 | MTOR | chr1 | 11299374 | 11299394 |
| pancreas | MTOR | chr1 | 11311581 | 11311781 | SLC4A4 | chr4 | 72105160 | 72105360 |
| cf) Tissue number; Tissue name (1;Breast, 2;Central_nervous_system, 3;Haematopoietic_and_lymphoid_tissue, 4;Large_intestine, 5;Liver, 6;Lung, 7;Ovary, 8;Pancreas, 9;Prostate, 10;Skin, 11;Soft_tissue, 12;Upper_aerodigestive_tract) |
| * From mRNA Sanger sequences, Chitars2.0 arranged chimeric transcripts. This table shows MTOR related fusion information. |
| ID | Head Gene | Tail Gene | Accession | Gene_a | qStart_a | qEnd_a | Chromosome_a | tStart_a | tEnd_a | Gene_a | qStart_a | qEnd_a | Chromosome_a | tStart_a | tEnd_a |
| BF845885 | RASGEF1B | 37 | 408 | 4 | 82365981 | 82366349 | MTOR | 403 | 531 | 1 | 11317791 | 11317919 | |
| BG194684 | PNPLA1 | 1 | 204 | 6 | 36274069 | 36275482 | MTOR | 195 | 238 | 1 | 11209072 | 11209117 | |
| BE149450 | HK1 | 29 | 161 | 10 | 71139645 | 71139779 | MTOR | 149 | 404 | 1 | 11167074 | 11167330 | |
| BF845891 | RASGEF1B | 28 | 395 | 4 | 82365981 | 82366351 | MTOR | 390 | 518 | 1 | 11317791 | 11317919 | |
| BE830802 | MTOR | 5 | 127 | 1 | 11186756 | 11187093 | MTOR | 119 | 296 | 1 | 11182129 | 11184677 | |
| BE380007 | MTOR | 1 | 132 | 1 | 11184403 | 11184534 | SOCS4 | 130 | 633 | 14 | 55514896 | 55515402 | |
| BF845998 | RASGEF1B | 10 | 375 | 4 | 82365981 | 82366349 | MTOR | 370 | 463 | 1 | 11317826 | 11317919 | |
| DB084769 | OCIAD1 | 1 | 348 | 4 | 48833080 | 48850463 | MTOR | 349 | 567 | 1 | 11193152 | 11194523 | |
| Top |
| Mutation type/ Tissue ID | brca | cns | cerv | endome | haematopo | kidn | Lintest | liver | lung | ns | ovary | pancre | prost | skin | stoma | thyro | urina | |||
| Total # sample | 1 | |||||||||||||||||||
| GAIN (# sample) | 1 | |||||||||||||||||||
| LOSS (# sample) |
| cf) Tissue ID; Tissue type (1; Breast, 2; Central_nervous_system, 3; Cervix, 4; Endometrium, 5; Haematopoietic_and_lymphoid_tissue, 6; Kidney, 7; Large_intestine, 8; Liver, 9; Lung, 10; NS, 11; Ovary, 12; Pancreas, 13; Prostate, 14; Skin, 15; Stomach, 16; Thyroid, 17; Urinary_tract) |
| Top |
|
 |
| Top |
| Stat. for Non-Synonymous SNVs (# total SNVs=314) | (# total SNVs=44) |
 |  |
(# total SNVs=6) | (# total SNVs=0) |
 |
| Top |
| * When you move the cursor on each content, you can see more deailed mutation information on the Tooltip. Those are primary_site,primary_histology,mutation(aa),pubmedID. |
| GRCh37 position | Mutation(aa) | Unique sampleID count |
| chr1:11184573-11184573 | p.S2215Y | 12 |
| chr1:11190804-11190804 | p.E1799K | 8 |
| chr1:11188078-11188078 | p.V2006F | 5 |
| chr1:11188164-11188164 | p.T1977K | 5 |
| chr1:11169361-11169361 | p.R2505P | 5 |
| chr1:11169375-11169375 | p.I2500M | 4 |
| chr1:11272938-11272938 | p.A1105T | 4 |
| chr1:11174395-11174395 | p.L2427Q | 4 |
| chr1:11319346-11319346 | p.A41P | 3 |
| chr1:11177096-11177096 | p.M2327I | 3 |
| Top |
|
 |
| Point Mutation/ Tissue ID | 1 | 2 | 3 | 4 | 5 | 6 | 7 | 8 | 9 | 10 | 11 | 12 | 13 | 14 | 15 | 16 | 17 | 18 | 19 | 20 |
| # sample | 2 | 15 | 2 | 41 | 9 | 7 | 2 | 34 | 3 | 27 | 11 | 9 | 2 | 19 | 23 | 35 | ||||
| # mutation | 2 | 15 | 2 | 40 | 10 | 7 | 2 | 30 | 3 | 31 | 12 | 9 | 2 | 23 | 28 | 48 | ||||
| nonsynonymous SNV | 2 | 11 | 2 | 32 | 7 | 6 | 2 | 26 | 2 | 27 | 9 | 9 | 2 | 12 | 21 | 43 | ||||
| synonymous SNV | 4 | 8 | 3 | 1 | 4 | 1 | 4 | 3 | 11 | 7 | 5 |
| cf) Tissue ID; Tissue type (1; BLCA[Bladder Urothelial Carcinoma], 2; BRCA[Breast invasive carcinoma], 3; CESC[Cervical squamous cell carcinoma and endocervical adenocarcinoma], 4; COAD[Colon adenocarcinoma], 5; GBM[Glioblastoma multiforme], 6; Glioma Low Grade, 7; HNSC[Head and Neck squamous cell carcinoma], 8; KICH[Kidney Chromophobe], 9; KIRC[Kidney renal clear cell carcinoma], 10; KIRP[Kidney renal papillary cell carcinoma], 11; LAML[Acute Myeloid Leukemia], 12; LUAD[Lung adenocarcinoma], 13; LUSC[Lung squamous cell carcinoma], 14; OV[Ovarian serous cystadenocarcinoma ], 15; PAAD[Pancreatic adenocarcinoma], 16; PRAD[Prostate adenocarcinoma], 17; SKCM[Skin Cutaneous Melanoma], 18:STAD[Stomach adenocarcinoma], 19:THCA[Thyroid carcinoma], 20:UCEC[Uterine Corpus Endometrial Carcinoma]) |
| Top |
| * We represented just top 10 SNVs. When you move the cursor on each content, you can see more deailed mutation information on the Tooltip. Those are primary_site, primary_histology, mutation(aa), pubmedID. |
| Genomic Position | Mutation(aa) | Unique sampleID count |
| chr1:11184573 | p.S2215Y | 9 |
| chr1:11190804 | p.E1799K | 6 |
| chr1:11188164 | p.T1977K | 5 |
| chr1:11272938 | p.A1105T | 4 |
| chr1:11169375 | p.F1888I | 3 |
| chr1:11189847 | p.I2500M | 3 |
| chr1:11217230 | p.C1483Y | 3 |
| chr1:11177096 | p.R957Q | 2 |
| chr1:11188177 | p.R1616H | 2 |
| chr1:11174395 | p.I1973F | 2 |
| * Copy number data were extracted from TCGA using R package TCGA-Assembler. The URLs of all public data files on TCGA DCC data server were gathered on Jan-05-2015. Function ProcessCNAData in TCGA-Assembler package was used to obtain gene-level copy number value which is calculated as the average copy number of the genomic region of a gene. |
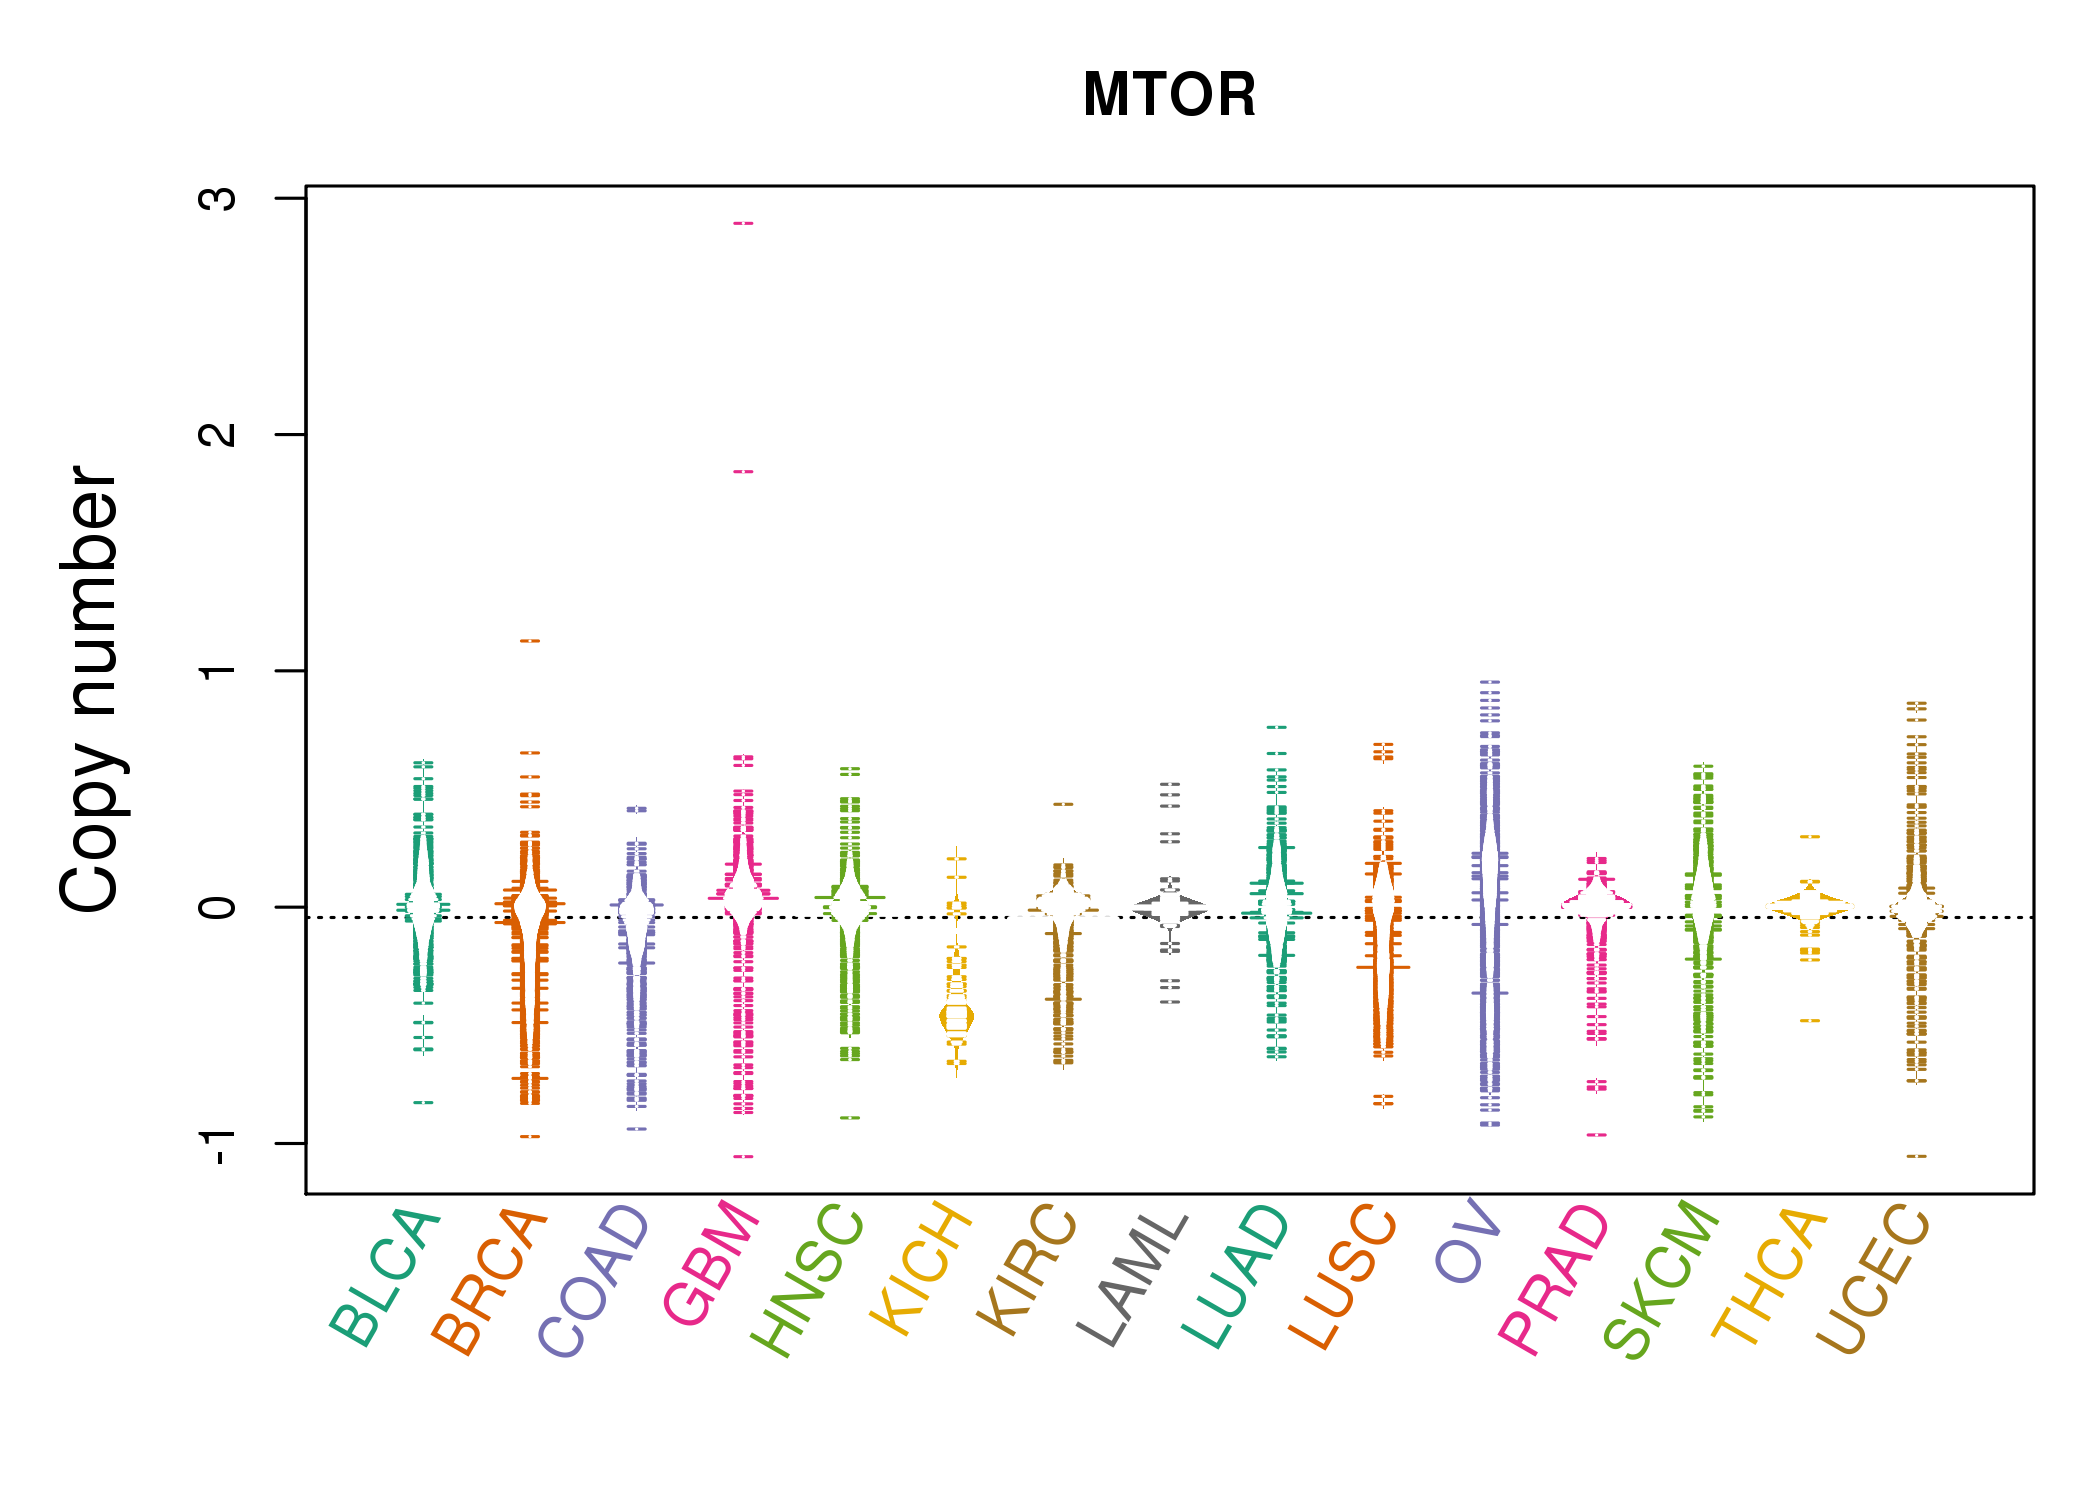 |
| cf) Tissue ID[Tissue type]: BLCA[Bladder Urothelial Carcinoma], BRCA[Breast invasive carcinoma], CESC[Cervical squamous cell carcinoma and endocervical adenocarcinoma], COAD[Colon adenocarcinoma], GBM[Glioblastoma multiforme], Glioma Low Grade, HNSC[Head and Neck squamous cell carcinoma], KICH[Kidney Chromophobe], KIRC[Kidney renal clear cell carcinoma], KIRP[Kidney renal papillary cell carcinoma], LAML[Acute Myeloid Leukemia], LUAD[Lung adenocarcinoma], LUSC[Lung squamous cell carcinoma], OV[Ovarian serous cystadenocarcinoma ], PAAD[Pancreatic adenocarcinoma], PRAD[Prostate adenocarcinoma], SKCM[Skin Cutaneous Melanoma], STAD[Stomach adenocarcinoma], THCA[Thyroid carcinoma], UCEC[Uterine Corpus Endometrial Carcinoma] |
| Top |
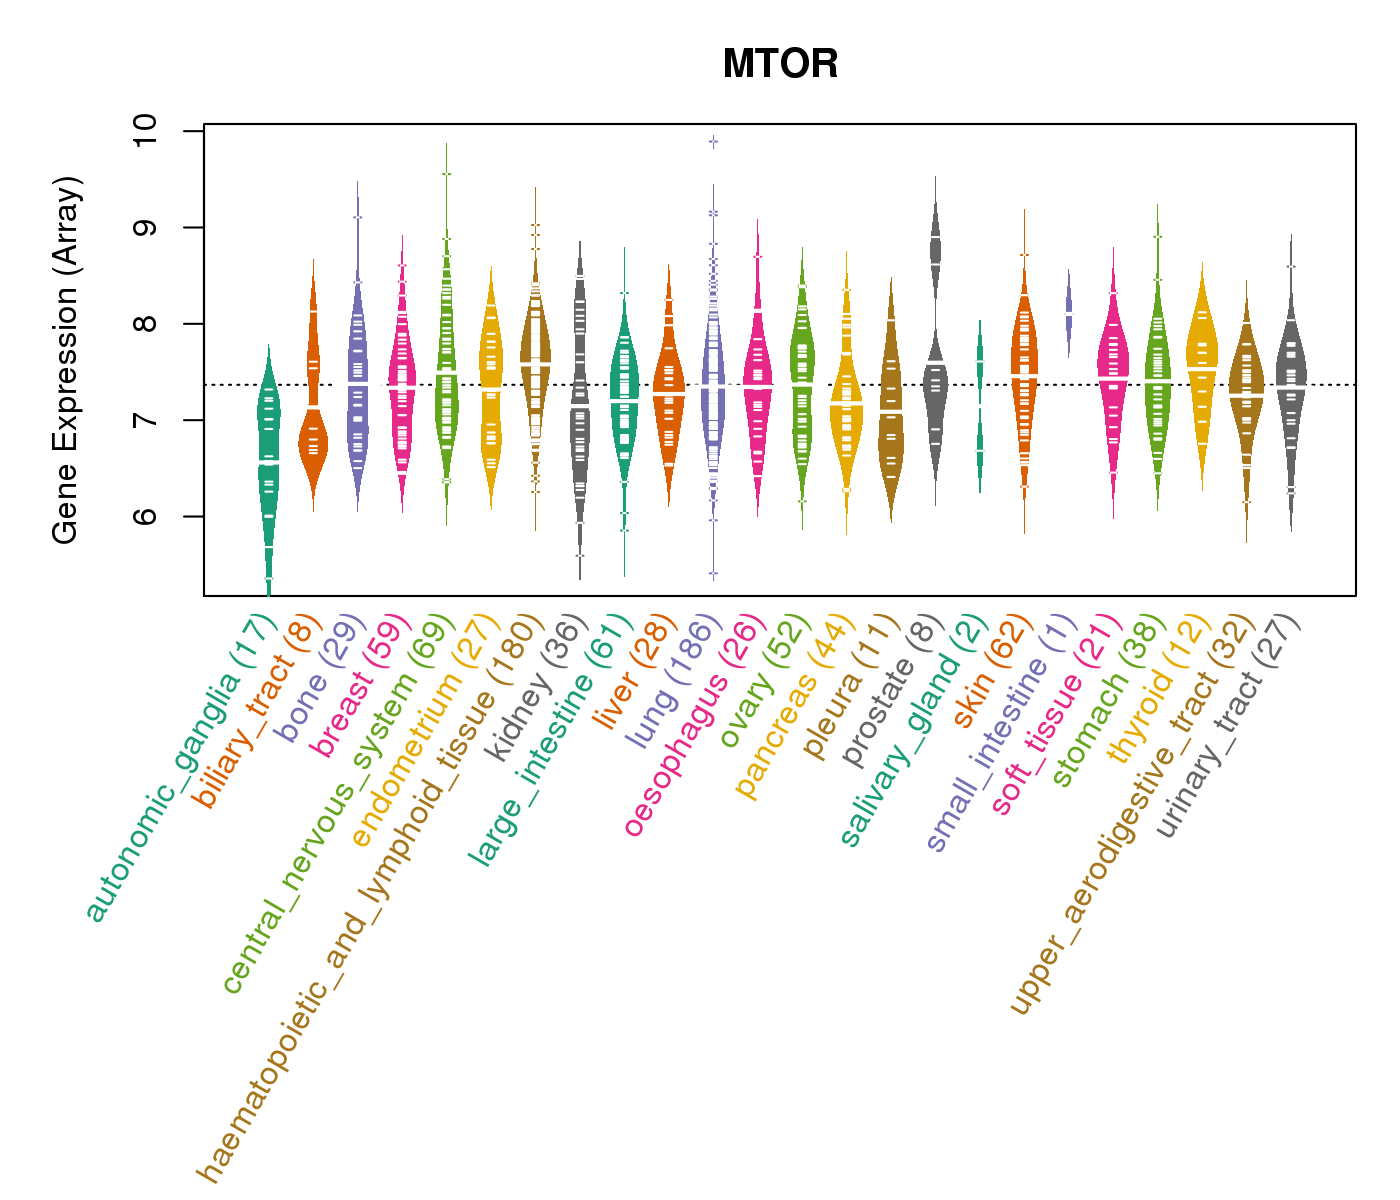
| Gene Expression for MTOR |
| * CCLE gene expression data were extracted from CCLE_Expression_Entrez_2012-10-18.res: Gene-centric RMA-normalized mRNA expression data. |
 |
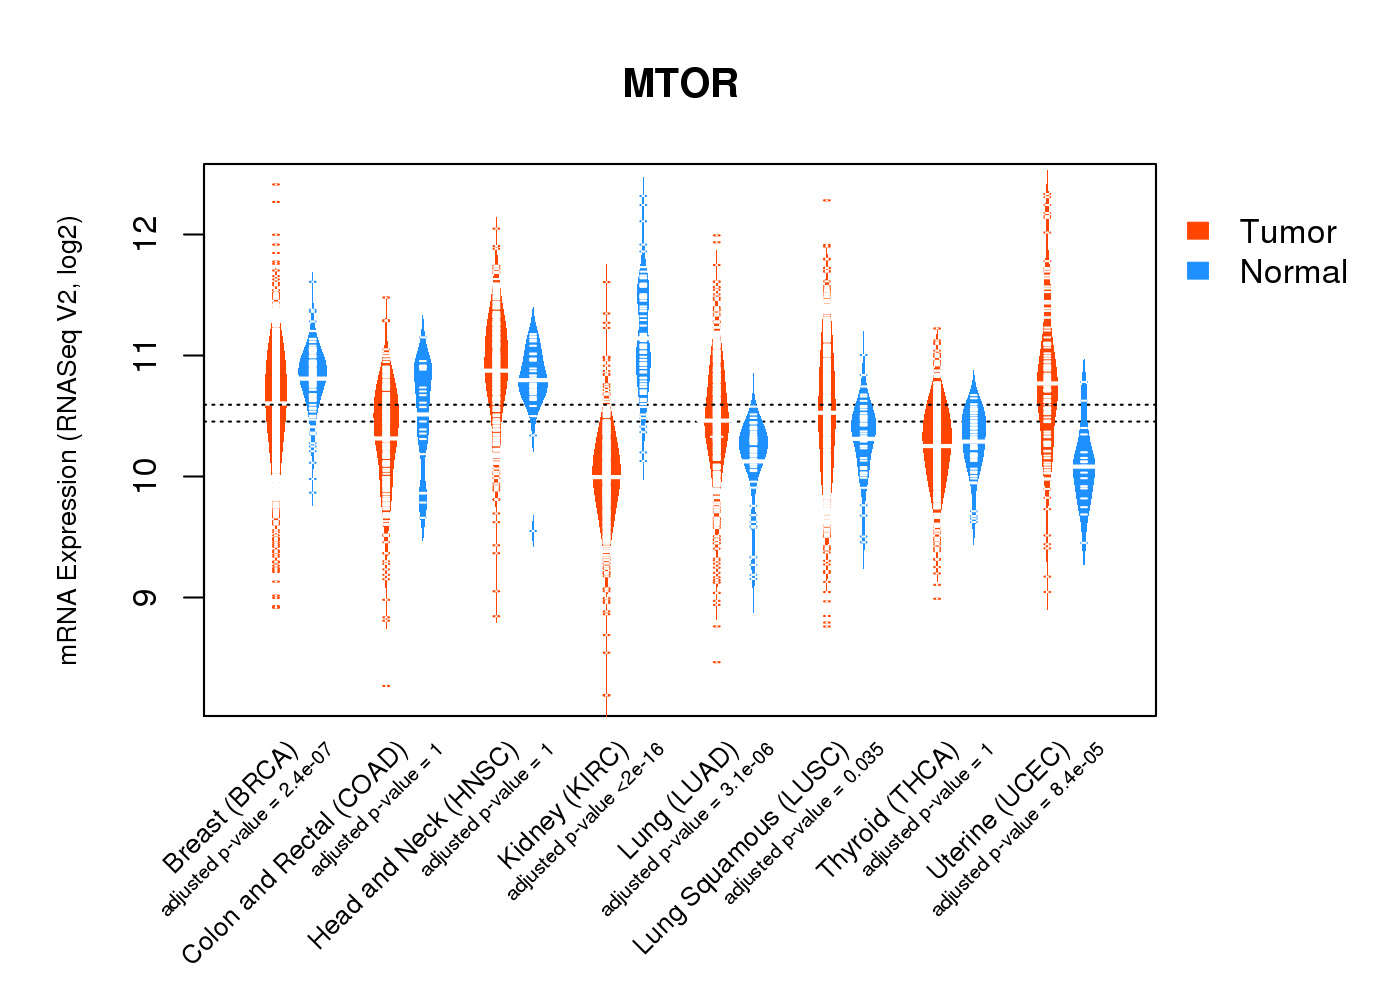
| * Normalized gene expression data of RNASeqV2 was extracted from TCGA using R package TCGA-Assembler. The URLs of all public data files on TCGA DCC data server were gathered at Jan-05-2015. Only eight cancer types have enough normal control samples for differential expression analysis. (t test, adjusted p<0.05 (using Benjamini-Hochberg FDR)) |
 |
| Top |
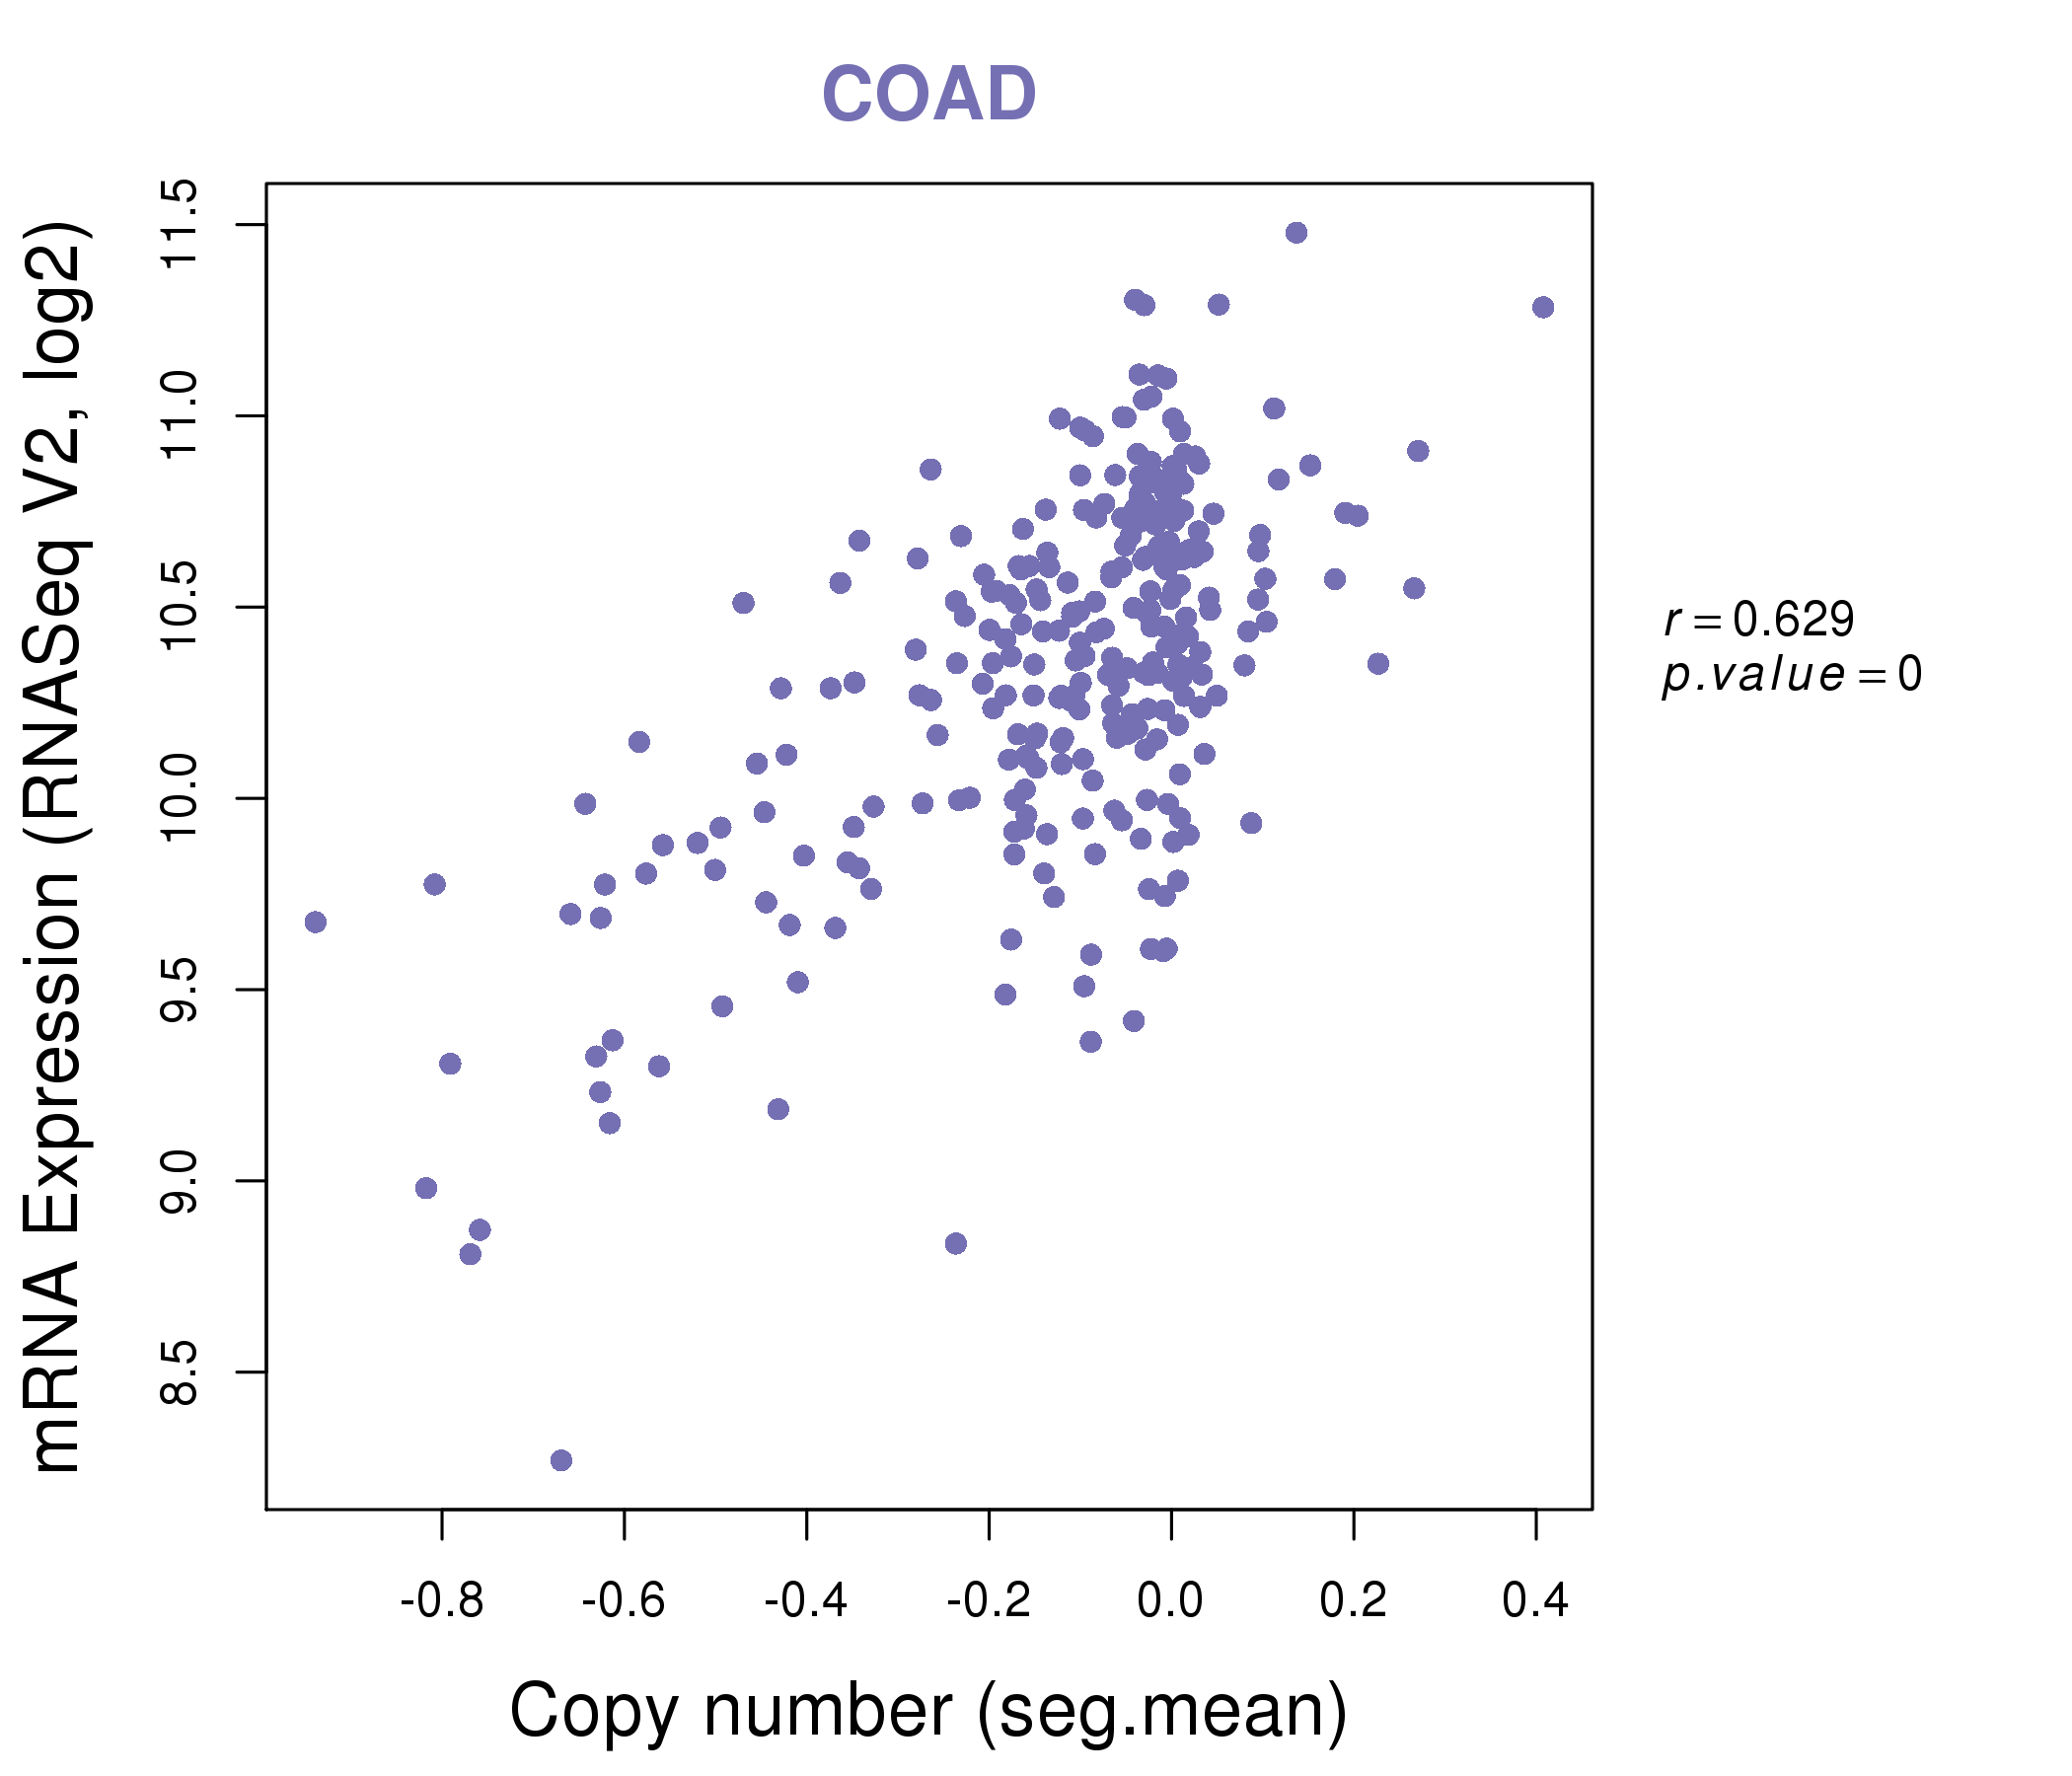
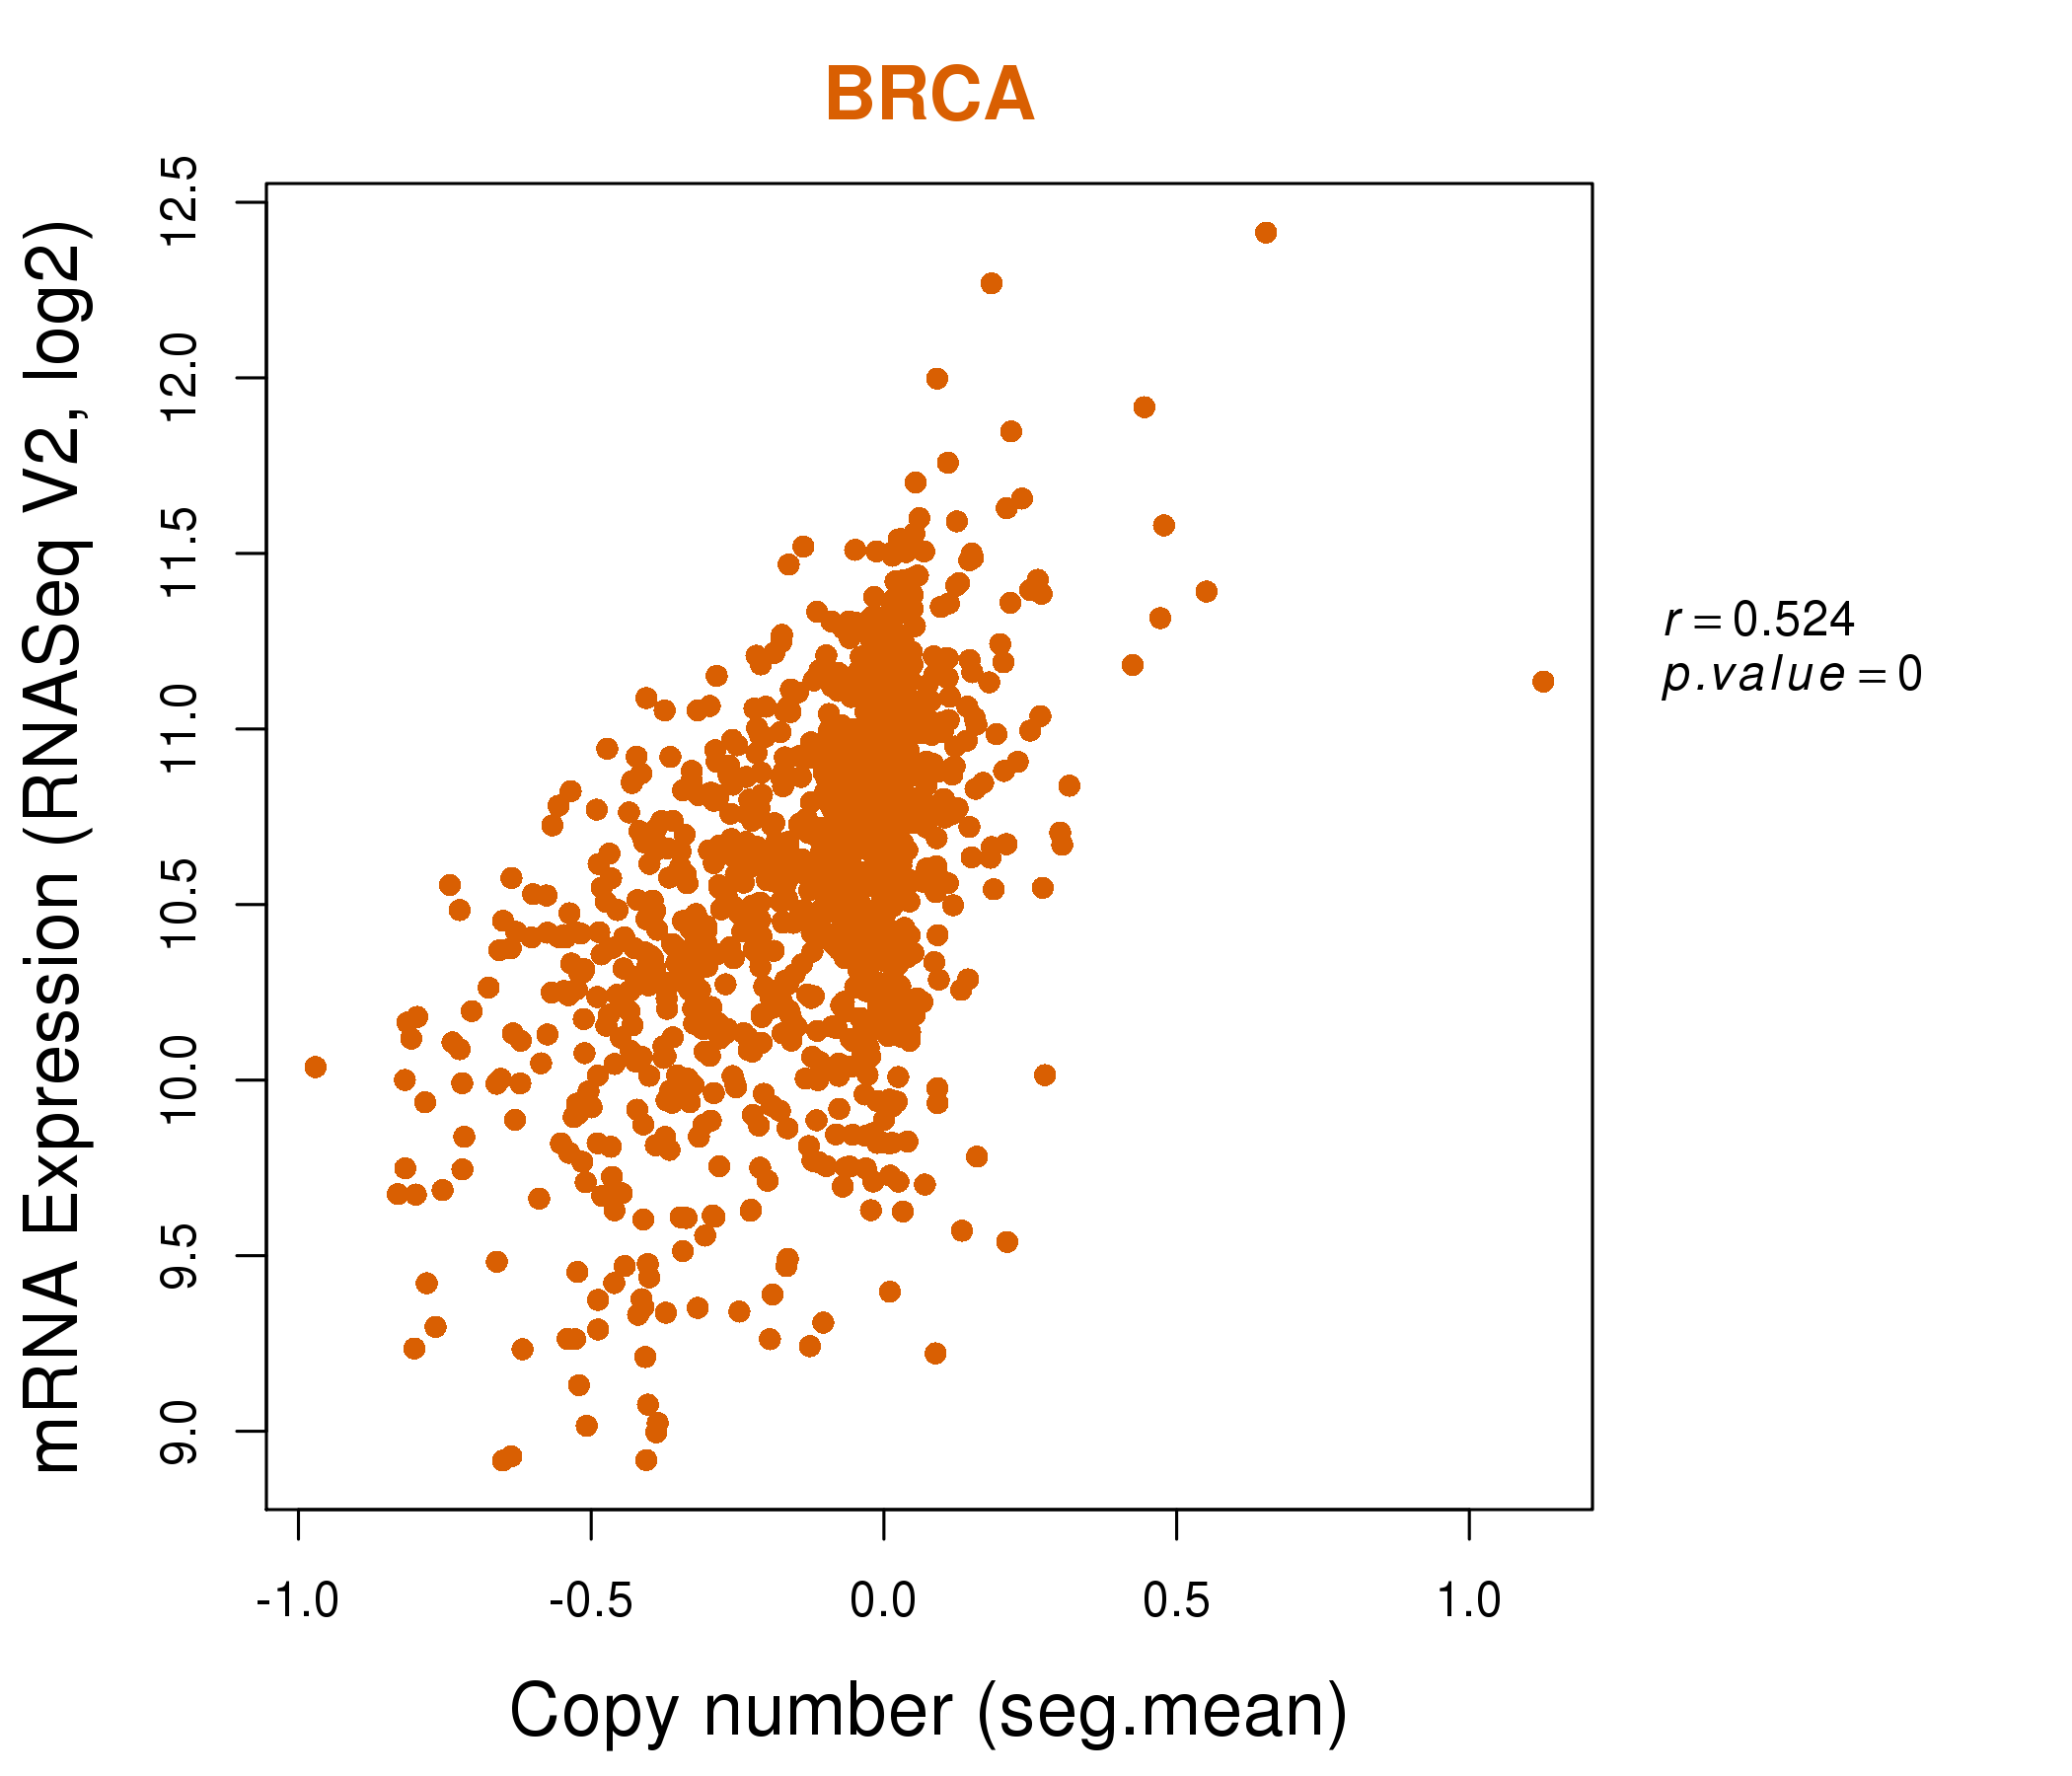
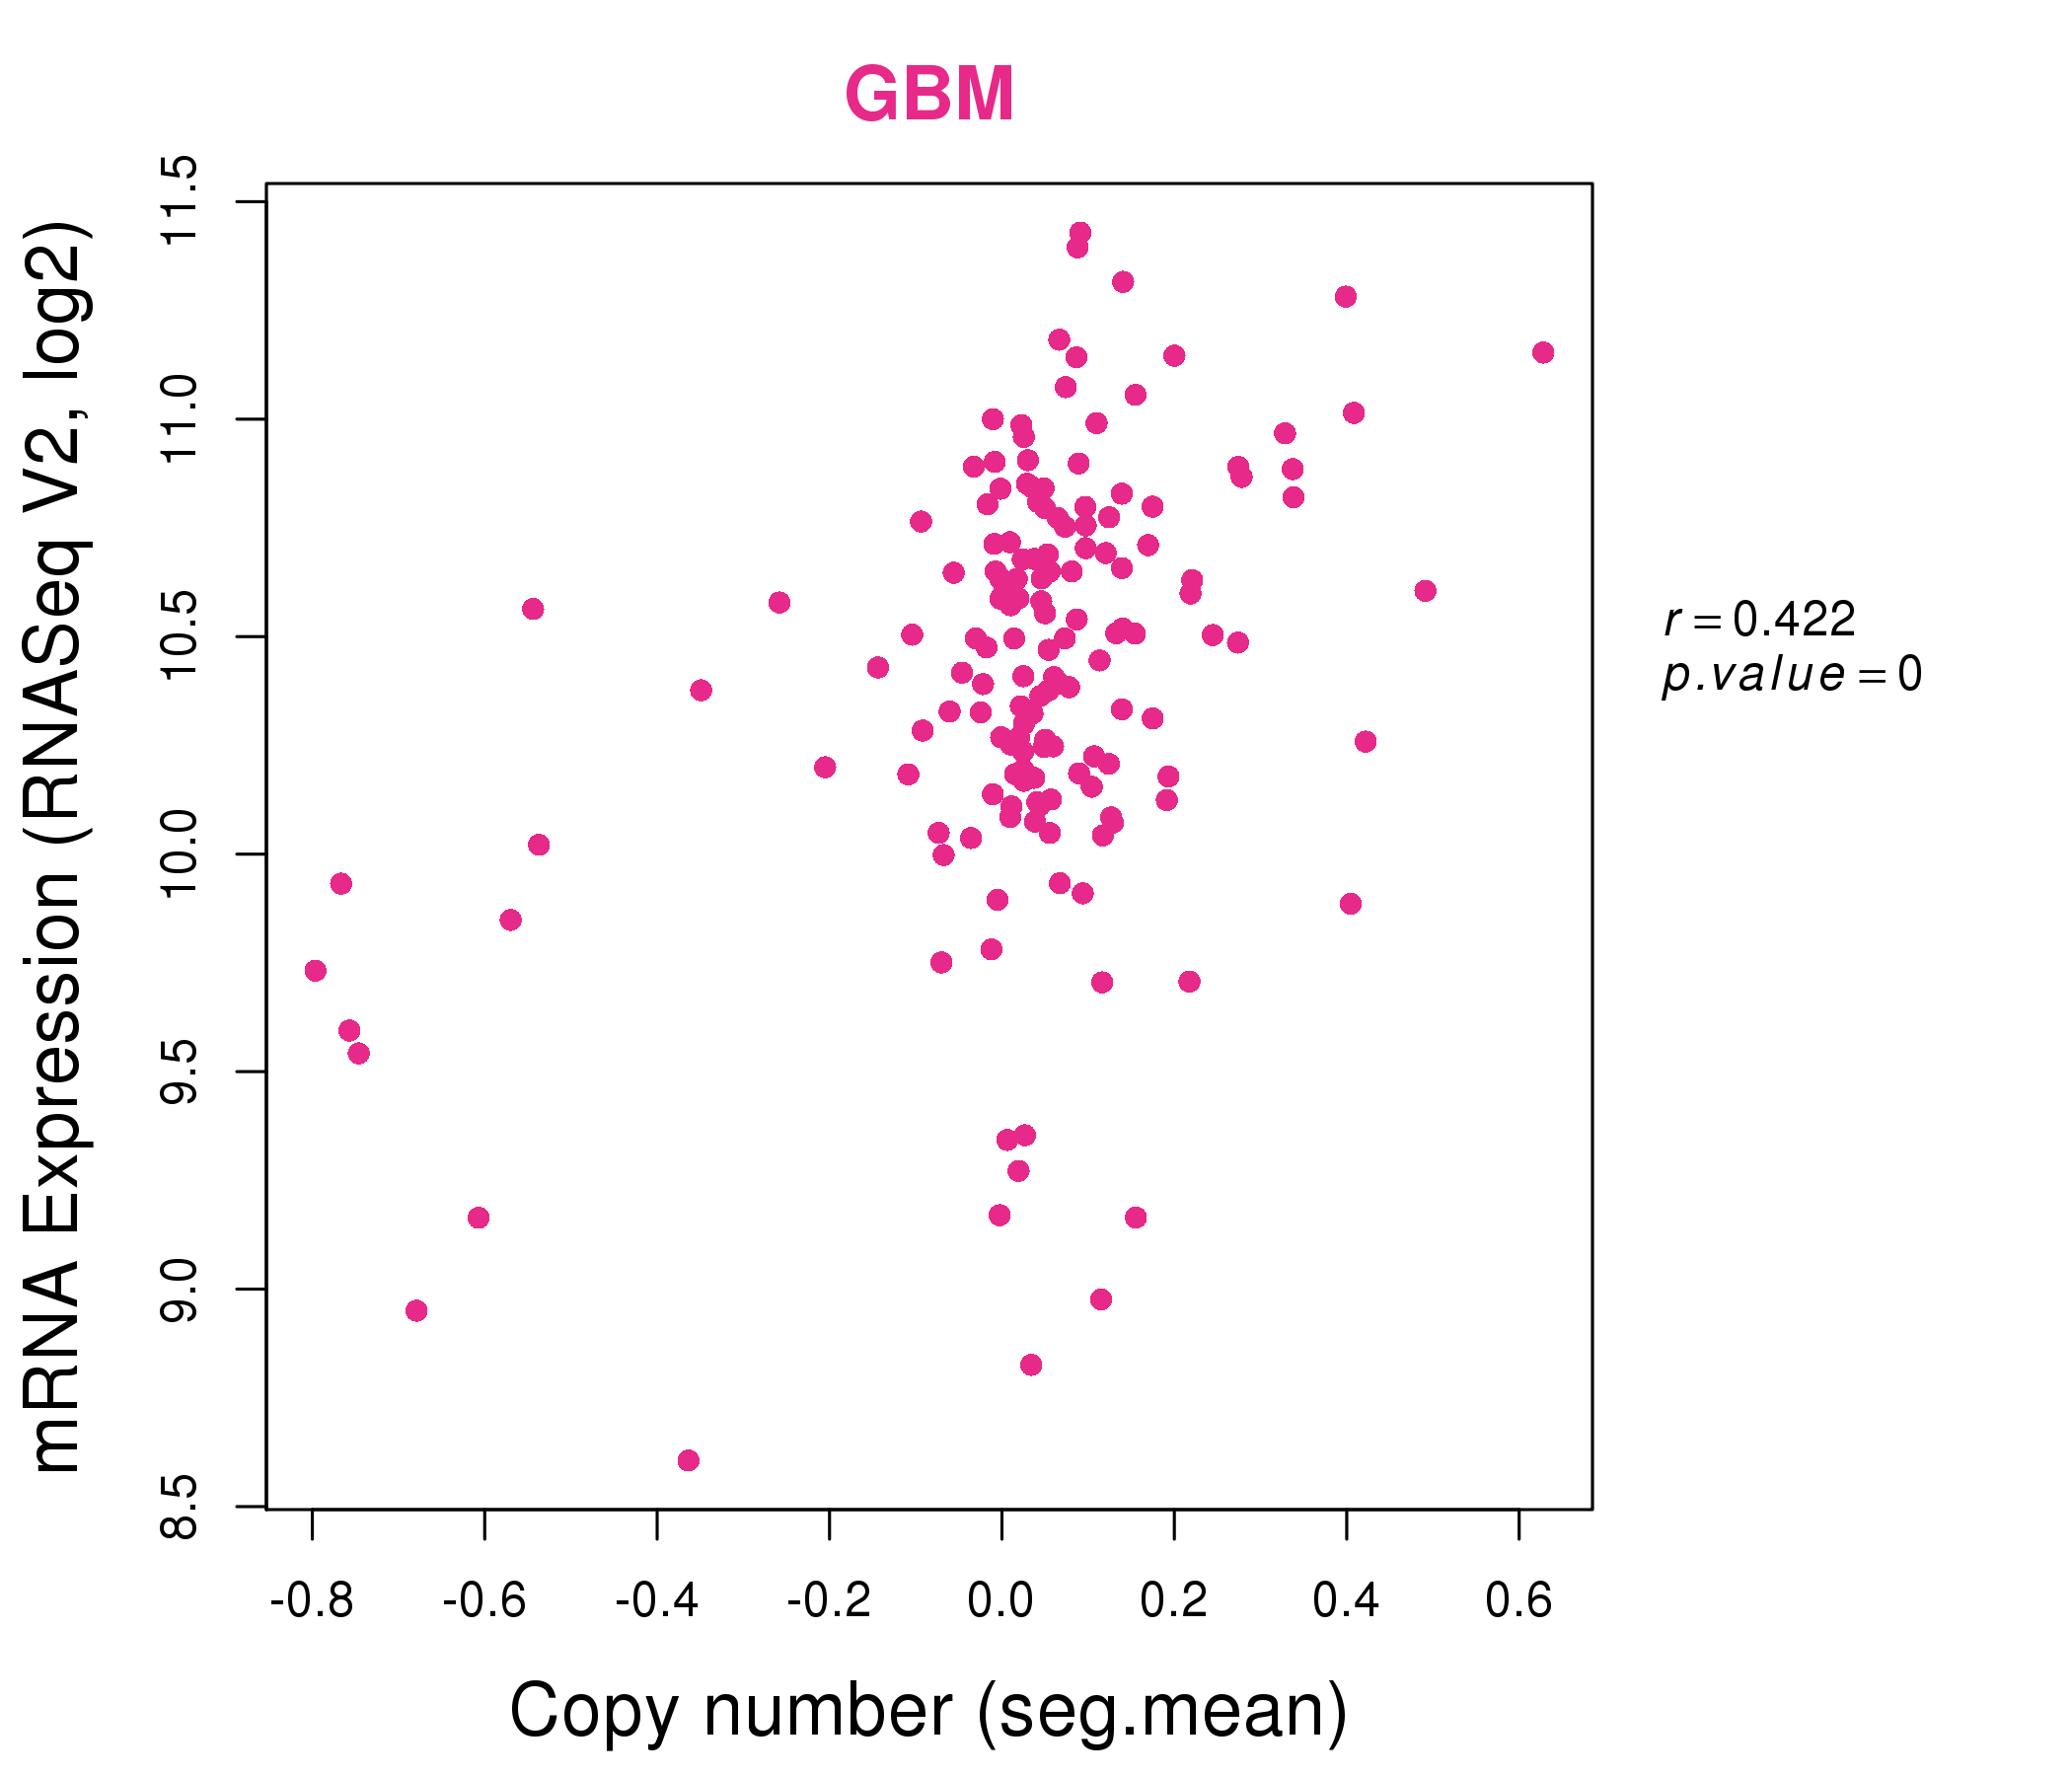
| * This plots show the correlation between CNV and gene expression. |
: Open all plots for all cancer types
 |
|
 |
|
| Top |
| Gene-Gene Network Information |
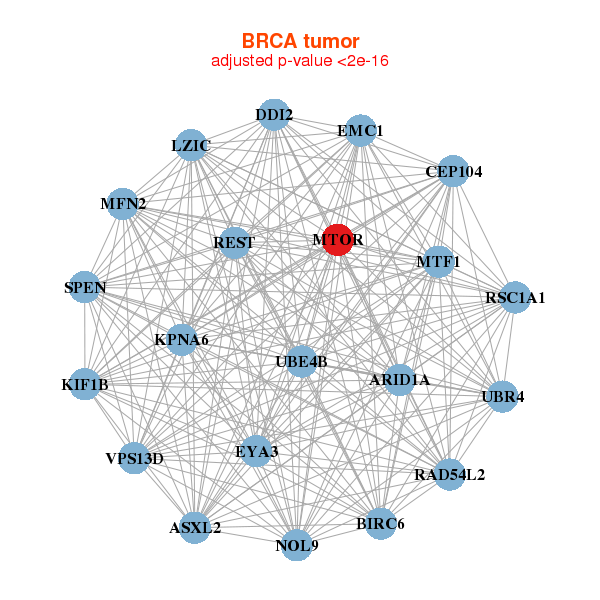
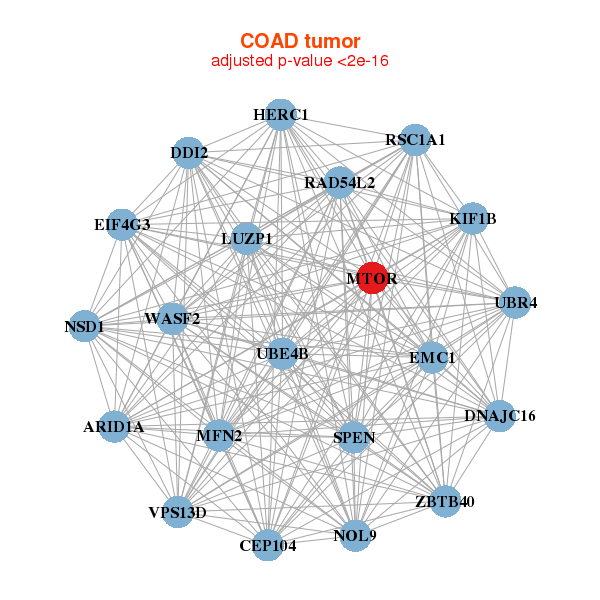
| * Co-Expression network figures were drawn using R package igraph. Only the top 20 genes with the highest correlations were shown. Red circle: input gene, orange circle: cell metabolism gene, sky circle: other gene |
: Open all plots for all cancer types
 |
| ||||
| ARID1A,ASXL2,BIRC6,DDI2,EYA3,EMC1,CEP104, KIF1B,KPNA6,LZIC,MFN2,MTF1,MTOR,NOL9, RAD54L2,REST,RSC1A1,SPEN,UBE4B,UBR4,VPS13D | ANKRD52,ATE1,C10orf12,NOP9,C9orf129,CKAP5,DDI2, GBF1,GCN1L1,GIGYF2,HERC2,HUWE1,IDE,LMTK2, KMT2B___KMT2D,MTOR,NCOR1,PRPF8,RGP1,UBE3B,UBR4 | ||||
 |
| ||||
| ARID1A,DDI2,DNAJC16,EIF4G3,HERC1,EMC1,CEP104, KIF1B,LUZP1,MFN2,MTOR,NOL9,NSD1,RAD54L2, RSC1A1,SPEN,UBE4B,UBR4,VPS13D,WASF2,ZBTB40 | ALMS1,ARID1A,BAZ1B,CHD8,DYNC1H1,EP400,GCN1L1, GIGYF2,HCFC1,HERC2,HUWE1,MTOR,KAT6A,NSD1, PRKDC,PRPF8,SNRNP200,TPR,TRRAP,VPS13D,YLPM1 |
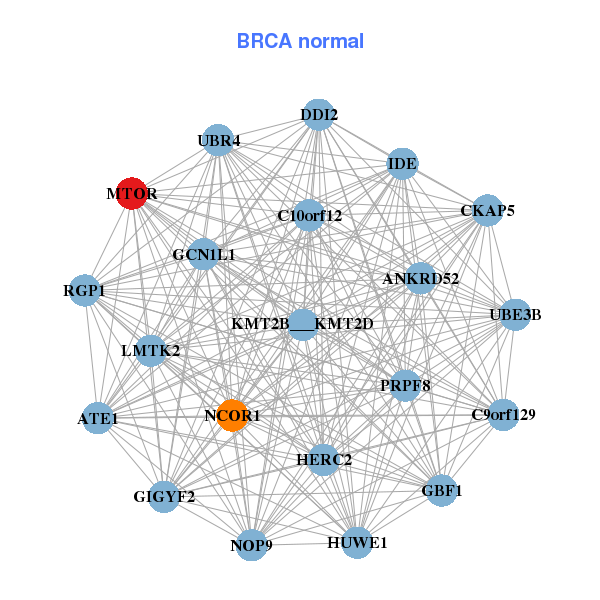
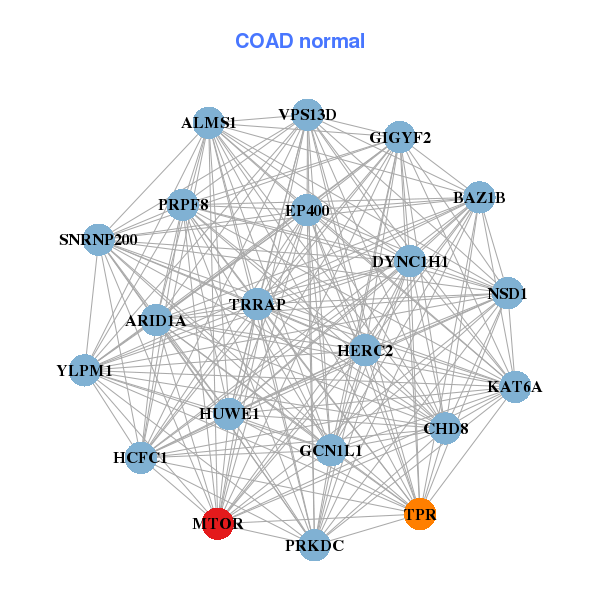
| * Co-Expression network figures were drawn using R package igraph. Only the top 20 genes with the highest correlations were shown. Red circle: input gene, orange circle: cell metabolism gene, sky circle: other gene |
: Open all plots for all cancer types
| Top |
: Open all interacting genes' information including KEGG pathway for all interacting genes from DAVID
| Top |
| Pharmacological Information for MTOR |
| DB Category | DB Name | DB's ID and Url link |
| Chemistry | BindingDB | P42345; -. |
| Chemistry | ChEMBL | CHEMBL2221341; -. |
| Chemistry | GuidetoPHARMACOLOGY | 2109; -. |
| Organism-specific databases | PharmGKB | PA28360; -. |
| Organism-specific databases | CTD | 2475; -. |
| * Gene Centered Interaction Network. |
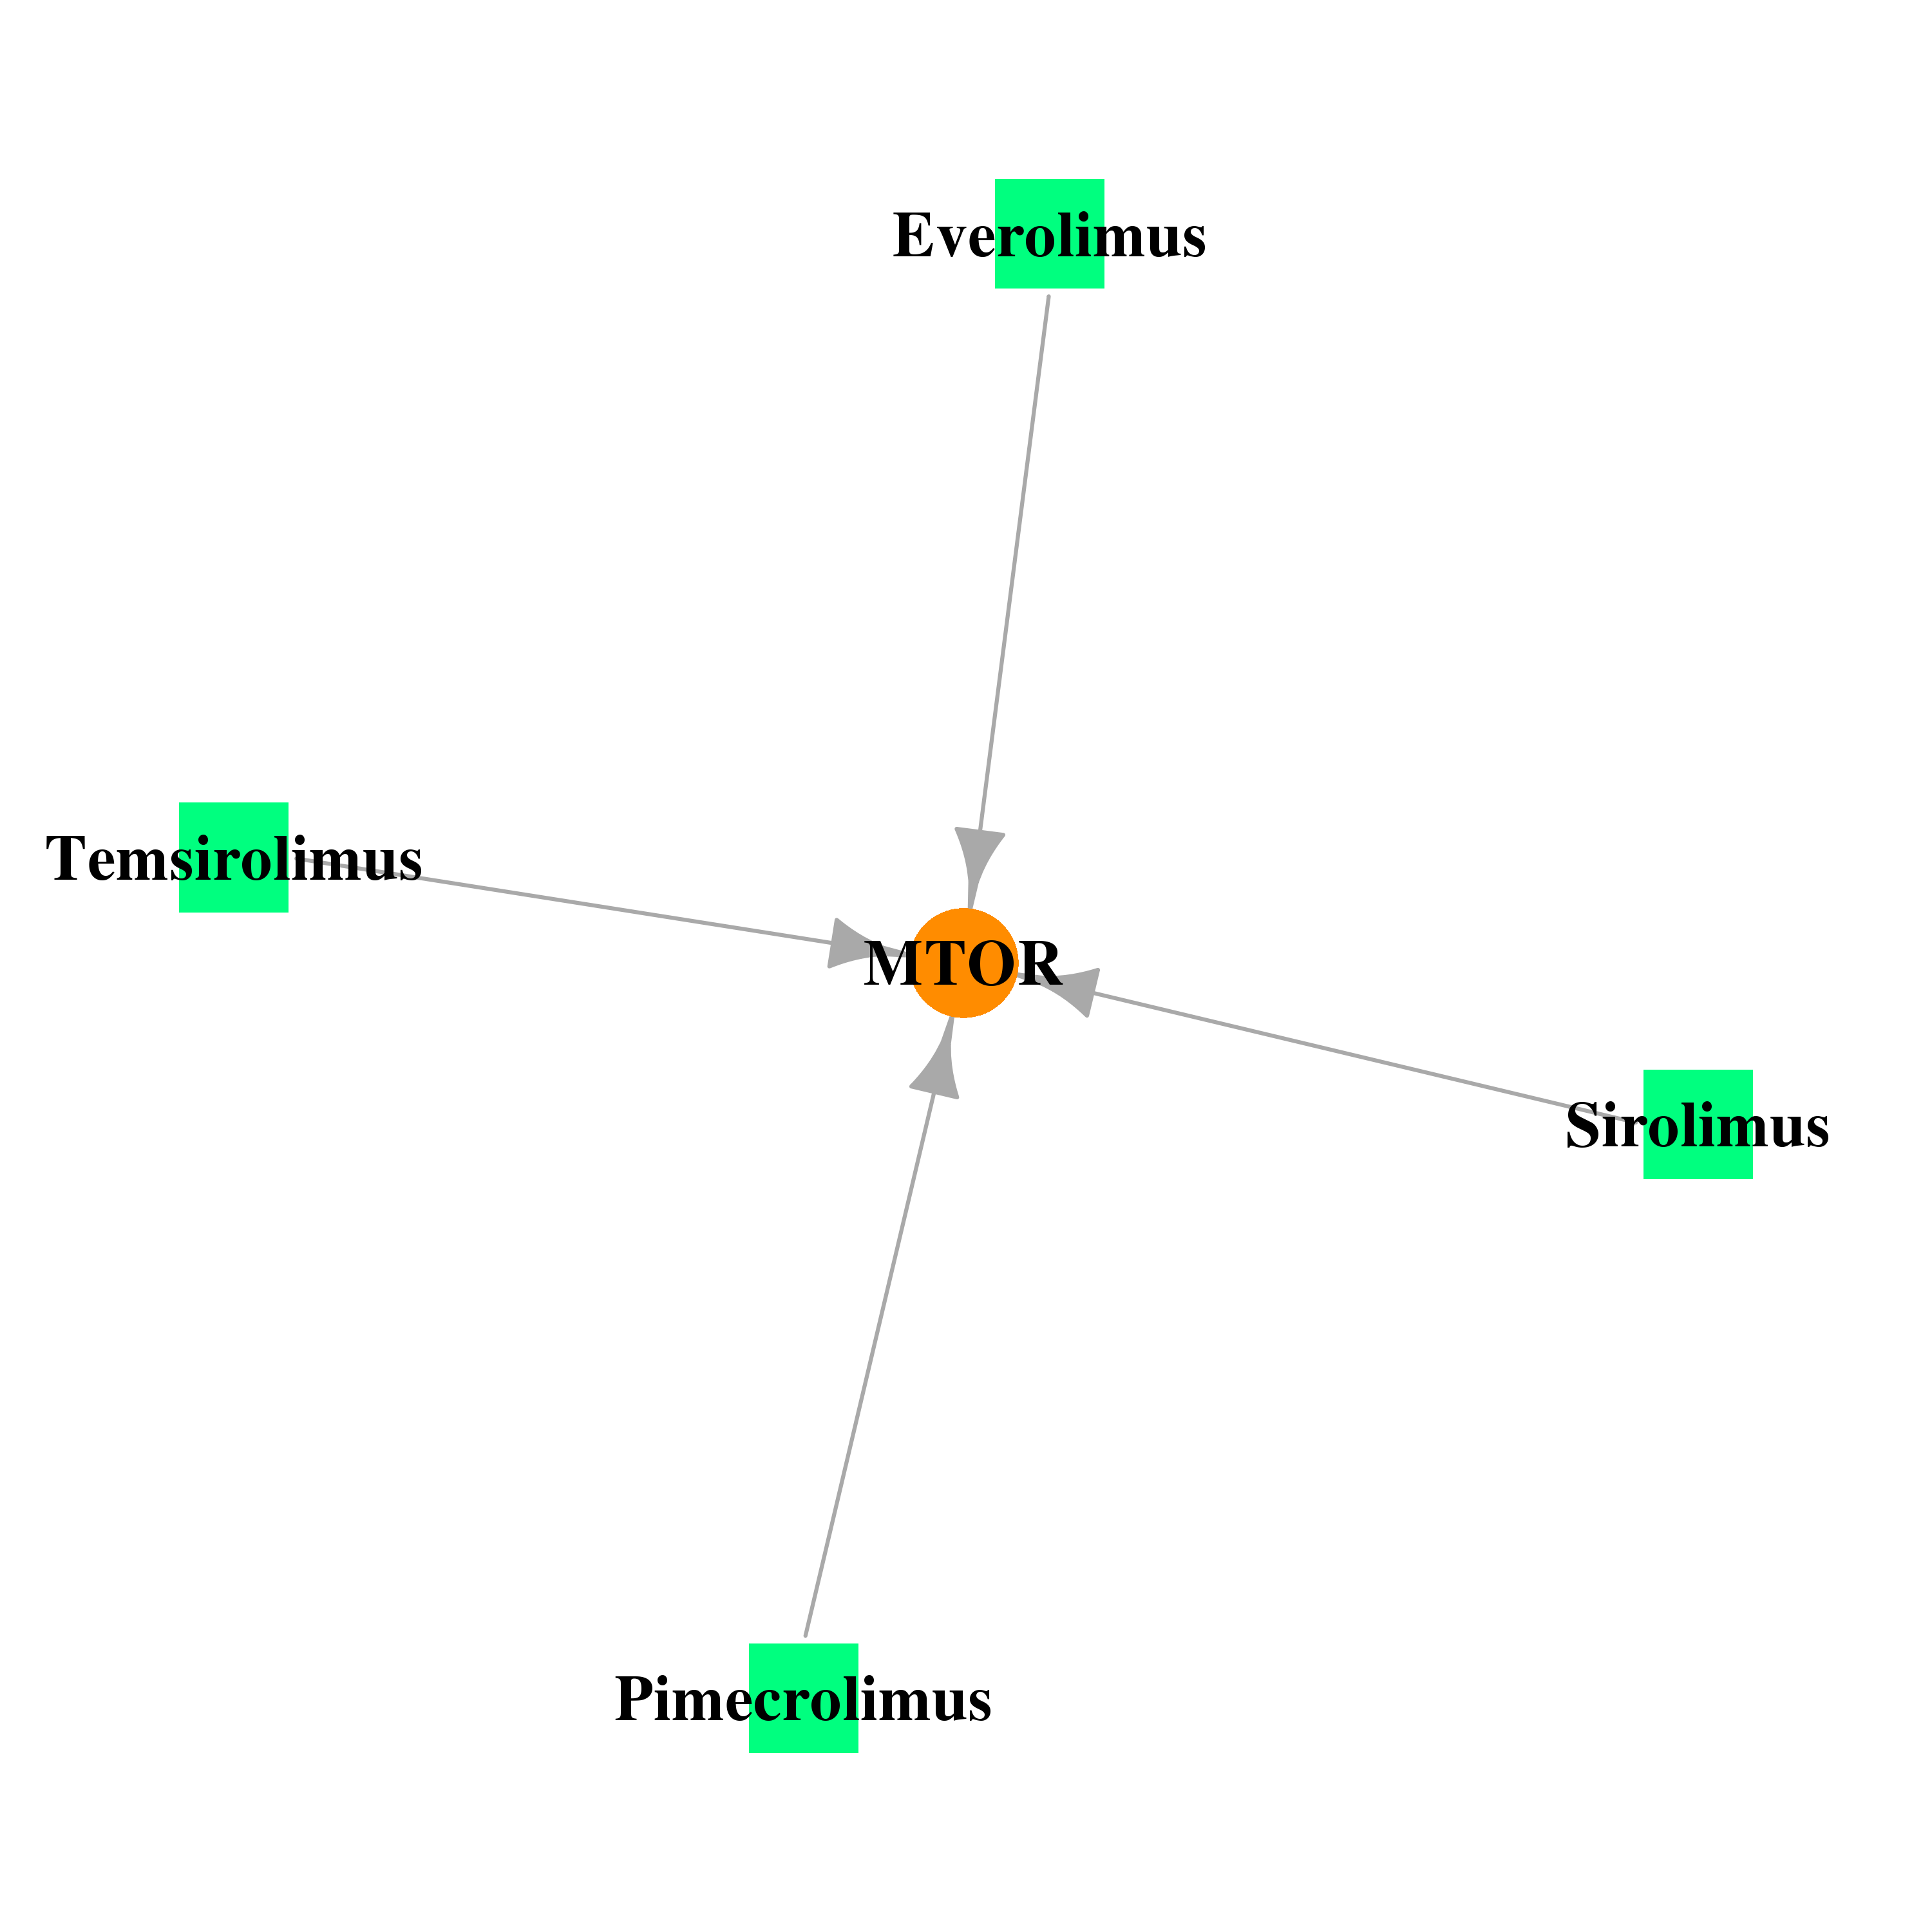 |
| * Drug Centered Interaction Network. |
| DrugBank ID | Target Name | Drug Groups | Generic Name | Drug Centered Network | Drug Structure |
| DB00337 | mechanistic target of rapamycin (serine/threonine kinase) | approved; investigational | Pimecrolimus | 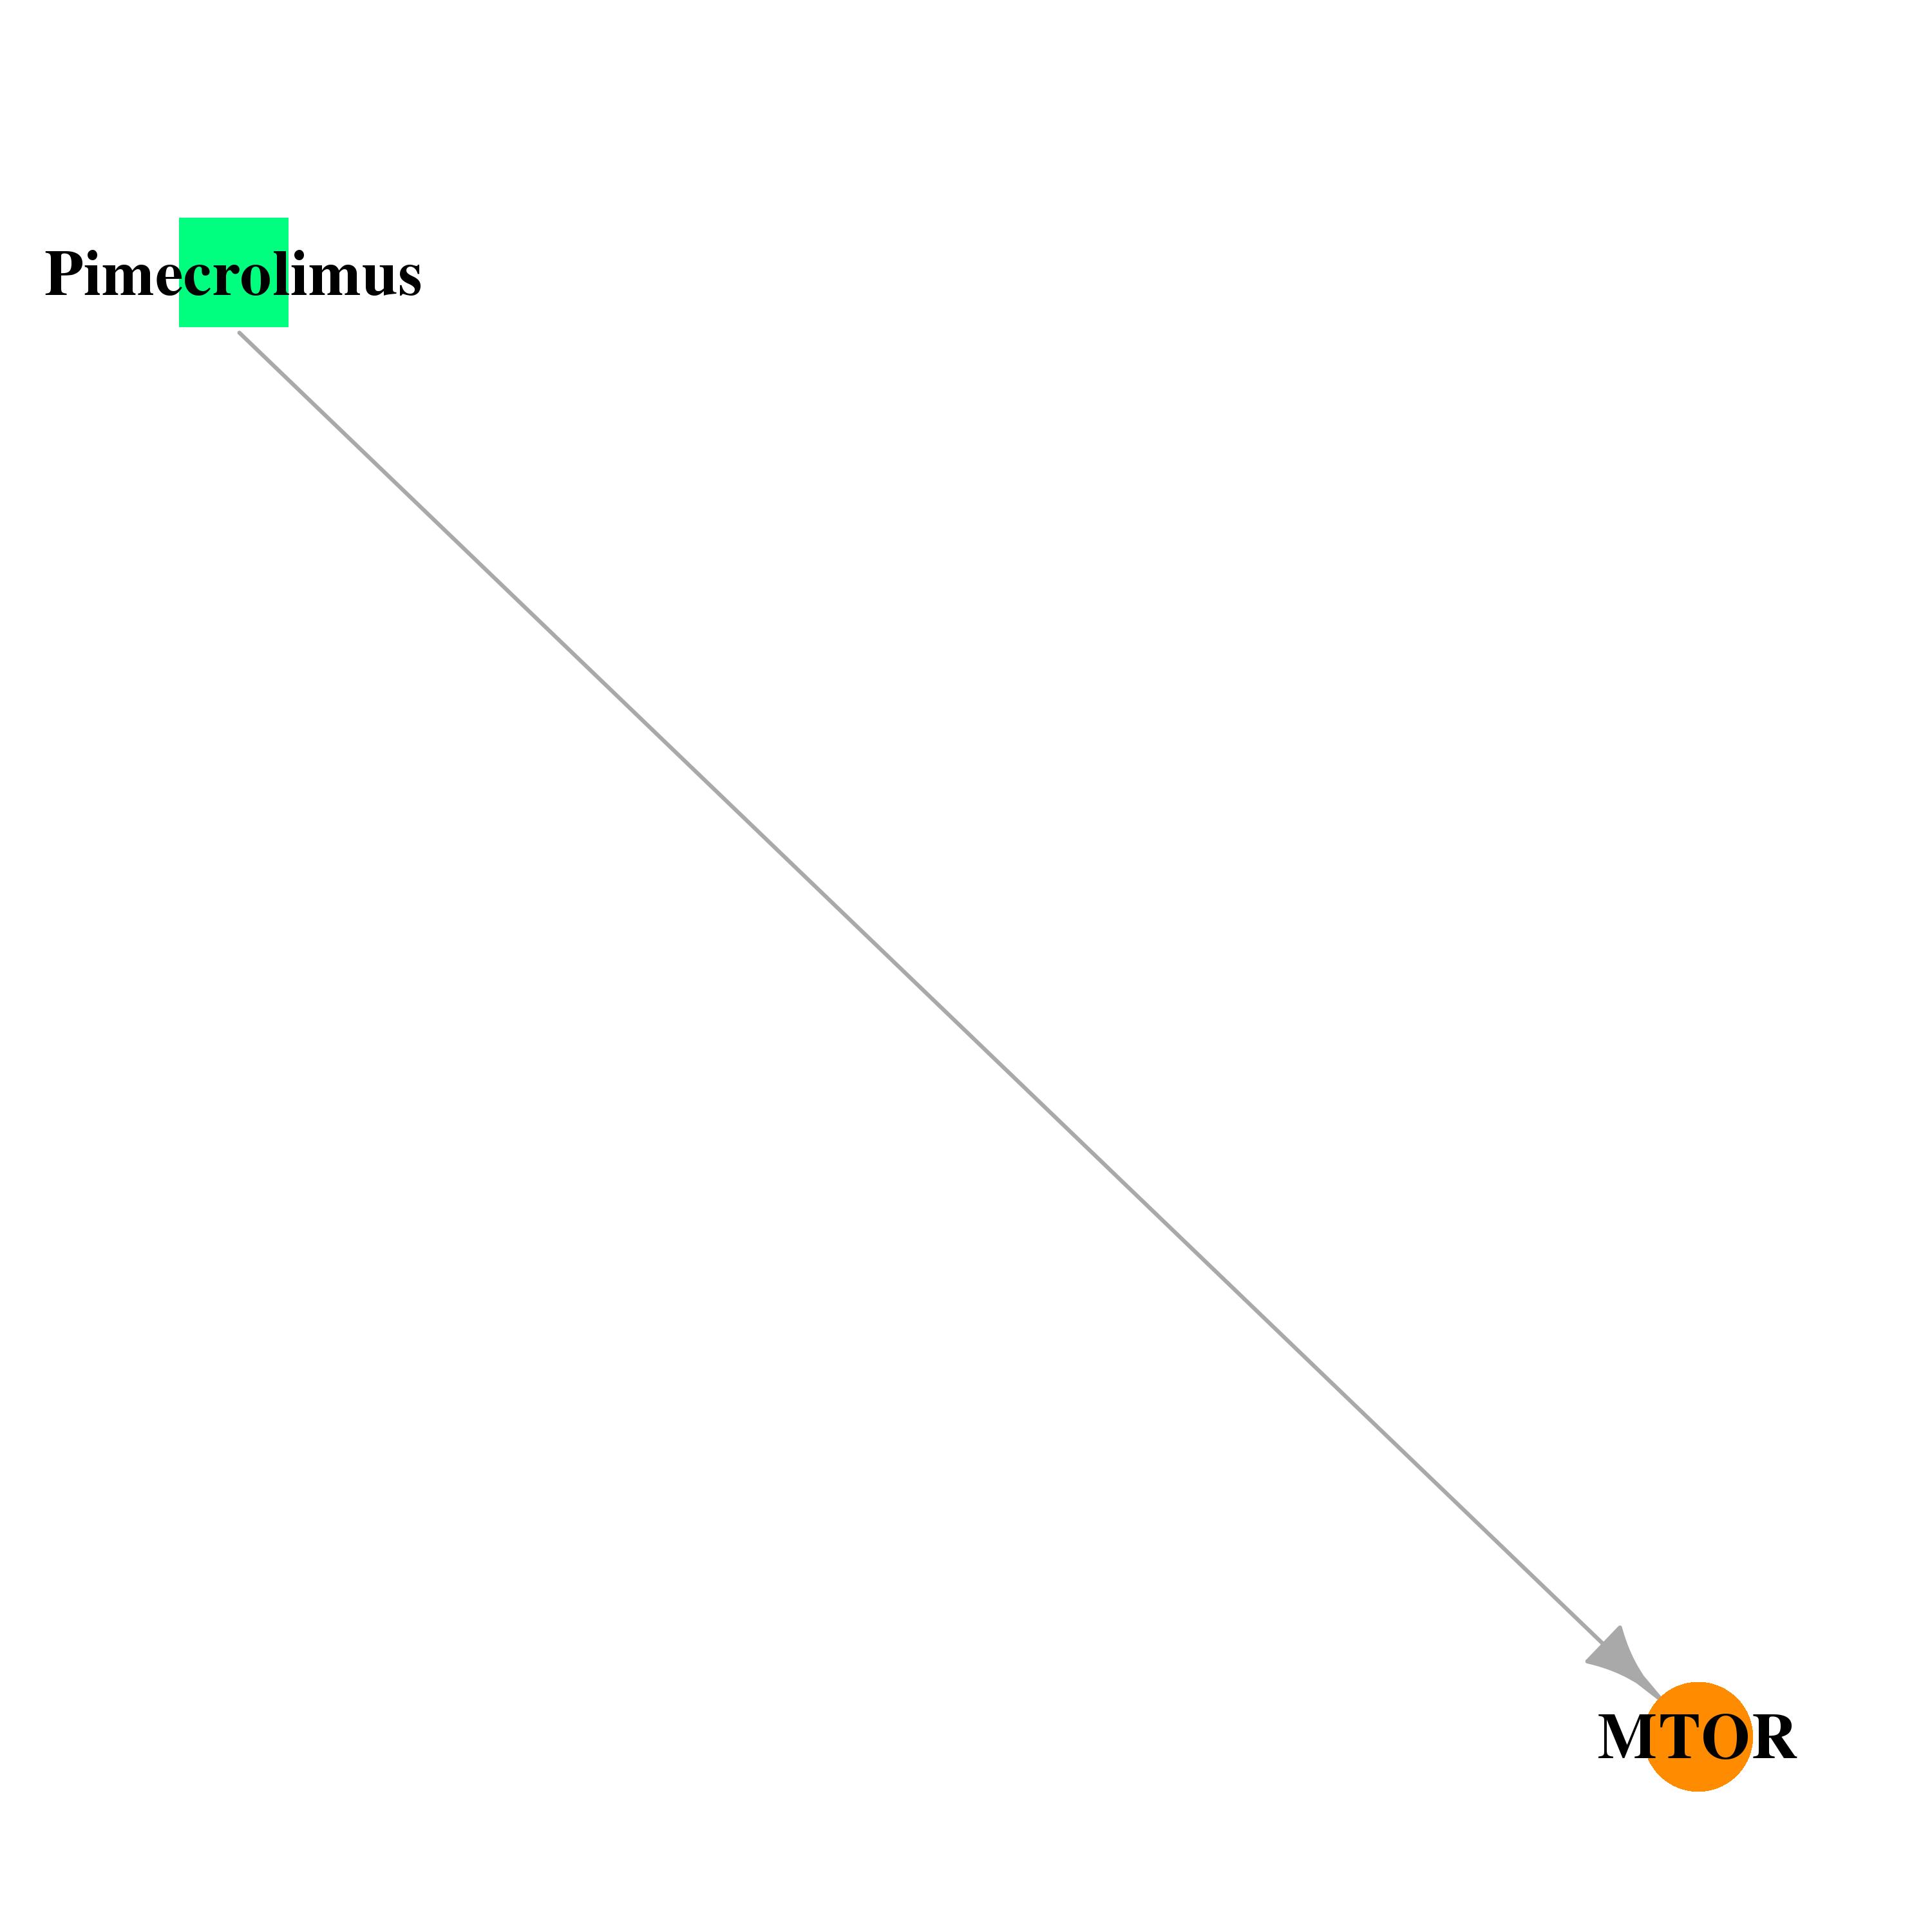 | 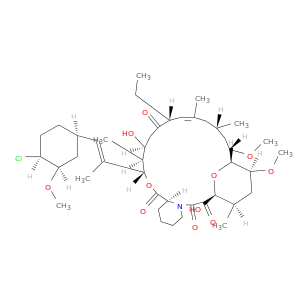 |
| DB00877 | mechanistic target of rapamycin (serine/threonine kinase) | approved; investigational | Sirolimus | 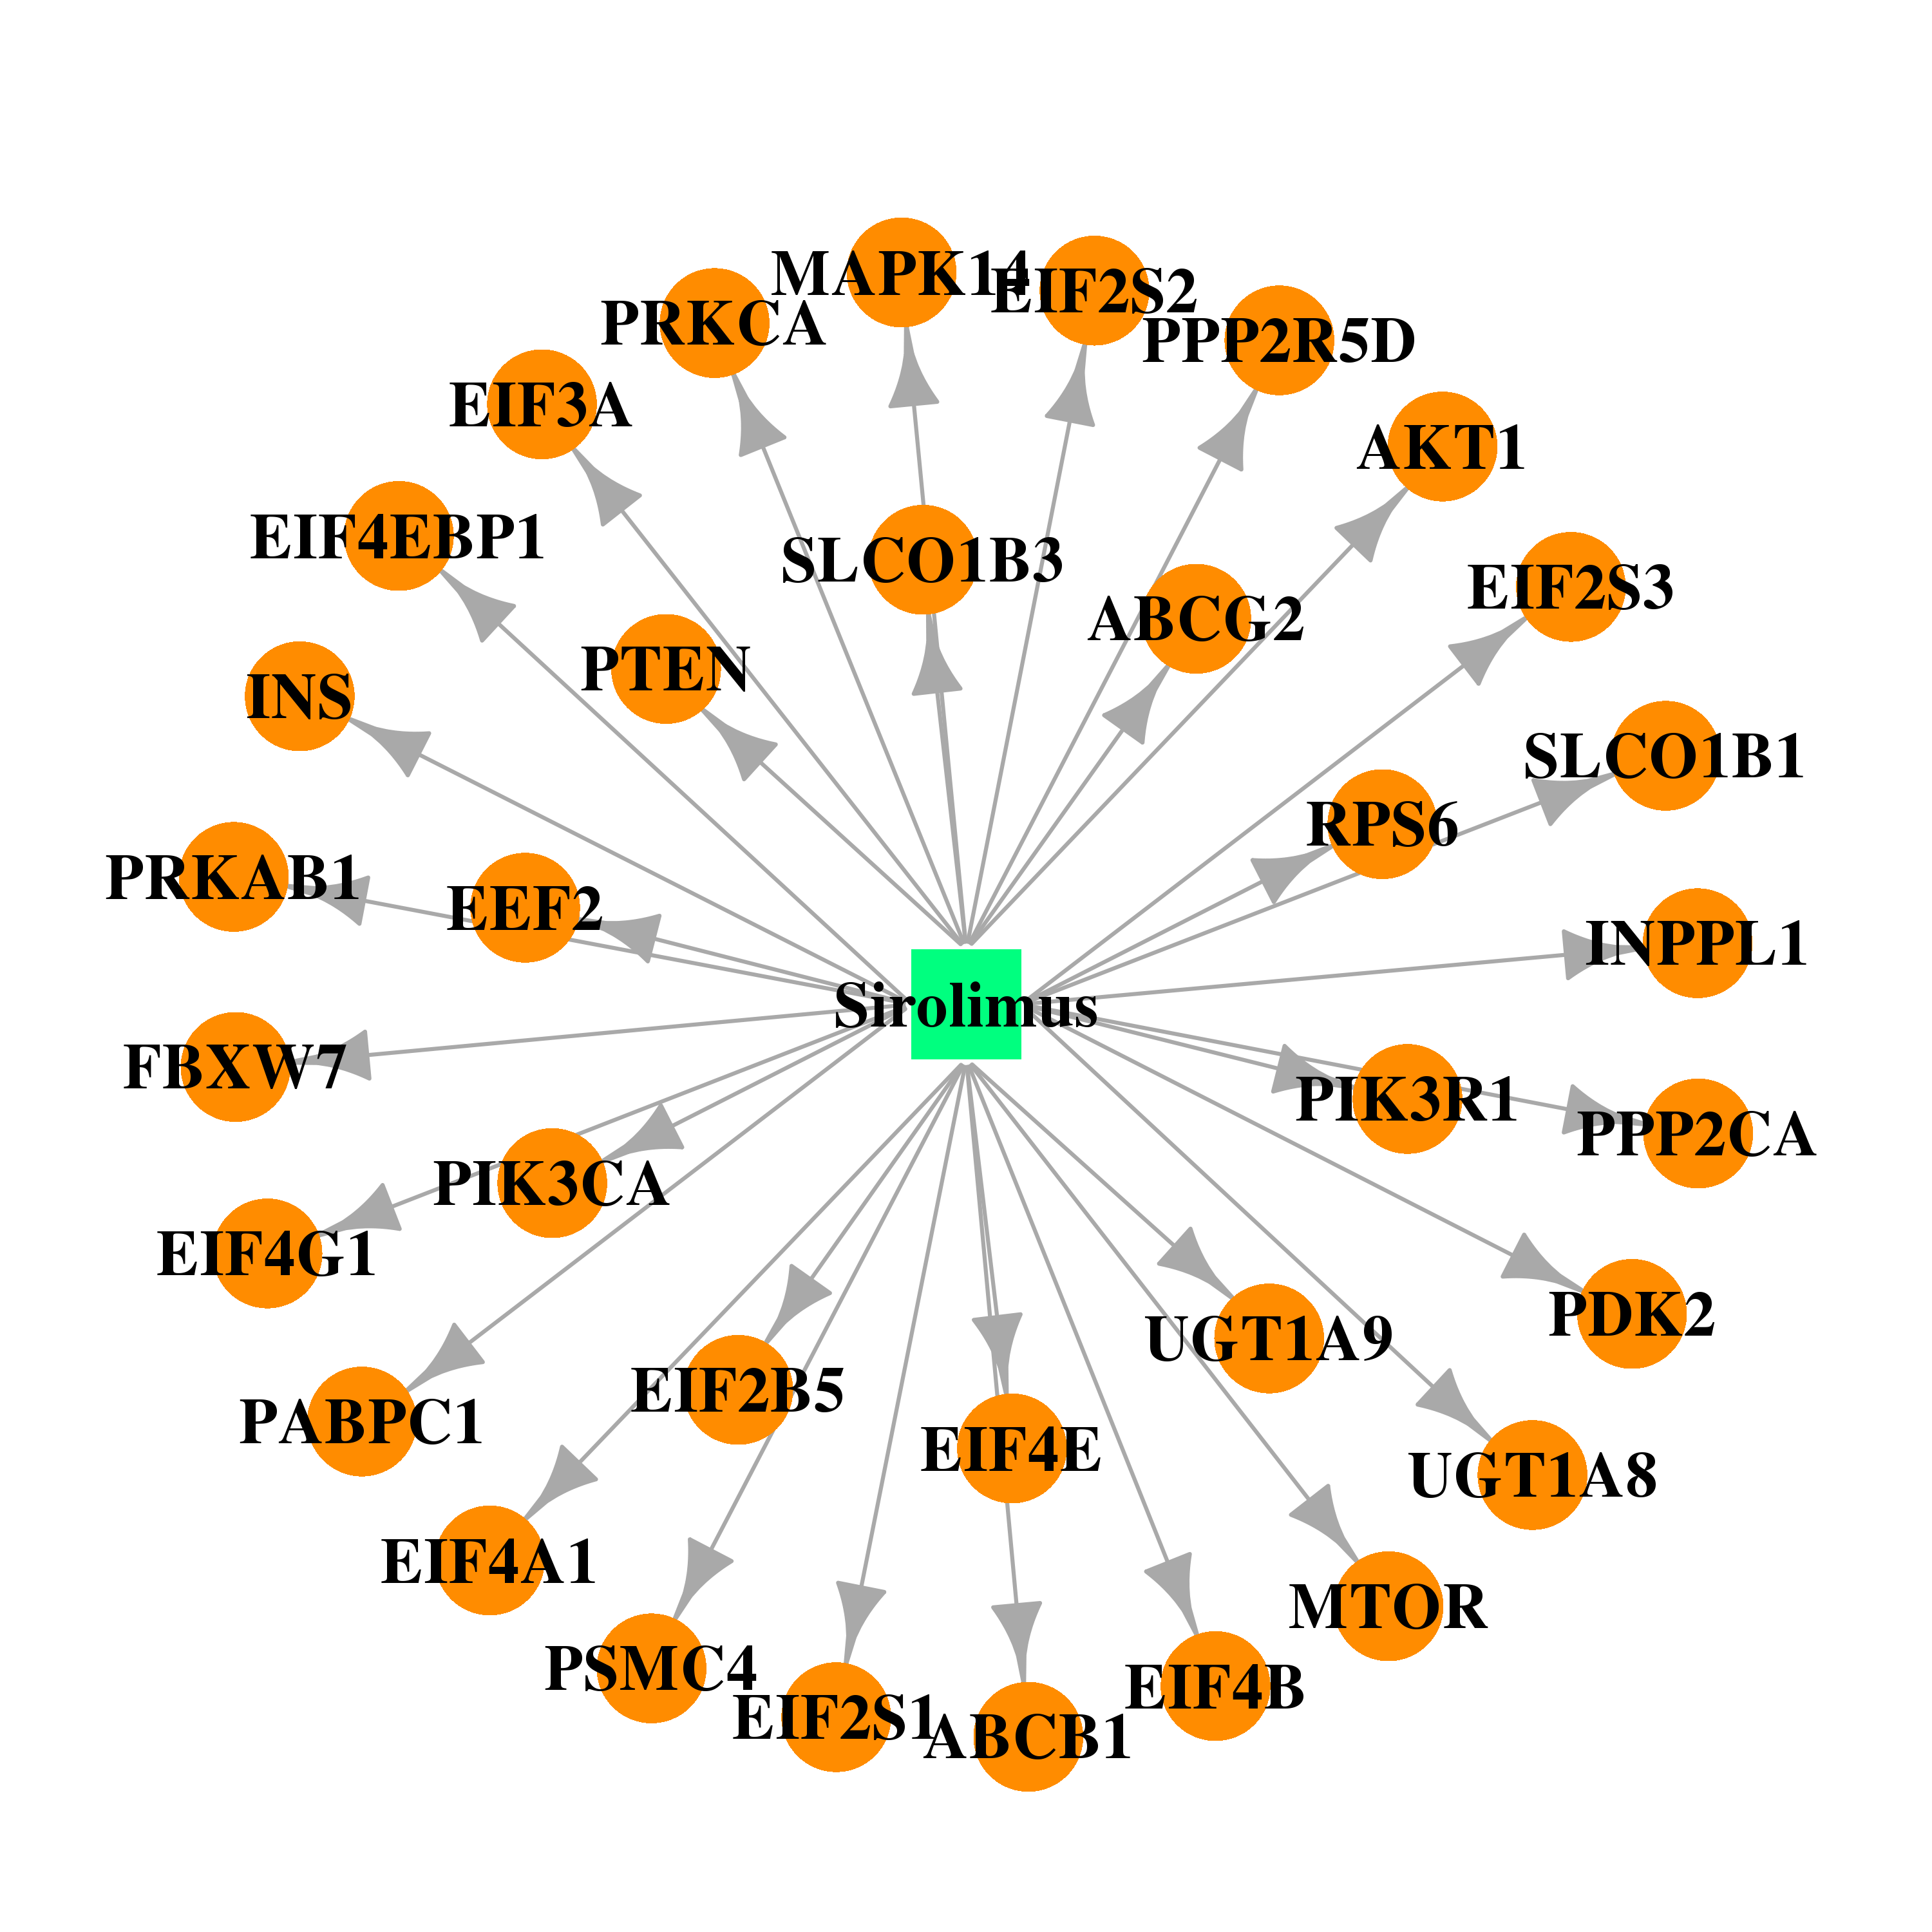 |  |
| DB01590 | mechanistic target of rapamycin (serine/threonine kinase) | approved; investigational | Everolimus |  |  |
| DB06287 | mechanistic target of rapamycin (serine/threonine kinase) | approved; investigational | Temsirolimus |  |  |
| Top |
| Cross referenced IDs for MTOR |
| * We obtained these cross-references from Uniprot database. It covers 150 different DBs, 18 categories. http://www.uniprot.org/help/cross_references_section |
: Open all cross reference information
|
Copyright © 2016-Present - The Univsersity of Texas Health Science Center at Houston @ |