|
||||||||||||||||||||||||||||||||||||||||||||||||||||||||||||||||||||||||||||||||||||||||||||||||||||||||||||||||||||||||||||||||||||||||||||||||||||||||||||||||||||||||||||||||||||||||||||||||||||||||||||||||||||||||||||||||||||||||||||||||||||||||||||||||||||||||||||||||||||||||||||||||||||||||||||||||||||||||||
| |
| Phenotypic Information (metabolism pathway, cancer, disease, phenome) |
| |
| |
| Gene-Gene Network Information: Co-Expression Network, Interacting Genes & KEGG |
| |
|


| Gene Summary for SIN3A |
| Basic gene info. | Gene symbol | SIN3A |
| Gene name | SIN3 transcription regulator family member A | |
| Synonyms | - | |
| Cytomap | UCSC genome browser: 15q24.2 | |
| Genomic location | chr15 :75661719-75743926 | |
| Type of gene | protein-coding | |
| RefGenes | NM_001145357.1, NM_001145358.1,NM_015477.2, | |
| Ensembl id | ENSG00000169375 | |
| Description | SIN3 homolog A, transcription regulatorSIN3 transcription regulator homolog Ahistone deacetylase complex subunit Sin3apaired amphipathic helix protein Sin3atranscriptional co-repressor Sin3Atranscriptional corepressor Sin3atranscriptional regulator, | |
| Modification date | 20141207 | |
| dbXrefs | MIM : 607776 | |
| HGNC : HGNC | ||
| Ensembl : ENSG00000169375 | ||
| HPRD : 09690 | ||
| Vega : OTTHUMG00000142834 | ||
| Protein | UniProt: Q96ST3 go to UniProt's Cross Reference DB Table | |
| Expression | CleanEX: HS_SIN3A | |
| BioGPS: 25942 | ||
| Gene Expression Atlas: ENSG00000169375 | ||
| The Human Protein Atlas: ENSG00000169375 | ||
| Pathway | NCI Pathway Interaction Database: SIN3A | |
| KEGG: SIN3A | ||
| REACTOME: SIN3A | ||
| ConsensusPathDB | ||
| Pathway Commons: SIN3A | ||
| Metabolism | MetaCyc: SIN3A | |
| HUMANCyc: SIN3A | ||
| Regulation | Ensembl's Regulation: ENSG00000169375 | |
| miRBase: chr15 :75,661,719-75,743,926 | ||
| TargetScan: NM_001145357 | ||
| cisRED: ENSG00000169375 | ||
| Context | iHOP: SIN3A | |
| cancer metabolism search in PubMed: SIN3A | ||
| UCL Cancer Institute: SIN3A | ||
| Assigned class in ccmGDB | B - This gene belongs to cancer gene. | |
| Top |
| Phenotypic Information for SIN3A(metabolism pathway, cancer, disease, phenome) |
| Cancer | CGAP: SIN3A |
| Familial Cancer Database: SIN3A | |
| * This gene is included in those cancer gene databases. |
|
|
|
|
|
| . | ||||||||||||||||||||||||||||||||||||||||||||||||||||||||||||||||||||||||||||||||||||||||||||||||||||||||||||||||||||||||||||||||||||||||||||||||||||||||||||||||||||||||||||||||||||||||||||||||||||||||||||||||||||||||||||||||||||||||||||||||||||||||||||||||||||||||||||||||||||||||||||||||||||||||||||||||||||
Oncogene 1 | Significant driver gene in UCEC 6, | |||||||||||||||||||||||||||||||||||||||||||||||||||||||||||||||||||||||||||||||||||||||||||||||||||||||||||||||||||||||||||||||||||||||||||||||||||||||||||||||||||||||||||||||||||||||||||||||||||||||||||||||||||||||||||||||||||||||||||||||||||||||||||||||||||||||||||||||||||||||||||||||||||||||||||||||||||||||||
| cf) number; DB name 1 Oncogene; http://nar.oxfordjournals.org/content/35/suppl_1/D721.long, 2 Tumor Suppressor gene; https://bioinfo.uth.edu/TSGene/, 3 Cancer Gene Census; http://www.nature.com/nrc/journal/v4/n3/abs/nrc1299.html, 4 CancerGenes; http://nar.oxfordjournals.org/content/35/suppl_1/D721.long, 5 Network of Cancer Gene; http://ncg.kcl.ac.uk/index.php, 6 http://www.nature.com/nature/journal/v497/n7447/full/nature12113.html, 7Therapeutic Vulnerabilities in Cancer; http://cbio.mskcc.org/cancergenomics/statius/ |
| REACTOME_METABOLISM_OF_LIPIDS_AND_LIPOPROTEINS | |
| OMIM | 607776; gene. |
| Orphanet | |
| Disease | KEGG Disease: SIN3A |
| MedGen: SIN3A (Human Medical Genetics with Condition) | |
| ClinVar: SIN3A | |
| Phenotype | MGI: SIN3A (International Mouse Phenotyping Consortium) |
| PhenomicDB: SIN3A | |
| Mutations for SIN3A |
| * Under tables are showing count per each tissue to give us broad intuition about tissue specific mutation patterns.You can go to the detailed page for each mutation database's web site. |
| There's no structural variation information in COSMIC data for this gene. |
| * From mRNA Sanger sequences, Chitars2.0 arranged chimeric transcripts. This table shows SIN3A related fusion information. |
| ID | Head Gene | Tail Gene | Accession | Gene_a | qStart_a | qEnd_a | Chromosome_a | tStart_a | tEnd_a | Gene_a | qStart_a | qEnd_a | Chromosome_a | tStart_a | tEnd_a |
| BI054950 | SIN3A | 17 | 153 | 15 | 75705159 | 75705295 | SGCZ | 139 | 159 | 8 | 14912171 | 14912191 | |
| AW851387 | SIN3A | 1 | 466 | 15 | 75676615 | 75684714 | SIN3A | 463 | 640 | 15 | 75687125 | 75688696 | |
| AW866901 | FIS1 | 24 | 270 | 7 | 100885885 | 100887158 | SIN3A | 267 | 391 | 15 | 75722655 | 75743795 | |
| BQ346619 | SIN3A | 8 | 104 | 15 | 75684829 | 75684925 | ZNF577 | 97 | 165 | 19 | 52376648 | 52376715 | |
| AW006026 | SIN3A | 1 | 94 | 15 | 75663475 | 75663568 | DHODH | 87 | 623 | 16 | 72048450 | 72057095 | |
| BF366946 | SIN3A | 38 | 146 | 15 | 75684816 | 75684925 | ZNF577 | 139 | 206 | 19 | 52376648 | 52376715 | |
| BF764786 | AFAP1 | 1 | 260 | 4 | 7791526 | 7791786 | SIN3A | 258 | 347 | 15 | 75668057 | 75668146 | |
| Top |
| Mutation type/ Tissue ID | brca | cns | cerv | endome | haematopo | kidn | Lintest | liver | lung | ns | ovary | pancre | prost | skin | stoma | thyro | urina | |||
| Total # sample | 1 | |||||||||||||||||||
| GAIN (# sample) | 1 | |||||||||||||||||||
| LOSS (# sample) |
| cf) Tissue ID; Tissue type (1; Breast, 2; Central_nervous_system, 3; Cervix, 4; Endometrium, 5; Haematopoietic_and_lymphoid_tissue, 6; Kidney, 7; Large_intestine, 8; Liver, 9; Lung, 10; NS, 11; Ovary, 12; Pancreas, 13; Prostate, 14; Skin, 15; Stomach, 16; Thyroid, 17; Urinary_tract) |
| Top |
|
 |
| Top |
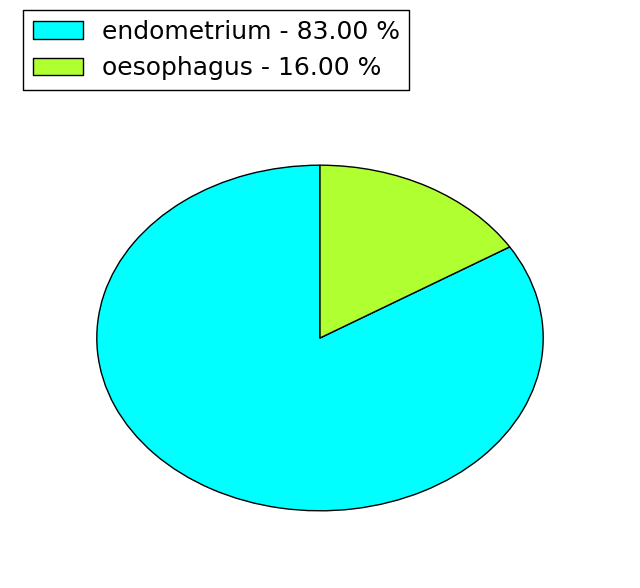
| Stat. for Non-Synonymous SNVs (# total SNVs=130) | (# total SNVs=33) |
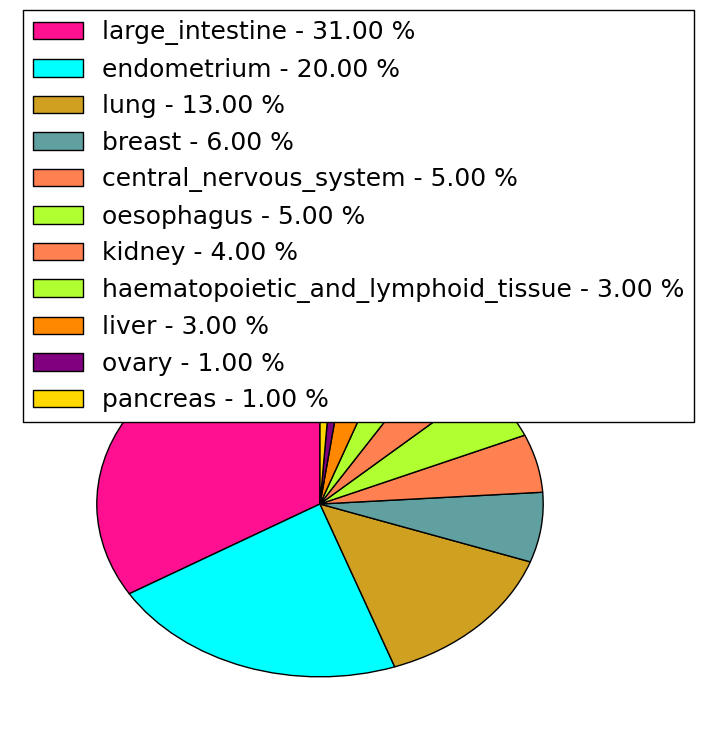 | 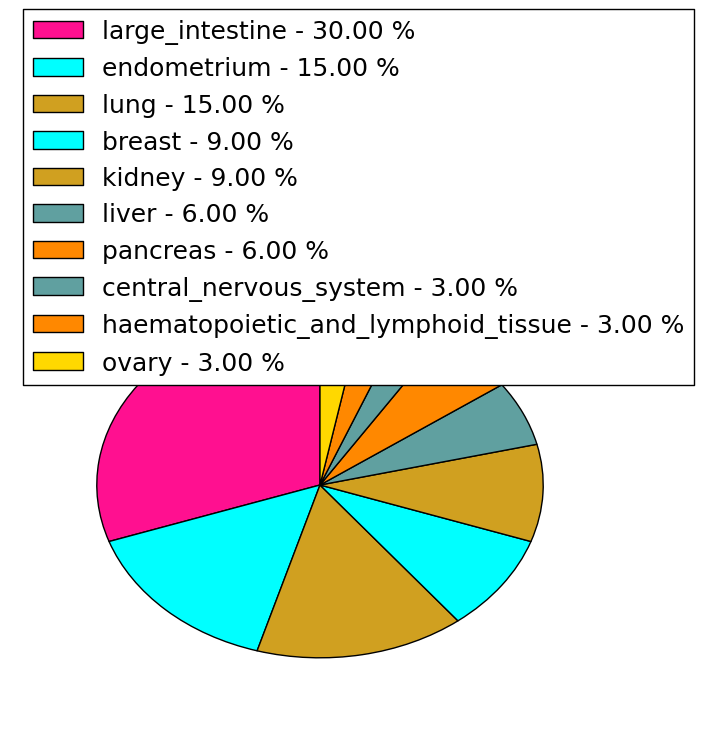 |
(# total SNVs=6) | (# total SNVs=1) |
 |  |
| Top |
| * When you move the cursor on each content, you can see more deailed mutation information on the Tooltip. Those are primary_site,primary_histology,mutation(aa),pubmedID. |
| GRCh37 position | Mutation(aa) | Unique sampleID count |
| chr15:75706642-75706642 | p.A126V | 4 |
| chr15:75673043-75673043 | p.R1104* | 4 |
| chr15:75694278-75694278 | p.E481K | 3 |
| chr15:75684631-75684631 | p.R935* | 3 |
| chr15:75706595-75706595 | p.Q142* | 2 |
| chr15:75722562-75722562 | p.T52M | 2 |
| chr15:75692470-75692470 | p.P589S | 2 |
| chr15:75702228-75702228 | p.Q422Q | 2 |
| chr15:75687179-75687179 | p.R707* | 2 |
| chr15:75693184-75693184 | p.I542L | 2 |
| Top |
|
 |
| Point Mutation/ Tissue ID | 1 | 2 | 3 | 4 | 5 | 6 | 7 | 8 | 9 | 10 | 11 | 12 | 13 | 14 | 15 | 16 | 17 | 18 | 19 | 20 |
| # sample | 3 | 3 | 2 | 20 | 3 | 5 | 2 | 2 | 4 | 3 | 3 | 14 | 12 | 19 | ||||||
| # mutation | 3 | 3 | 2 | 30 | 3 | 5 | 2 | 2 | 5 | 3 | 3 | 15 | 13 | 25 | ||||||
| nonsynonymous SNV | 3 | 3 | 2 | 23 | 3 | 2 | 1 | 4 | 3 | 2 | 11 | 11 | 20 | |||||||
| synonymous SNV | 7 | 3 | 1 | 2 | 1 | 1 | 4 | 2 | 5 |
| cf) Tissue ID; Tissue type (1; BLCA[Bladder Urothelial Carcinoma], 2; BRCA[Breast invasive carcinoma], 3; CESC[Cervical squamous cell carcinoma and endocervical adenocarcinoma], 4; COAD[Colon adenocarcinoma], 5; GBM[Glioblastoma multiforme], 6; Glioma Low Grade, 7; HNSC[Head and Neck squamous cell carcinoma], 8; KICH[Kidney Chromophobe], 9; KIRC[Kidney renal clear cell carcinoma], 10; KIRP[Kidney renal papillary cell carcinoma], 11; LAML[Acute Myeloid Leukemia], 12; LUAD[Lung adenocarcinoma], 13; LUSC[Lung squamous cell carcinoma], 14; OV[Ovarian serous cystadenocarcinoma ], 15; PAAD[Pancreatic adenocarcinoma], 16; PRAD[Prostate adenocarcinoma], 17; SKCM[Skin Cutaneous Melanoma], 18:STAD[Stomach adenocarcinoma], 19:THCA[Thyroid carcinoma], 20:UCEC[Uterine Corpus Endometrial Carcinoma]) |
| Top |
| * We represented just top 10 SNVs. When you move the cursor on each content, you can see more deailed mutation information on the Tooltip. Those are primary_site, primary_histology, mutation(aa), pubmedID. |
| Genomic Position | Mutation(aa) | Unique sampleID count |
| chr15:75684776 | p.R611G,SIN3A | 2 |
| chr15:75702229 | p.Q422R,SIN3A | 2 |
| chr15:75706642 | p.F886F,SIN3A | 2 |
| chr15:75692404 | p.A126V,SIN3A | 2 |
| chr15:75705360 | p.H796Q,SIN3A | 1 |
| chr15:75664419 | p.R611H,SIN3A | 1 |
| chr15:75684744 | p.K457K,SIN3A | 1 |
| chr15:75693144 | p.S289S,SIN3A | 1 |
| chr15:75702220 | p.S1198F,SIN3A | 1 |
| chr15:75722649 | p.T52M,SIN3A | 1 |
| * Copy number data were extracted from TCGA using R package TCGA-Assembler. The URLs of all public data files on TCGA DCC data server were gathered on Jan-05-2015. Function ProcessCNAData in TCGA-Assembler package was used to obtain gene-level copy number value which is calculated as the average copy number of the genomic region of a gene. |
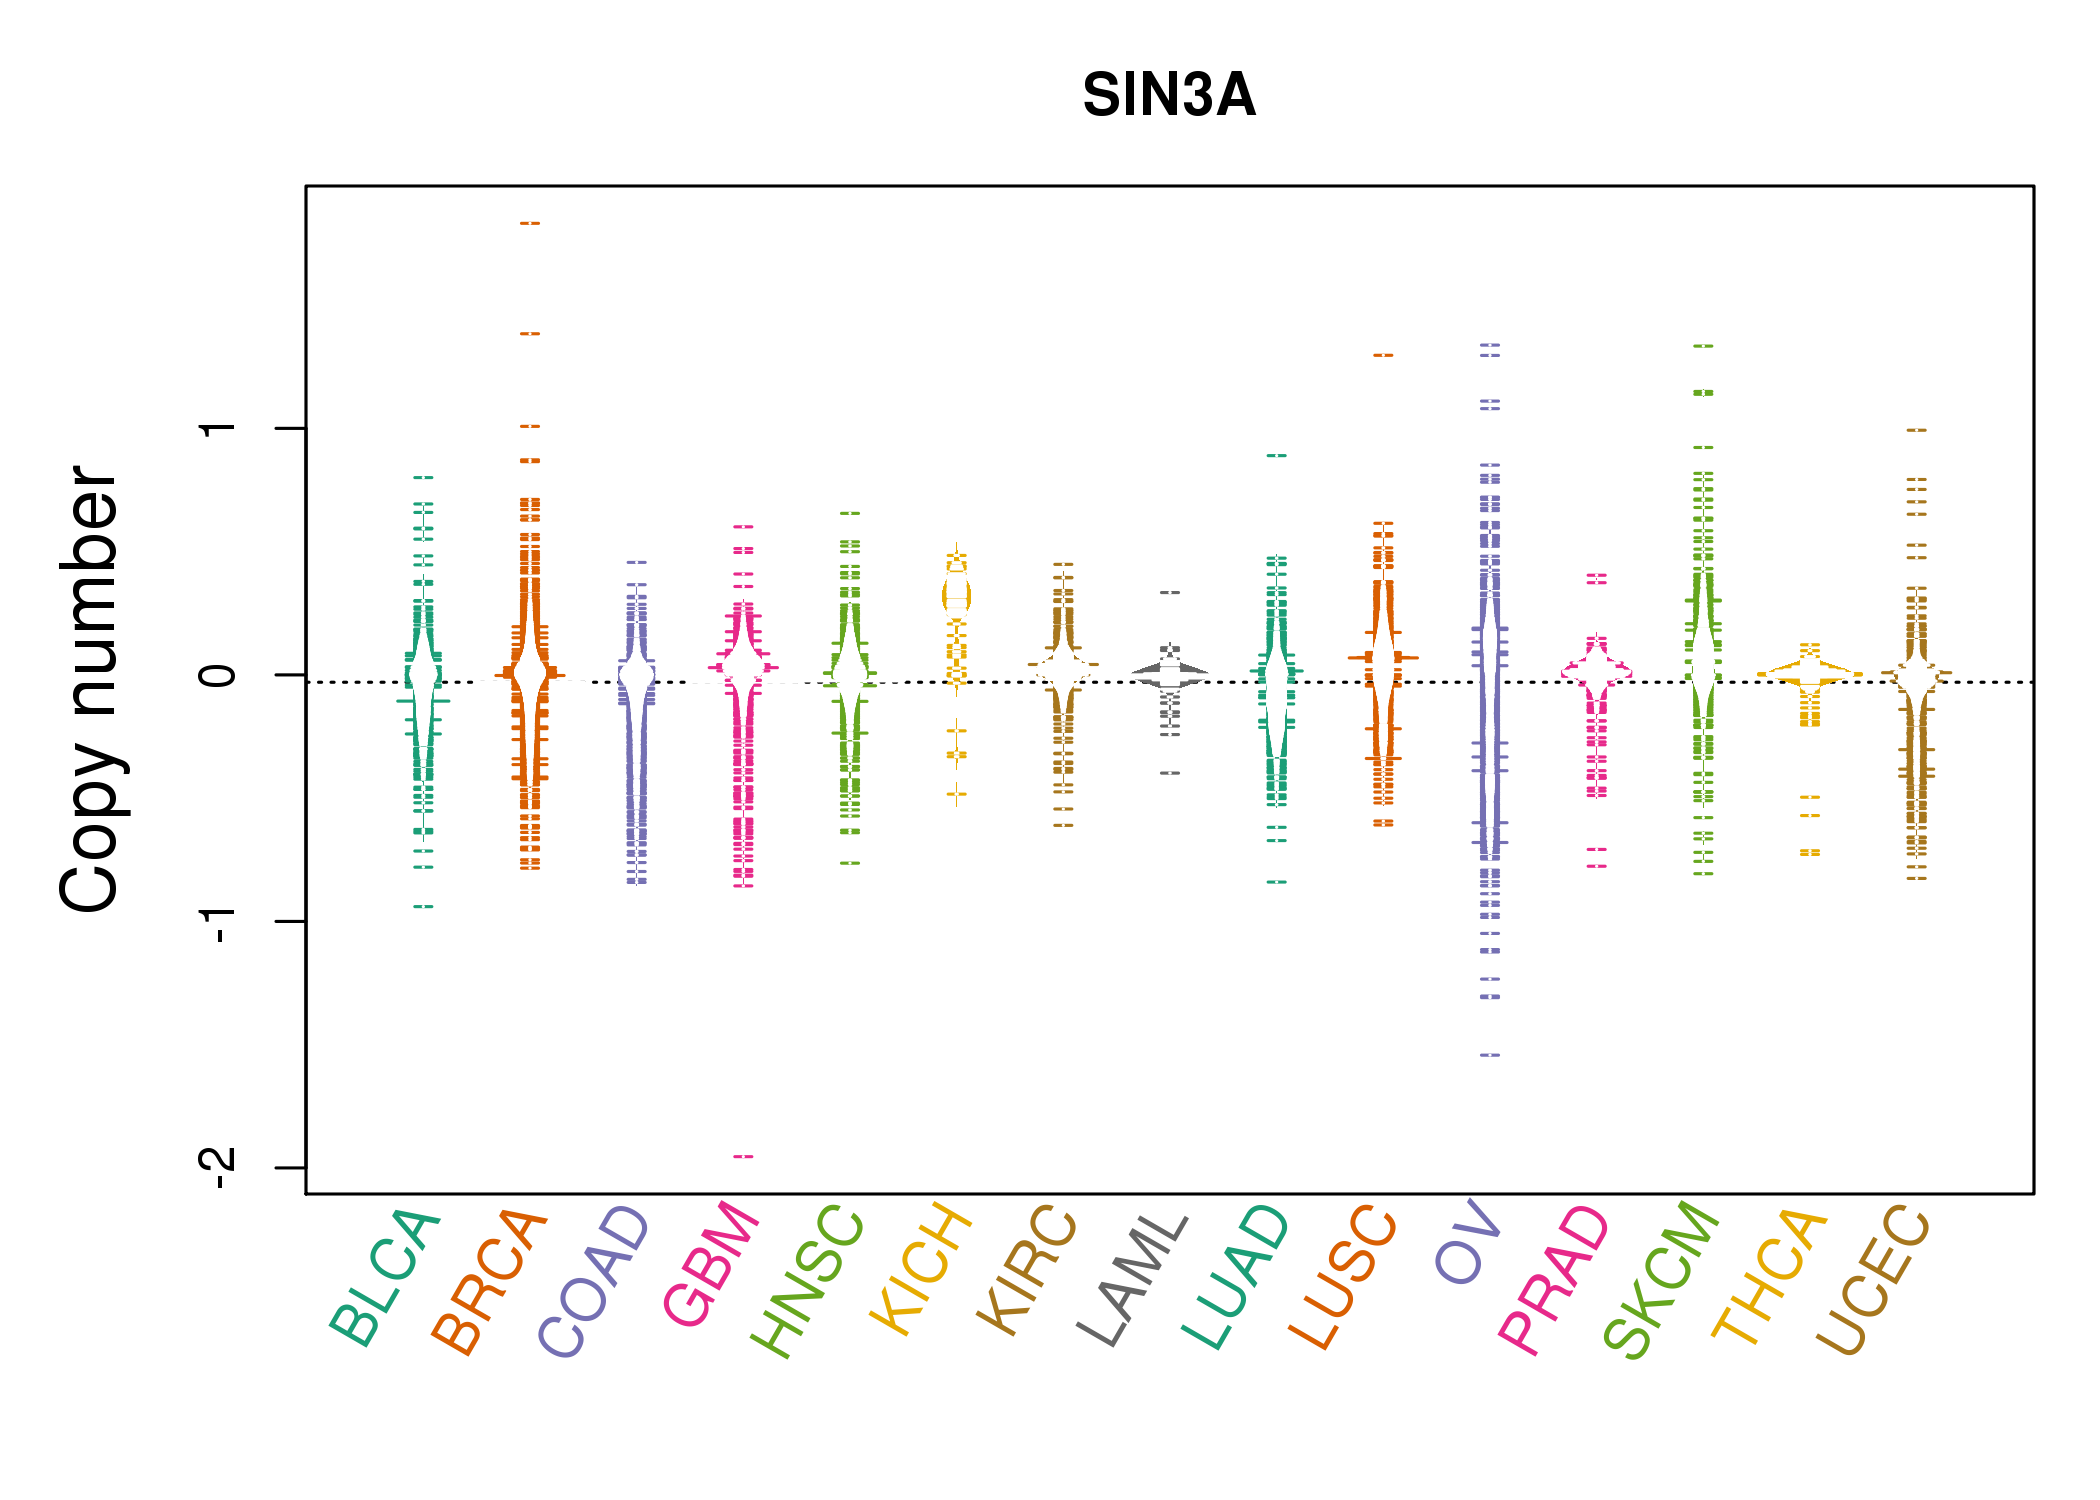 |
| cf) Tissue ID[Tissue type]: BLCA[Bladder Urothelial Carcinoma], BRCA[Breast invasive carcinoma], CESC[Cervical squamous cell carcinoma and endocervical adenocarcinoma], COAD[Colon adenocarcinoma], GBM[Glioblastoma multiforme], Glioma Low Grade, HNSC[Head and Neck squamous cell carcinoma], KICH[Kidney Chromophobe], KIRC[Kidney renal clear cell carcinoma], KIRP[Kidney renal papillary cell carcinoma], LAML[Acute Myeloid Leukemia], LUAD[Lung adenocarcinoma], LUSC[Lung squamous cell carcinoma], OV[Ovarian serous cystadenocarcinoma ], PAAD[Pancreatic adenocarcinoma], PRAD[Prostate adenocarcinoma], SKCM[Skin Cutaneous Melanoma], STAD[Stomach adenocarcinoma], THCA[Thyroid carcinoma], UCEC[Uterine Corpus Endometrial Carcinoma] |
| Top |
| Gene Expression for SIN3A |
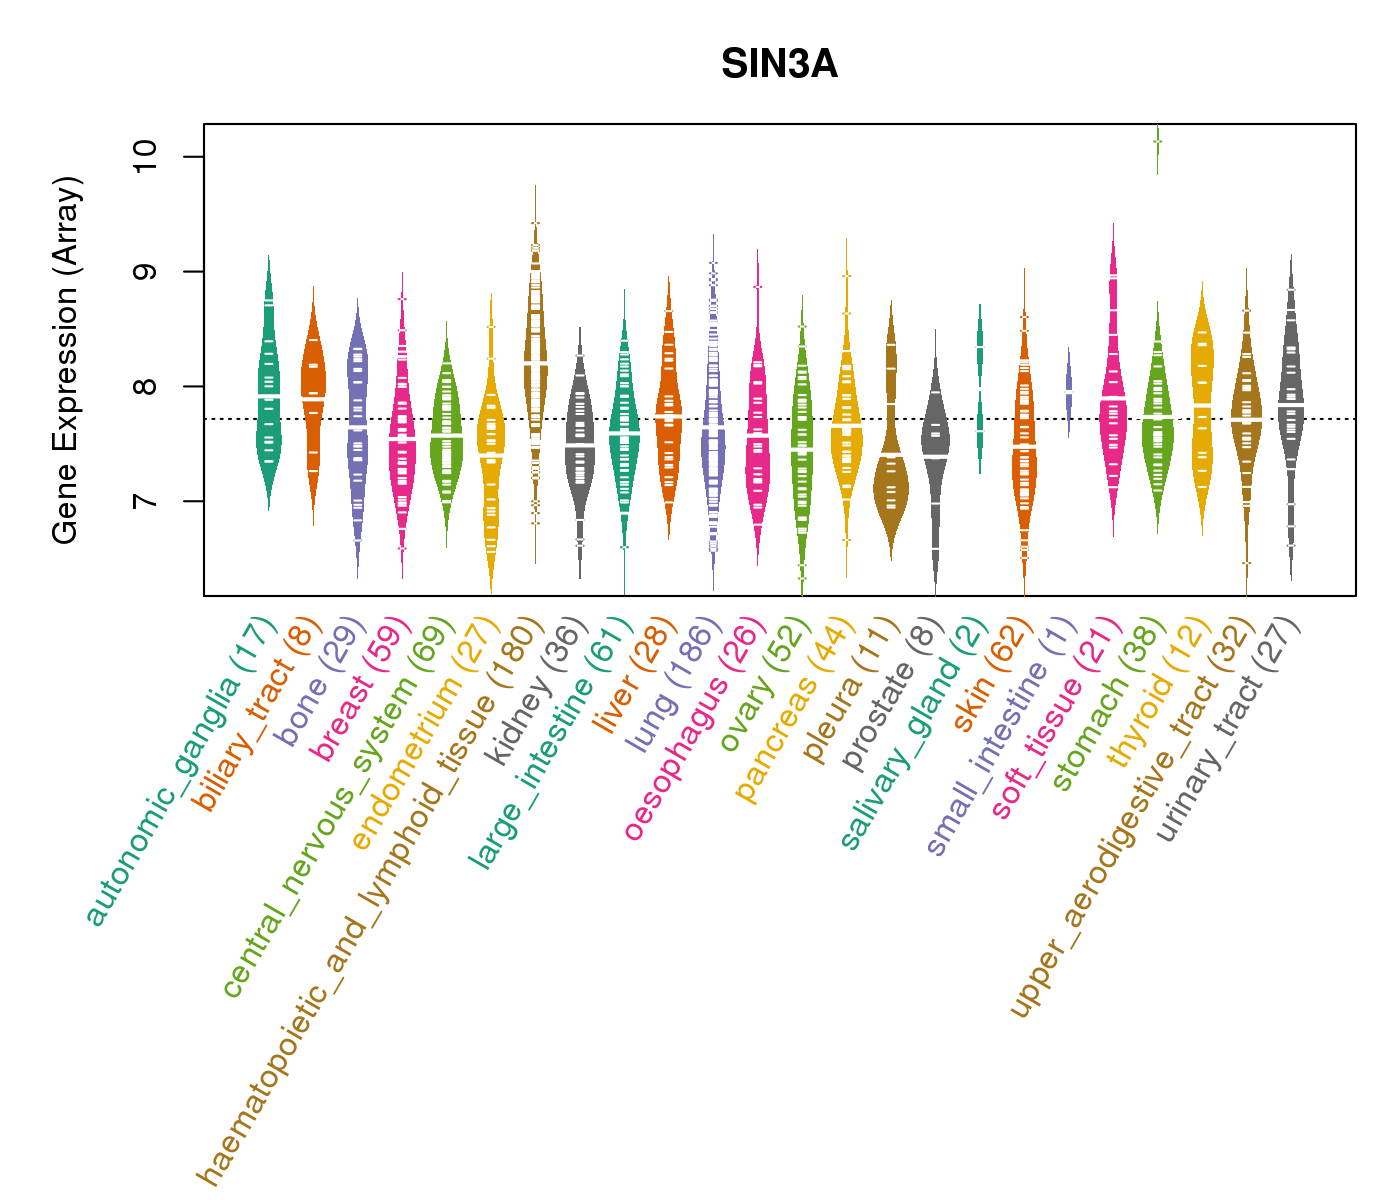
| * CCLE gene expression data were extracted from CCLE_Expression_Entrez_2012-10-18.res: Gene-centric RMA-normalized mRNA expression data. |
 |
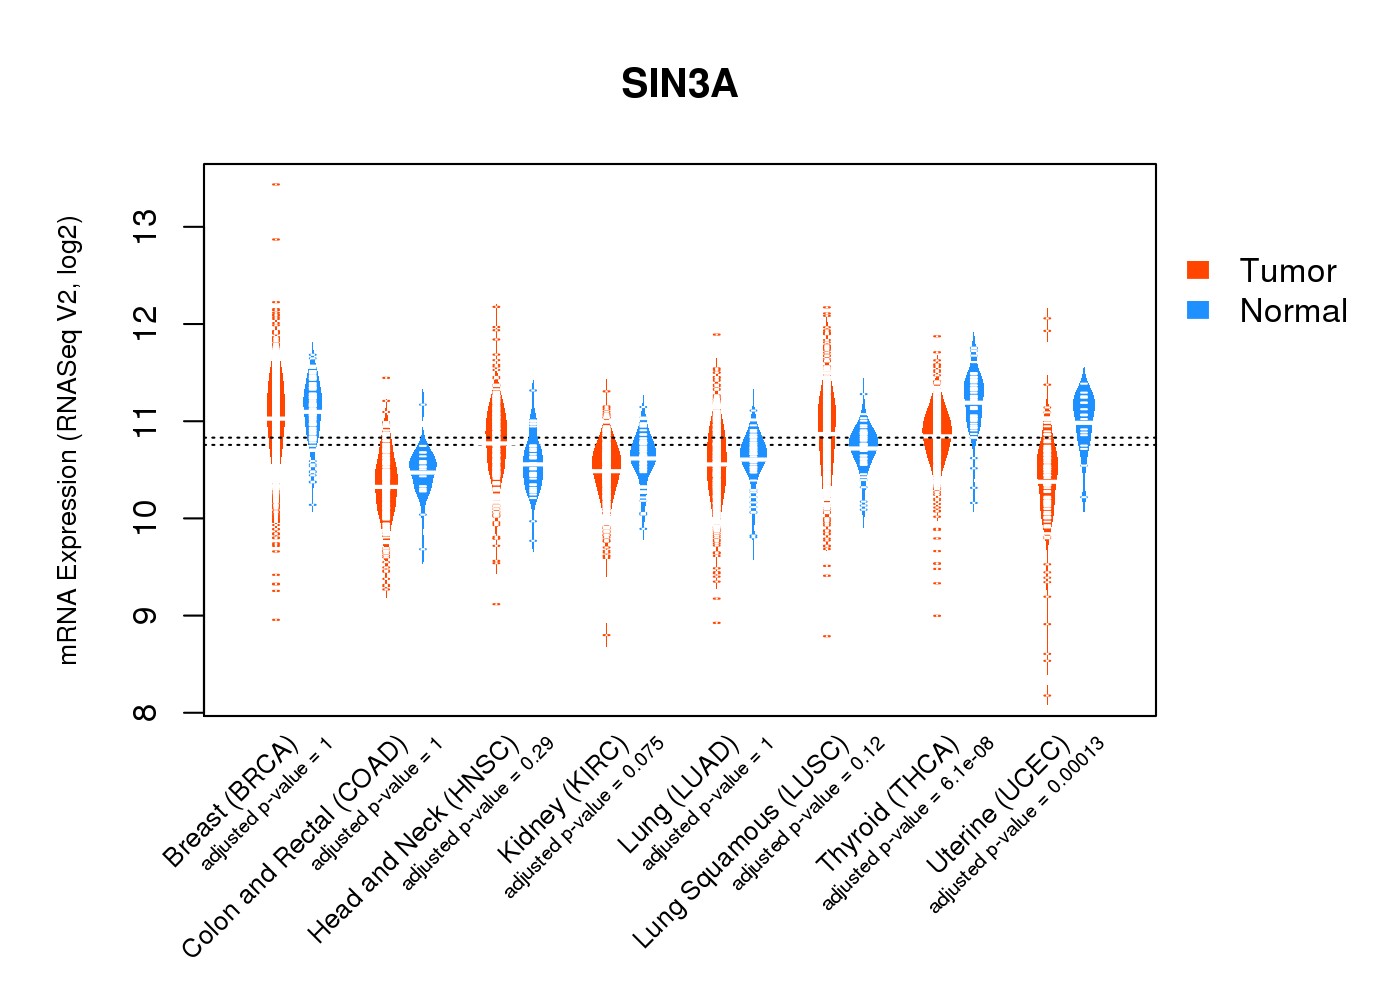
| * Normalized gene expression data of RNASeqV2 was extracted from TCGA using R package TCGA-Assembler. The URLs of all public data files on TCGA DCC data server were gathered at Jan-05-2015. Only eight cancer types have enough normal control samples for differential expression analysis. (t test, adjusted p<0.05 (using Benjamini-Hochberg FDR)) |
 |
| Top |
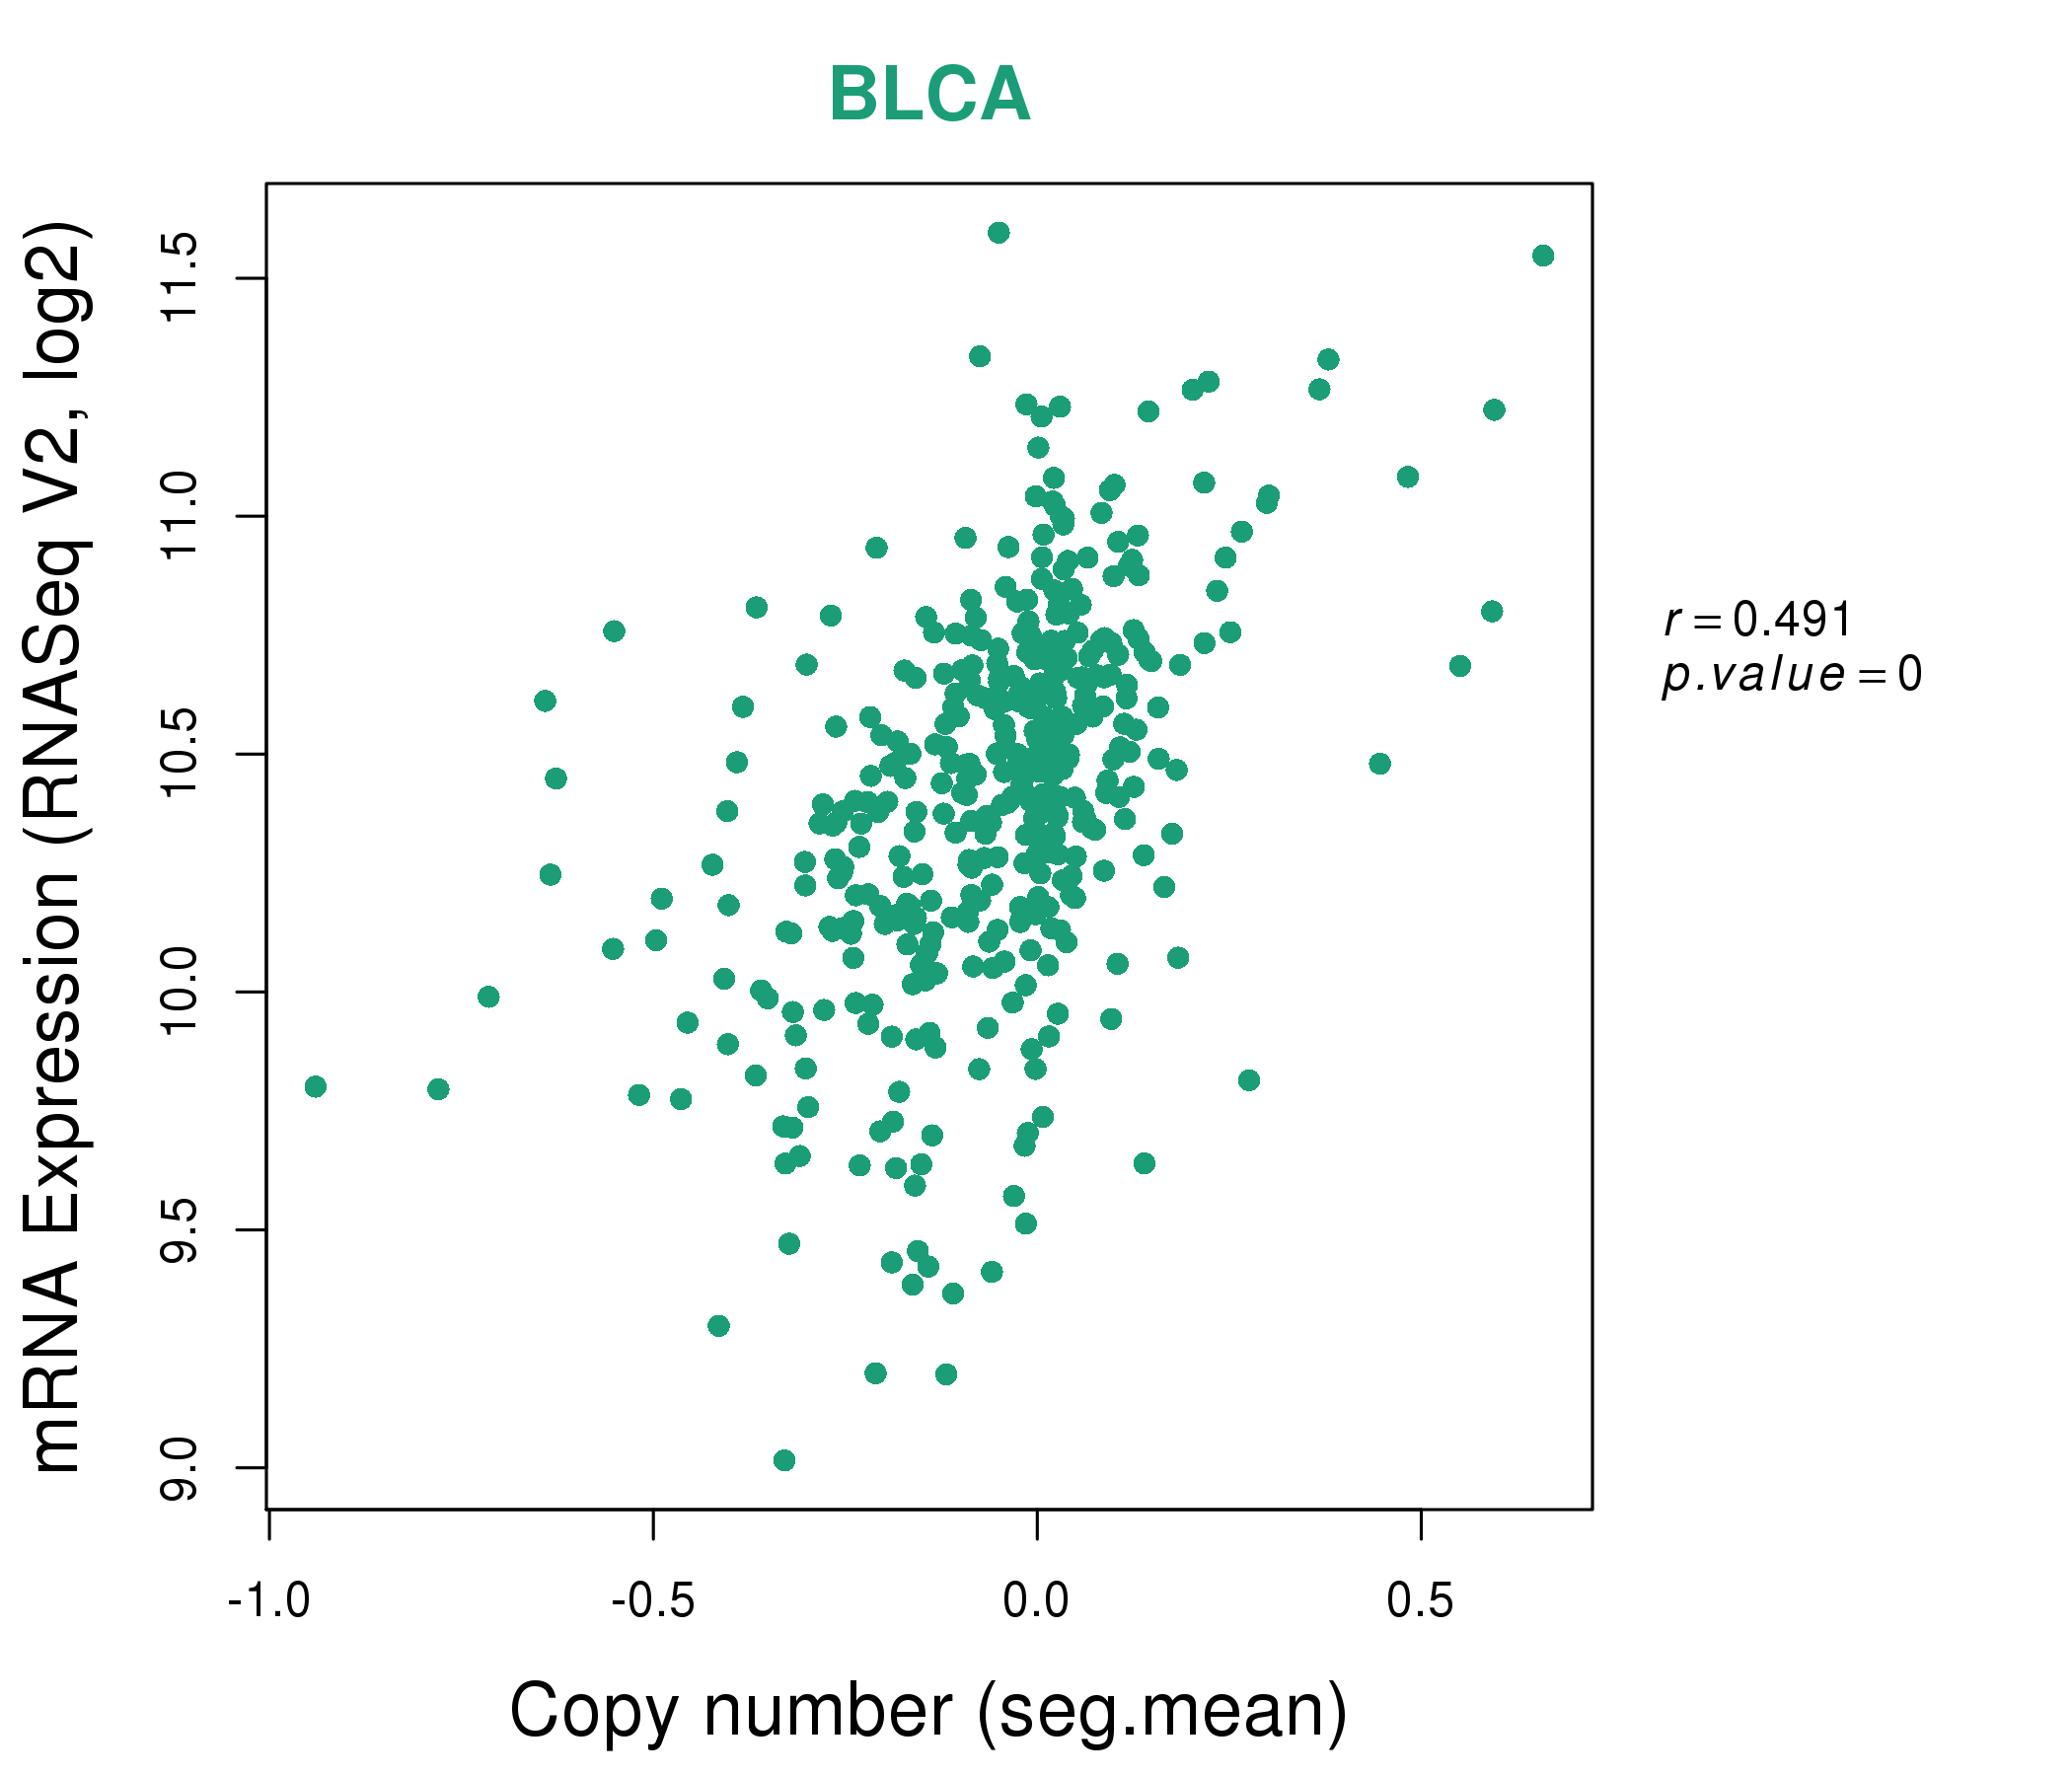
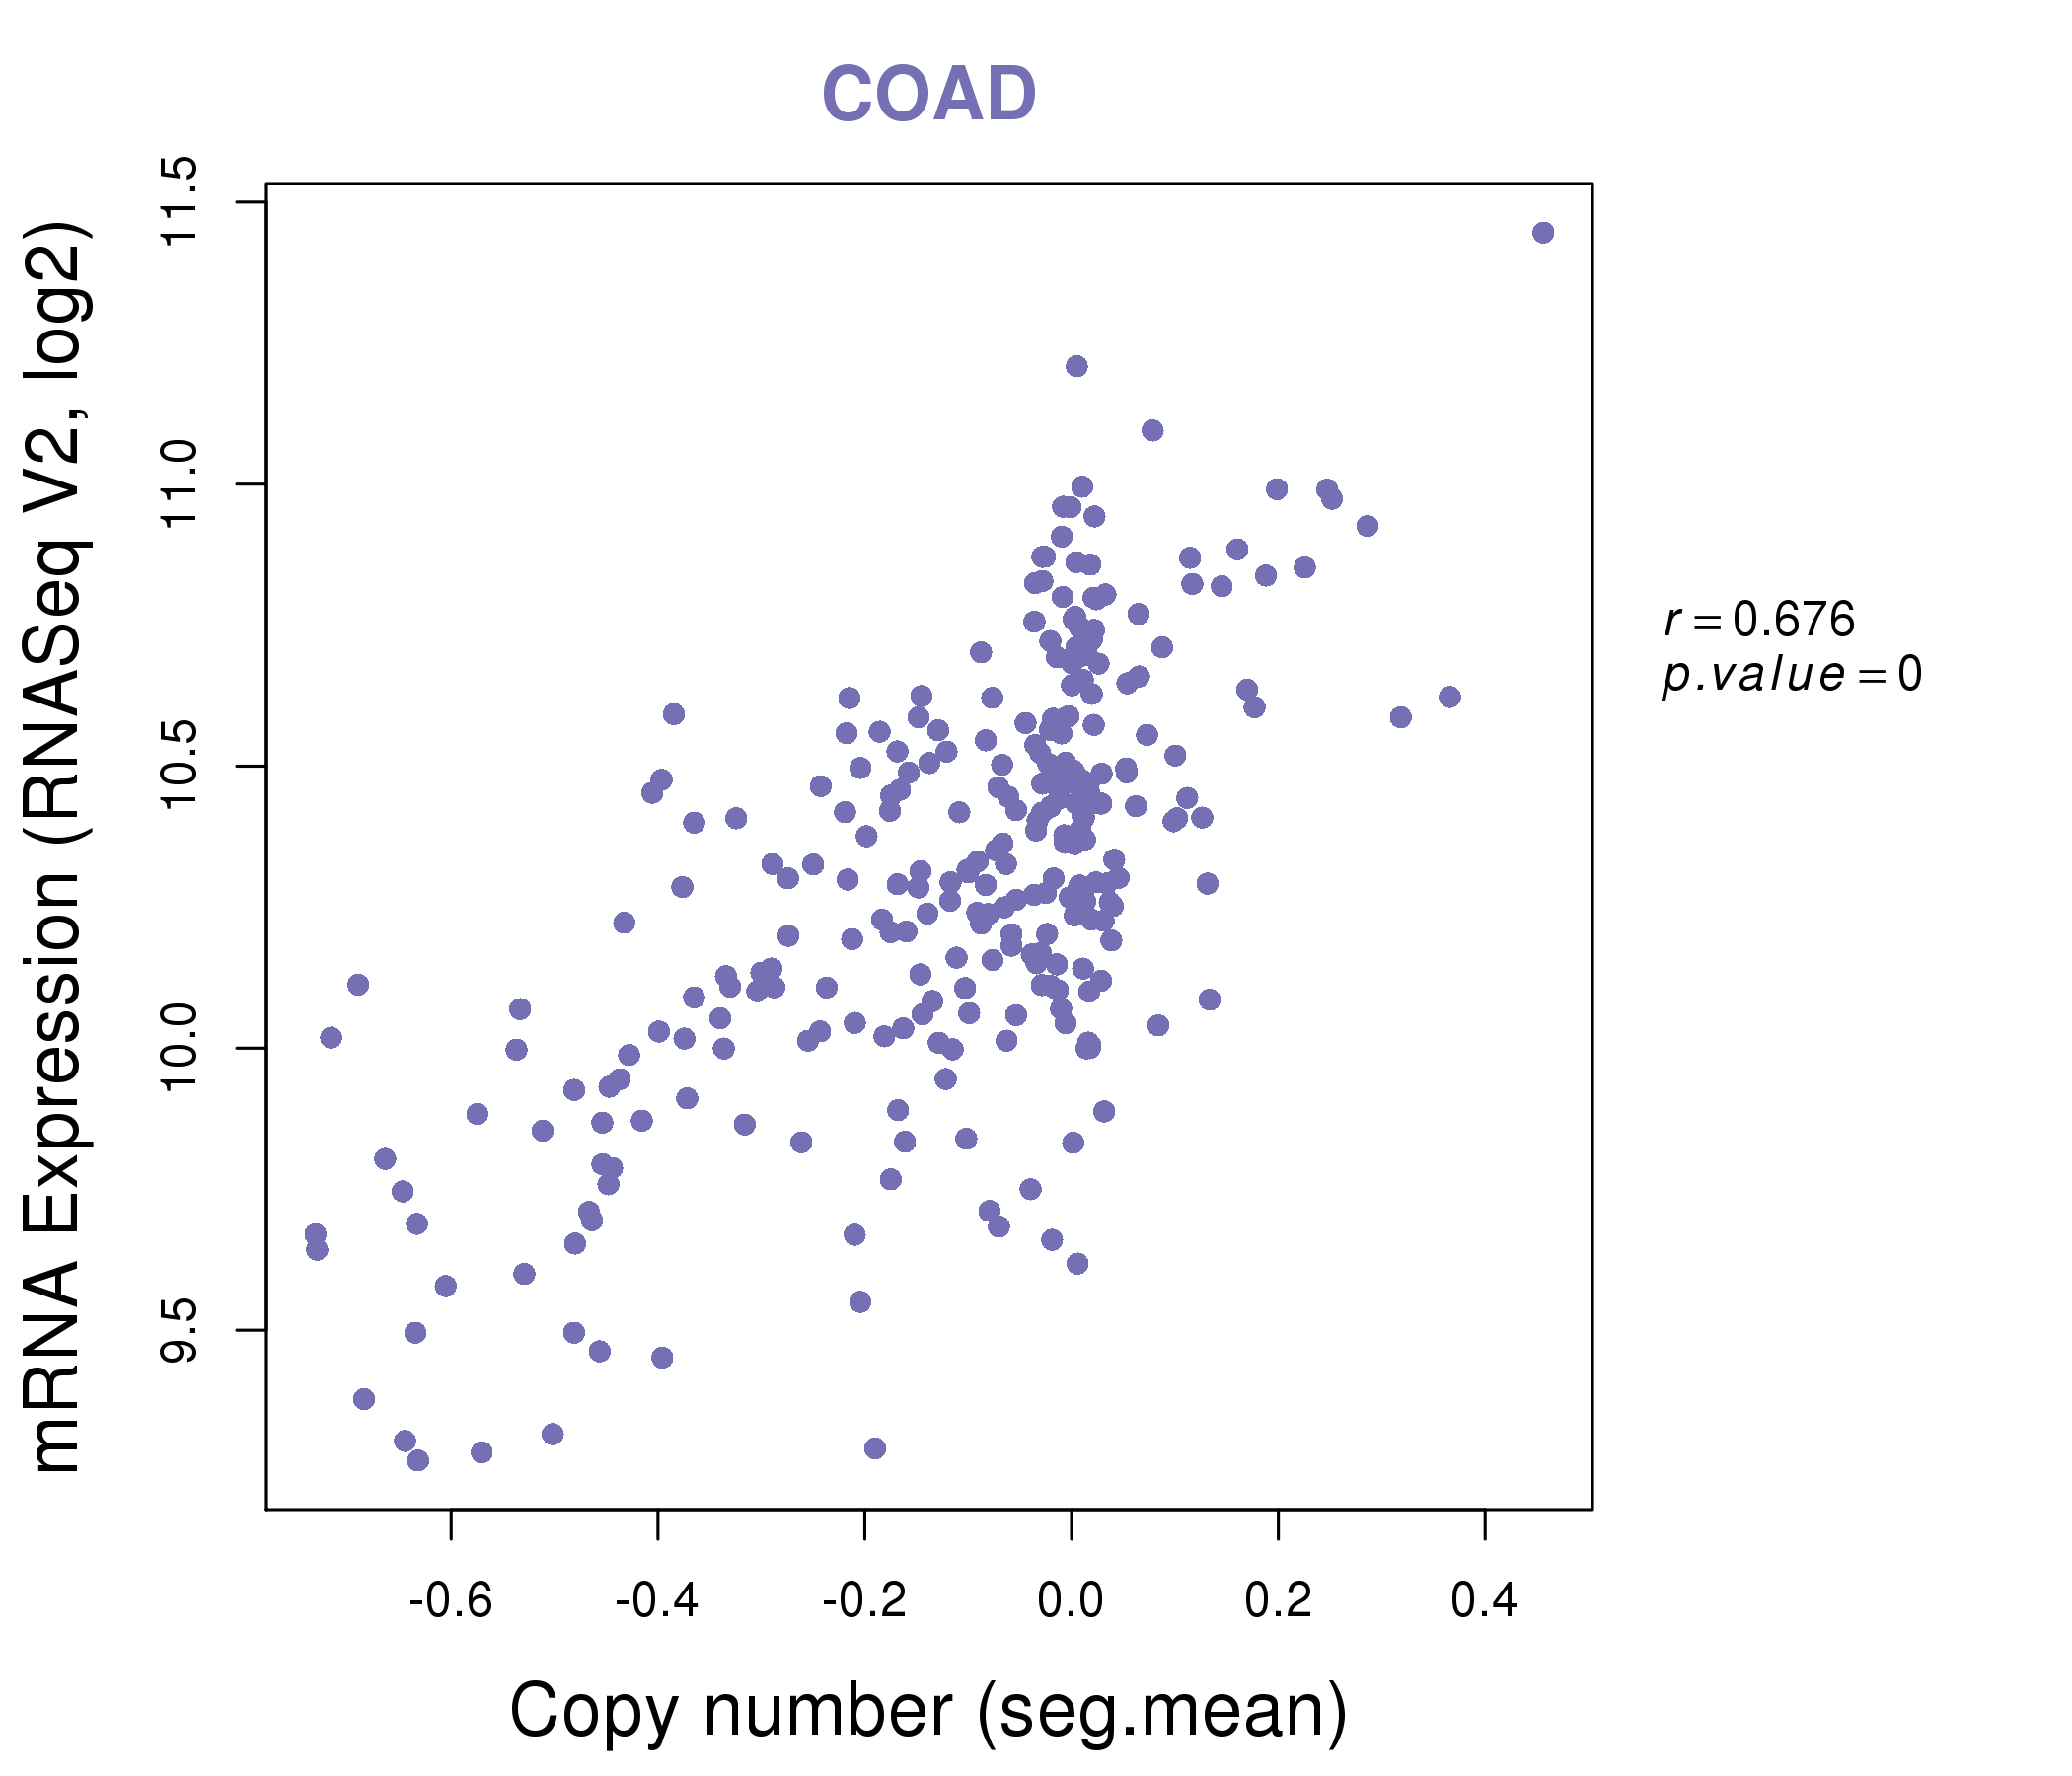
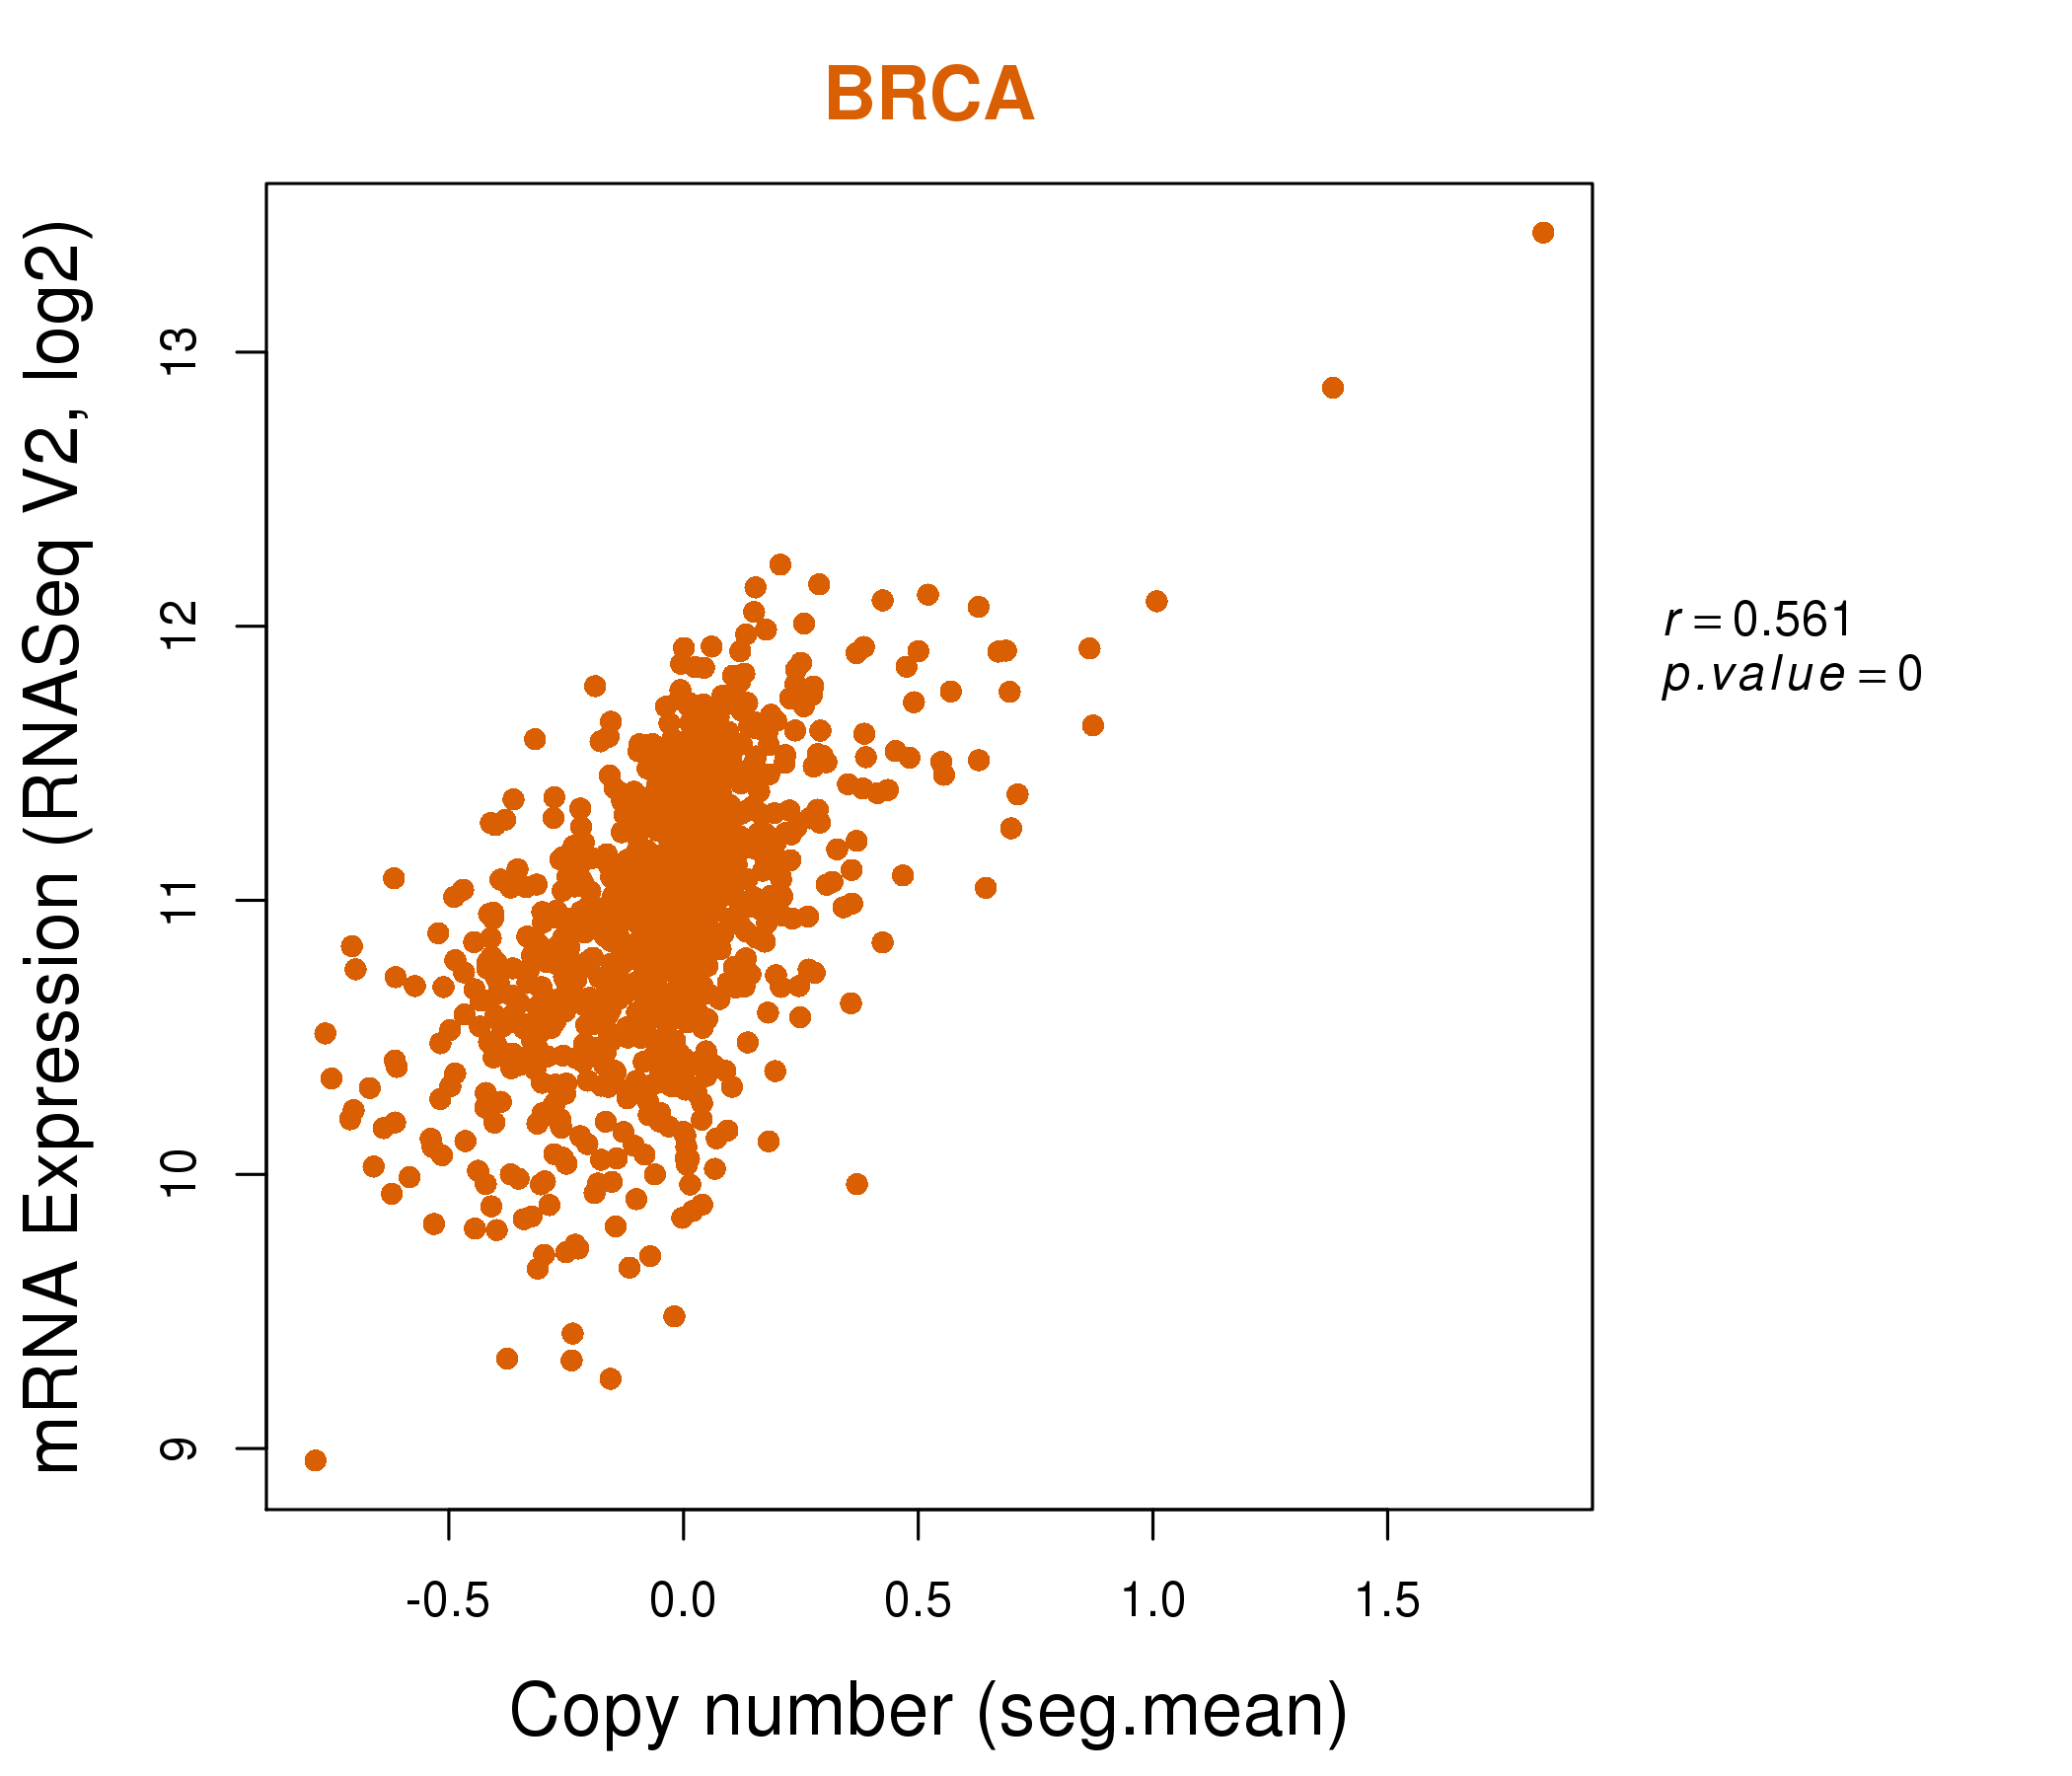
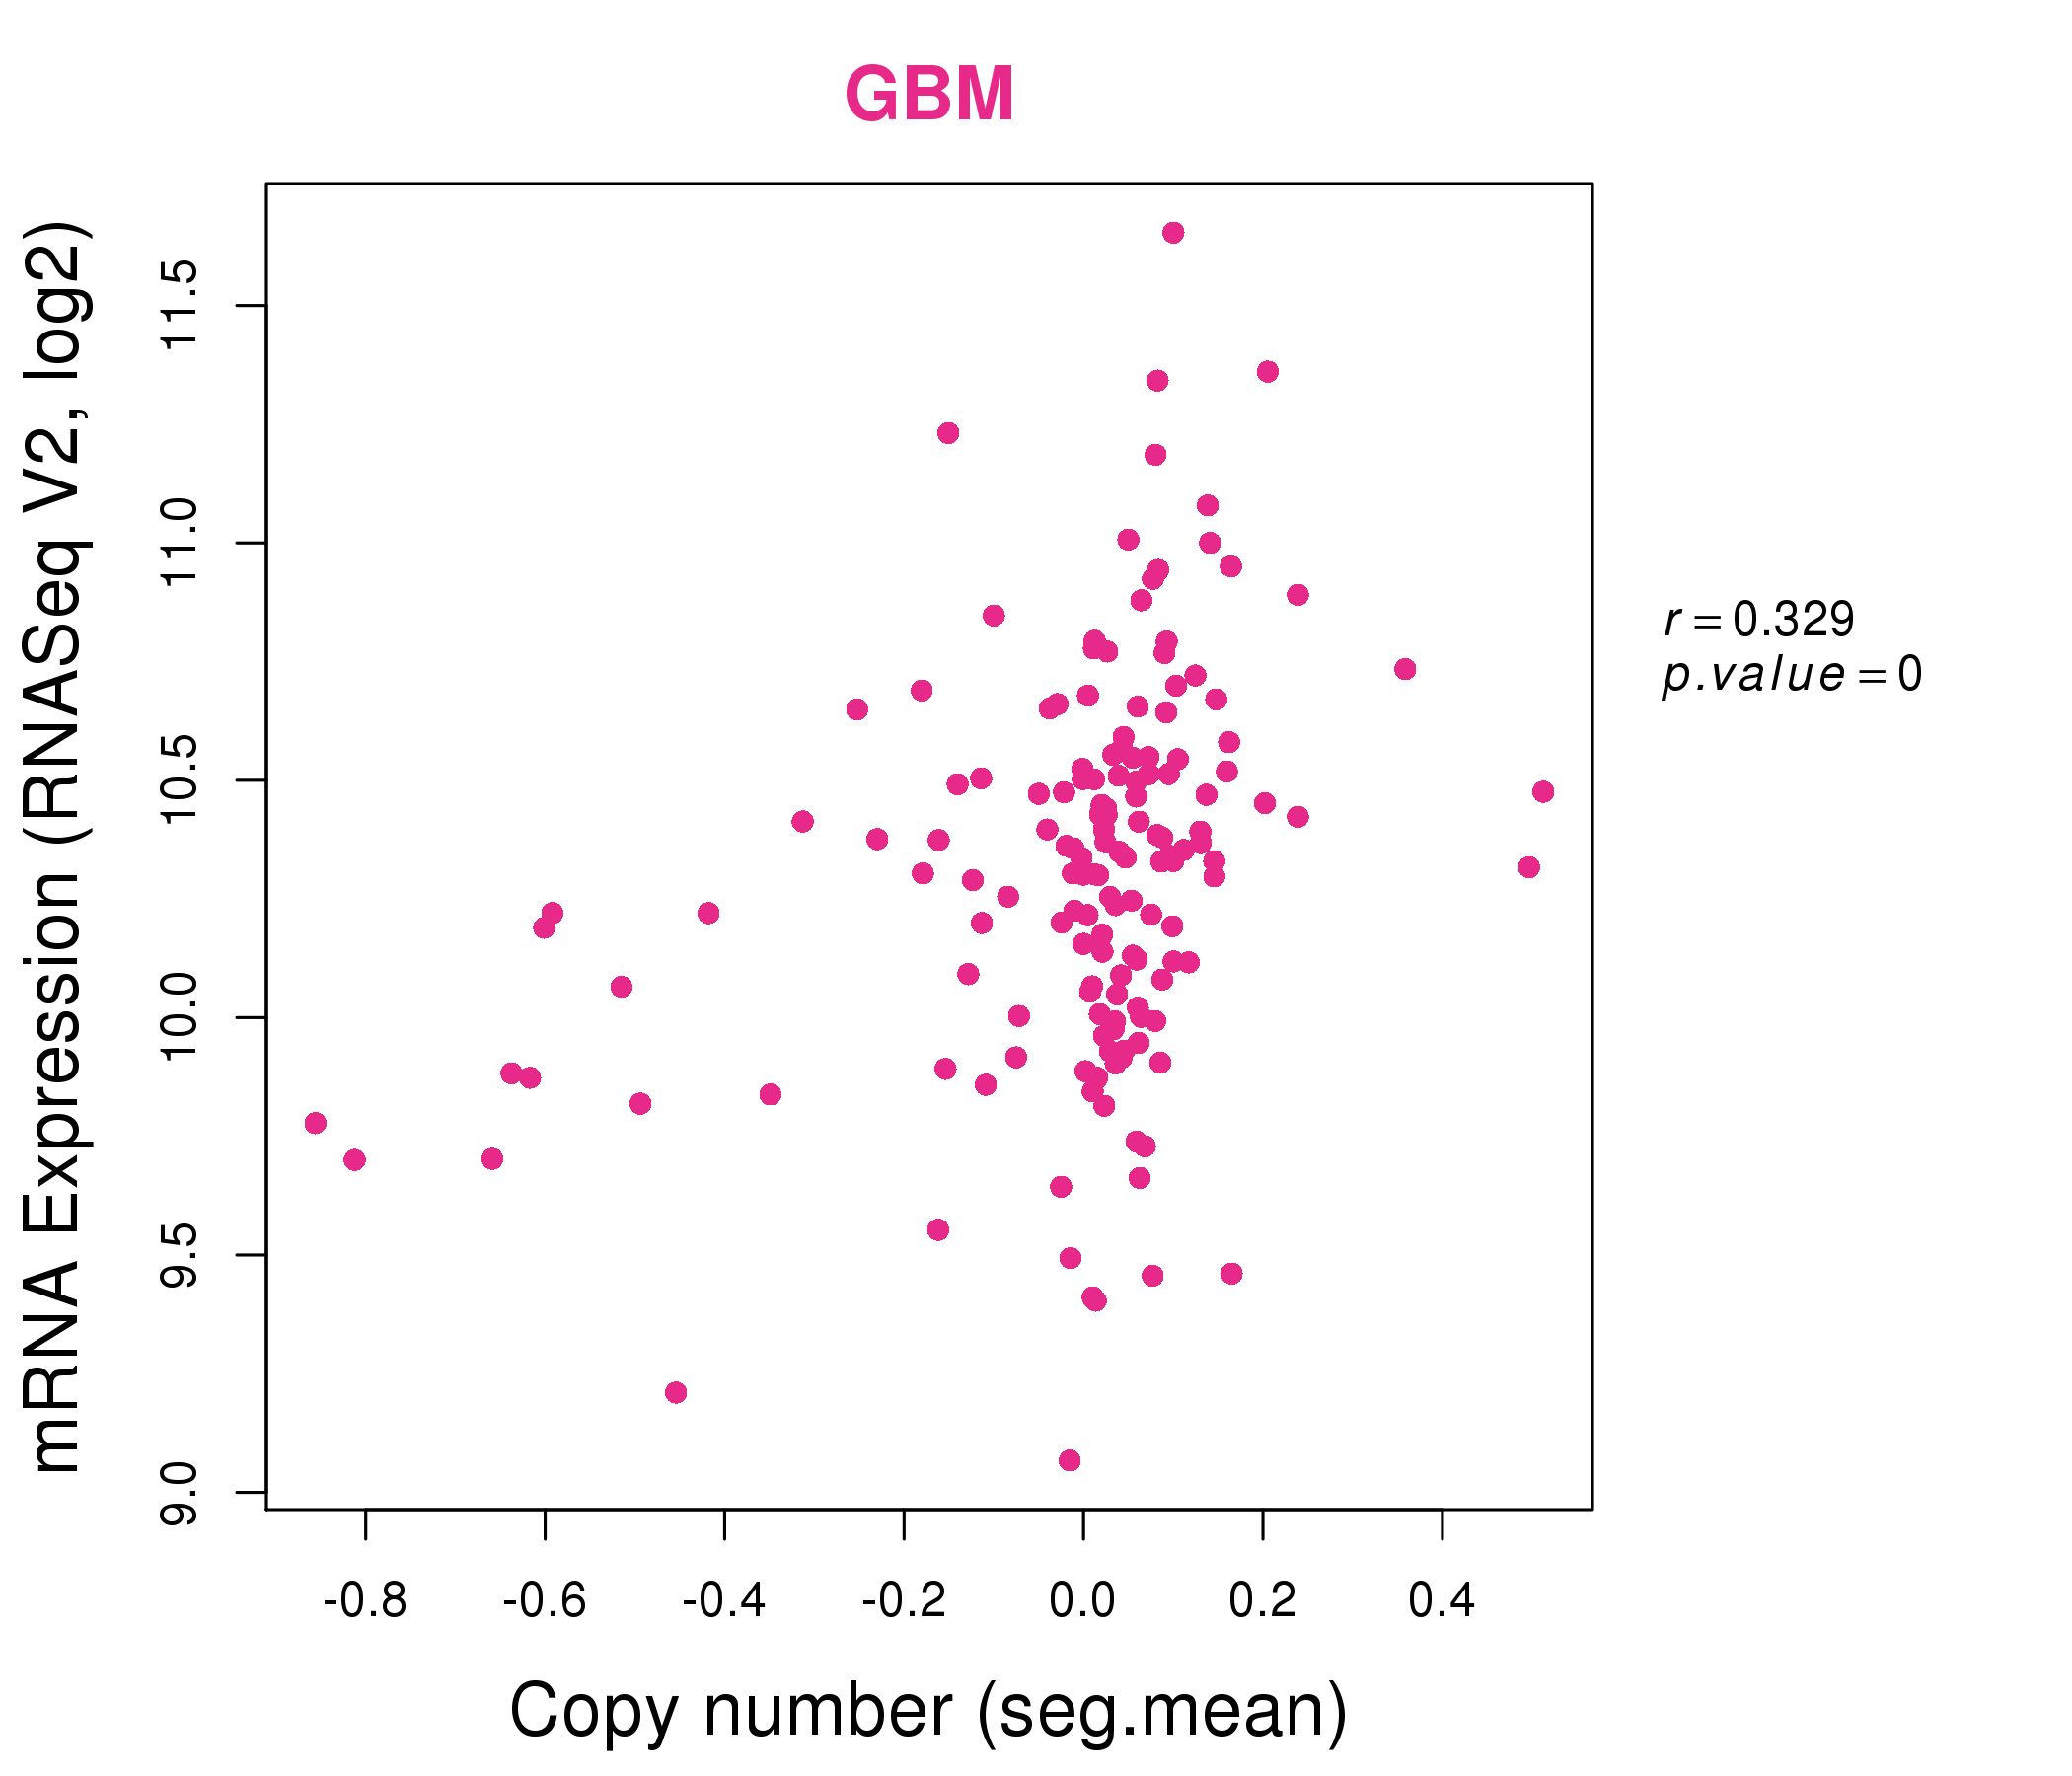
| * This plots show the correlation between CNV and gene expression. |
: Open all plots for all cancer types
 |
|
 |
|
| Top |
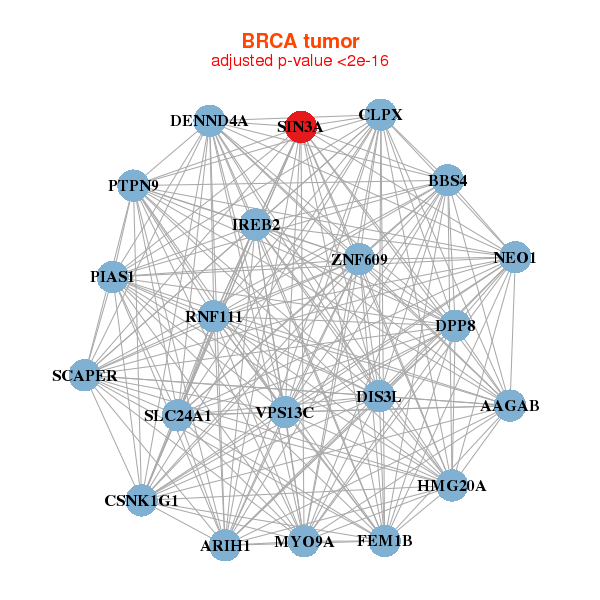
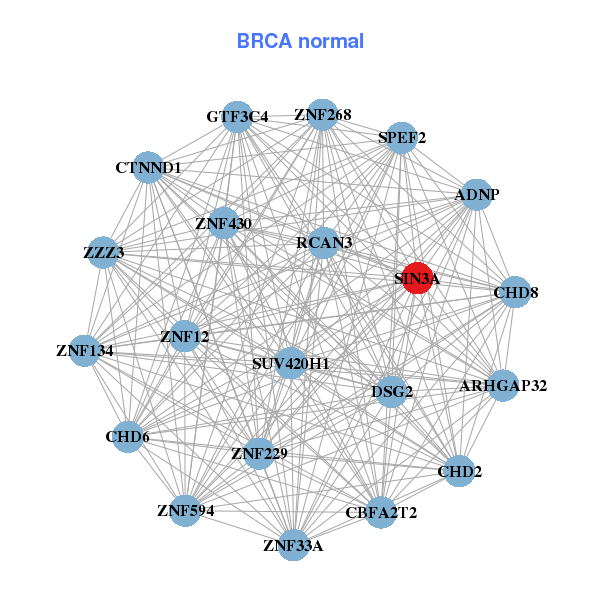
| Gene-Gene Network Information |
| * Co-Expression network figures were drawn using R package igraph. Only the top 20 genes with the highest correlations were shown. Red circle: input gene, orange circle: cell metabolism gene, sky circle: other gene |
: Open all plots for all cancer types
 |
|
| AAGAB,ARIH1,BBS4,CLPX,CSNK1G1,DENND4A,DIS3L, DPP8,FEM1B,HMG20A,IREB2,MYO9A,NEO1,PIAS1, PTPN9,RNF111,SCAPER,SIN3A,SLC24A1,VPS13C,ZNF609 | ADNP,ARHGAP32,CBFA2T2,CHD2,CHD6,CHD8,CTNND1, DSG2,GTF3C4,RCAN3,SIN3A,SPEF2,SUV420H1,ZNF12, ZNF134,ZNF229,ZNF268,ZNF33A,ZNF430,ZNF594,ZZZ3 |
 |
|
| ADAM10,ARIH1,CSNK1G1,DENND4A,DPP8,EDC3,FAM98B, FEM1B,HERC1,INO80,IREB2,PIAS1,PTPN9,RFX7, RNF111,RTF1,SIN3A,SNX1,ZNF106,ZNF592,ZNF609 | ACVR2B,ADNP,ATF7IP,BCOR,CBL,GATAD2B,GLG1, KDM3B,GLTSCR1L,KIAA1429,LSM14B,KAT7,NUMA1,RNF20, RPRD2,SIN3A,SMARCA2,SUFU,UBE4B,UBR5,ZMYM3 |
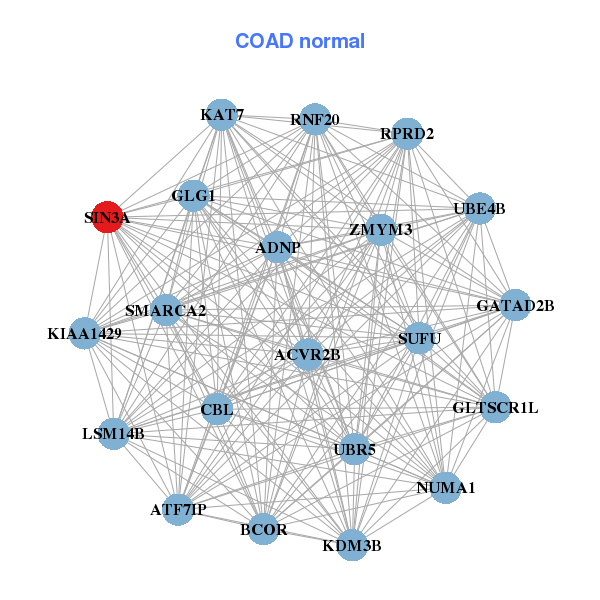
| * Co-Expression network figures were drawn using R package igraph. Only the top 20 genes with the highest correlations were shown. Red circle: input gene, orange circle: cell metabolism gene, sky circle: other gene |
: Open all plots for all cancer types
| Top |
: Open all interacting genes' information including KEGG pathway for all interacting genes from DAVID
| Top |
| Pharmacological Information for SIN3A |
| There's no related Drug. |
| Top |
| Cross referenced IDs for SIN3A |
| * We obtained these cross-references from Uniprot database. It covers 150 different DBs, 18 categories. http://www.uniprot.org/help/cross_references_section |
: Open all cross reference information
|
Copyright © 2016-Present - The Univsersity of Texas Health Science Center at Houston @ |