|
|||||||||||||||||||||||||||||||||||||||||||||||||||||||||||||||||||||||||||||||||||||||||||||||||||||||||||||||||||||||||||||||||||||||||||||||||||||||||||||||||||||||||||||||||||||||||||||||||||||||||||||||||||||||||||||||||||||||||||||||||||||||||||||||||||||||||||||||||||||||||||||||||||||||||||||||||||||||||||||||||||||||||||||||||||||||||
| |
| Phenotypic Information (metabolism pathway, cancer, disease, phenome) |
| |
| |
| Gene-Gene Network Information: Co-Expression Network, Interacting Genes & KEGG |
| |
|


| Gene Summary for PABPC1 |
| Top |
| Phenotypic Information for PABPC1(metabolism pathway, cancer, disease, phenome) |
| Cancer | CGAP: PABPC1 |
| Familial Cancer Database: PABPC1 | |
| * This gene is included in those cancer gene databases. |
|
|
|
|
|
| . | |||||||||||||||||||||||||||||||||||||||||||||||||||||||||||||||||||||||||||||||||||||||||||||||||||||||||||||||||||||||||||||||||||||||||||||||||||||||||||||||||||||||||||||||||||||||||||||||||||||||||||||||||||||||||||||||||||||||||||||||||||||||||||||||||||||||||||||||||||||||||||||||||||||||||||||||||||||||||||||||||||||||||||||||||||
Oncogene 1 | Significant driver gene in | ||||||||||||||||||||||||||||||||||||||||||||||||||||||||||||||||||||||||||||||||||||||||||||||||||||||||||||||||||||||||||||||||||||||||||||||||||||||||||||||||||||||||||||||||||||||||||||||||||||||||||||||||||||||||||||||||||||||||||||||||||||||||||||||||||||||||||||||||||||||||||||||||||||||||||||||||||||||||||||||||||||||||||||||||||||||||
| cf) number; DB name 1 Oncogene; http://nar.oxfordjournals.org/content/35/suppl_1/D721.long, 2 Tumor Suppressor gene; https://bioinfo.uth.edu/TSGene/, 3 Cancer Gene Census; http://www.nature.com/nrc/journal/v4/n3/abs/nrc1299.html, 4 CancerGenes; http://nar.oxfordjournals.org/content/35/suppl_1/D721.long, 5 Network of Cancer Gene; http://ncg.kcl.ac.uk/index.php, 1Therapeutic Vulnerabilities in Cancer; http://cbio.mskcc.org/cancergenomics/statius/ |
| REACTOME_METABOLISM_OF_PROTEINS REACTOME_METABOLISM_OF_MRNA REACTOME_METABOLISM_OF_RNA | |
| OMIM | 604679; gene. |
| Orphanet | |
| Disease | KEGG Disease: PABPC1 |
| MedGen: PABPC1 (Human Medical Genetics with Condition) | |
| ClinVar: PABPC1 | |
| Phenotype | MGI: PABPC1 (International Mouse Phenotyping Consortium) |
| PhenomicDB: PABPC1 | |
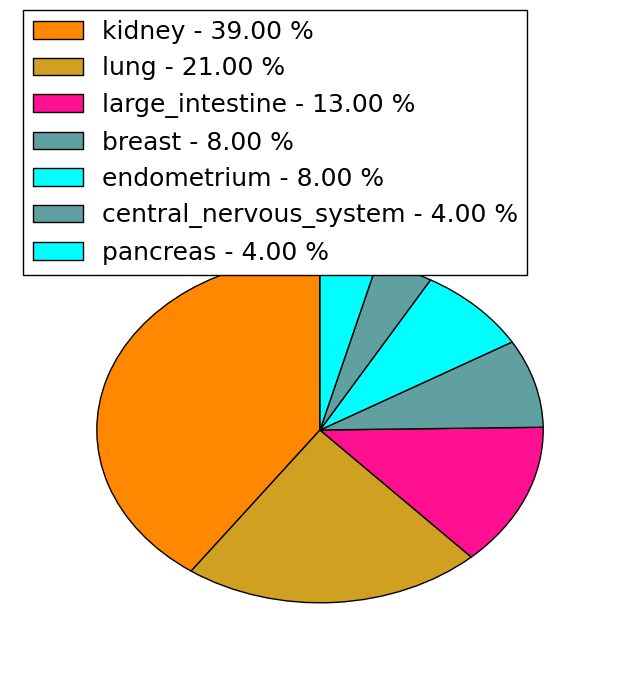
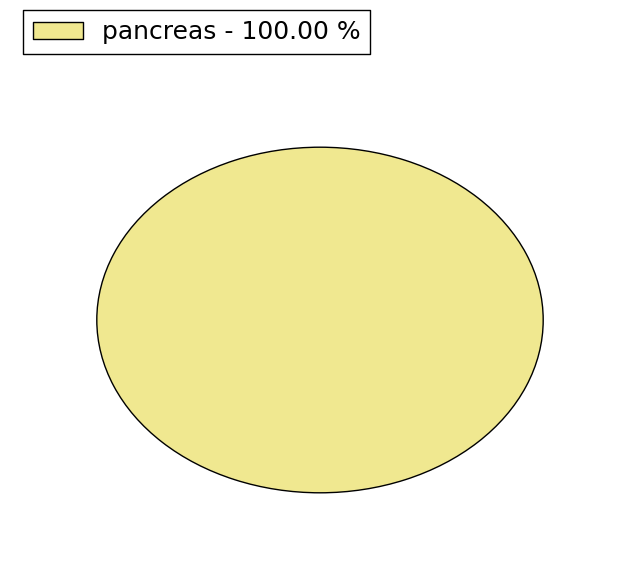
| Mutations for PABPC1 |
| * Under tables are showing count per each tissue to give us broad intuition about tissue specific mutation patterns.You can go to the detailed page for each mutation database's web site. |
| - Statistics for Tissue and Mutation type | Top |
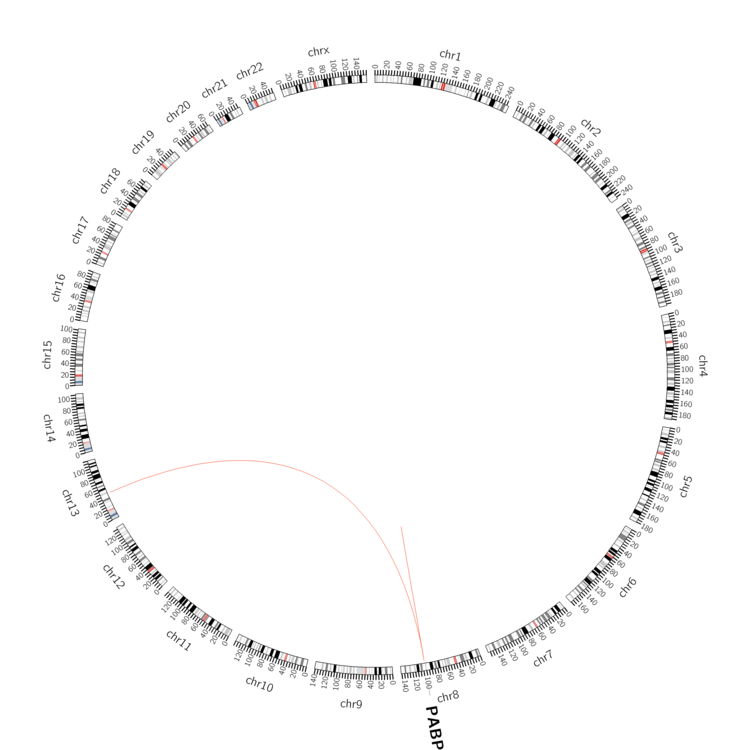 |
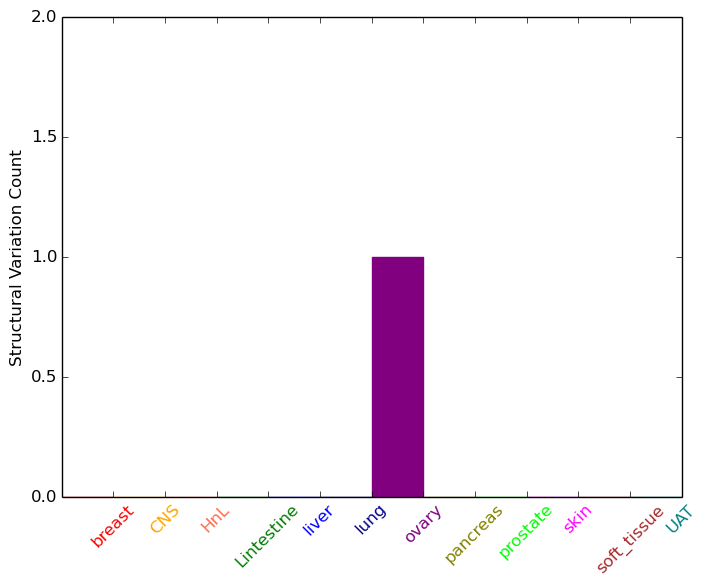
| - For Inter-chromosomal Variations |
| * Inter-chromosomal variantions includes 'interchromosomal amplicon to amplicon', 'interchromosomal amplicon to non-amplified dna', 'interchromosomal insertion', 'Interchromosomal unknown type'. |
 |
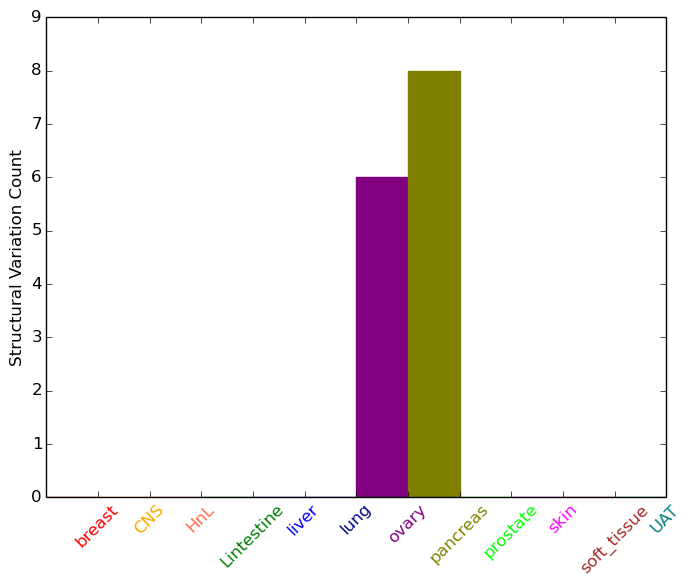
| - For Intra-chromosomal Variations |
| * Intra-chromosomal variantions includes 'intrachromosomal amplicon to amplicon', 'intrachromosomal amplicon to non-amplified dna', 'intrachromosomal deletion', 'intrachromosomal fold-back inversion', 'intrachromosomal inversion', 'intrachromosomal tandem duplication', 'Intrachromosomal unknown type', 'intrachromosomal with inverted orientation', 'intrachromosomal with non-inverted orientation'. |
 |
| Sample | Symbol_a | Chr_a | Start_a | End_a | Symbol_b | Chr_b | Start_b | End_b |
| ovary | PABPC1 | chr8 | 101719215 | 101719235 | PABPC1 | chr8 | 101721351 | 101721371 |
| pancreas | PABPC1 | chr8 | 101719215 | 101719235 | PABPC1 | chr8 | 101721351 | 101721371 |
| cf) Tissue number; Tissue name (1;Breast, 2;Central_nervous_system, 3;Haematopoietic_and_lymphoid_tissue, 4;Large_intestine, 5;Liver, 6;Lung, 7;Ovary, 8;Pancreas, 9;Prostate, 10;Skin, 11;Soft_tissue, 12;Upper_aerodigestive_tract) |
| * From mRNA Sanger sequences, Chitars2.0 arranged chimeric transcripts. This table shows PABPC1 related fusion information. |
| ID | Head Gene | Tail Gene | Accession | Gene_a | qStart_a | qEnd_a | Chromosome_a | tStart_a | tEnd_a | Gene_a | qStart_a | qEnd_a | Chromosome_a | tStart_a | tEnd_a |
| AA731281 | PABPC1 | 1 | 200 | 8 | 101733727 | 101733929 | MGEA5 | 200 | 402 | 10 | 103577939 | 103578141 | |
| DA592957 | HLA-DQB1 | 1 | 418 | 6 | 32629873 | 32634434 | PABPC1 | 414 | 560 | 8 | 101730415 | 101733671 | |
| BQ348968 | PABPC1 | 170 | 232 | 8 | 101721898 | 101721960 | DPP4 | 223 | 512 | 2 | 162849781 | 162862283 | |
| AW629981 | MFGE8 | 1 | 146 | 15 | 89445796 | 89445941 | PABPC1 | 141 | 562 | 8 | 101730429 | 101733960 | |
| AW880952 | PABPC1 | 35 | 352 | 8 | 101721812 | 101724949 | PABPC1 | 351 | 424 | 8 | 101724944 | 101725017 | |
| BE612624 | PABPC1 | 1 | 47 | 8 | 101715203 | 101715249 | VCP | 47 | 707 | 9 | 35057416 | 35060402 | |
| BG928171 | PABPC1 | 61 | 207 | 8 | 101733914 | 101734059 | NR4A1 | 190 | 628 | 12 | 52451247 | 52452841 | |
| BF087781 | PABPC1 | 29 | 130 | 8 | 101719115 | 101719216 | PABPC1 | 127 | 318 | 8 | 101721361 | 101721787 | |
| DB265528 | PABPC1 | 1 | 213 | 8 | 101734039 | 101734251 | MTMR14 | 206 | 592 | 3 | 9691293 | 9695557 | |
| DW419798 | RFX3 | 18 | 90 | 9 | 3524905 | 3524977 | PABPC1 | 89 | 302 | 8 | 101718881 | 101719175 | |
| Top |
| Mutation type/ Tissue ID | brca | cns | cerv | endome | haematopo | kidn | Lintest | liver | lung | ns | ovary | pancre | prost | skin | stoma | thyro | urina | |||
| Total # sample | 1 | |||||||||||||||||||
| GAIN (# sample) | 1 | |||||||||||||||||||
| LOSS (# sample) |
| cf) Tissue ID; Tissue type (1; Breast, 2; Central_nervous_system, 3; Cervix, 4; Endometrium, 5; Haematopoietic_and_lymphoid_tissue, 6; Kidney, 7; Large_intestine, 8; Liver, 9; Lung, 10; NS, 11; Ovary, 12; Pancreas, 13; Prostate, 14; Skin, 15; Stomach, 16; Thyroid, 17; Urinary_tract) |
| Top |
|
 |
| Top |
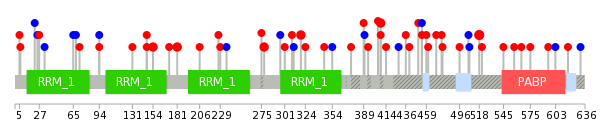
| Stat. for Non-Synonymous SNVs (# total SNVs=72) | (# total SNVs=23) |
 |  |
(# total SNVs=1) | (# total SNVs=1) |
 |  |
| Top |
| * When you move the cursor on each content, you can see more deailed mutation information on the Tooltip. Those are primary_site,primary_histology,mutation(aa),pubmedID. |
| GRCh37 position | Mutation(aa) | Unique sampleID count |
| chr8:101727750-101727750 | p.I195V | 5 |
| chr8:101727766-101727766 | p.E189E | 5 |
| chr8:101719201-101719201 | p.I454T | 4 |
| chr8:101721709-101721709 | p.Y408F | 4 |
| chr8:101730064-101730064 | p.T147M | 3 |
| chr8:101721407-101721407 | p.Q430Q | 3 |
| chr8:101718965-101718965 | p.R506C | 3 |
| chr8:101718968-101718968 | p.V505I | 3 |
| chr8:101718987-101718987 | p.A498A | 3 |
| chr8:101719004-101719004 | p.R493C | 3 |
| Top |
|
 |
| Point Mutation/ Tissue ID | 1 | 2 | 3 | 4 | 5 | 6 | 7 | 8 | 9 | 10 | 11 | 12 | 13 | 14 | 15 | 16 | 17 | 18 | 19 | 20 |
| # sample | 2 | 4 | 9 | 1 | 1 | 13 | 7 | 4 | 3 | 5 | 2 | 1 | 11 | |||||||
| # mutation | 2 | 4 | 8 | 1 | 1 | 11 | 9 | 5 | 3 | 5 | 2 | 1 | 12 | |||||||
| nonsynonymous SNV | 2 | 5 | 9 | 6 | 5 | 3 | 3 | 2 | 1 | 11 | ||||||||||
| synonymous SNV | 2 | 2 | 3 | 1 | 1 | 2 | 3 | 2 | 1 |
| cf) Tissue ID; Tissue type (1; BLCA[Bladder Urothelial Carcinoma], 2; BRCA[Breast invasive carcinoma], 3; CESC[Cervical squamous cell carcinoma and endocervical adenocarcinoma], 4; COAD[Colon adenocarcinoma], 5; GBM[Glioblastoma multiforme], 6; Glioma Low Grade, 7; HNSC[Head and Neck squamous cell carcinoma], 8; KICH[Kidney Chromophobe], 9; KIRC[Kidney renal clear cell carcinoma], 10; KIRP[Kidney renal papillary cell carcinoma], 11; LAML[Acute Myeloid Leukemia], 12; LUAD[Lung adenocarcinoma], 13; LUSC[Lung squamous cell carcinoma], 14; OV[Ovarian serous cystadenocarcinoma ], 15; PAAD[Pancreatic adenocarcinoma], 16; PRAD[Prostate adenocarcinoma], 17; SKCM[Skin Cutaneous Melanoma], 18:STAD[Stomach adenocarcinoma], 19:THCA[Thyroid carcinoma], 20:UCEC[Uterine Corpus Endometrial Carcinoma]) |
| Top |
| * We represented just top 10 SNVs. When you move the cursor on each content, you can see more deailed mutation information on the Tooltip. Those are primary_site, primary_histology, mutation(aa), pubmedID. |
| Genomic Position | Mutation(aa) | Unique sampleID count |
| chr8:101718929 | p.R518C | 3 |
| chr8:101721709 | p.Y408F | 3 |
| chr8:101730064 | p.A181T | 2 |
| chr8:101724923 | p.A154G | 2 |
| chr8:101724606 | p.T147M | 2 |
| chr8:101727792 | p.T319I | 2 |
| chr8:101730043 | p.R278H | 2 |
| chr8:101733746 | p.E275K | 1 |
| chr8:101721719 | p.L27P | 1 |
| chr8:101717279 | p.Q521R | 1 |
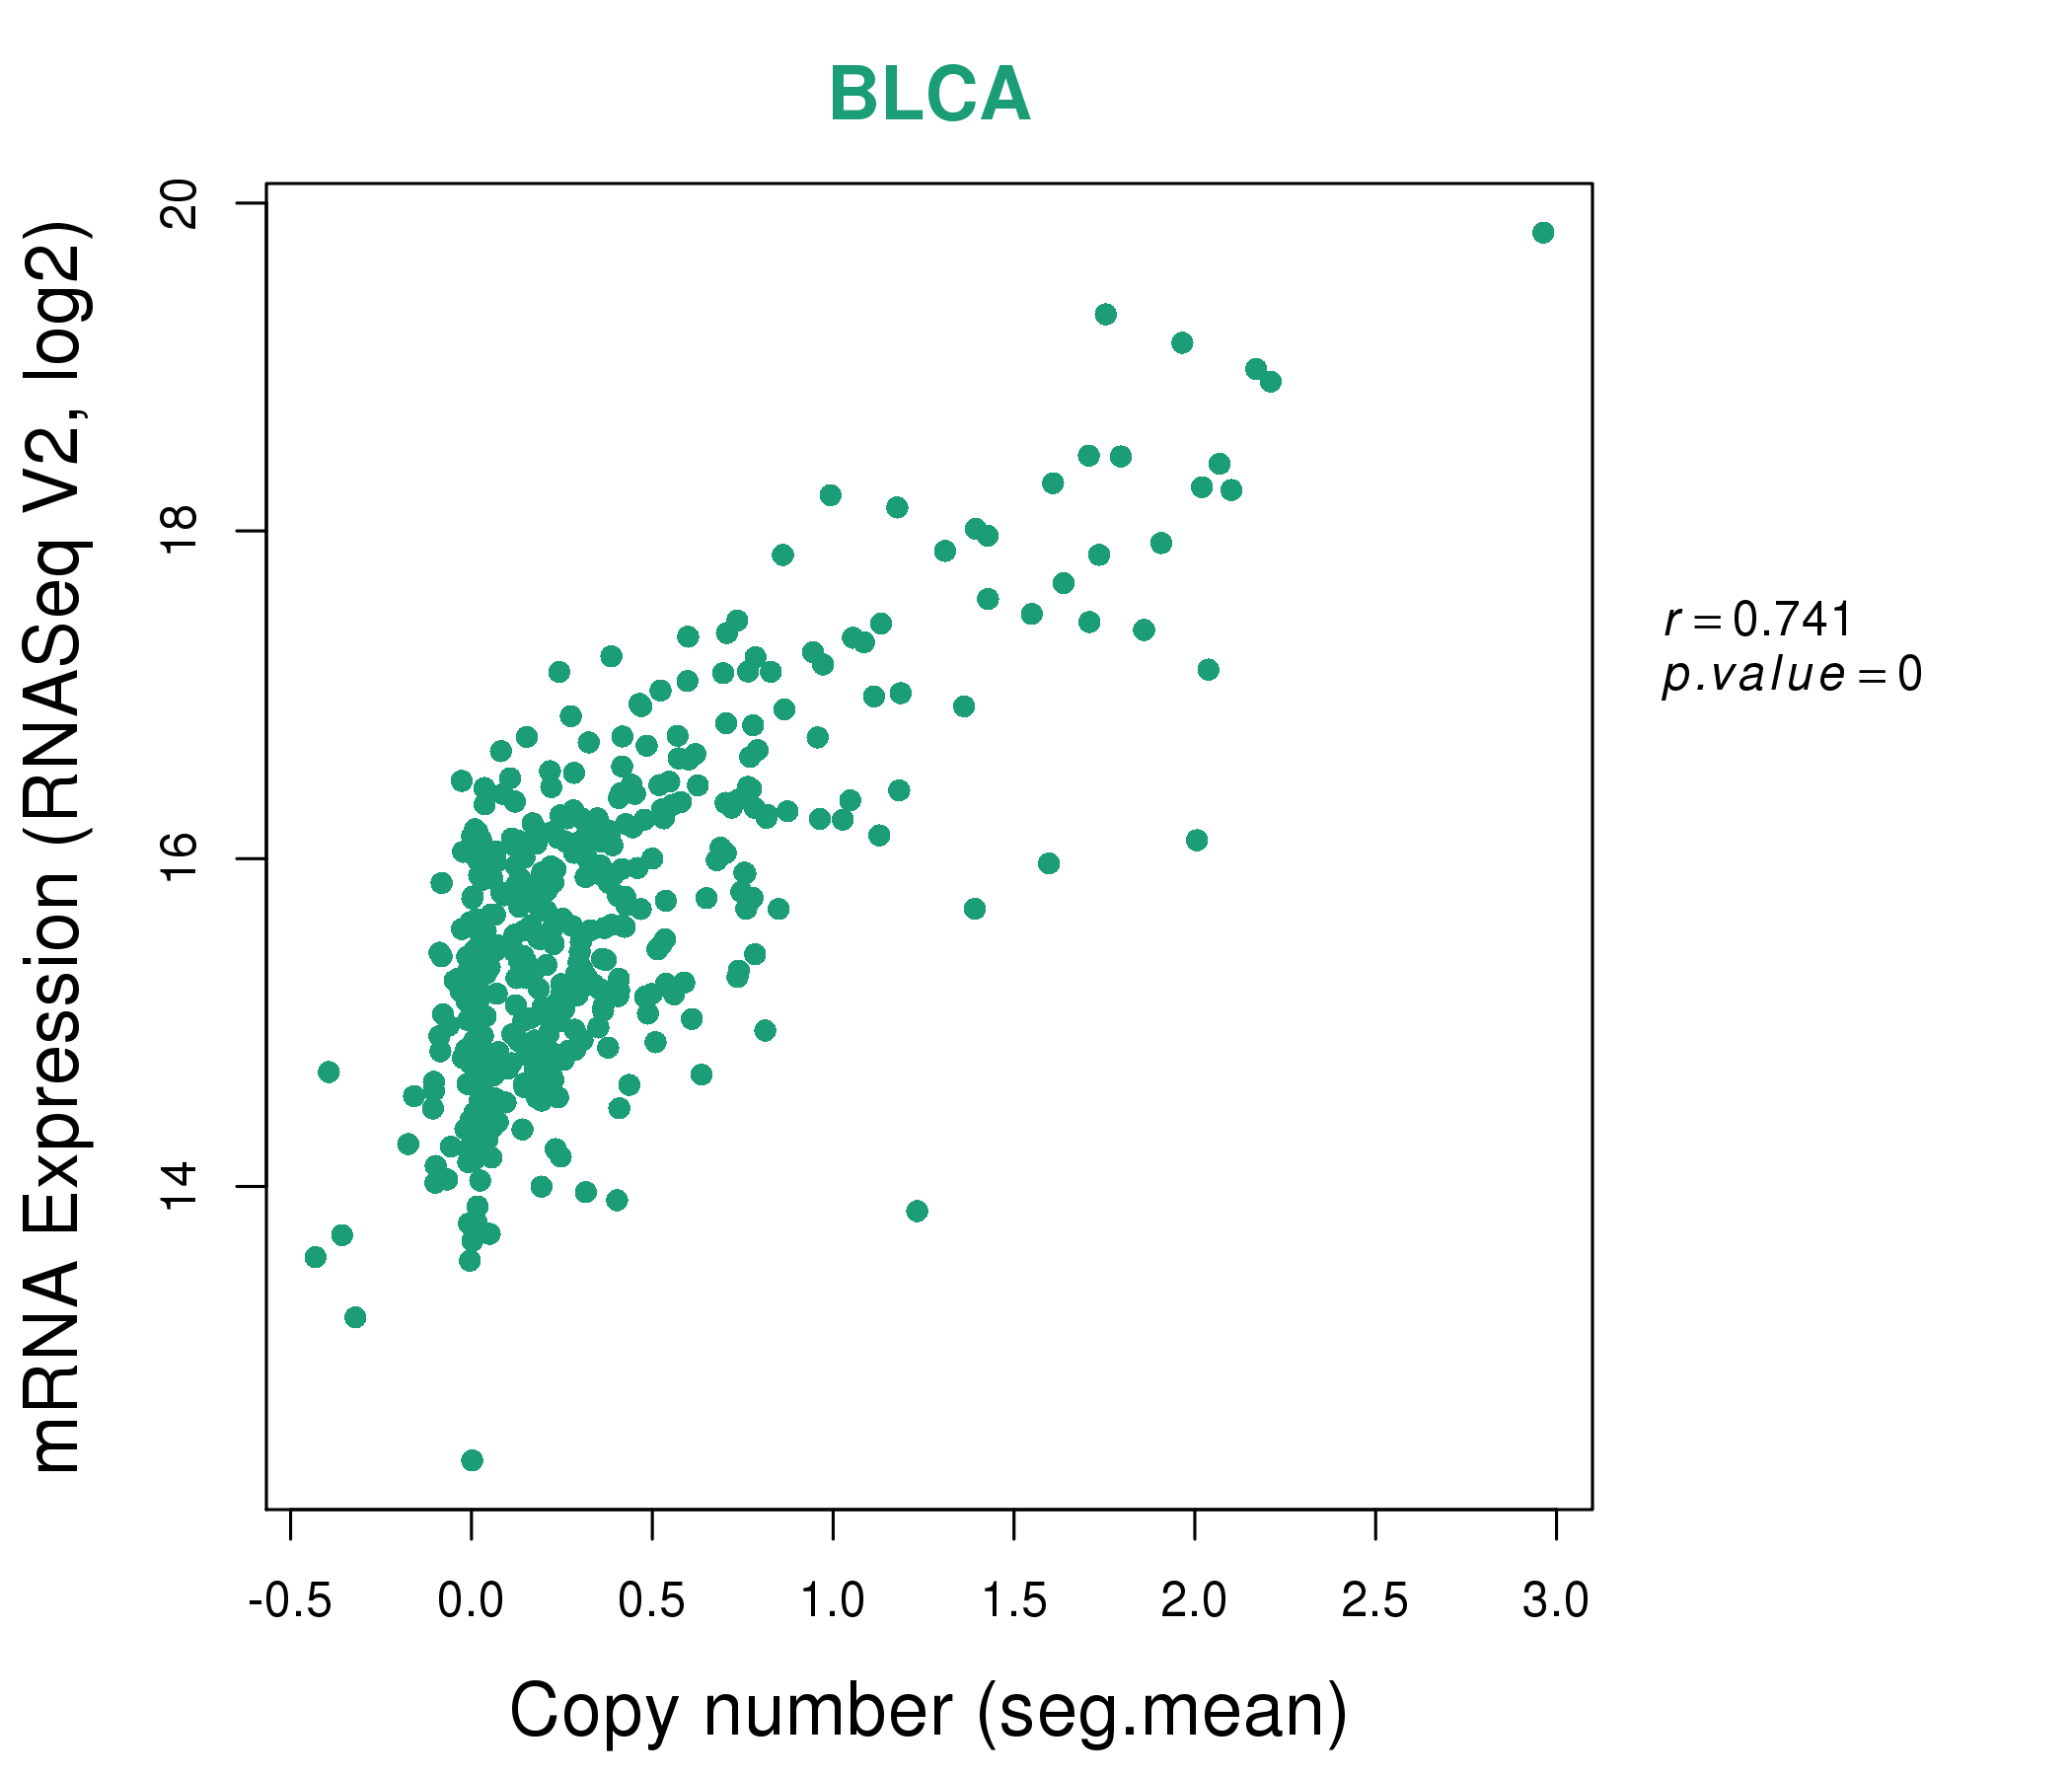
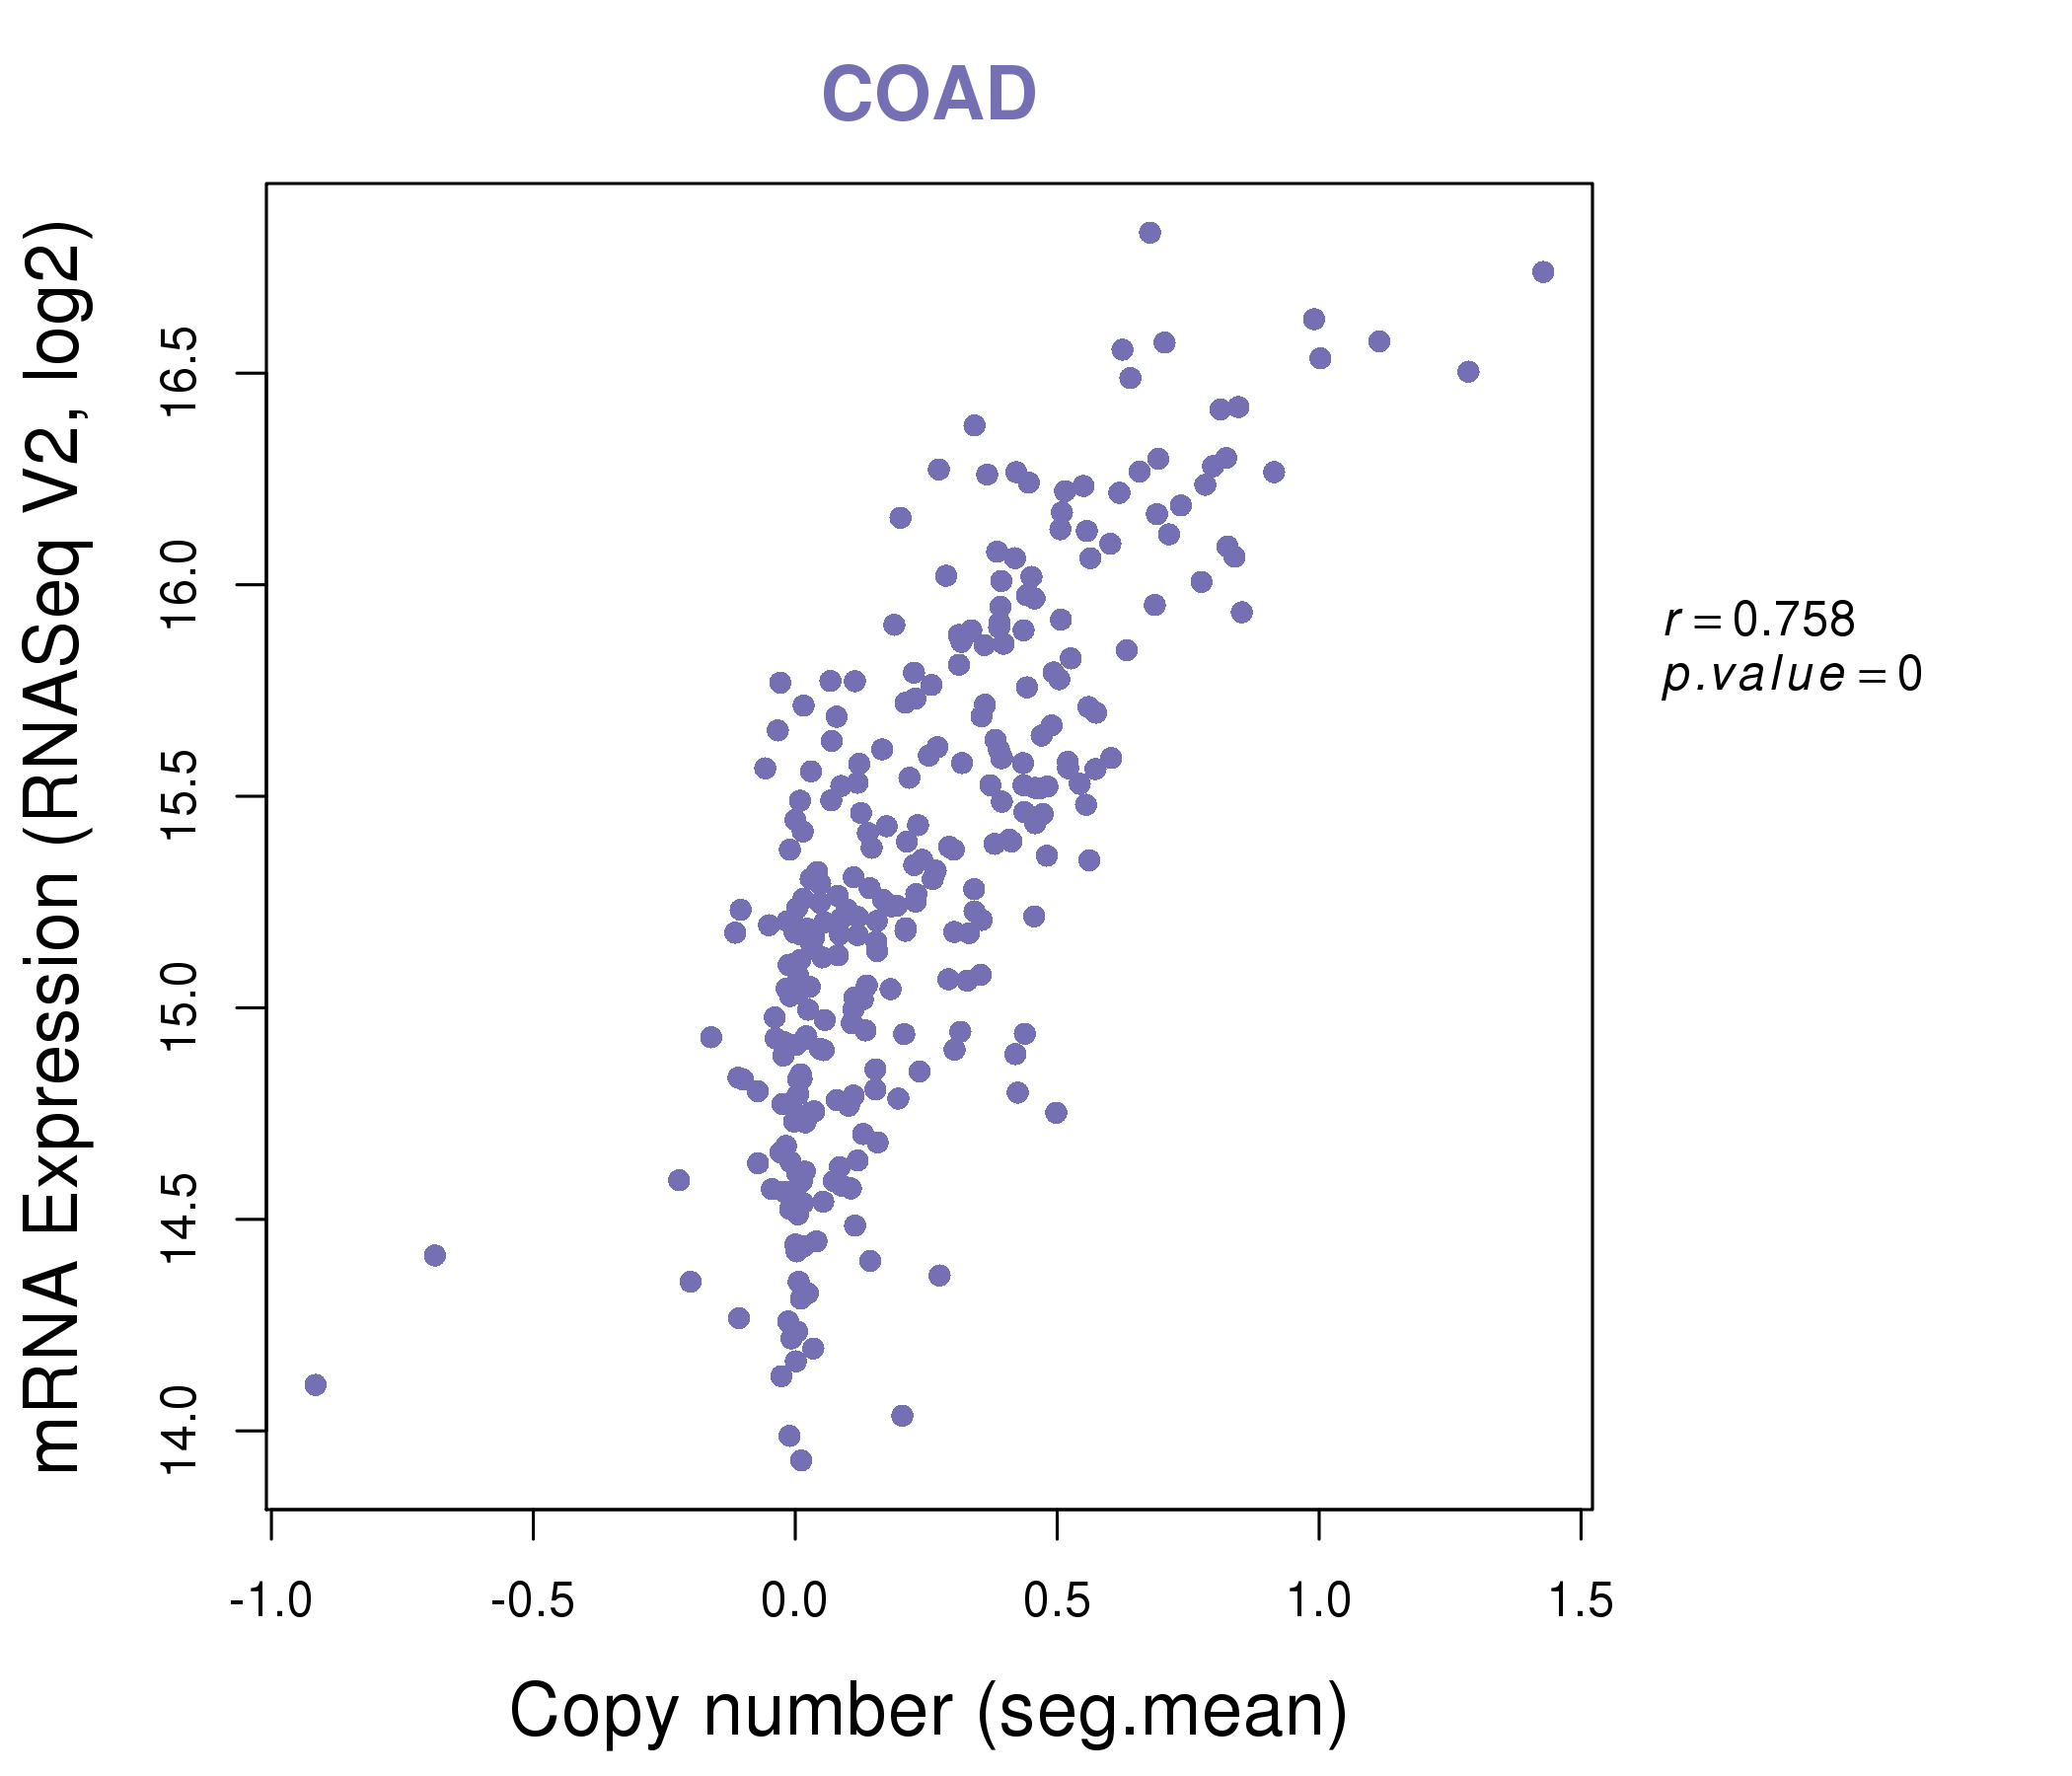
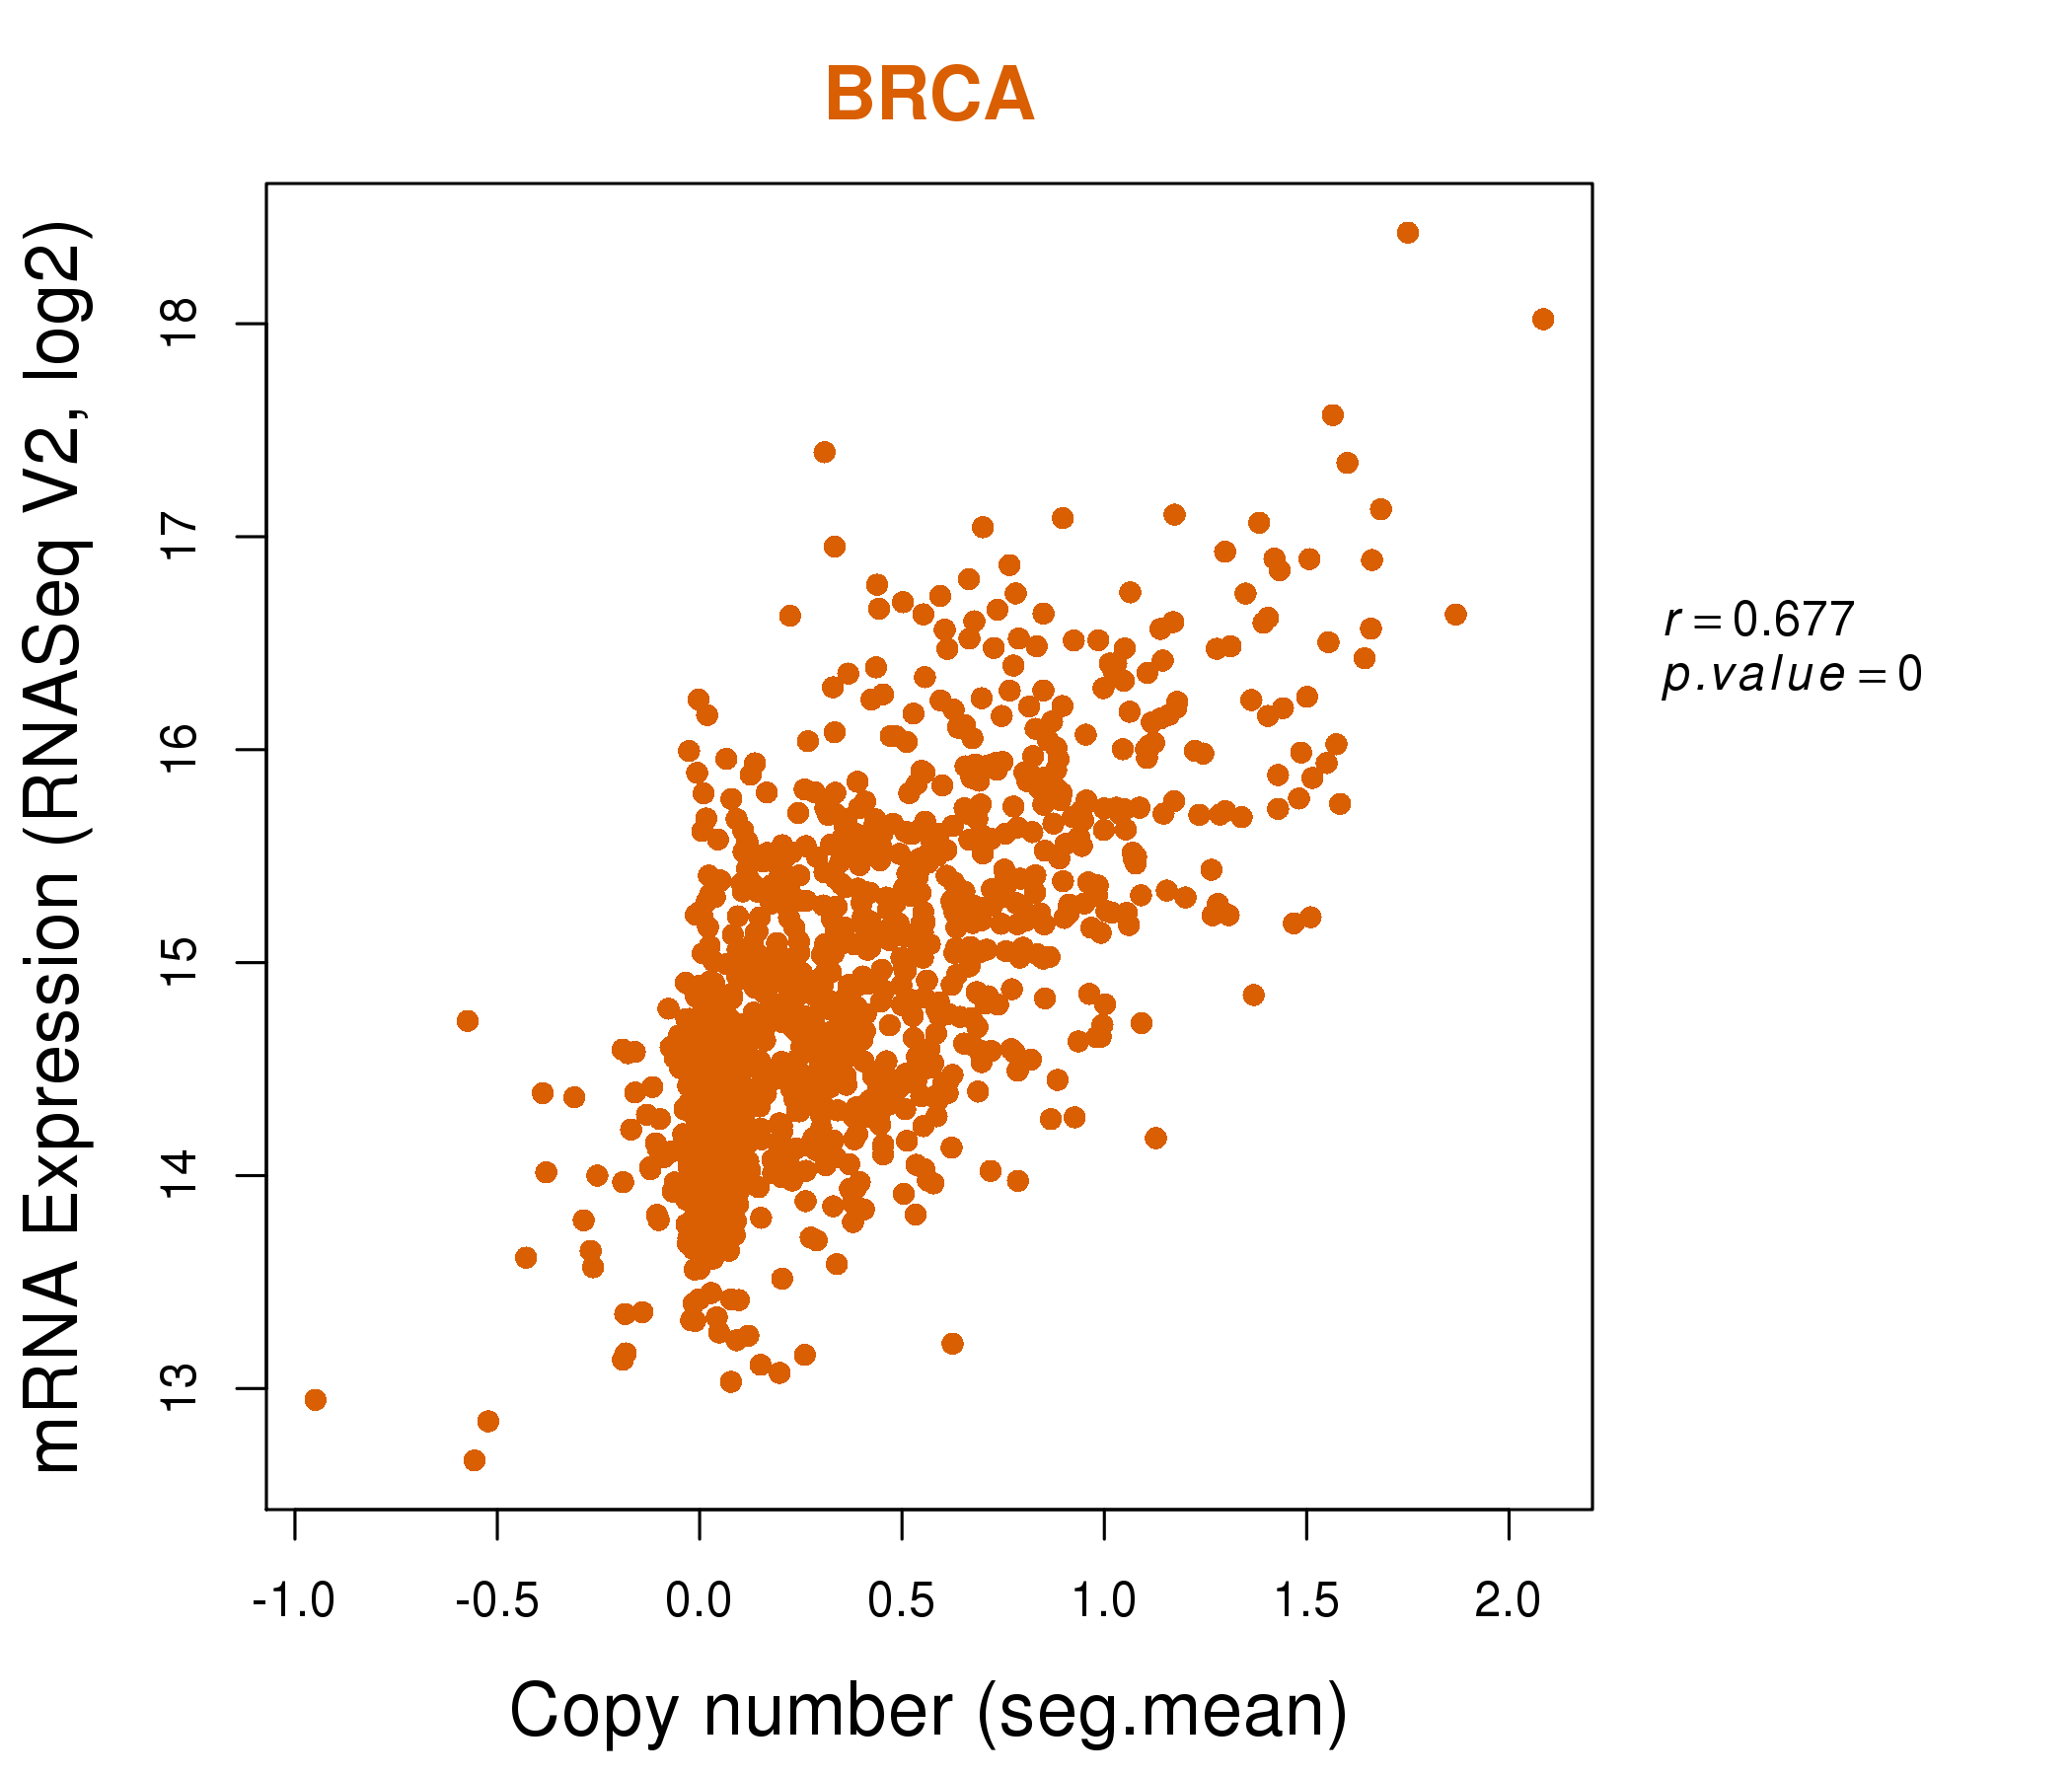
| * Copy number data were extracted from TCGA using R package TCGA-Assembler. The URLs of all public data files on TCGA DCC data server were gathered on Jan-05-2015. Function ProcessCNAData in TCGA-Assembler package was used to obtain gene-level copy number value which is calculated as the average copy number of the genomic region of a gene. |
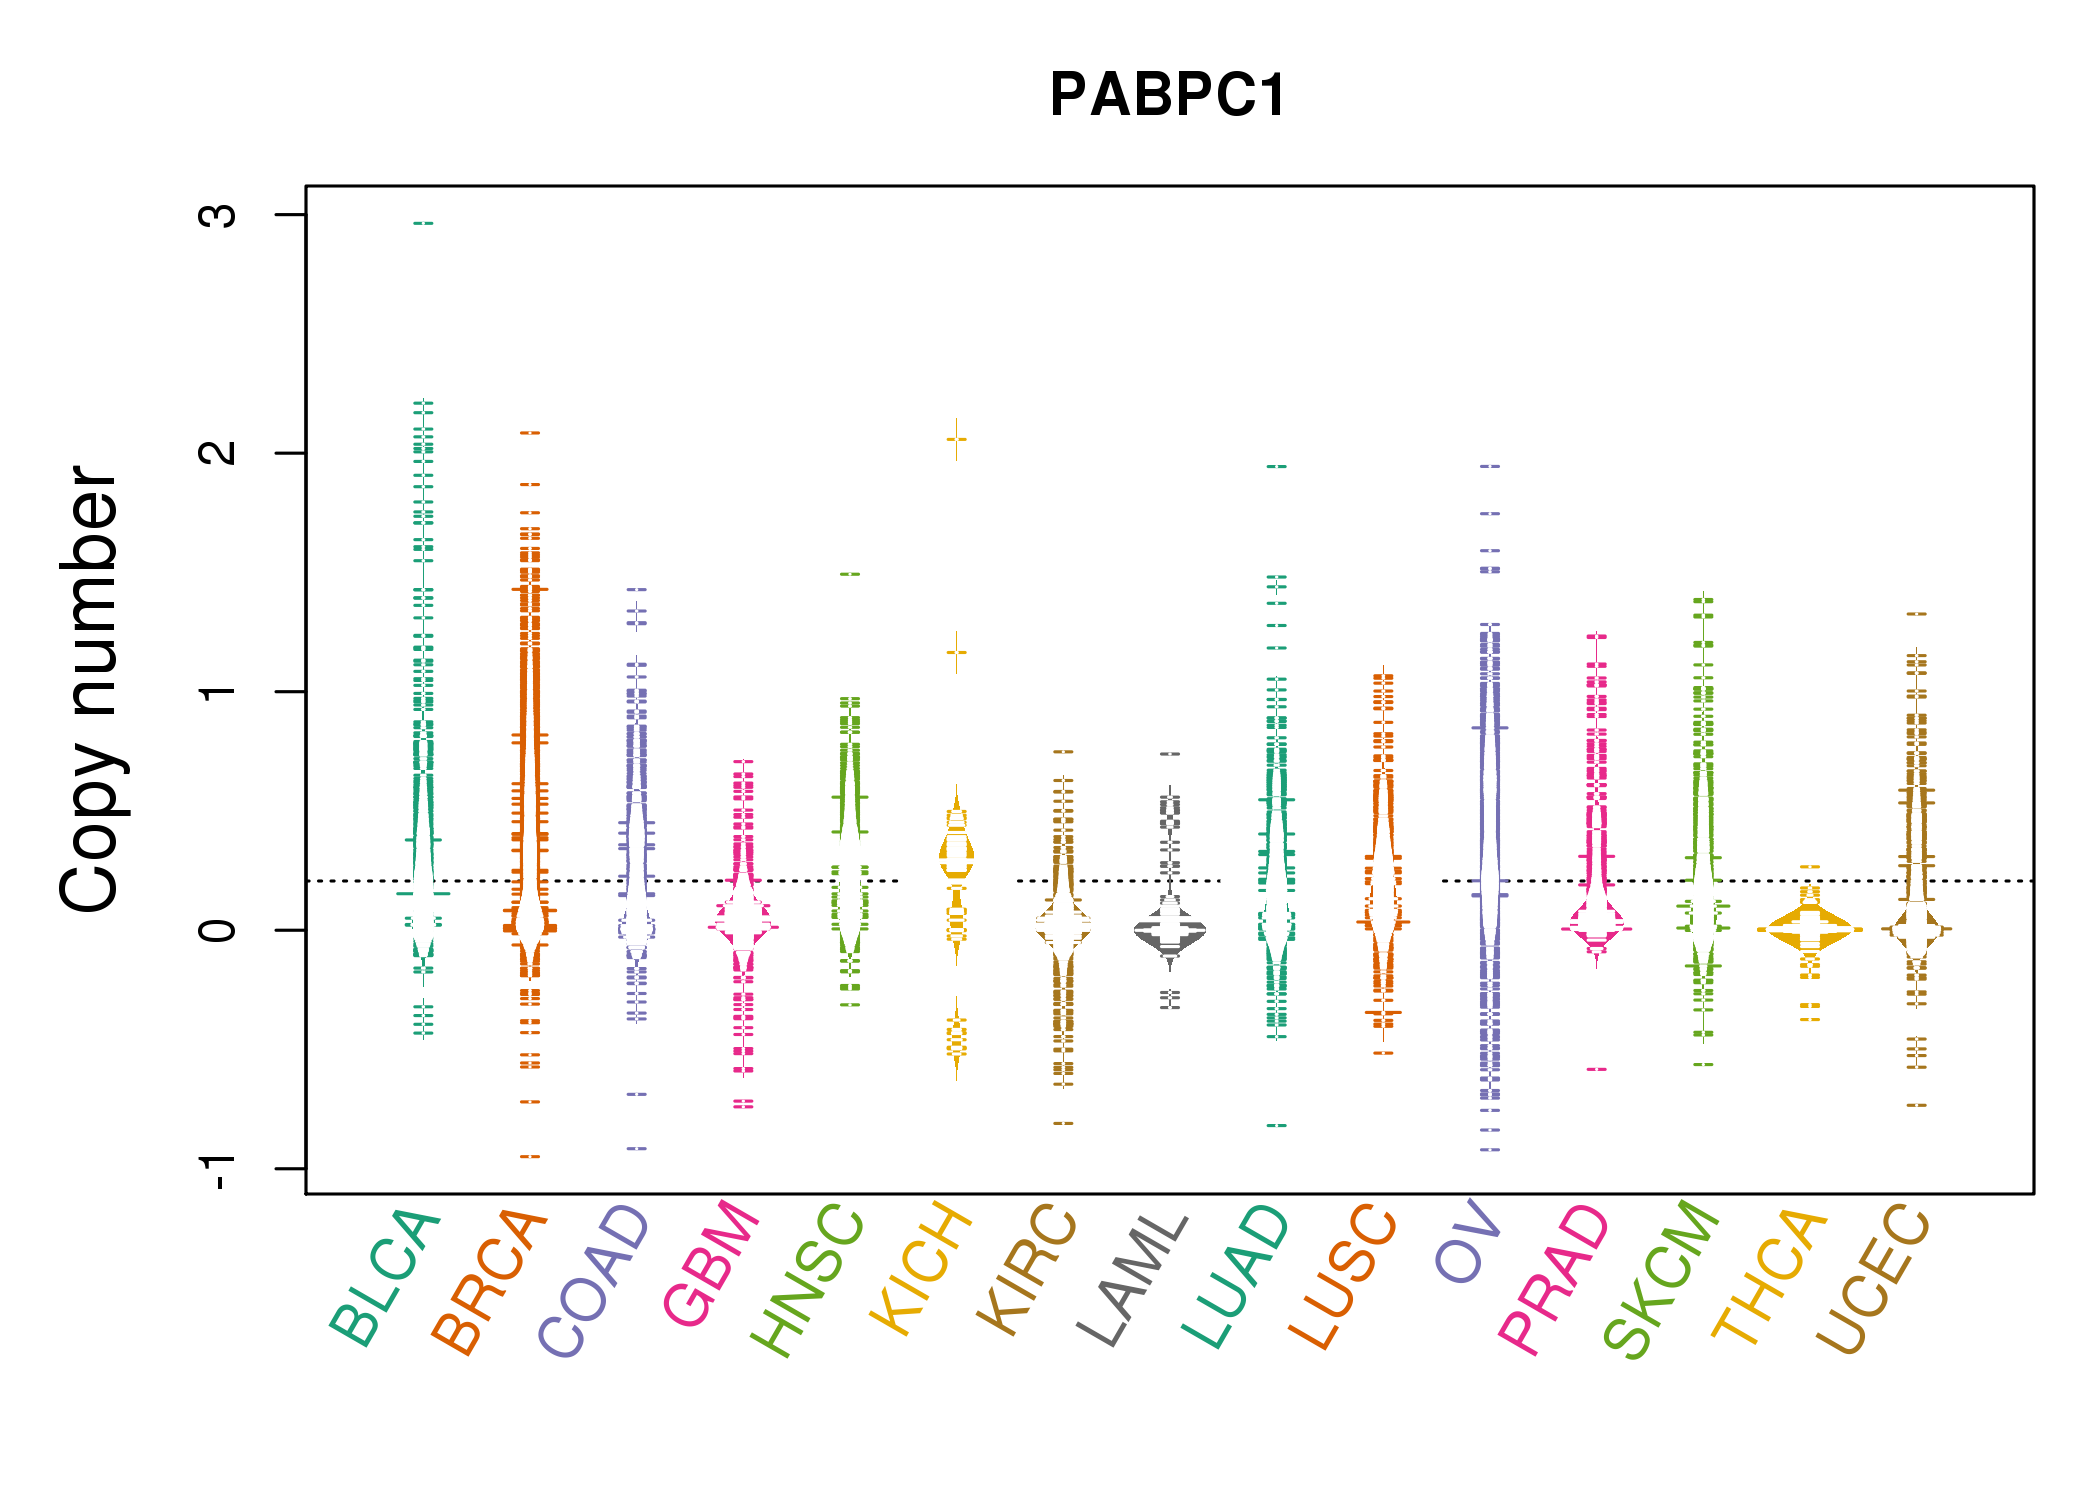 |
| cf) Tissue ID[Tissue type]: BLCA[Bladder Urothelial Carcinoma], BRCA[Breast invasive carcinoma], CESC[Cervical squamous cell carcinoma and endocervical adenocarcinoma], COAD[Colon adenocarcinoma], GBM[Glioblastoma multiforme], Glioma Low Grade, HNSC[Head and Neck squamous cell carcinoma], KICH[Kidney Chromophobe], KIRC[Kidney renal clear cell carcinoma], KIRP[Kidney renal papillary cell carcinoma], LAML[Acute Myeloid Leukemia], LUAD[Lung adenocarcinoma], LUSC[Lung squamous cell carcinoma], OV[Ovarian serous cystadenocarcinoma ], PAAD[Pancreatic adenocarcinoma], PRAD[Prostate adenocarcinoma], SKCM[Skin Cutaneous Melanoma], STAD[Stomach adenocarcinoma], THCA[Thyroid carcinoma], UCEC[Uterine Corpus Endometrial Carcinoma] |
| Top |
| Gene Expression for PABPC1 |
| * CCLE gene expression data were extracted from CCLE_Expression_Entrez_2012-10-18.res: Gene-centric RMA-normalized mRNA expression data. |
 |
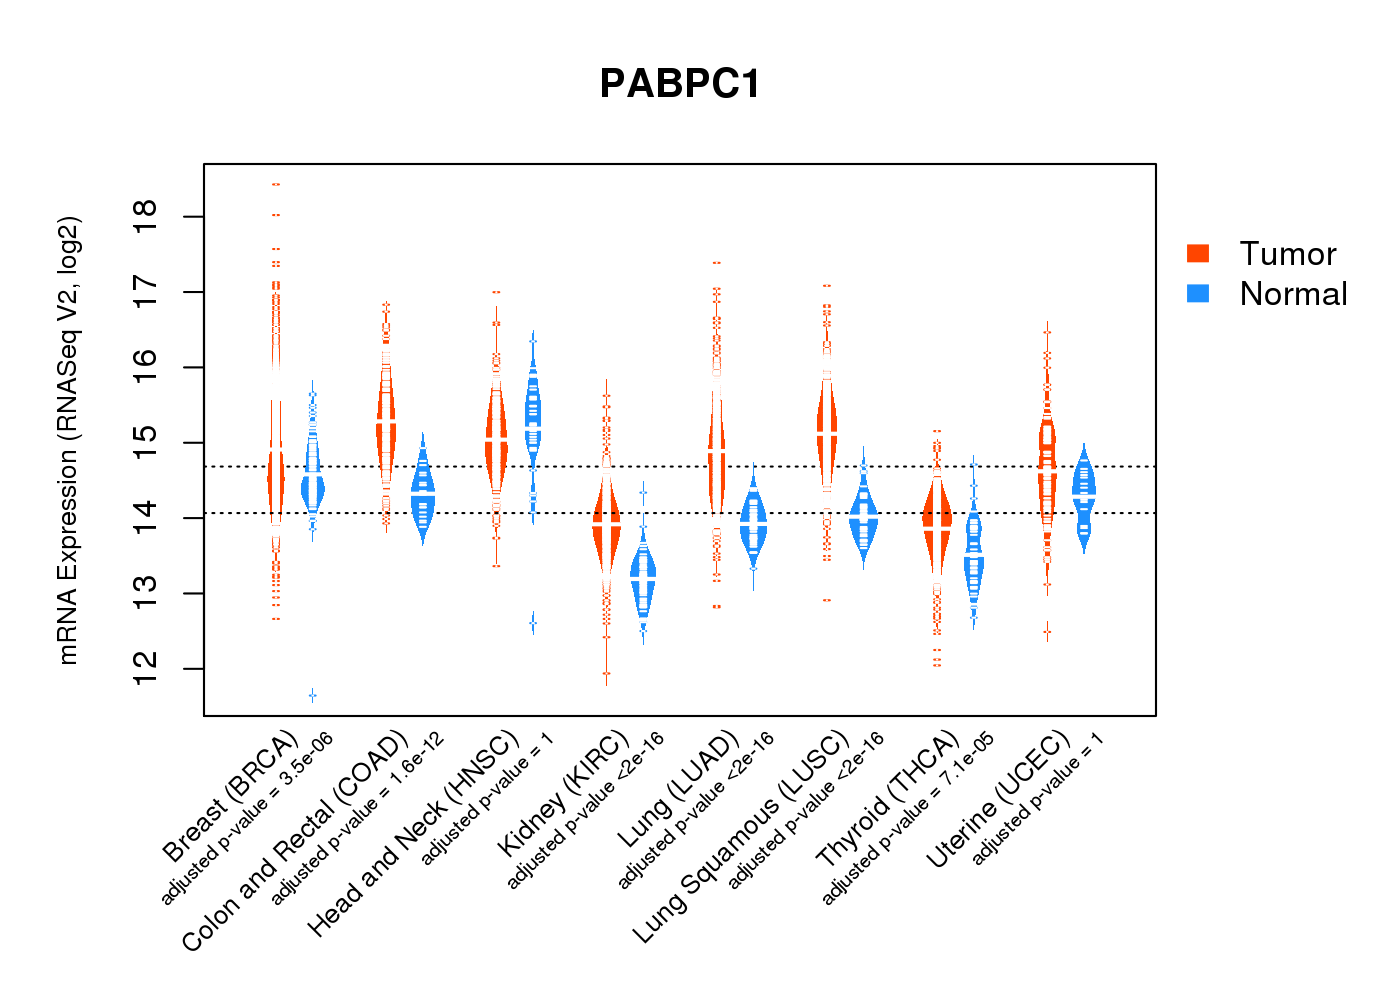
| * Normalized gene expression data of RNASeqV2 was extracted from TCGA using R package TCGA-Assembler. The URLs of all public data files on TCGA DCC data server were gathered at Jan-05-2015. Only eight cancer types have enough normal control samples for differential expression analysis. (t test, adjusted p<0.05 (using Benjamini-Hochberg FDR)) |
 |
| Top |
| * This plots show the correlation between CNV and gene expression. |
: Open all plots for all cancer types
 |
|
 |
|

| Top |
| Gene-Gene Network Information |
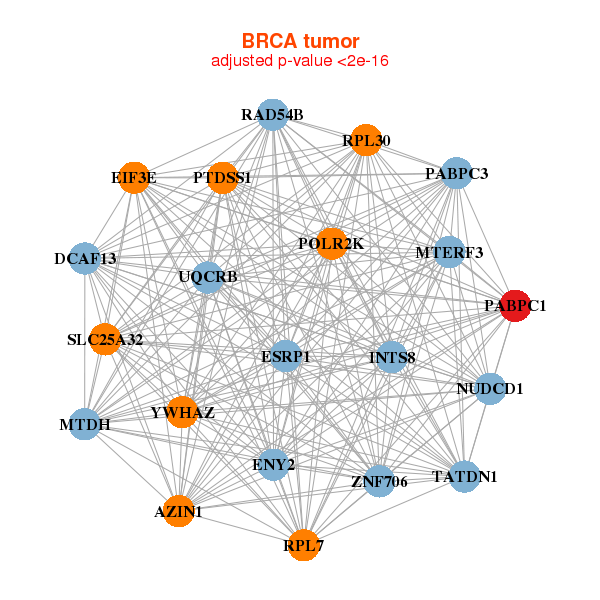
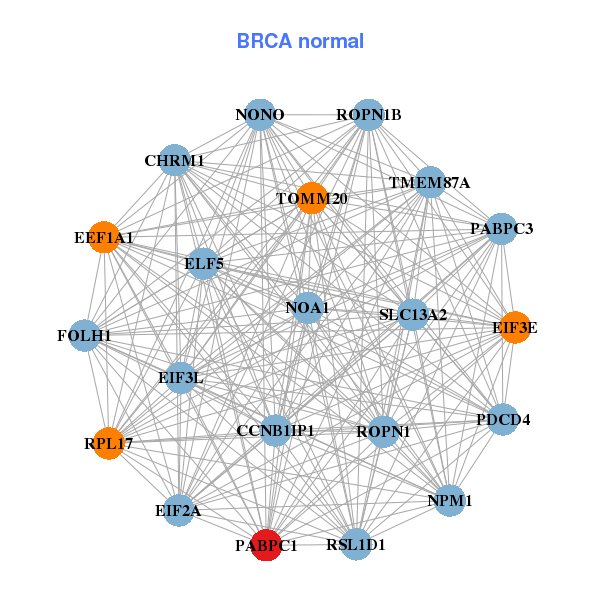
| * Co-Expression network figures were drawn using R package igraph. Only the top 20 genes with the highest correlations were shown. Red circle: input gene, orange circle: cell metabolism gene, sky circle: other gene |
: Open all plots for all cancer types
 |
| ||||
| AZIN1,DCAF13,EIF3E,ENY2,ESRP1,INTS8,MTDH, MTERF3,NUDCD1,PABPC1,PABPC3,POLR2K,PTDSS1,RAD54B, RPL30,RPL7,SLC25A32,TATDN1,UQCRB,YWHAZ,ZNF706 | NOA1,CCNB1IP1,CHRM1,EEF1A1,EIF2A,EIF3E,EIF3L, ELF5,FOLH1,NONO,NPM1,PABPC1,PABPC3,PDCD4, ROPN1,ROPN1B,RPL17,RSL1D1,SLC13A2,TMEM87A,TOMM20 | ||||
 |
| ||||
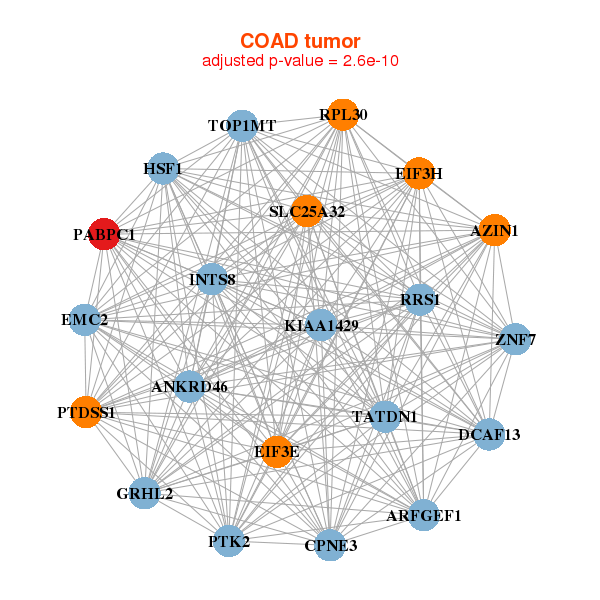
| ANKRD46,ARFGEF1,AZIN1,CPNE3,DCAF13,EIF3E,EIF3H, GRHL2,HSF1,INTS8,KIAA1429,PABPC1,PTDSS1,PTK2, RPL30,RRS1,SLC25A32,TATDN1,TOP1MT,EMC2,ZNF7 | TMEM254,NOA1,CRB2,EIF3D,FOXA1,FOXD2,KREMEN1, LGR5,LIMD1,MAZ,MTL5,PABPC1,PABPC3,PIK3R2, PTK7,QARS,REPIN1,SUMF1,TOP1MT,VGLL4,NELFA |
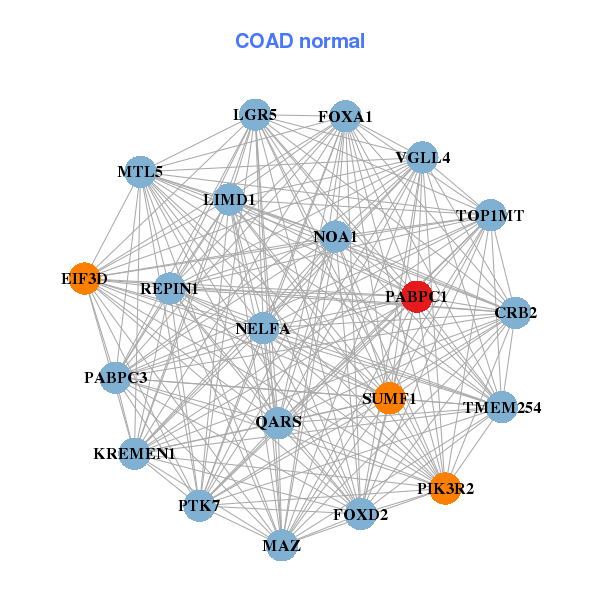
| * Co-Expression network figures were drawn using R package igraph. Only the top 20 genes with the highest correlations were shown. Red circle: input gene, orange circle: cell metabolism gene, sky circle: other gene |
: Open all plots for all cancer types
| Top |
: Open all interacting genes' information including KEGG pathway for all interacting genes from DAVID
| Top |
| Pharmacological Information for PABPC1 |
| DB Category | DB Name | DB's ID and Url link |
| Chemistry | BindingDB | P11940; -. |
| Chemistry | ChEMBL | CHEMBL1293286; -. |
| Organism-specific databases | PharmGKB | PA32880; -. |
| Organism-specific databases | CTD | 26986; -. |
| * Gene Centered Interaction Network. |
 |
| * Drug Centered Interaction Network. |
| DrugBank ID | Target Name | Drug Groups | Generic Name | Drug Centered Network | Drug Structure |
| DB00877 | poly(A) binding protein, cytoplasmic 1 | approved; investigational | Sirolimus | 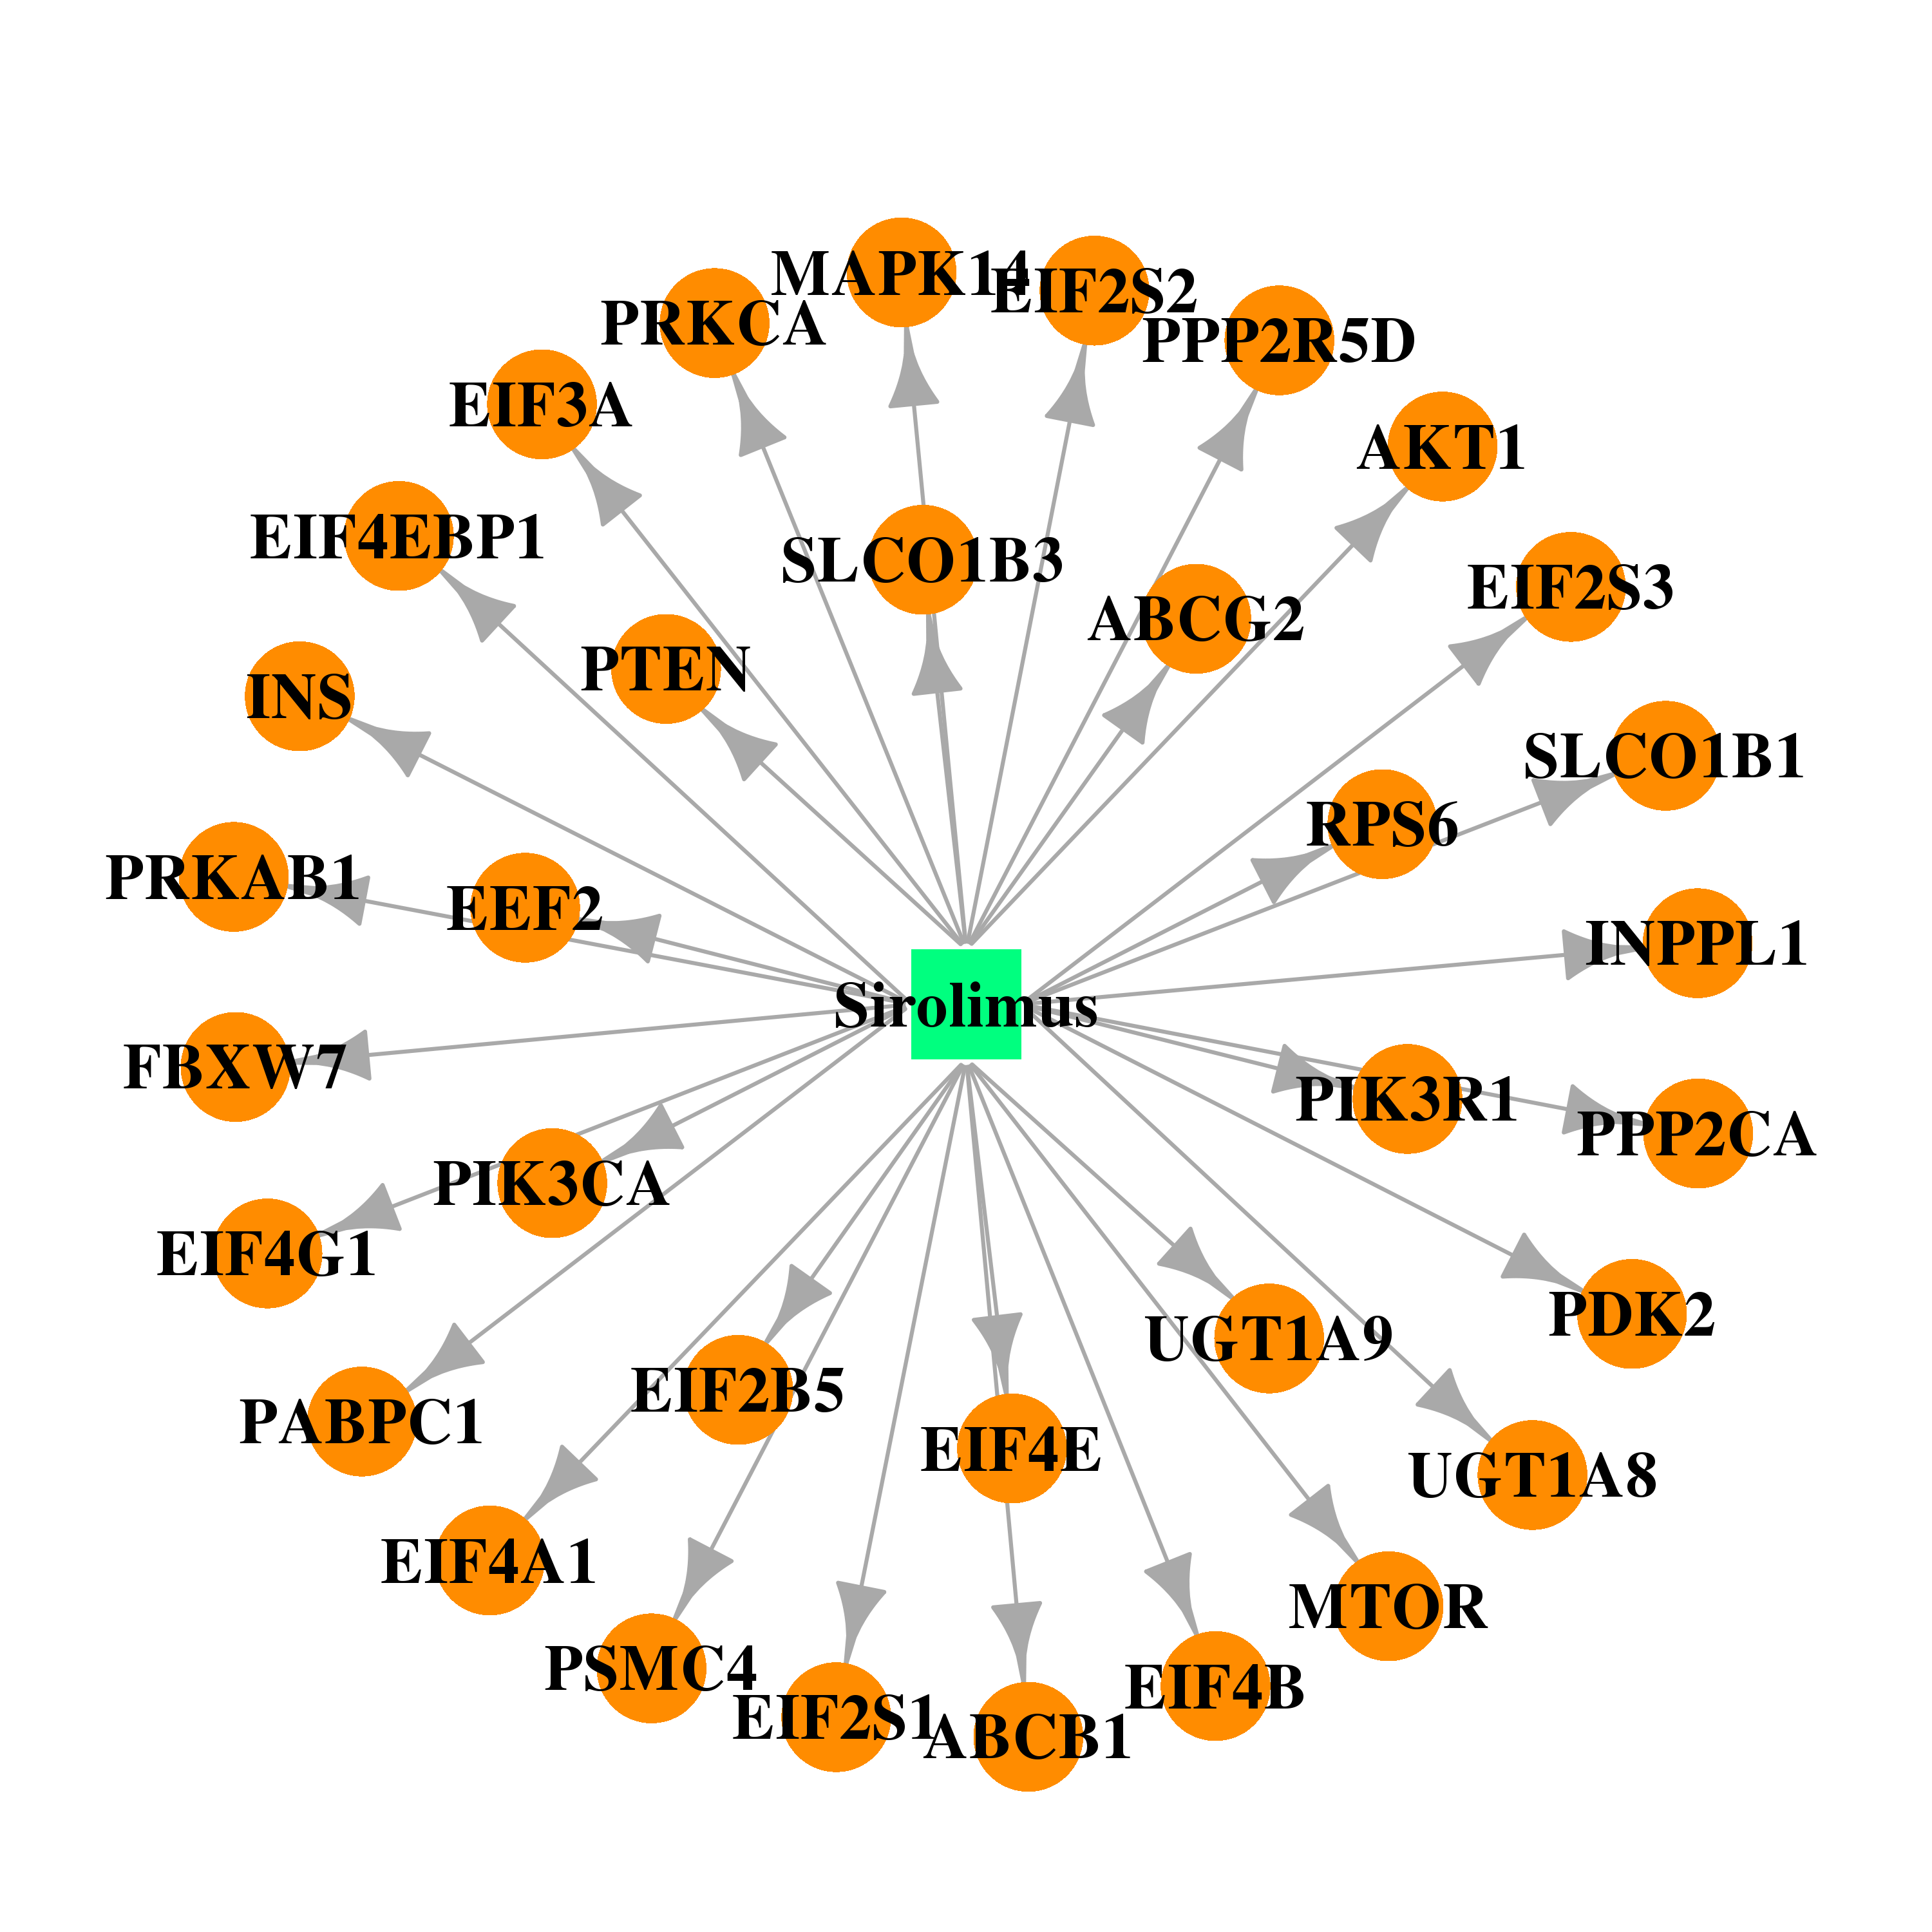 | 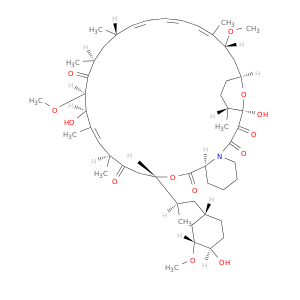 |
| Top |
| Cross referenced IDs for PABPC1 |
| * We obtained these cross-references from Uniprot database. It covers 150 different DBs, 18 categories. http://www.uniprot.org/help/cross_references_section |
: Open all cross reference information
|
Copyright © 2016-Present - The Univsersity of Texas Health Science Center at Houston @ |