|
||||||||||||||||||||
| |
| Phenotypic Information (metabolism pathway, cancer, disease, phenome) |
| |
| |
| Gene-Gene Network Information: Co-Expression Network, Interacting Genes & KEGG |
| |
|


| Gene Summary for GPC3 |
| Top |
| Phenotypic Information for GPC3(metabolism pathway, cancer, disease, phenome) |
| Cancer | CGAP: GPC3 |
| Familial Cancer Database: GPC3 | |
| * This gene is included in those cancer gene databases. |
|
|
|
|
|
| . | ||||||||||||||
Oncogene 1 | Significant driver gene in | |||||||||||||||||||
| cf) number; DB name 1 Oncogene; http://nar.oxfordjournals.org/content/35/suppl_1/D721.long, 2 Tumor Suppressor gene; https://bioinfo.uth.edu/TSGene/, 3 Cancer Gene Census; http://www.nature.com/nrc/journal/v4/n3/abs/nrc1299.html, 4 CancerGenes; http://nar.oxfordjournals.org/content/35/suppl_1/D721.long, 5 Network of Cancer Gene; http://ncg.kcl.ac.uk/index.php, 1Therapeutic Vulnerabilities in Cancer; http://cbio.mskcc.org/cancergenomics/statius/ |
| REACTOME_METABOLISM_OF_CARBOHYDRATES | |
| OMIM | 300037; gene. 312870; phenotype. |
| Orphanet | 373; Simpson-Golabi-Behmel syndrome. |
| Disease | KEGG Disease: GPC3 |
| MedGen: GPC3 (Human Medical Genetics with Condition) | |
| ClinVar: GPC3 | |
| Phenotype | MGI: GPC3 (International Mouse Phenotyping Consortium) |
| PhenomicDB: GPC3 | |
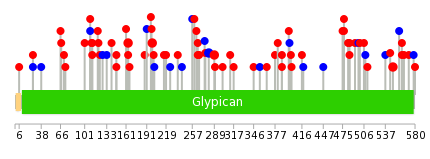
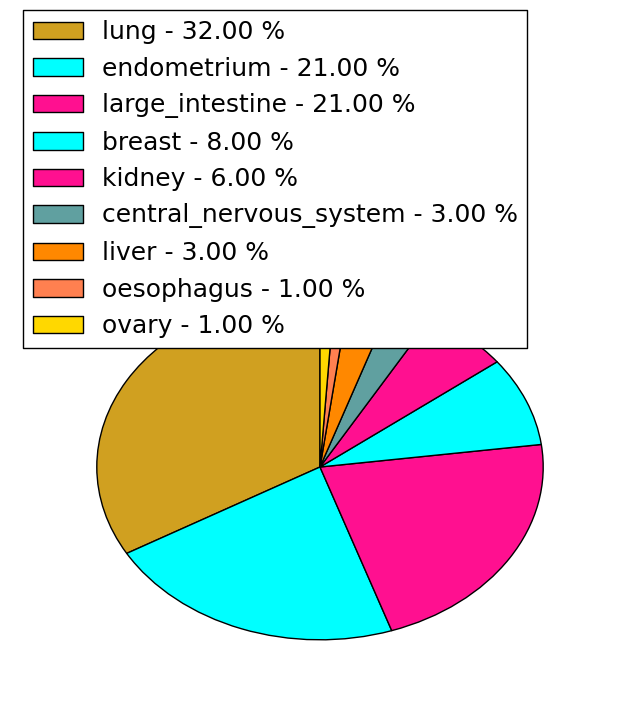
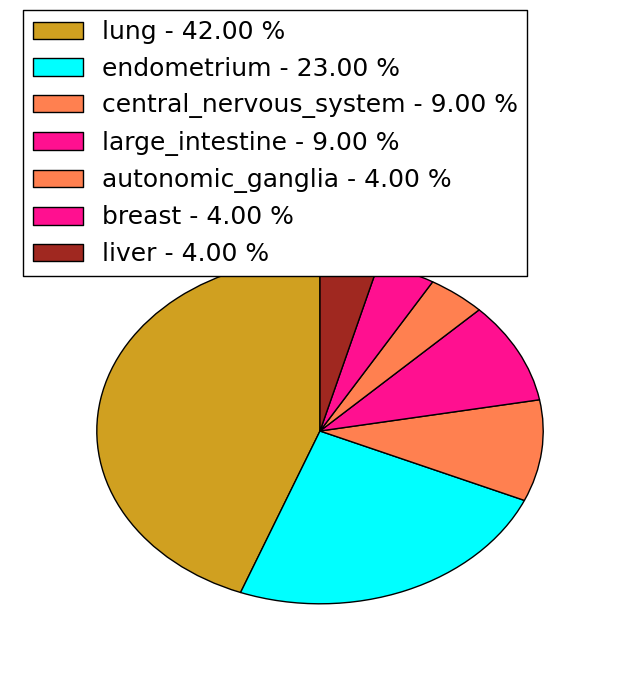
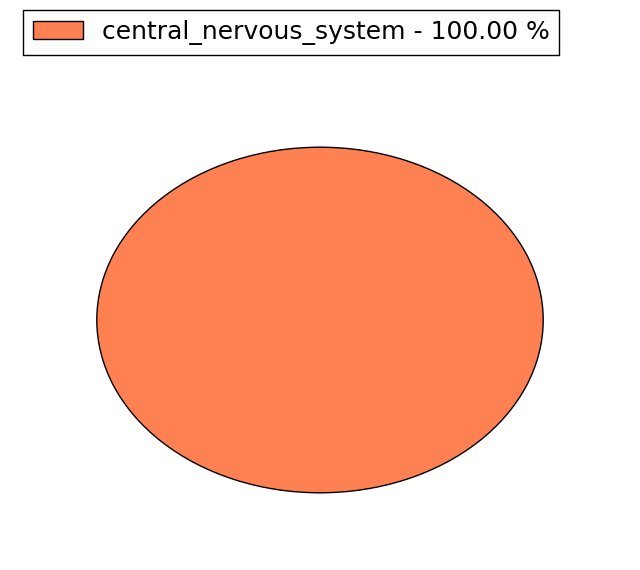
| Mutations for GPC3 |
| * Under tables are showing count per each tissue to give us broad intuition about tissue specific mutation patterns.You can go to the detailed page for each mutation database's web site. |
| There's no structural variation information in COSMIC data for this gene. |
| * From mRNA Sanger sequences, Chitars2.0 arranged chimeric transcripts. This table shows GPC3 related fusion information. |
| ID | Head Gene | Tail Gene | Accession | Gene_a | qStart_a | qEnd_a | Chromosome_a | tStart_a | tEnd_a | Gene_a | qStart_a | qEnd_a | Chromosome_a | tStart_a | tEnd_a |
| BI905820 | LRPPRC | 1 | 205 | 2 | 44209547 | 44223116 | GPC3 | 204 | 390 | X | 132669773 | 132669958 | |
| R64084 | TNKS | 1 | 317 | 8 | 9636790 | 9637105 | GPC3 | 308 | 369 | X | 132669781 | 132669842 | |
| AI468457 | GPC3 | 4 | 202 | X | 132669773 | 132669971 | PDGFRA | 196 | 348 | 4 | 55163307 | 55163459 | |
| BG153241 | CD74 | 56 | 121 | 5 | 149781425 | 149781490 | GPC3 | 116 | 135 | X | 132846201 | 132846220 | |
| BC036707 | TTL | 1 | 328 | 2 | 113260721 | 113289983 | GPC3 | 317 | 344 | X | 132690723 | 132690986 | |
| Top |
| There's no copy number variation information in COSMIC data for this gene. |
| Top |
|
 |
| Top |
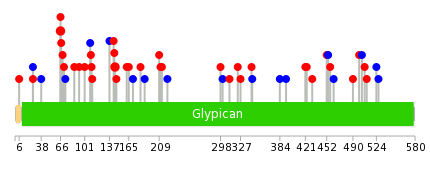
| Stat. for Non-Synonymous SNVs (# total SNVs=61) | (# total SNVs=21) |
 |  |
(# total SNVs=1) | (# total SNVs=0) |
 |
| Top |
| * When you move the cursor on each content, you can see more deailed mutation information on the Tooltip. Those are primary_site,primary_histology,mutation(aa),pubmedID. |
| GRCh37 position | Mutation(aa) | Unique sampleID count |
| chr23:132670253-132670253 | p.E548K | 2 |
| chr23:132887945-132887945 | p.R199Q | 2 |
| chr23:132730611-132730611 | p.S477F | 2 |
| chr23:132887946-132887946 | p.R199* | 2 |
| chr23:132887676-132887676 | p.V289L | 2 |
| chr23:132887698-132887698 | p.V281V | 2 |
| chr23:133119341-133119341 | p.Q46* | 2 |
| chr23:132888051-132888051 | p.D164H | 2 |
| chr23:132887753-132887753 | p.S263F | 1 |
| chr23:133087081-133087081 | p.F111L | 1 |
| Top |
|
 |
| Point Mutation/ Tissue ID | 1 | 2 | 3 | 4 | 5 | 6 | 7 | 8 | 9 | 10 | 11 | 12 | 13 | 14 | 15 | 16 | 17 | 18 | 19 | 20 |
| # sample | 1 | 1 | 10 | 1 | 2 | 2 | 8 | 4 | 1 | 9 | 1 | 10 | ||||||||
| # mutation | 1 | 1 | 10 | 1 | 2 | 2 | 8 | 4 | 1 | 9 | 1 | 14 | ||||||||
| nonsynonymous SNV | 1 | 1 | 9 | 1 | 2 | 4 | 3 | 1 | 7 | 1 | 9 | |||||||||
| synonymous SNV | 1 | 2 | 4 | 1 | 2 | 5 |
| cf) Tissue ID; Tissue type (1; BLCA[Bladder Urothelial Carcinoma], 2; BRCA[Breast invasive carcinoma], 3; CESC[Cervical squamous cell carcinoma and endocervical adenocarcinoma], 4; COAD[Colon adenocarcinoma], 5; GBM[Glioblastoma multiforme], 6; Glioma Low Grade, 7; HNSC[Head and Neck squamous cell carcinoma], 8; KICH[Kidney Chromophobe], 9; KIRC[Kidney renal clear cell carcinoma], 10; KIRP[Kidney renal papillary cell carcinoma], 11; LAML[Acute Myeloid Leukemia], 12; LUAD[Lung adenocarcinoma], 13; LUSC[Lung squamous cell carcinoma], 14; OV[Ovarian serous cystadenocarcinoma ], 15; PAAD[Pancreatic adenocarcinoma], 16; PRAD[Prostate adenocarcinoma], 17; SKCM[Skin Cutaneous Melanoma], 18:STAD[Stomach adenocarcinoma], 19:THCA[Thyroid carcinoma], 20:UCEC[Uterine Corpus Endometrial Carcinoma]) |
| Top |
| * We represented just top 10 SNVs. When you move the cursor on each content, you can see more deailed mutation information on the Tooltip. Those are primary_site, primary_histology, mutation(aa), pubmedID. |
| Genomic Position | Mutation(aa) | Unique sampleID count |
| chrX:132888183 | p.R145Q,GPC3 | 2 |
| chrX:132887945 | p.R66C,GPC3 | 2 |
| chrX:133119363 | p.T188T,GPC3 | 1 |
| chrX:132833946 | p.Q112P,GPC3 | 1 |
| chrX:132887866 | p.D431N,GPC3 | 1 |
| chrX:132888160 | p.G182E,GPC3 | 1 |
| chrX:132730510 | p.F111L,GPC3 | 1 |
| chrX:133119399 | p.S423Y,GPC3 | 1 |
| chrX:132833959 | p.V171V,GPC3 | 1 |
| chrX:132887885 | p.A109A,GPC3 | 1 |
| * Copy number data were extracted from TCGA using R package TCGA-Assembler. The URLs of all public data files on TCGA DCC data server were gathered on Jan-05-2015. Function ProcessCNAData in TCGA-Assembler package was used to obtain gene-level copy number value which is calculated as the average copy number of the genomic region of a gene. |
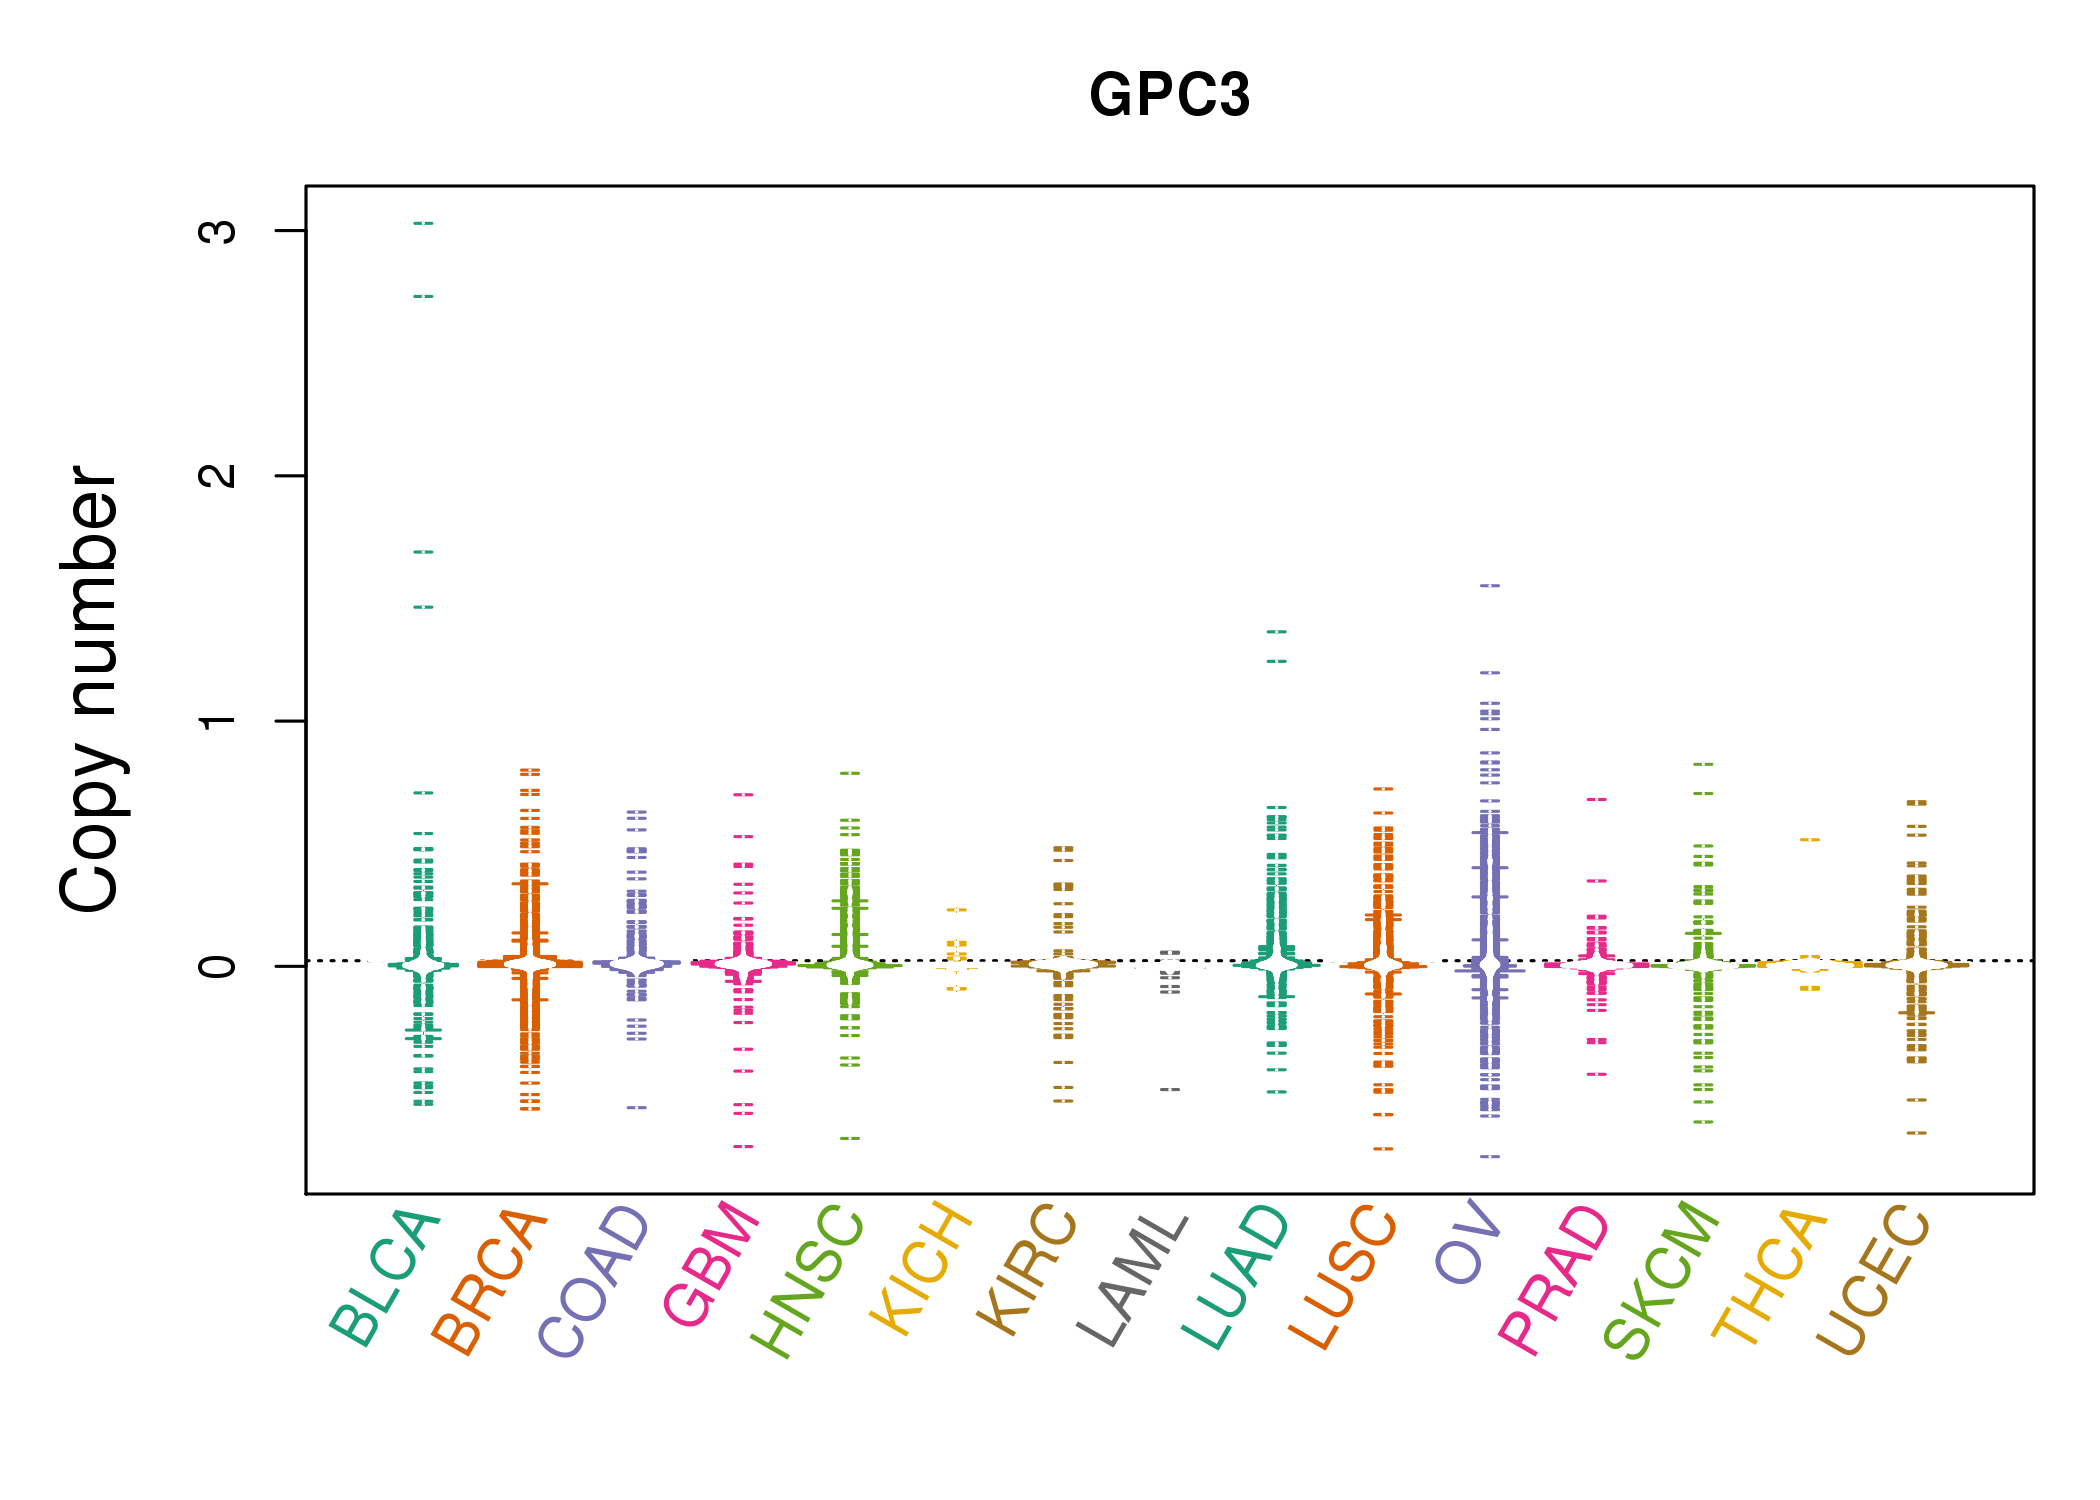 |
| cf) Tissue ID[Tissue type]: BLCA[Bladder Urothelial Carcinoma], BRCA[Breast invasive carcinoma], CESC[Cervical squamous cell carcinoma and endocervical adenocarcinoma], COAD[Colon adenocarcinoma], GBM[Glioblastoma multiforme], Glioma Low Grade, HNSC[Head and Neck squamous cell carcinoma], KICH[Kidney Chromophobe], KIRC[Kidney renal clear cell carcinoma], KIRP[Kidney renal papillary cell carcinoma], LAML[Acute Myeloid Leukemia], LUAD[Lung adenocarcinoma], LUSC[Lung squamous cell carcinoma], OV[Ovarian serous cystadenocarcinoma ], PAAD[Pancreatic adenocarcinoma], PRAD[Prostate adenocarcinoma], SKCM[Skin Cutaneous Melanoma], STAD[Stomach adenocarcinoma], THCA[Thyroid carcinoma], UCEC[Uterine Corpus Endometrial Carcinoma] |
| Top |
| Gene Expression for GPC3 |
| * CCLE gene expression data were extracted from CCLE_Expression_Entrez_2012-10-18.res: Gene-centric RMA-normalized mRNA expression data. |
 |
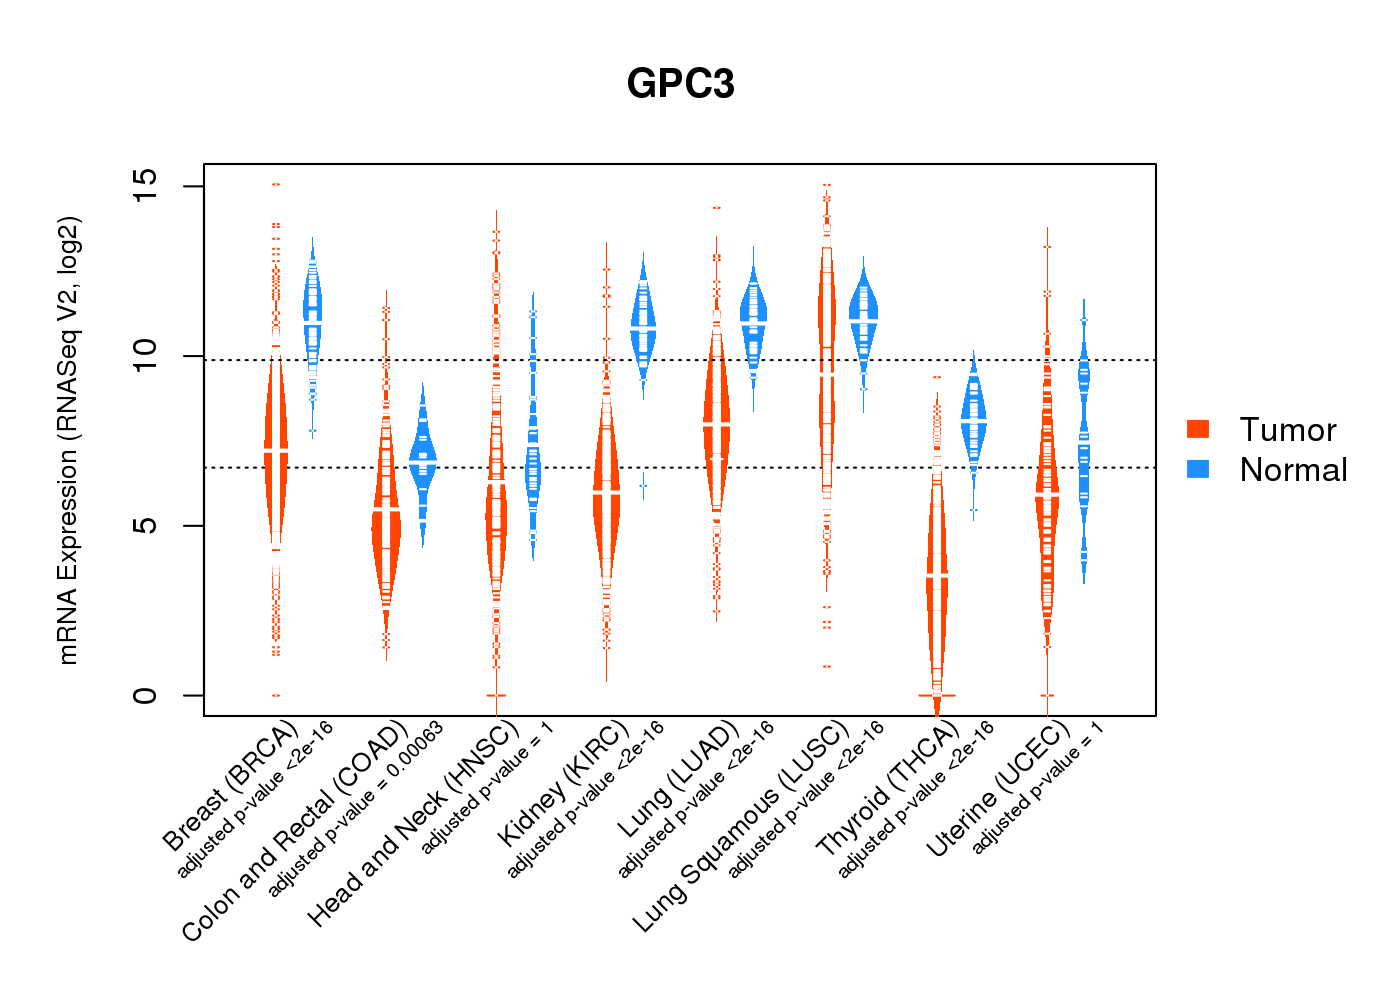
| * Normalized gene expression data of RNASeqV2 was extracted from TCGA using R package TCGA-Assembler. The URLs of all public data files on TCGA DCC data server were gathered at Jan-05-2015. Only eight cancer types have enough normal control samples for differential expression analysis. (t test, adjusted p<0.05 (using Benjamini-Hochberg FDR)) |
 |
| Top |
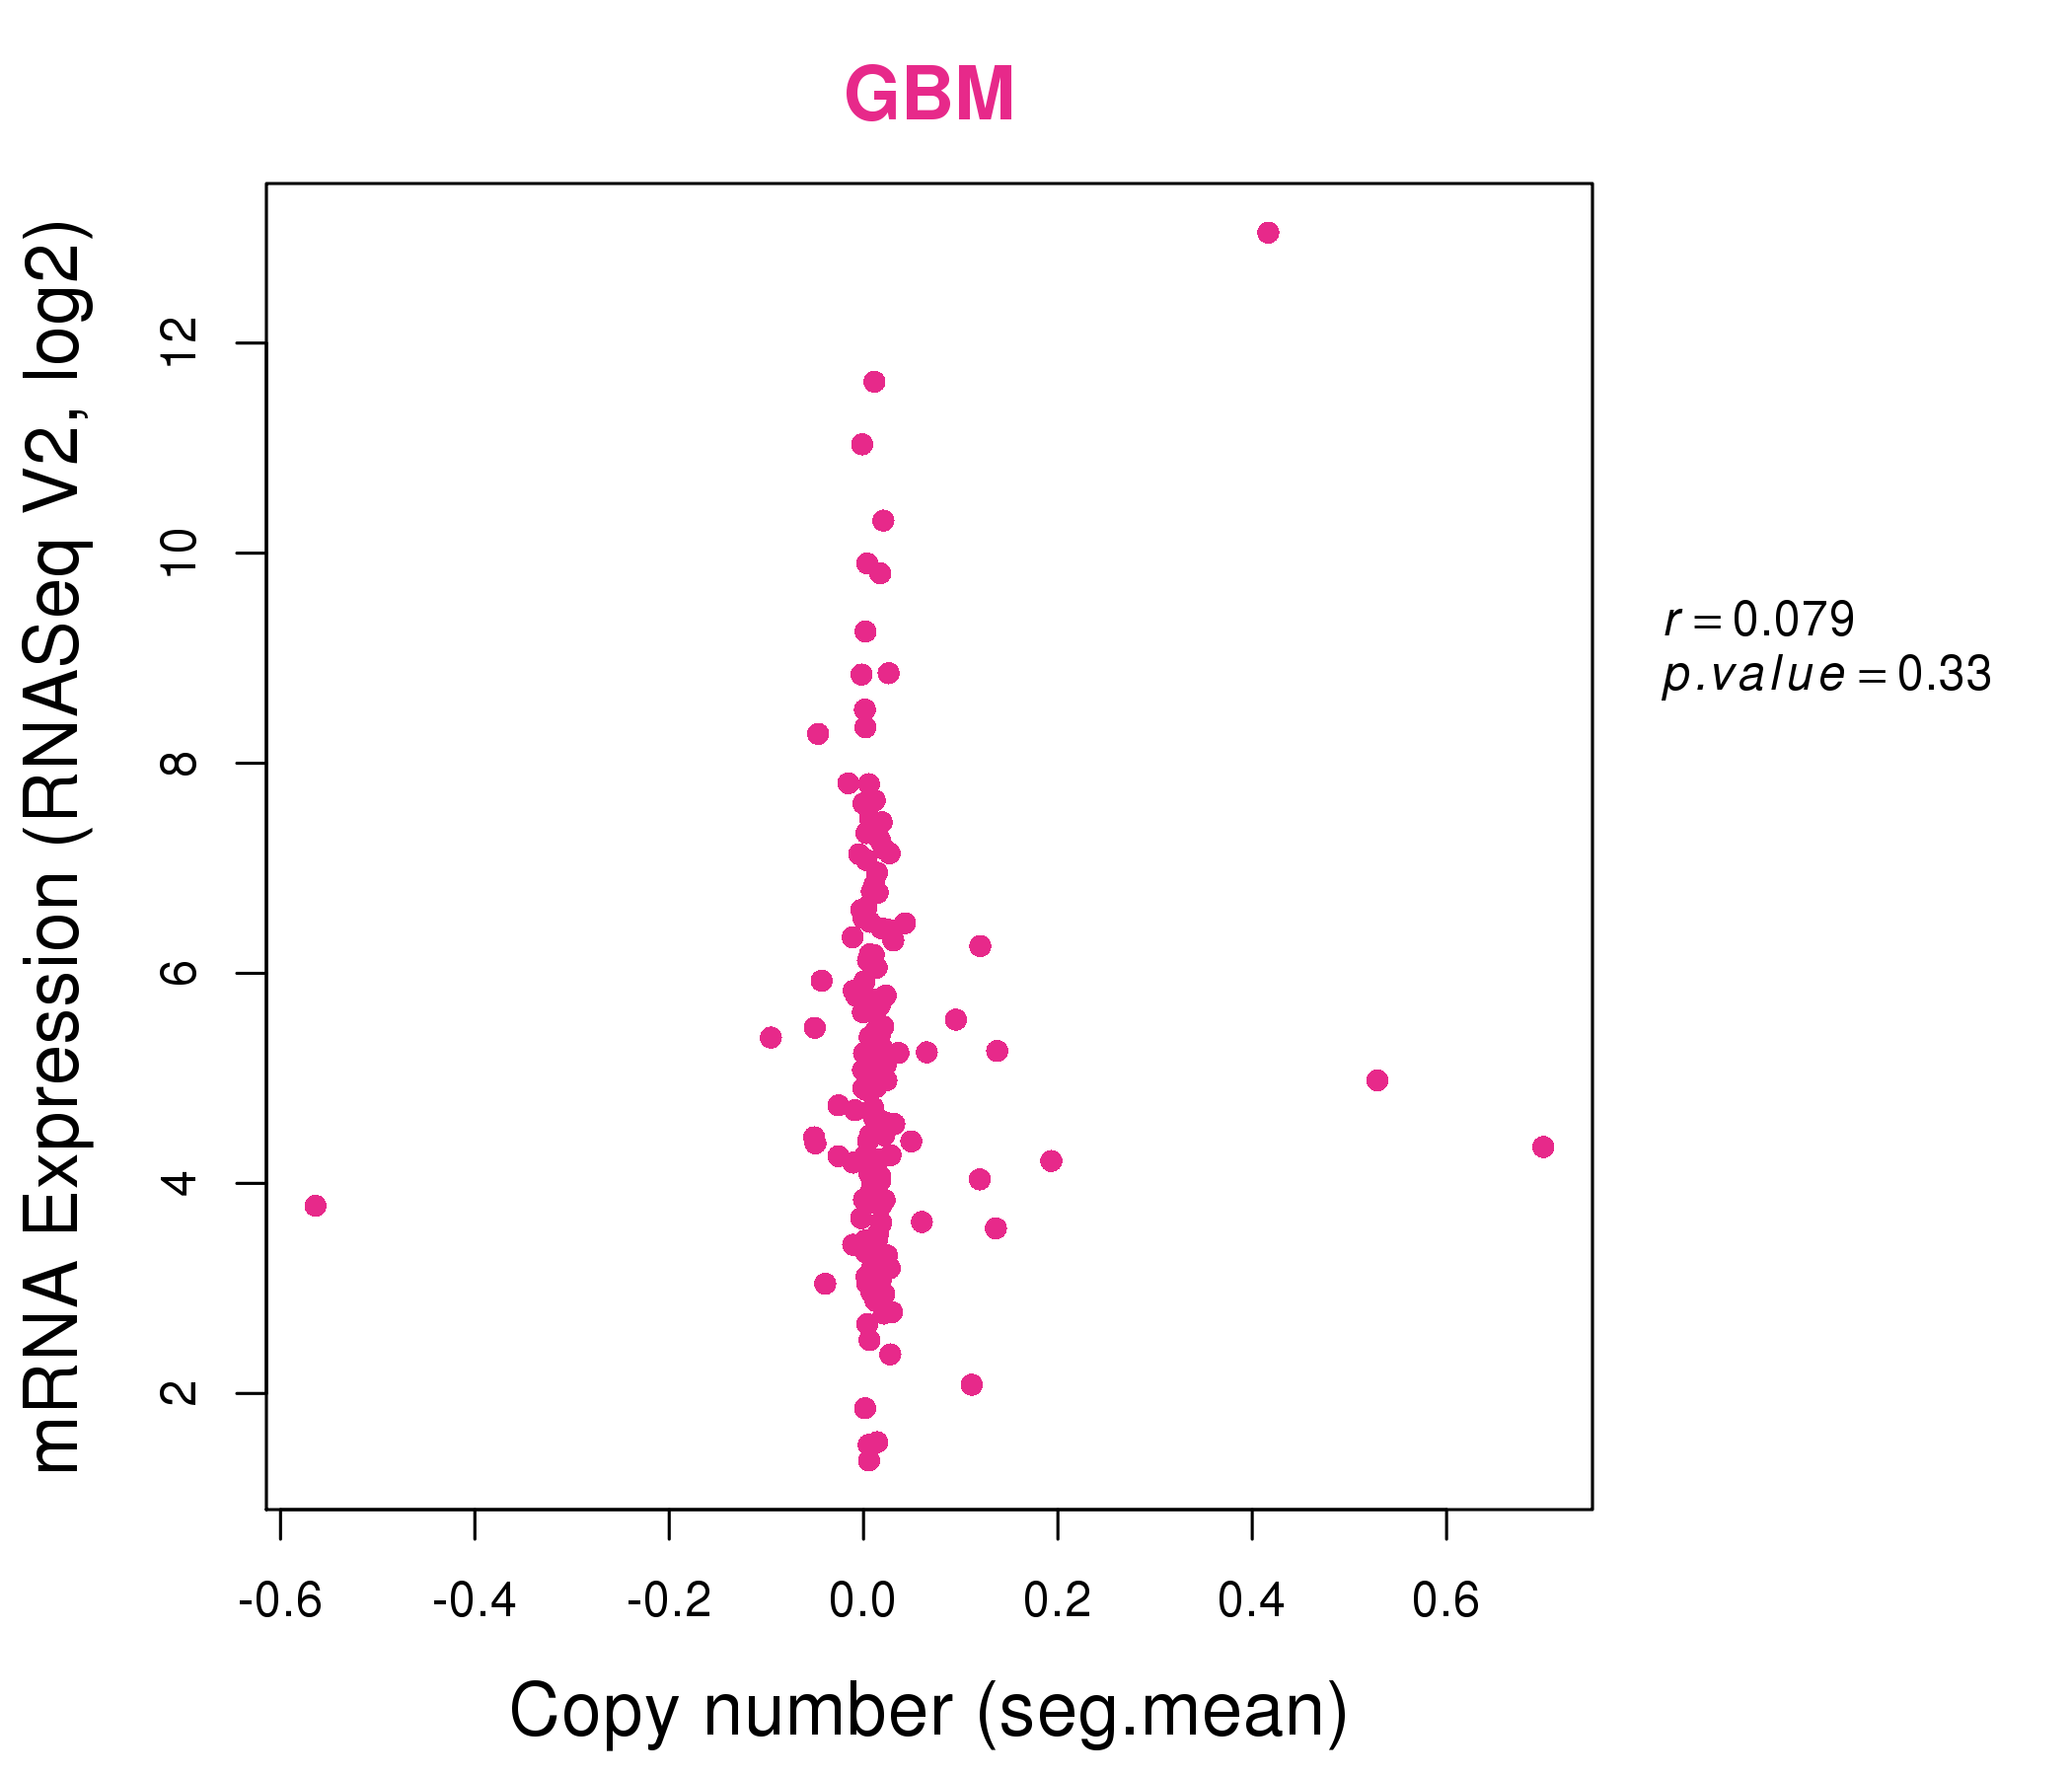
| * This plots show the correlation between CNV and gene expression. |
: Open all plots for all cancer types
 |
|
 |
|

| Top |
| Gene-Gene Network Information |
| * Co-Expression network figures were drawn using R package igraph. Only the top 20 genes with the highest correlations were shown. Red circle: input gene, orange circle: cell metabolism gene, sky circle: other gene |
: Open all plots for all cancer types
 |
|
| AFP,C9orf135,CEACAM16,CHRNA6,CNTN4,CRH,CXorf30, CHDC2,DLX1,DLX2,ENOX1,GHRH,GPC3,HS6ST2, C7orf62,OPTC,PART1,PLA2G2C,PRSS21,RASSF6,TAF1L | AIDA,ANGPTL2,CELF2,CNRIP1,CRTAP,EBF3,FBLN5, GPC3,HOXC8,HSD17B11,LAMC1,MXRA7,NEGR1,NPR2, PCOLCE2,PID1,PMP22,RNASE4,TIMP3,SLC35G2,VIM |
 |
|
| ANKRD53,BSX,CADM3,CFC1B,EBF3,GABRG2,GFRA2, GPC3,GRIA1,KCNS2,KIAA1045,MC4R,NR2E1,OR7E5P, PM20D1,PYDC2,RSPO1,SLC17A7,TAC3,TNXB,TSHR | ANKRD1,ACTRT3,LINC00323,C2orf69,PXDC1,C8orf22,COLEC11, DRD5,FAM35A,FAM35DP,FAM35BP,FGF5,FMO3,GPC3, HAR1B,ITGB8,LOC645166,LOC654342,POPDC3,SLC14A2,TNFRSF12A |


| * Co-Expression network figures were drawn using R package igraph. Only the top 20 genes with the highest correlations were shown. Red circle: input gene, orange circle: cell metabolism gene, sky circle: other gene |
: Open all plots for all cancer types
| Top |
: Open all interacting genes' information including KEGG pathway for all interacting genes from DAVID
| Top |
| Pharmacological Information for GPC3 |
| There's no related Drug. |
| Top |
| Cross referenced IDs for GPC3 |
| * We obtained these cross-references from Uniprot database. It covers 150 different DBs, 18 categories. http://www.uniprot.org/help/cross_references_section |
: Open all cross reference information
|
Copyright © 2016-Present - The Univsersity of Texas Health Science Center at Houston @ |