|
||||||||||||||||||||||||||||||||||||||||||||||||||||||||||||||||||||||||||||||||||||||||||||||||||||||||||||||||||||||||||||||||||||||||||||||||||||||||||||||||||||||||||||||||||||||||||||||||||||||||||||||||||||||||||||||||||||||||||||||||||||||||||||||||||||||||||||||||||||||||||||||||||||||||||||||||||||||||||
| |
| Phenotypic Information (metabolism pathway, cancer, disease, phenome) |
| |
| |
| Gene-Gene Network Information: Co-Expression Network, Interacting Genes & KEGG |
| |
|


| Gene Summary for LSM1 |
| Basic gene info. | Gene symbol | LSM1 |
| Gene name | LSM1, U6 small nuclear RNA associated | |
| Synonyms | CASM|YJL124C | |
| Cytomap | UCSC genome browser: 8p11.2 | |
| Genomic location | chr8 :38020838-38034248 | |
| Type of gene | protein-coding | |
| RefGenes | NM_014462.2, NR_045492.1,NR_045493.1, | |
| Ensembl id | ENSG00000175324 | |
| Description | LSM1 homolog, U6 small nuclear RNA associatedU6 snRNA-associated Sm-like protein LSm1cancer-associated Sm-like proteinsmall nuclear ribonuclear CaSm | |
| Modification date | 20141207 | |
| dbXrefs | MIM : 607281 | |
| HGNC : HGNC | ||
| Ensembl : ENSG00000175324 | ||
| HPRD : 06281 | ||
| Vega : OTTHUMG00000164051 | ||
| Protein | UniProt: O15116 go to UniProt's Cross Reference DB Table | |
| Expression | CleanEX: HS_LSM1 | |
| BioGPS: 27257 | ||
| Gene Expression Atlas: ENSG00000175324 | ||
| The Human Protein Atlas: ENSG00000175324 | ||
| Pathway | NCI Pathway Interaction Database: LSM1 | |
| KEGG: LSM1 | ||
| REACTOME: LSM1 | ||
| ConsensusPathDB | ||
| Pathway Commons: LSM1 | ||
| Metabolism | MetaCyc: LSM1 | |
| HUMANCyc: LSM1 | ||
| Regulation | Ensembl's Regulation: ENSG00000175324 | |
| miRBase: chr8 :38,020,838-38,034,248 | ||
| TargetScan: NM_014462 | ||
| cisRED: ENSG00000175324 | ||
| Context | iHOP: LSM1 | |
| cancer metabolism search in PubMed: LSM1 | ||
| UCL Cancer Institute: LSM1 | ||
| Assigned class in ccmGDB | B - This gene belongs to cancer gene. | |
| Top |
| Phenotypic Information for LSM1(metabolism pathway, cancer, disease, phenome) |
| Cancer | CGAP: LSM1 |
| Familial Cancer Database: LSM1 | |
| * This gene is included in those cancer gene databases. |
|
|
|
|
|
| . | ||||||||||||||||||||||||||||||||||||||||||||||||||||||||||||||||||||||||||||||||||||||||||||||||||||||||||||||||||||||||||||||||||||||||||||||||||||||||||||||||||||||||||||||||||||||||||||||||||||||||||||||||||||||||||||||||||||||||||||||||||||||||||||||||||||||||||||||||||||||||||||||||||||||||||||||||||||
Oncogene 1 | Significant driver gene in | |||||||||||||||||||||||||||||||||||||||||||||||||||||||||||||||||||||||||||||||||||||||||||||||||||||||||||||||||||||||||||||||||||||||||||||||||||||||||||||||||||||||||||||||||||||||||||||||||||||||||||||||||||||||||||||||||||||||||||||||||||||||||||||||||||||||||||||||||||||||||||||||||||||||||||||||||||||||||
| cf) number; DB name 1 Oncogene; http://nar.oxfordjournals.org/content/35/suppl_1/D721.long, 2 Tumor Suppressor gene; https://bioinfo.uth.edu/TSGene/, 3 Cancer Gene Census; http://www.nature.com/nrc/journal/v4/n3/abs/nrc1299.html, 4 CancerGenes; http://nar.oxfordjournals.org/content/35/suppl_1/D721.long, 5 Network of Cancer Gene; http://ncg.kcl.ac.uk/index.php, 1Therapeutic Vulnerabilities in Cancer; http://cbio.mskcc.org/cancergenomics/statius/ |
| REACTOME_METABOLISM_OF_MRNA REACTOME_METABOLISM_OF_RNA | |
| OMIM | 607281; gene. |
| Orphanet | |
| Disease | KEGG Disease: LSM1 |
| MedGen: LSM1 (Human Medical Genetics with Condition) | |
| ClinVar: LSM1 | |
| Phenotype | MGI: LSM1 (International Mouse Phenotyping Consortium) |
| PhenomicDB: LSM1 | |
| Mutations for LSM1 |
| * Under tables are showing count per each tissue to give us broad intuition about tissue specific mutation patterns.You can go to the detailed page for each mutation database's web site. |
| There's no structural variation information in COSMIC data for this gene. |
| * From mRNA Sanger sequences, Chitars2.0 arranged chimeric transcripts. This table shows LSM1 related fusion information. |
| ID | Head Gene | Tail Gene | Accession | Gene_a | qStart_a | qEnd_a | Chromosome_a | tStart_a | tEnd_a | Gene_a | qStart_a | qEnd_a | Chromosome_a | tStart_a | tEnd_a |
| AA501557 | LPP | 12 | 84 | 3 | 188138333 | 188434852 | LSM1 | 85 | 253 | 8 | 38020935 | 38021103 | |
| Top |
| Mutation type/ Tissue ID | brca | cns | cerv | endome | haematopo | kidn | Lintest | liver | lung | ns | ovary | pancre | prost | skin | stoma | thyro | urina | |||
| Total # sample | 4 | 1 | 4 | |||||||||||||||||
| GAIN (# sample) | 4 | 1 | 4 | |||||||||||||||||
| LOSS (# sample) |
| cf) Tissue ID; Tissue type (1; Breast, 2; Central_nervous_system, 3; Cervix, 4; Endometrium, 5; Haematopoietic_and_lymphoid_tissue, 6; Kidney, 7; Large_intestine, 8; Liver, 9; Lung, 10; NS, 11; Ovary, 12; Pancreas, 13; Prostate, 14; Skin, 15; Stomach, 16; Thyroid, 17; Urinary_tract) |
| Top |
|
 |
| Top |
| Stat. for Non-Synonymous SNVs (# total SNVs=10) | (# total SNVs=3) |
 |  |
(# total SNVs=0) | (# total SNVs=0) |
| Top |
| * When you move the cursor on each content, you can see more deailed mutation information on the Tooltip. Those are primary_site,primary_histology,mutation(aa),pubmedID. |
| GRCh37 position | Mutation(aa) | Unique sampleID count |
| chr8:38027375-38027375 | p.I59S | 1 |
| chr8:38027383-38027383 | p.Y56Y | 1 |
| chr8:38021196-38021196 | p.E132Q | 1 |
| chr8:38027393-38027393 | p.G53D | 1 |
| chr8:38021226-38021226 | p.L122I | 1 |
| chr8:38027405-38027405 | p.R49H | 1 |
| chr8:38021254-38021254 | p.L112L | 1 |
| chr8:38027409-38027409 | p.E48* | 1 |
| chr8:38021327-38021327 | p.Q88R | 1 |
| chr8:38029500-38029500 | p.R33K | 1 |
| Top |
|
 |
| Point Mutation/ Tissue ID | 1 | 2 | 3 | 4 | 5 | 6 | 7 | 8 | 9 | 10 | 11 | 12 | 13 | 14 | 15 | 16 | 17 | 18 | 19 | 20 |
| # sample | 1 | 1 | 5 | 1 | 2 | 1 | 2 | 1 | 2 | 1 | ||||||||||
| # mutation | 1 | 1 | 4 | 1 | 2 | 1 | 2 | 1 | 2 | 1 | ||||||||||
| nonsynonymous SNV | 3 | 1 | 1 | 1 | 2 | 1 | 1 | 1 | ||||||||||||
| synonymous SNV | 1 | 1 | 1 | 1 | 1 |
| cf) Tissue ID; Tissue type (1; BLCA[Bladder Urothelial Carcinoma], 2; BRCA[Breast invasive carcinoma], 3; CESC[Cervical squamous cell carcinoma and endocervical adenocarcinoma], 4; COAD[Colon adenocarcinoma], 5; GBM[Glioblastoma multiforme], 6; Glioma Low Grade, 7; HNSC[Head and Neck squamous cell carcinoma], 8; KICH[Kidney Chromophobe], 9; KIRC[Kidney renal clear cell carcinoma], 10; KIRP[Kidney renal papillary cell carcinoma], 11; LAML[Acute Myeloid Leukemia], 12; LUAD[Lung adenocarcinoma], 13; LUSC[Lung squamous cell carcinoma], 14; OV[Ovarian serous cystadenocarcinoma ], 15; PAAD[Pancreatic adenocarcinoma], 16; PRAD[Prostate adenocarcinoma], 17; SKCM[Skin Cutaneous Melanoma], 18:STAD[Stomach adenocarcinoma], 19:THCA[Thyroid carcinoma], 20:UCEC[Uterine Corpus Endometrial Carcinoma]) |
| Top |
| * We represented just top 10 SNVs. When you move the cursor on each content, you can see more deailed mutation information on the Tooltip. Those are primary_site, primary_histology, mutation(aa), pubmedID. |
| Genomic Position | Mutation(aa) | Unique sampleID count |
| chr8:38021226 | p.L122I | 2 |
| chr8:38027375 | p.R49H | 1 |
| chr8:38027379 | p.I29T | 1 |
| chr8:38027383 | p.L28P | 1 |
| chr8:38021196 | p.I11I | 1 |
| chr8:38027393 | p.E132Q | 1 |
| chr8:38027405 | p.L112L | 1 |
| chr8:38021254 | p.Q88R | 1 |
| chr8:38029512 | p.L87I | 1 |
| chr8:38021327 | p.L73L | 1 |
| * Copy number data were extracted from TCGA using R package TCGA-Assembler. The URLs of all public data files on TCGA DCC data server were gathered on Jan-05-2015. Function ProcessCNAData in TCGA-Assembler package was used to obtain gene-level copy number value which is calculated as the average copy number of the genomic region of a gene. |
 |
| cf) Tissue ID[Tissue type]: BLCA[Bladder Urothelial Carcinoma], BRCA[Breast invasive carcinoma], CESC[Cervical squamous cell carcinoma and endocervical adenocarcinoma], COAD[Colon adenocarcinoma], GBM[Glioblastoma multiforme], Glioma Low Grade, HNSC[Head and Neck squamous cell carcinoma], KICH[Kidney Chromophobe], KIRC[Kidney renal clear cell carcinoma], KIRP[Kidney renal papillary cell carcinoma], LAML[Acute Myeloid Leukemia], LUAD[Lung adenocarcinoma], LUSC[Lung squamous cell carcinoma], OV[Ovarian serous cystadenocarcinoma ], PAAD[Pancreatic adenocarcinoma], PRAD[Prostate adenocarcinoma], SKCM[Skin Cutaneous Melanoma], STAD[Stomach adenocarcinoma], THCA[Thyroid carcinoma], UCEC[Uterine Corpus Endometrial Carcinoma] |
| Top |
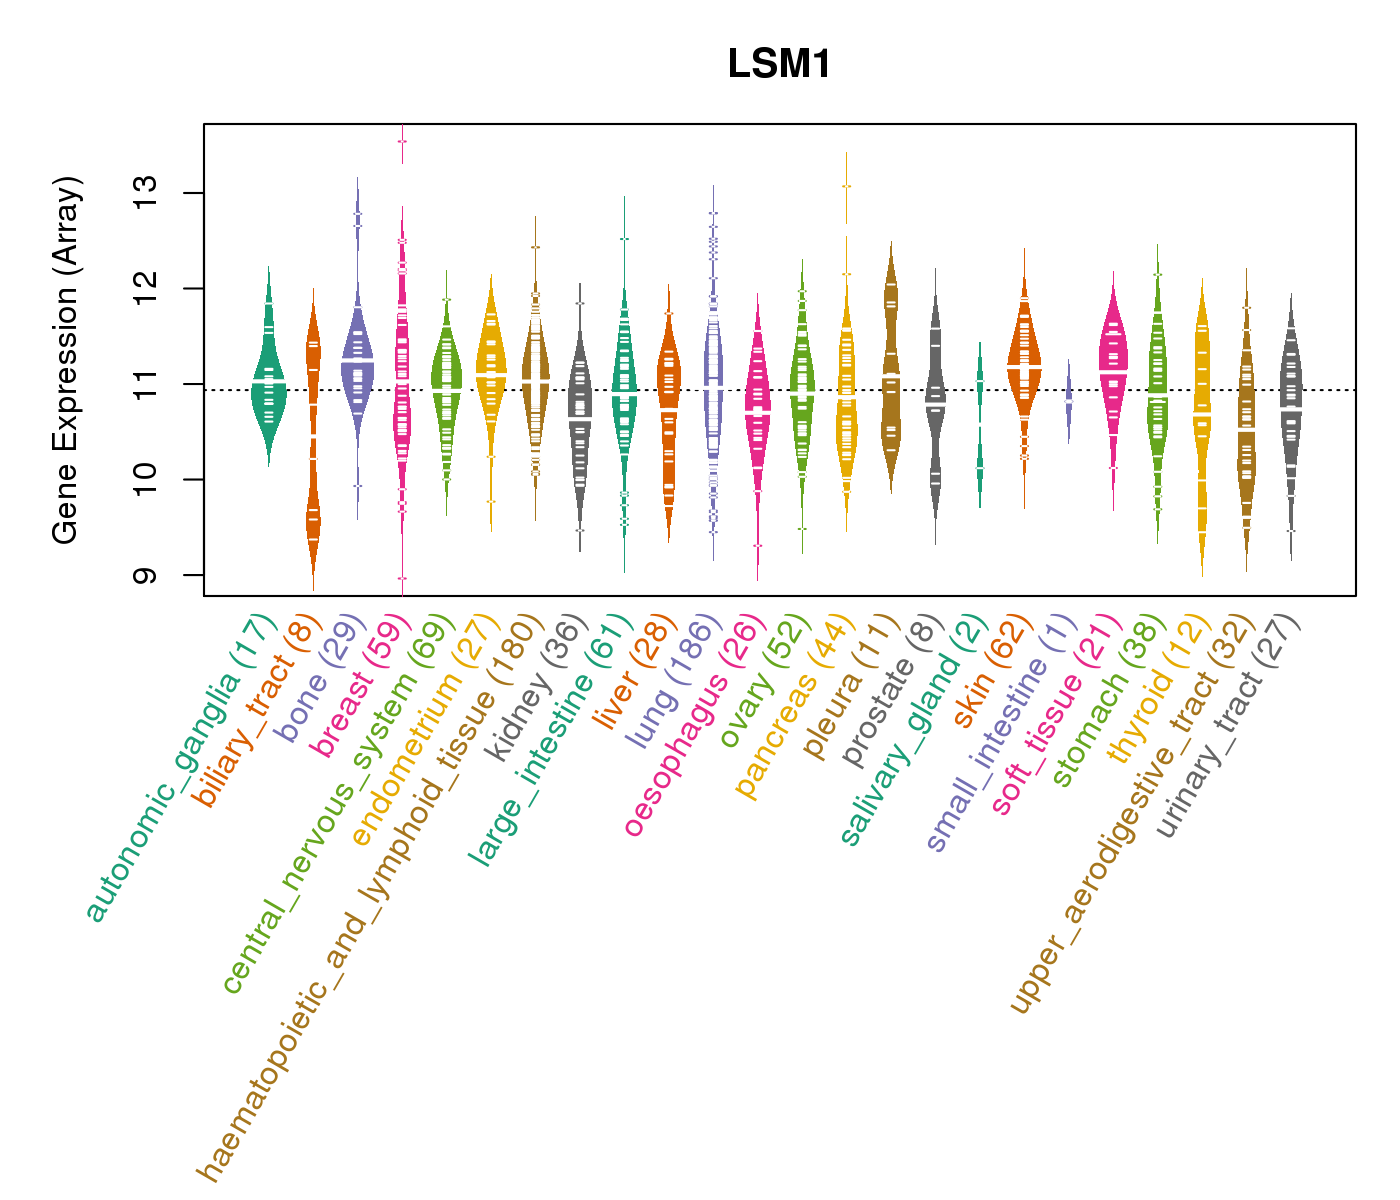
| Gene Expression for LSM1 |
| * CCLE gene expression data were extracted from CCLE_Expression_Entrez_2012-10-18.res: Gene-centric RMA-normalized mRNA expression data. |
 |
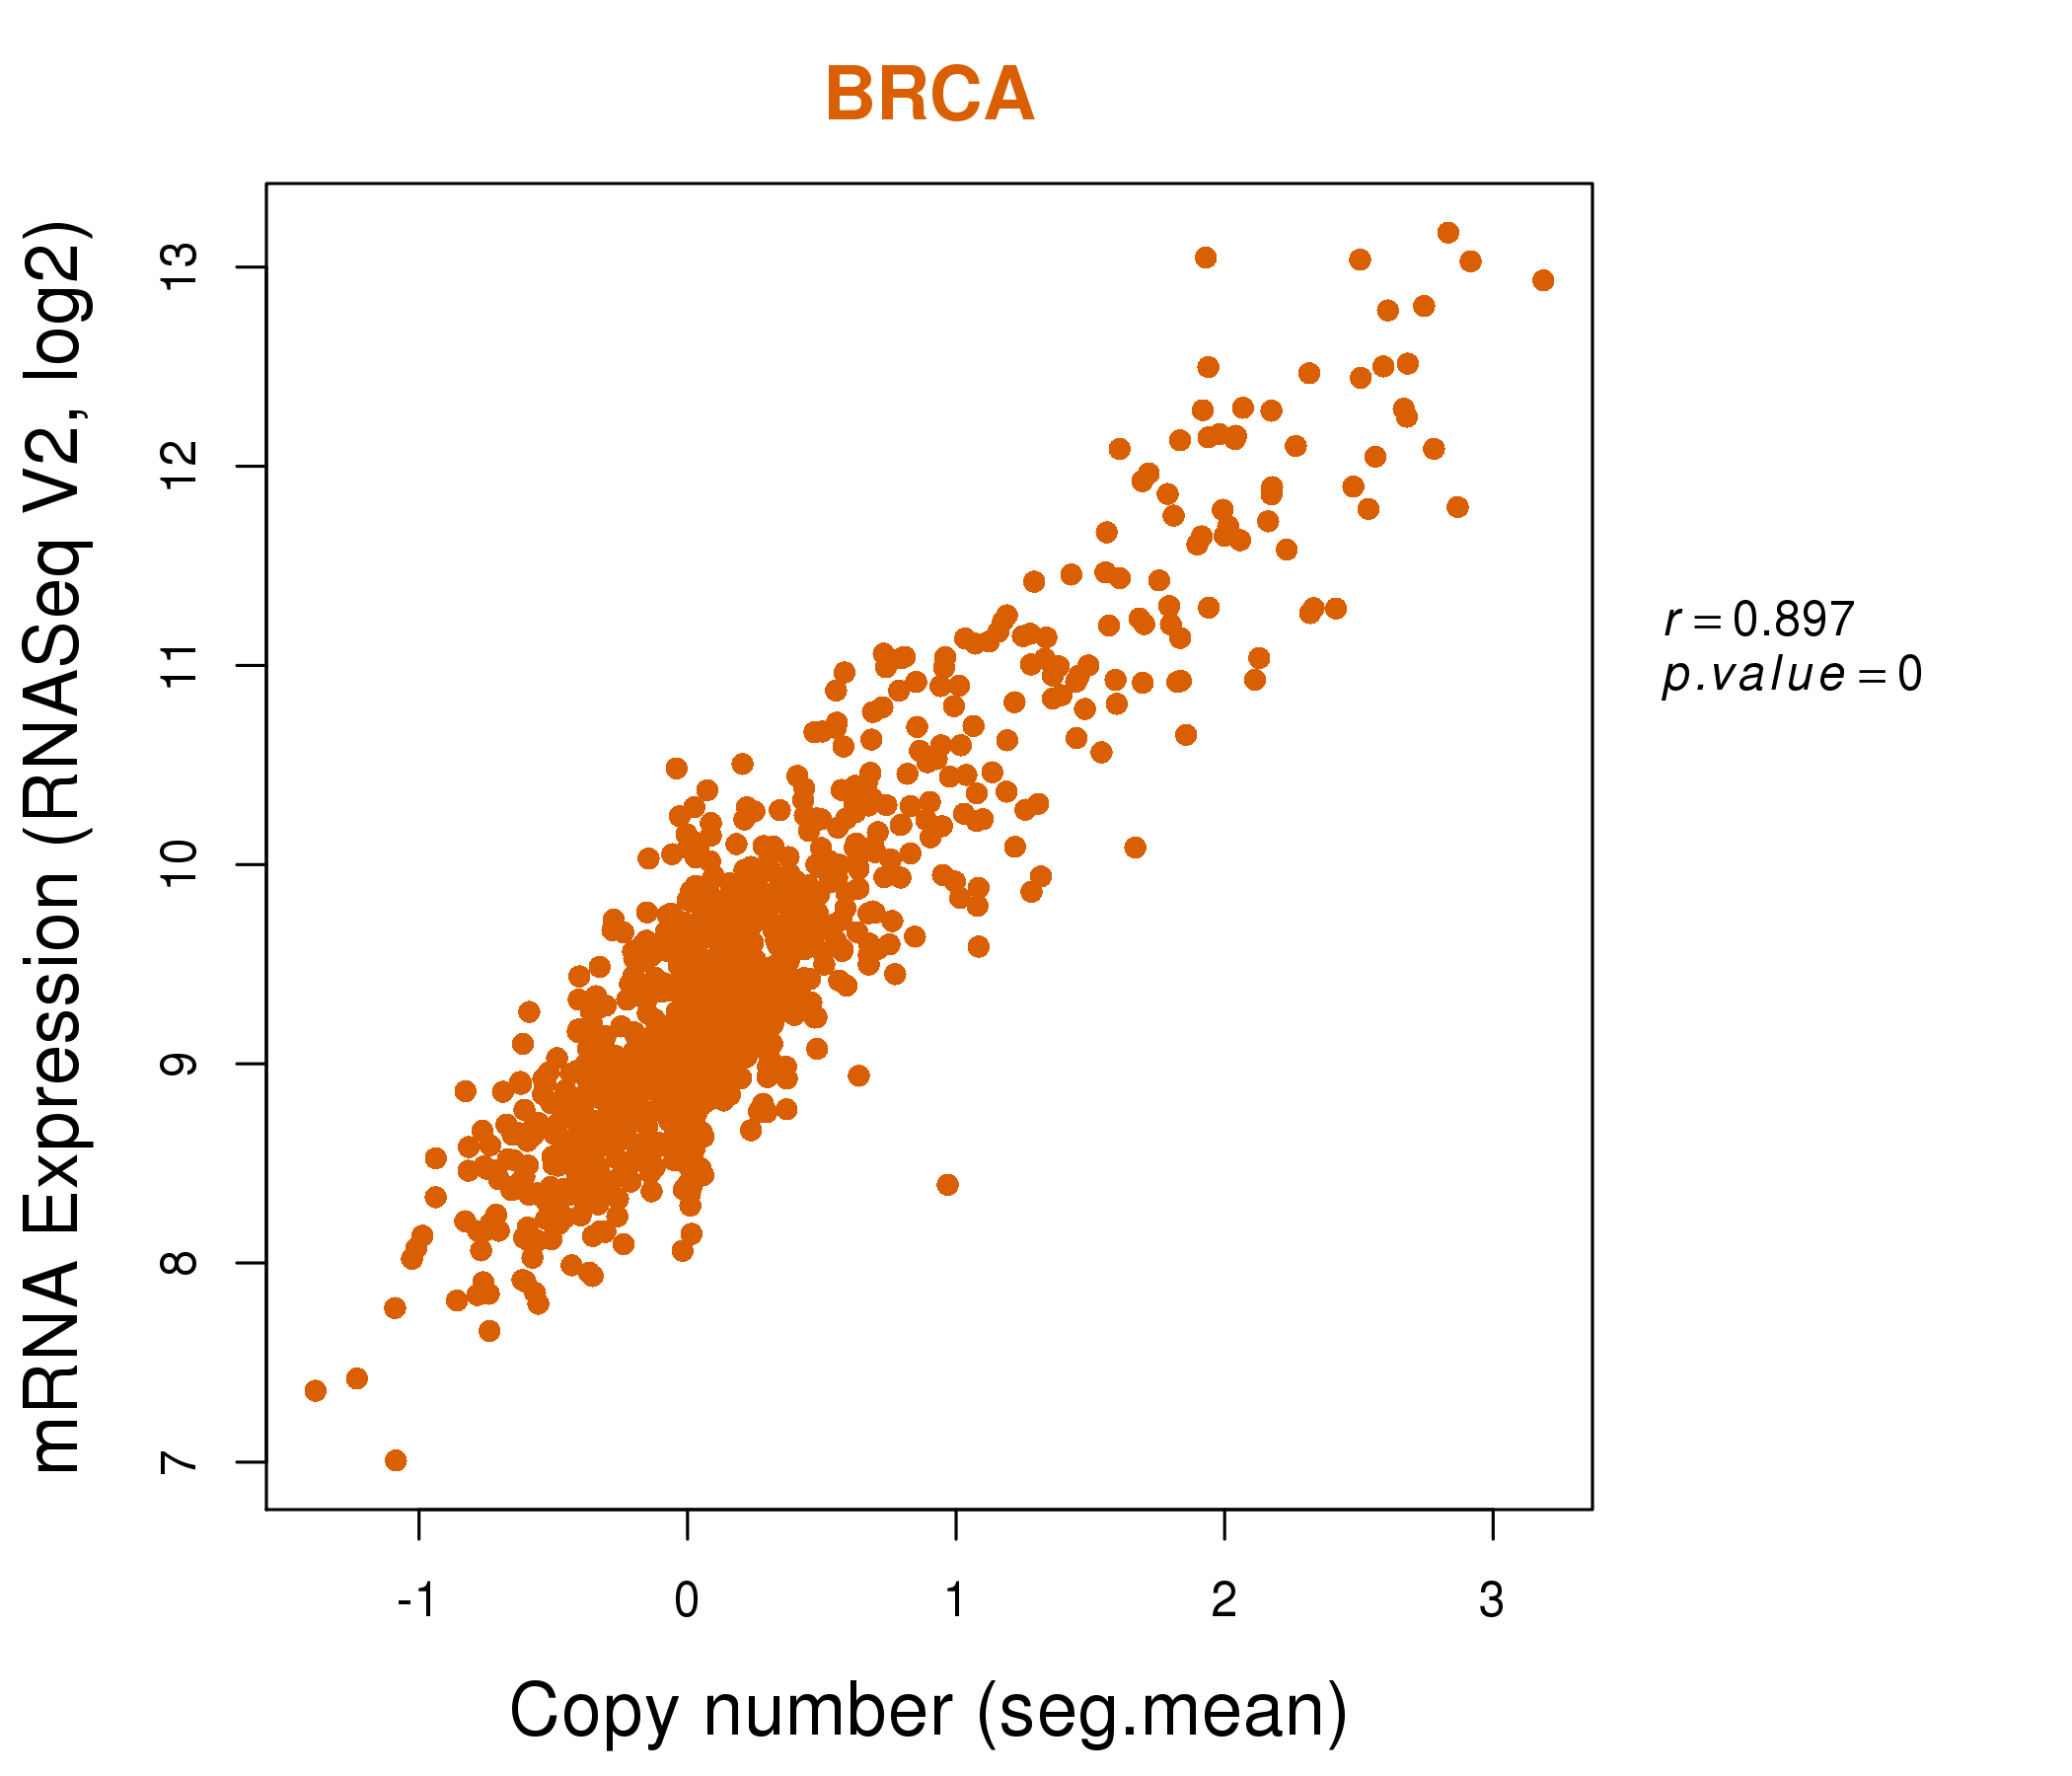
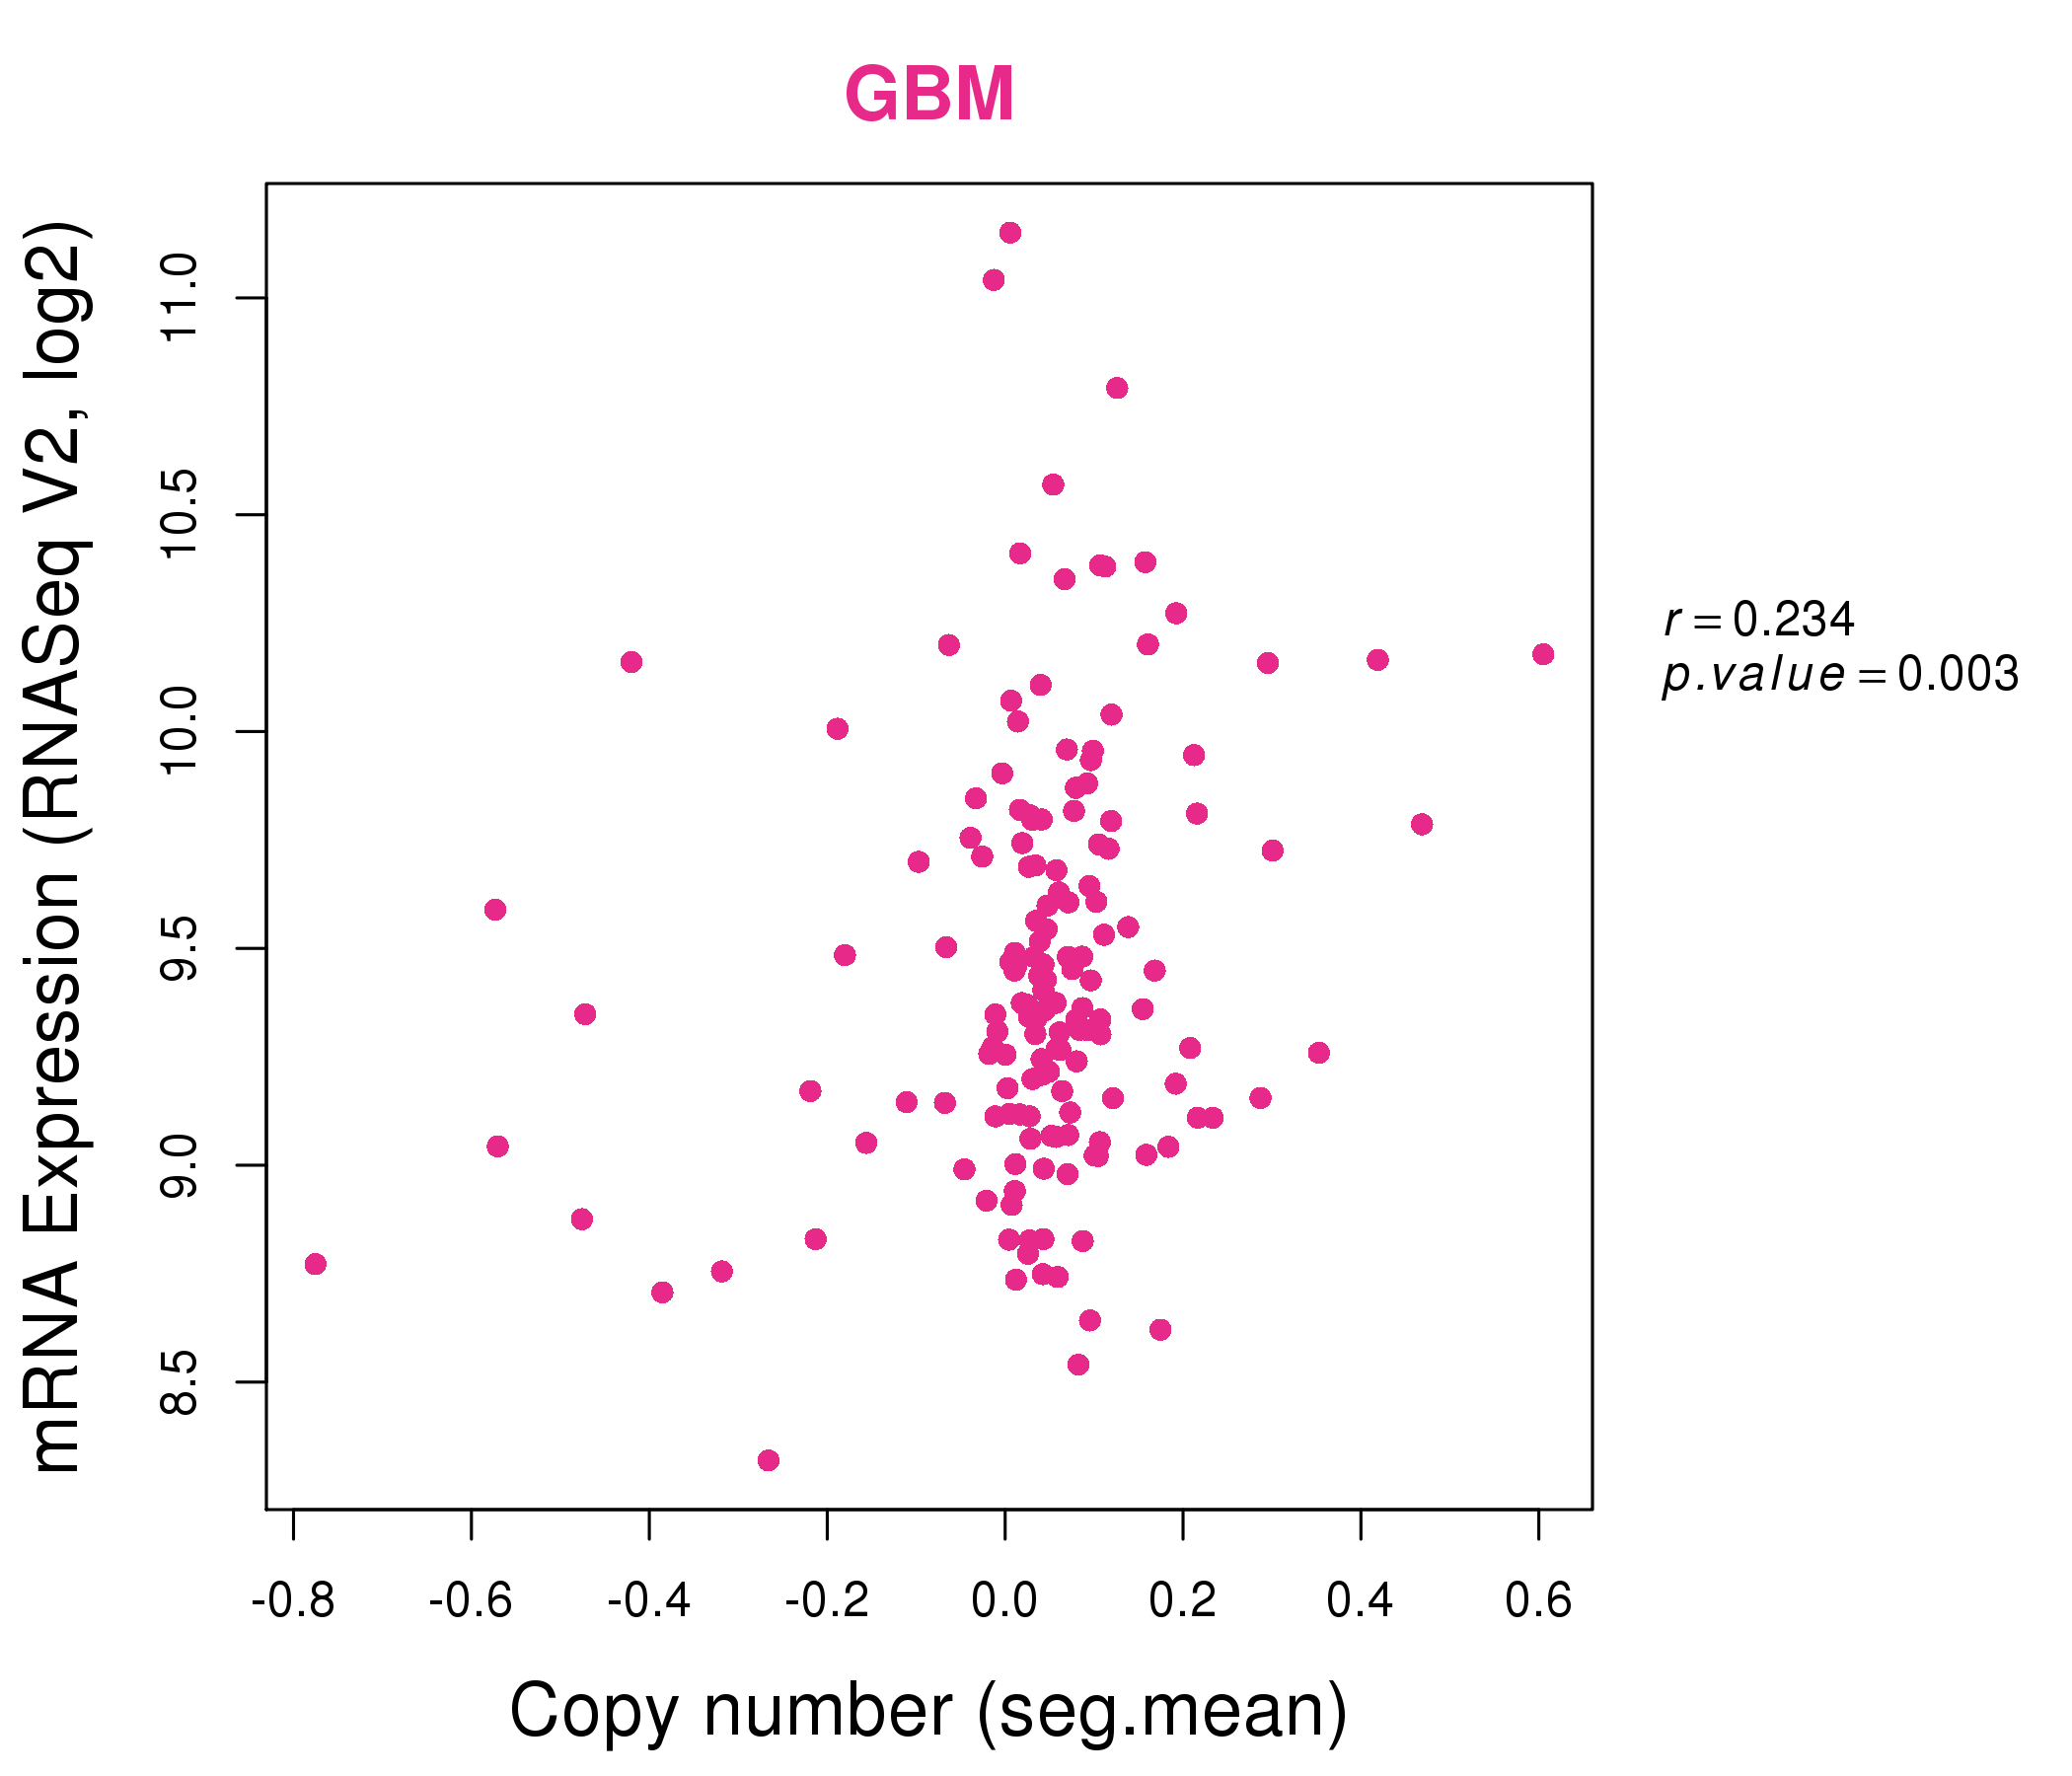
| * Normalized gene expression data of RNASeqV2 was extracted from TCGA using R package TCGA-Assembler. The URLs of all public data files on TCGA DCC data server were gathered at Jan-05-2015. Only eight cancer types have enough normal control samples for differential expression analysis. (t test, adjusted p<0.05 (using Benjamini-Hochberg FDR)) |
 |
| Top |
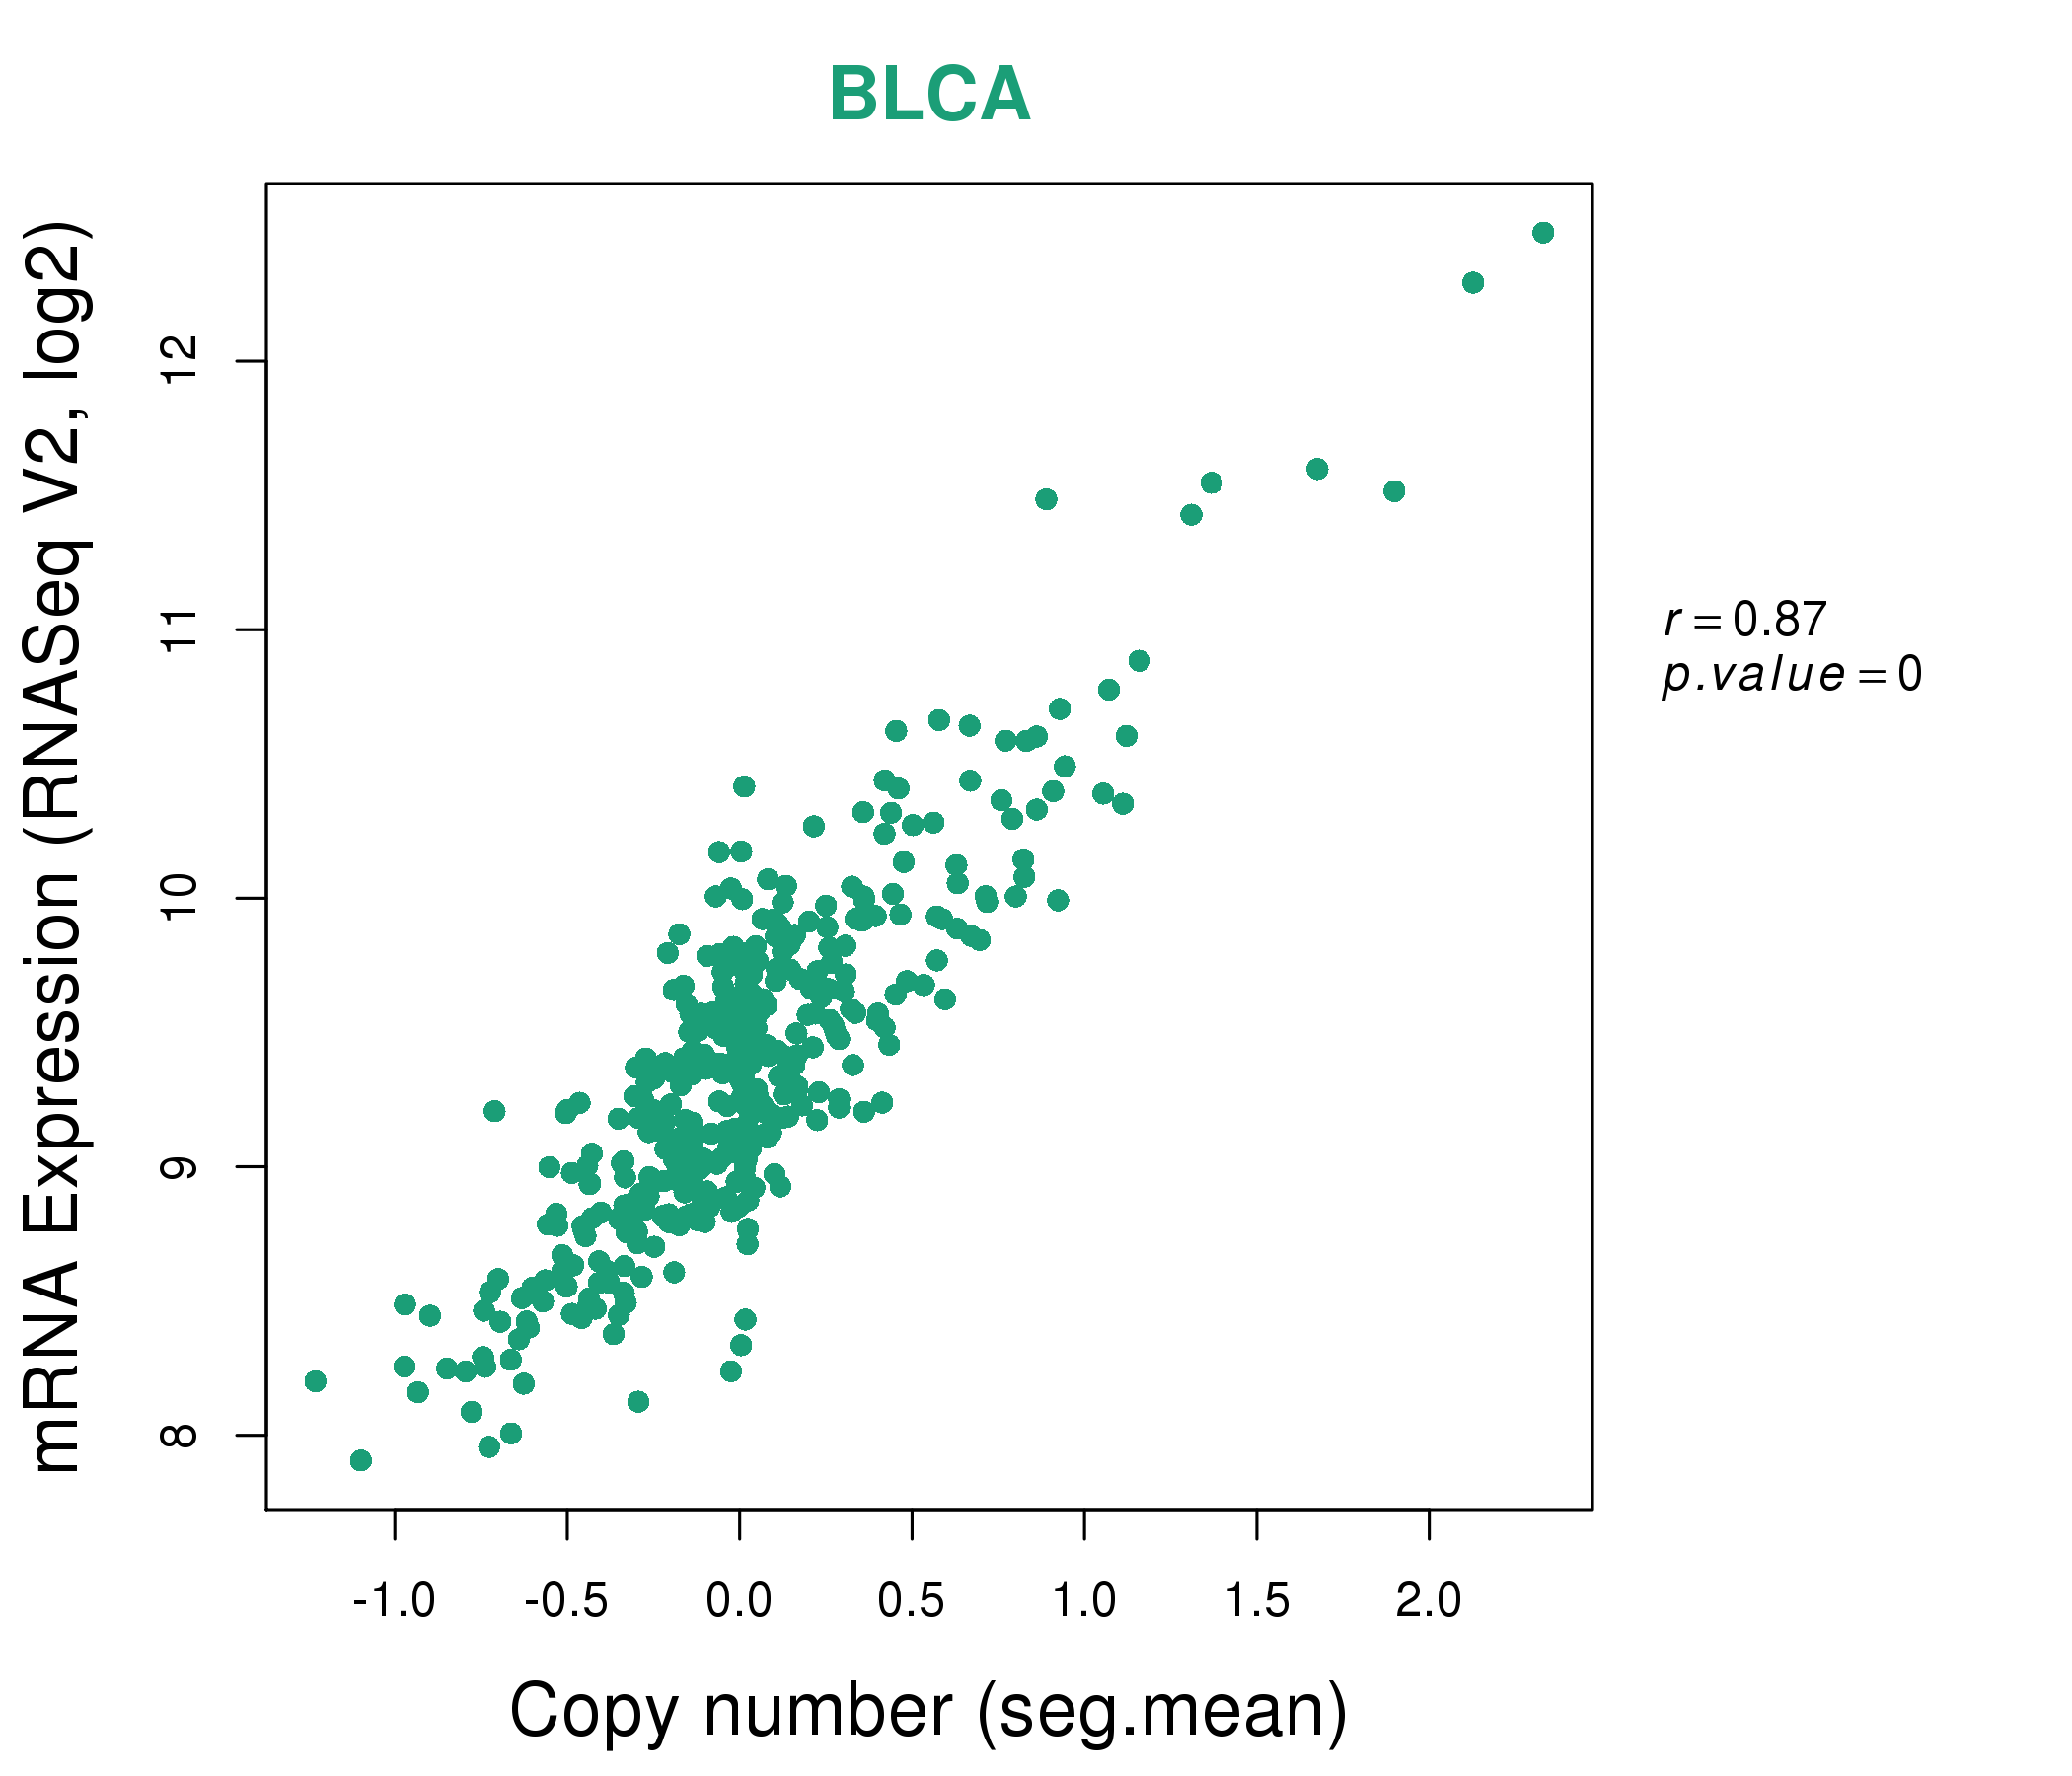
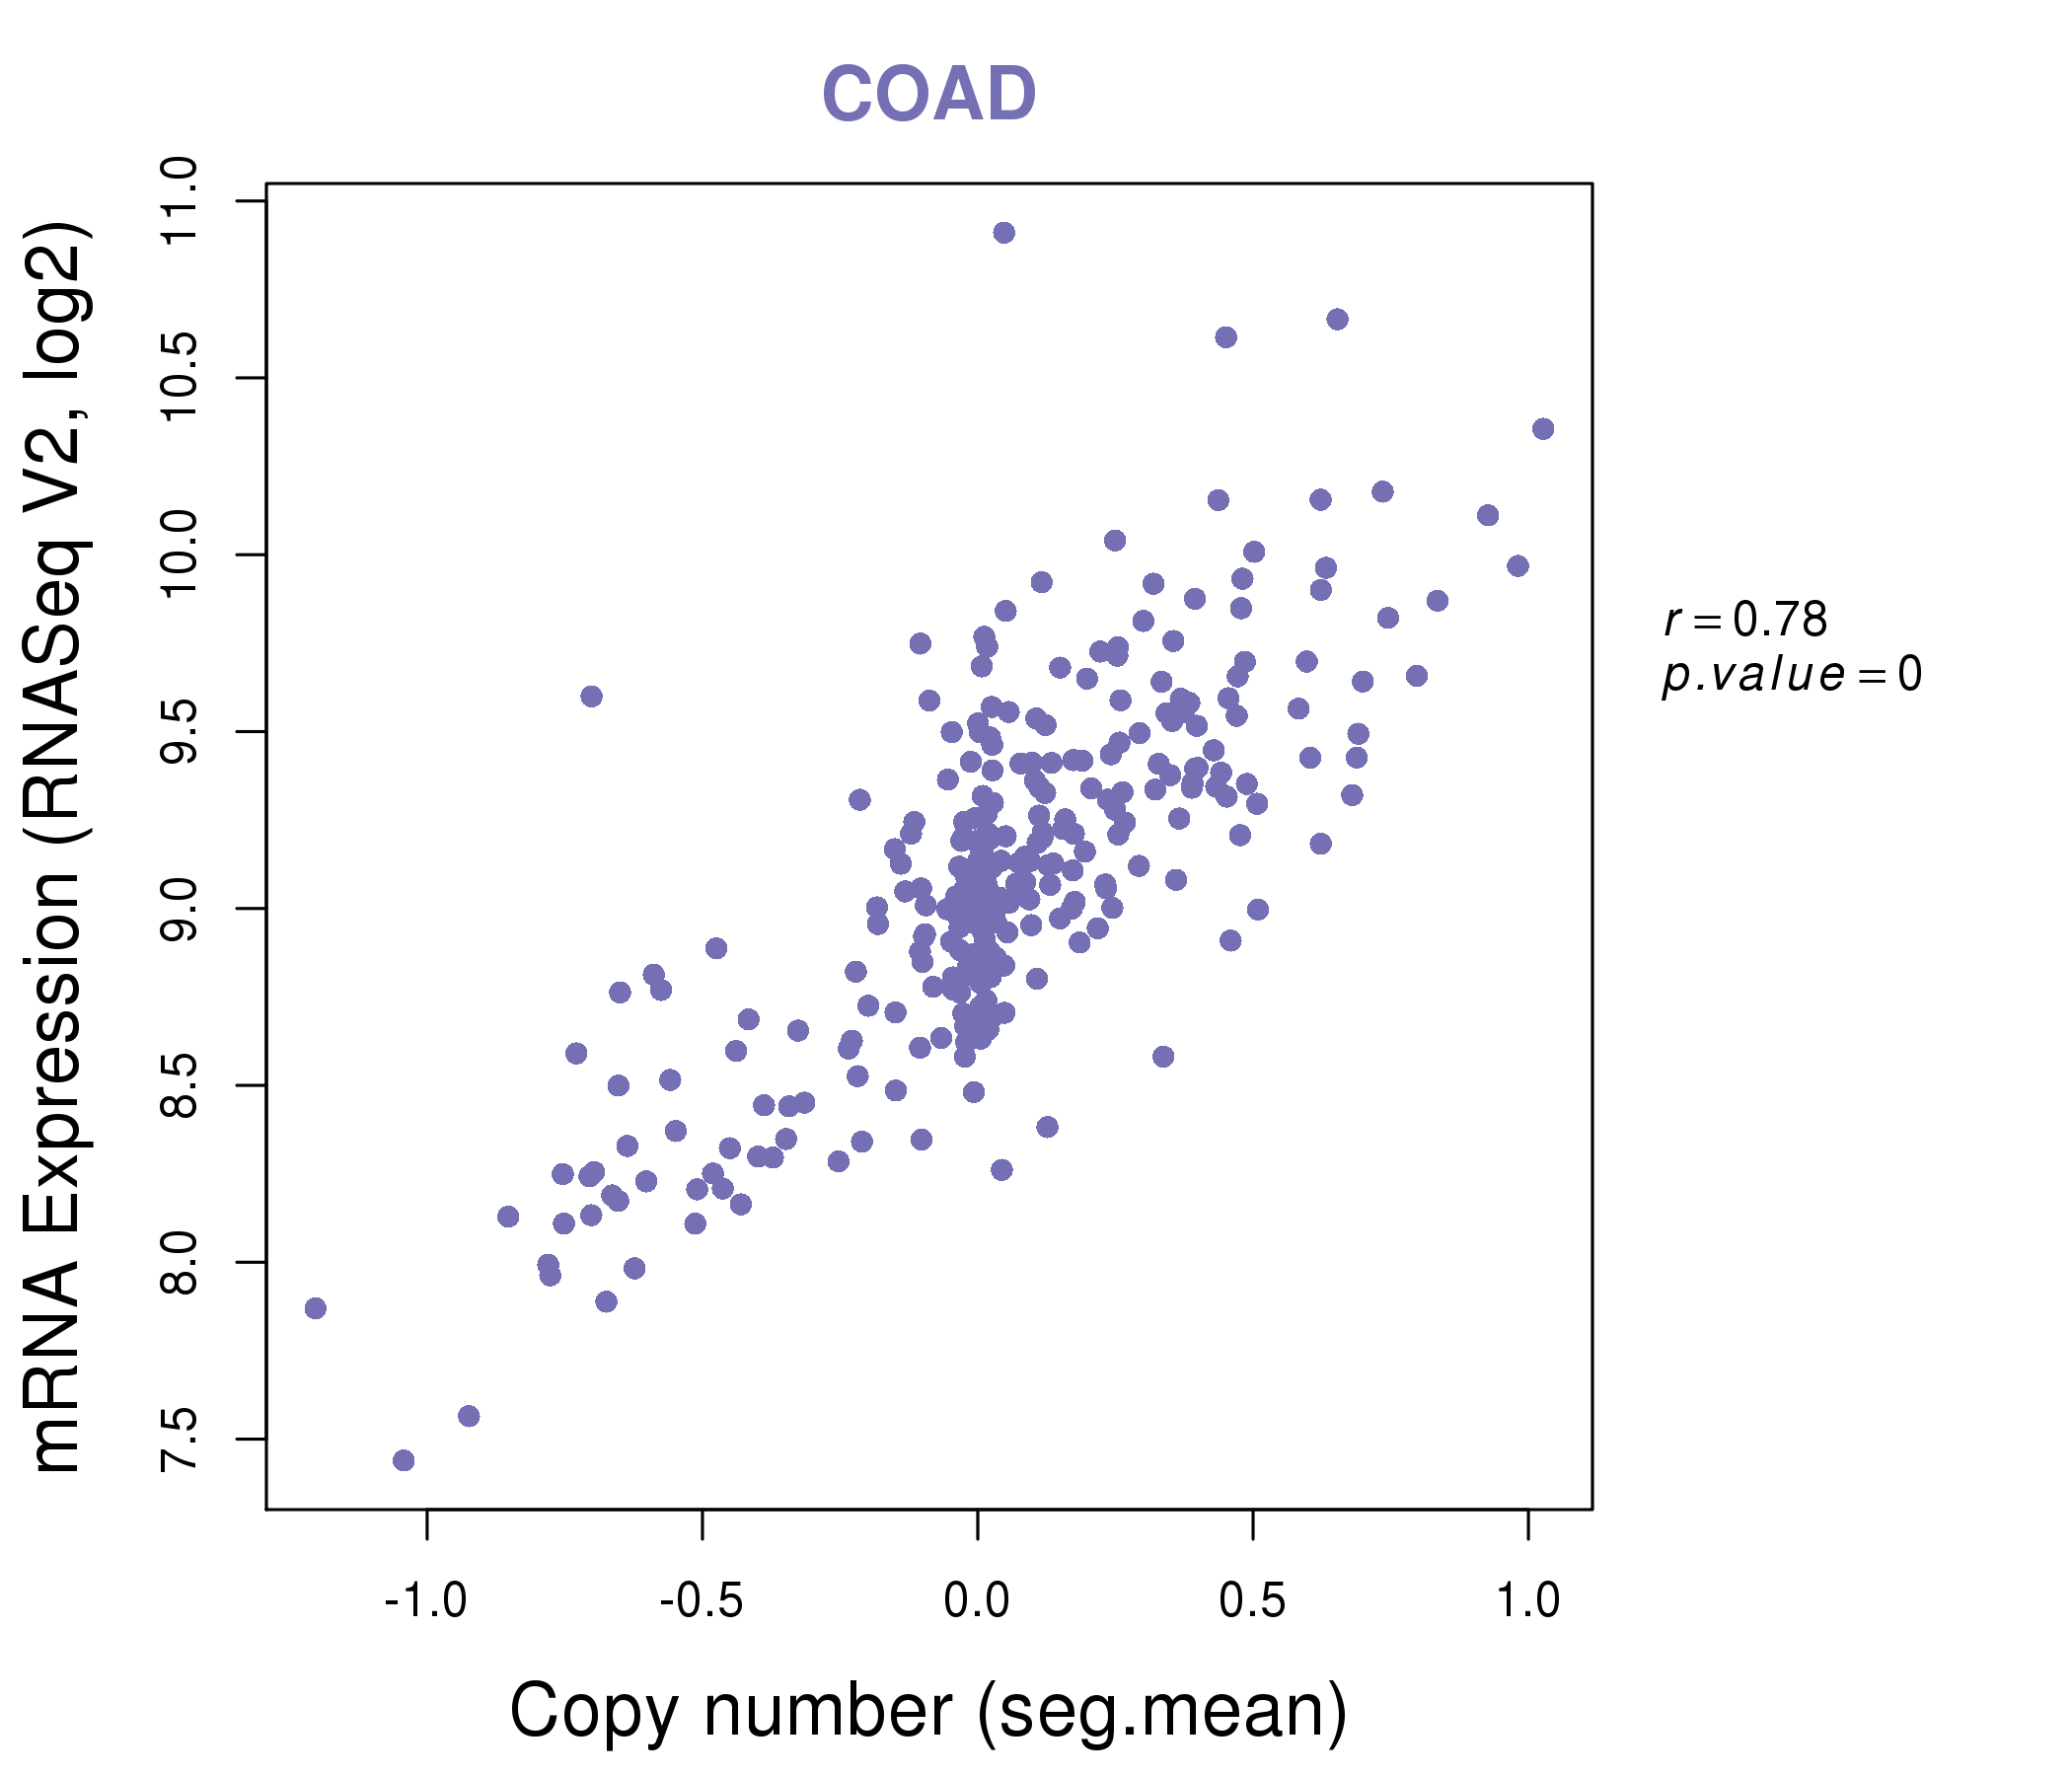
| * This plots show the correlation between CNV and gene expression. |
: Open all plots for all cancer types
 |
|
 |
|
| Top |
| Gene-Gene Network Information |
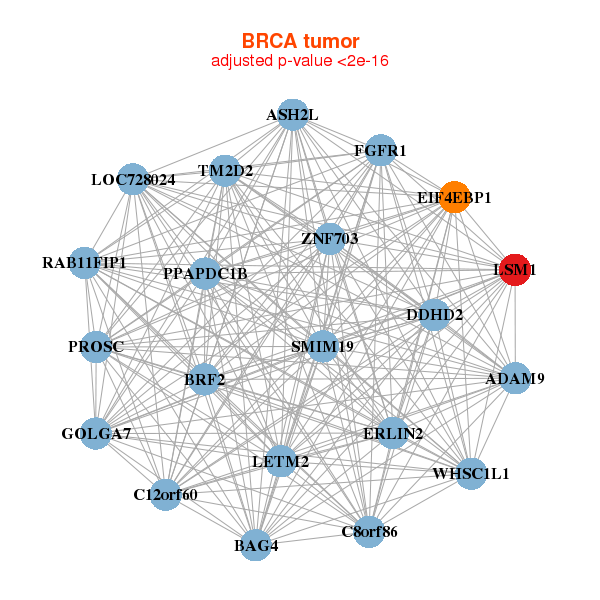
| * Co-Expression network figures were drawn using R package igraph. Only the top 20 genes with the highest correlations were shown. Red circle: input gene, orange circle: cell metabolism gene, sky circle: other gene |
: Open all plots for all cancer types
 |
|
| ADAM9,ASH2L,BAG4,BRF2,C12orf60,SMIM19,C8orf86, DDHD2,EIF4EBP1,ERLIN2,FGFR1,GOLGA7,LETM2,LOC728024, LSM1,PPAPDC1B,PROSC,RAB11FIP1,TM2D2,WHSC1L1,ZNF703 | ATP5E,ATP6V1E1,EMC7,COPRS,DNAJC8,EIF2S2,ENY2, GTF3A,LSM1,NEDD8,POP4,PPP1R7,PSMA4,PSMA6, PSMB1,PTPMT1,STX8,TRAPPC3,TTC1,UBE2F,ZBTB8OS |
 |
|
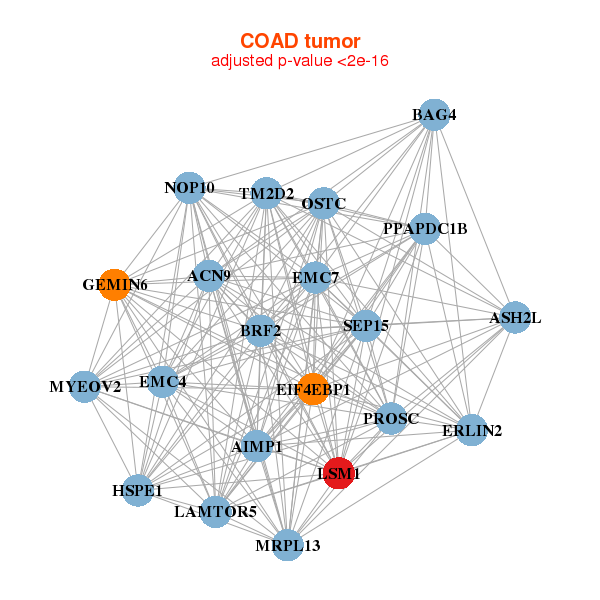
| ACN9,AIMP1,ASH2L,BAG4,BRF2,EMC7,EIF4EBP1, ERLIN2,GEMIN6,LAMTOR5,HSPE1,LSM1,MRPL13,MYEOV2, NOP10,OSTC,PPAPDC1B,PROSC,SEP15,TM2D2,EMC4 | EMC7,COA6,CALM2,CKLF,DPM1,DYNLT1,LAMTOR5, HSBP1,LSM1,MYEOV2,NDUFB6,NDUFV2,PHF5A,PSMB1, PSMD13,PTS,RBX1,SELK,TRAPPC3,VPS29,ZNF410 |
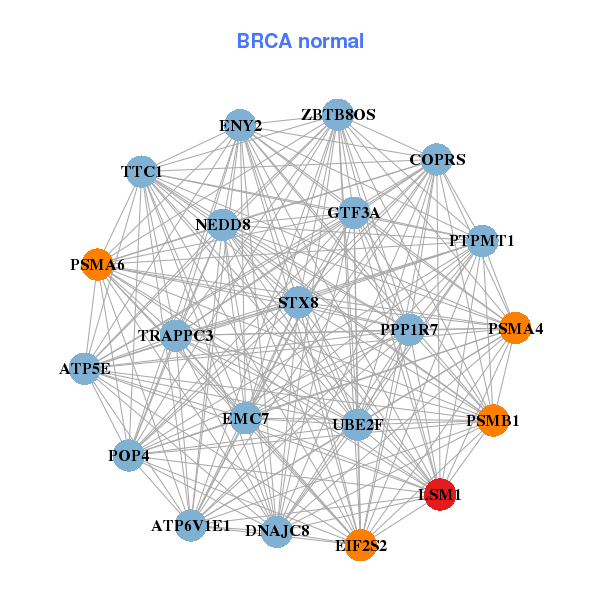
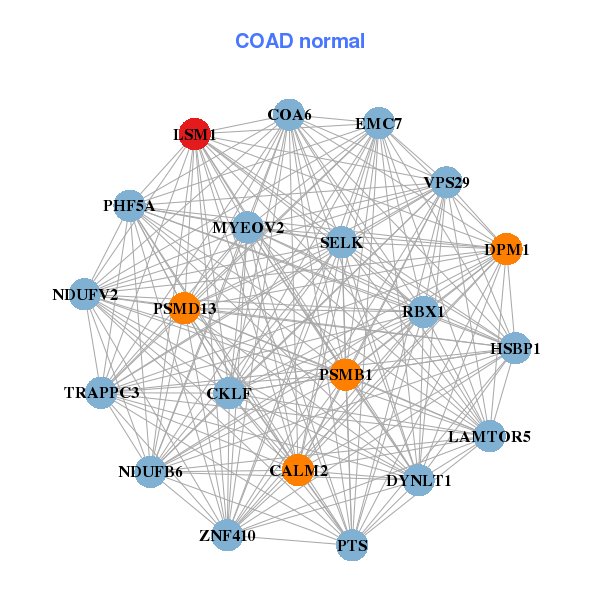
| * Co-Expression network figures were drawn using R package igraph. Only the top 20 genes with the highest correlations were shown. Red circle: input gene, orange circle: cell metabolism gene, sky circle: other gene |
: Open all plots for all cancer types
| Top |
: Open all interacting genes' information including KEGG pathway for all interacting genes from DAVID
| Top |
| Pharmacological Information for LSM1 |
| There's no related Drug. |
| Top |
| Cross referenced IDs for LSM1 |
| * We obtained these cross-references from Uniprot database. It covers 150 different DBs, 18 categories. http://www.uniprot.org/help/cross_references_section |
: Open all cross reference information
|
Copyright © 2016-Present - The Univsersity of Texas Health Science Center at Houston @ |