|
||||||||||||||||||||||||||||||||||||||||||||||||||||||||||||||||||||||||||||||||||||||||||||||||||||||||||||||||||||||||||||||||||||||||||||||||||||||||||||||||||||||||||||||||||||||||||||||||||||||||||||||||||||||||||||||||||||||||||||||||||||||||||||||||||||||||||||||||||||||||||||||||||||||||||||||||||||||||||
| |
| Phenotypic Information (metabolism pathway, cancer, disease, phenome) |
| |
| |
| Gene-Gene Network Information: Co-Expression Network, Interacting Genes & KEGG |
| |
|


| Gene Summary for GUCY1A2 |
| Top |
| Phenotypic Information for GUCY1A2(metabolism pathway, cancer, disease, phenome) |
| Cancer | CGAP: GUCY1A2 |
| Familial Cancer Database: GUCY1A2 | |
| * This gene is included in those cancer gene databases. |
|
|
|
|
|
| . | ||||||||||||||||||||||||||||||||||||||||||||||||||||||||||||||||||||||||||||||||||||||||||||||||||||||||||||||||||||||||||||||||||||||||||||||||||||||||||||||||||||||||||||||||||||||||||||||||||||||||||||||||||||||||||||||||||||||||||||||||||||||||||||||||||||||||||||||||||||||||||||||||||||||||||||||||||||
Oncogene 1 | Significant driver gene in | |||||||||||||||||||||||||||||||||||||||||||||||||||||||||||||||||||||||||||||||||||||||||||||||||||||||||||||||||||||||||||||||||||||||||||||||||||||||||||||||||||||||||||||||||||||||||||||||||||||||||||||||||||||||||||||||||||||||||||||||||||||||||||||||||||||||||||||||||||||||||||||||||||||||||||||||||||||||||
| cf) number; DB name 1 Oncogene; http://nar.oxfordjournals.org/content/35/suppl_1/D721.long, 2 Tumor Suppressor gene; https://bioinfo.uth.edu/TSGene/, 3 Cancer Gene Census; http://www.nature.com/nrc/journal/v4/n3/abs/nrc1299.html, 4 CancerGenes; http://nar.oxfordjournals.org/content/35/suppl_1/D721.long, 5 Network of Cancer Gene; http://ncg.kcl.ac.uk/index.php, 1Therapeutic Vulnerabilities in Cancer; http://cbio.mskcc.org/cancergenomics/statius/ |
| KEGG_PURINE_METABOLISM | |
| OMIM | 601244; gene. |
| Orphanet | |
| Disease | KEGG Disease: GUCY1A2 |
| MedGen: GUCY1A2 (Human Medical Genetics with Condition) | |
| ClinVar: GUCY1A2 | |
| Phenotype | MGI: GUCY1A2 (International Mouse Phenotyping Consortium) |
| PhenomicDB: GUCY1A2 | |
| Mutations for GUCY1A2 |
| * Under tables are showing count per each tissue to give us broad intuition about tissue specific mutation patterns.You can go to the detailed page for each mutation database's web site. |
| - Statistics for Tissue and Mutation type | Top |
 |
| - For Inter-chromosomal Variations |
| There's no inter-chromosomal structural variation. |
| - For Intra-chromosomal Variations |
| * Intra-chromosomal variantions includes 'intrachromosomal amplicon to amplicon', 'intrachromosomal amplicon to non-amplified dna', 'intrachromosomal deletion', 'intrachromosomal fold-back inversion', 'intrachromosomal inversion', 'intrachromosomal tandem duplication', 'Intrachromosomal unknown type', 'intrachromosomal with inverted orientation', 'intrachromosomal with non-inverted orientation'. |
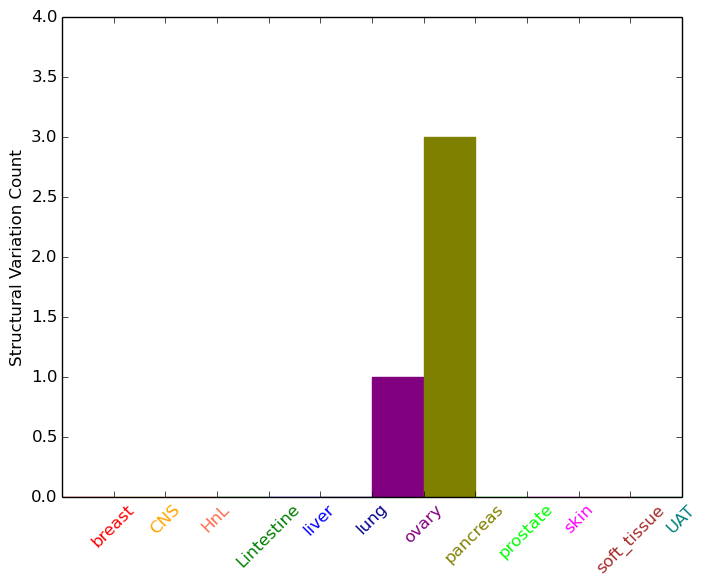 |
| Sample | Symbol_a | Chr_a | Start_a | End_a | Symbol_b | Chr_b | Start_b | End_b |
| ovary | GUCY1A2 | chr11 | 106845059 | 106845079 | GUCY1A2 | chr11 | 106845123 | 106845143 |
| pancreas | GUCY1A2 | chr11 | 106616795 | 106616815 | chr11 | 107054834 | 107054854 | |
| pancreas | GUCY1A2 | chr11 | 106760443 | 106760463 | GUCY1A2 | chr11 | 106761740 | 106761760 |
| pancreas | GUCY1A2 | chr11 | 106760840 | 106761040 | GUCY1A2 | chr11 | 106761405 | 106761605 |
| cf) Tissue number; Tissue name (1;Breast, 2;Central_nervous_system, 3;Haematopoietic_and_lymphoid_tissue, 4;Large_intestine, 5;Liver, 6;Lung, 7;Ovary, 8;Pancreas, 9;Prostate, 10;Skin, 11;Soft_tissue, 12;Upper_aerodigestive_tract) |
| * From mRNA Sanger sequences, Chitars2.0 arranged chimeric transcripts. This table shows GUCY1A2 related fusion information. |
| ID | Head Gene | Tail Gene | Accession | Gene_a | qStart_a | qEnd_a | Chromosome_a | tStart_a | tEnd_a | Gene_a | qStart_a | qEnd_a | Chromosome_a | tStart_a | tEnd_a |
| BG000658 | GUCY1A2 | 9 | 201 | 11 | 106722249 | 106722440 | MALAT1 | 192 | 427 | 11 | 65266737 | 65266972 | |
| Top |
| Mutation type/ Tissue ID | brca | cns | cerv | endome | haematopo | kidn | Lintest | liver | lung | ns | ovary | pancre | prost | skin | stoma | thyro | urina | |||
| Total # sample | 1 | 1 | 2 | 1 | 1 | 3 | 1 | |||||||||||||
| GAIN (# sample) | 1 | 1 | 1 | 1 | 1 | |||||||||||||||
| LOSS (# sample) | 2 | 1 | 2 |
| cf) Tissue ID; Tissue type (1; Breast, 2; Central_nervous_system, 3; Cervix, 4; Endometrium, 5; Haematopoietic_and_lymphoid_tissue, 6; Kidney, 7; Large_intestine, 8; Liver, 9; Lung, 10; NS, 11; Ovary, 12; Pancreas, 13; Prostate, 14; Skin, 15; Stomach, 16; Thyroid, 17; Urinary_tract) |
| Top |
|
 |
| Top |
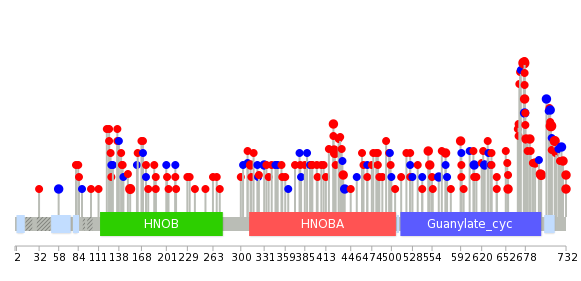
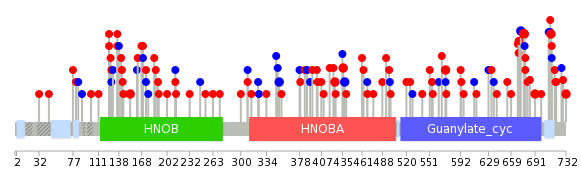
| Stat. for Non-Synonymous SNVs (# total SNVs=136) | (# total SNVs=40) |
 |  |
(# total SNVs=1) | (# total SNVs=0) |
 |
| Top |
| * When you move the cursor on each content, you can see more deailed mutation information on the Tooltip. Those are primary_site,primary_histology,mutation(aa),pubmedID. |
| GRCh37 position | Mutation(aa) | Unique sampleID count |
| chr11:106558447-106558447 | p.P676L | 5 |
| chr11:106558339-106558339 | p.S712L | 4 |
| chr11:106849374-106849374 | p.G153E | 3 |
| chr11:106558444-106558444 | p.R677Q | 3 |
| chr11:106579265-106579265 | p.R655L | 3 |
| chr11:106681137-106681137 | p.P425L | 3 |
| chr11:106558379-106558379 | p.V699L | 3 |
| chr11:106558323-106558323 | p.K717N | 3 |
| chr11:106810341-106810341 | p.R351* | 3 |
| chr11:106680966-106680966 | p.A482V | 2 |
| Top |
|
 |
| Point Mutation/ Tissue ID | 1 | 2 | 3 | 4 | 5 | 6 | 7 | 8 | 9 | 10 | 11 | 12 | 13 | 14 | 15 | 16 | 17 | 18 | 19 | 20 |
| # sample | 5 | 4 | 19 | 5 | 2 | 25 | 12 | 2 | 2 | 28 | 12 | 10 | ||||||||
| # mutation | 5 | 4 | 25 | 5 | 2 | 28 | 13 | 2 | 1 | 27 | 13 | 11 | ||||||||
| nonsynonymous SNV | 4 | 4 | 22 | 4 | 1 | 19 | 10 | 1 | 17 | 8 | 9 | |||||||||
| synonymous SNV | 1 | 3 | 1 | 1 | 9 | 3 | 2 | 10 | 5 | 2 |
| cf) Tissue ID; Tissue type (1; BLCA[Bladder Urothelial Carcinoma], 2; BRCA[Breast invasive carcinoma], 3; CESC[Cervical squamous cell carcinoma and endocervical adenocarcinoma], 4; COAD[Colon adenocarcinoma], 5; GBM[Glioblastoma multiforme], 6; Glioma Low Grade, 7; HNSC[Head and Neck squamous cell carcinoma], 8; KICH[Kidney Chromophobe], 9; KIRC[Kidney renal clear cell carcinoma], 10; KIRP[Kidney renal papillary cell carcinoma], 11; LAML[Acute Myeloid Leukemia], 12; LUAD[Lung adenocarcinoma], 13; LUSC[Lung squamous cell carcinoma], 14; OV[Ovarian serous cystadenocarcinoma ], 15; PAAD[Pancreatic adenocarcinoma], 16; PRAD[Prostate adenocarcinoma], 17; SKCM[Skin Cutaneous Melanoma], 18:STAD[Stomach adenocarcinoma], 19:THCA[Thyroid carcinoma], 20:UCEC[Uterine Corpus Endometrial Carcinoma]) |
| Top |
| * We represented just top 10 SNVs. When you move the cursor on each content, you can see more deailed mutation information on the Tooltip. Those are primary_site, primary_histology, mutation(aa), pubmedID. |
| Genomic Position | Mutation(aa) | Unique sampleID count |
| chr11:106558447 | p.P676L,GUCY1A2 | 3 |
| chr11:106849448 | p.P425L,GUCY1A2 | 2 |
| chr11:106681137 | p.L732I,GUCY1A2 | 2 |
| chr11:106558458 | p.R136I,GUCY1A2 | 2 |
| chr11:106558280 | p.K128N,GUCY1A2 | 2 |
| chr11:106849374 | p.F672F,GUCY1A2 | 2 |
| chr11:106558469 | p.Y572H,GUCY1A2 | 2 |
| chr11:106810341 | p.E669Q,GUCY1A2 | 2 |
| chr11:106558403 | p.S712L,GUCY1A2 | 2 |
| chr11:106681097 | p.L438L,GUCY1A2 | 2 |
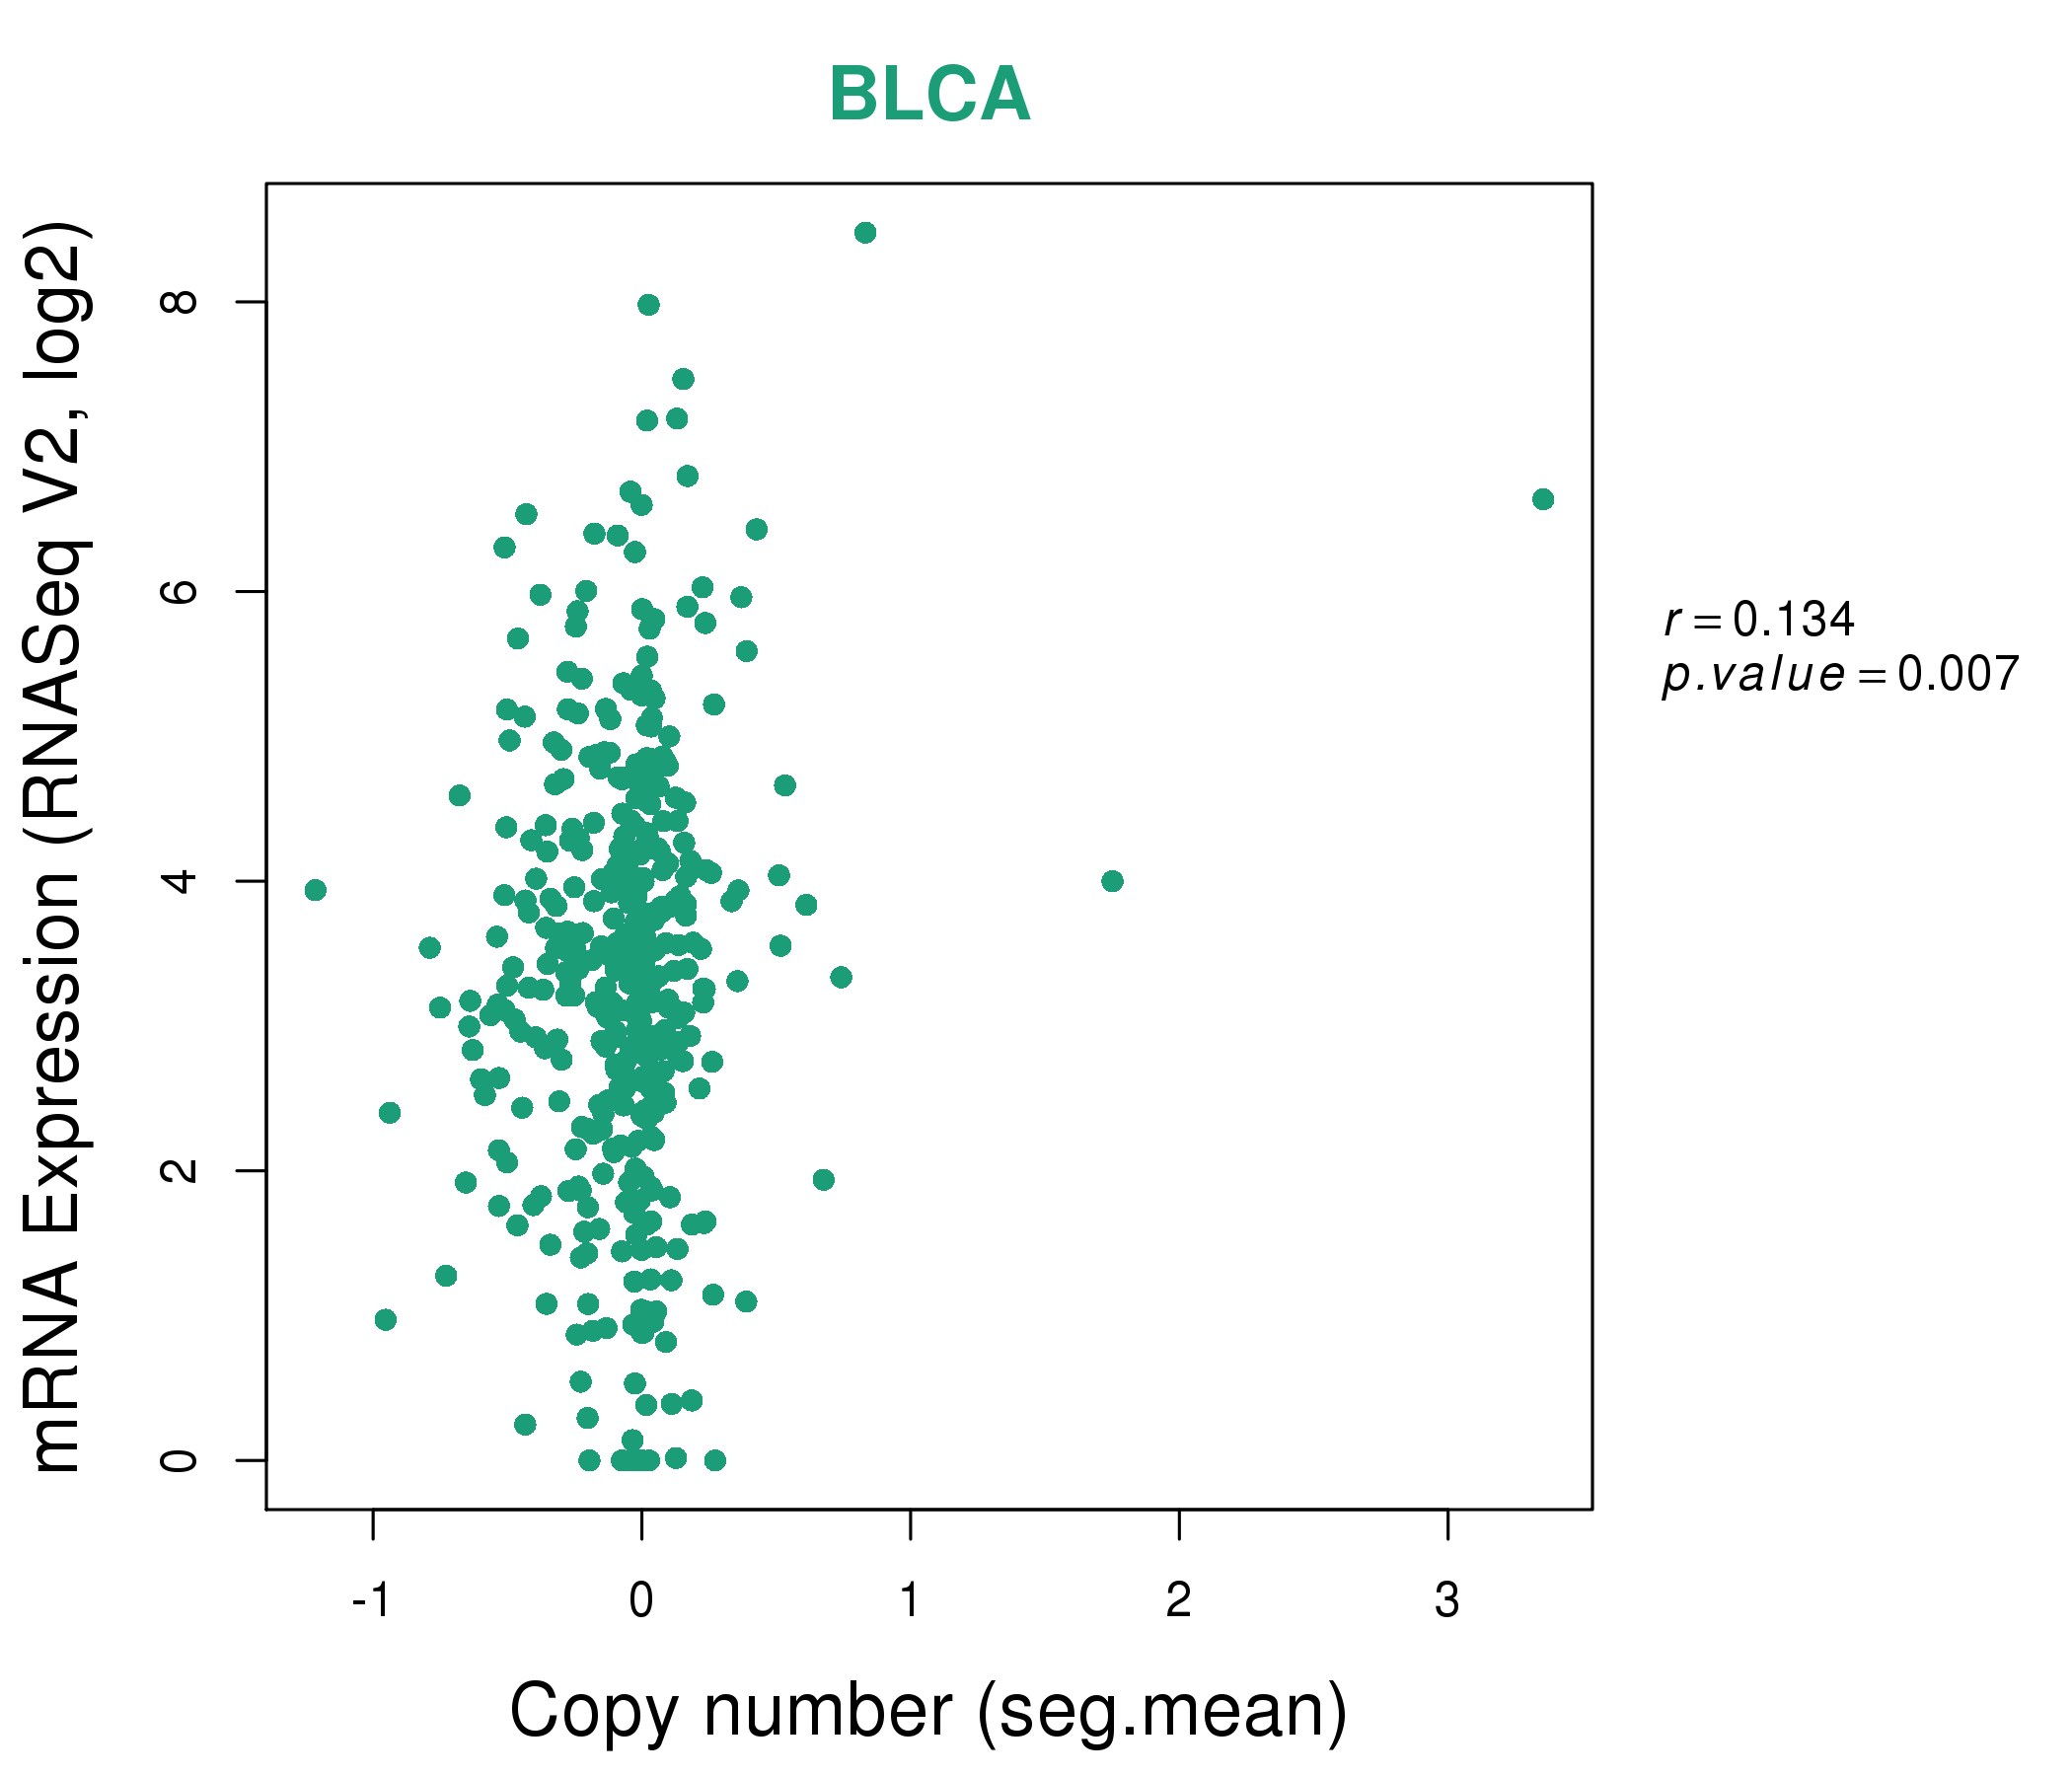
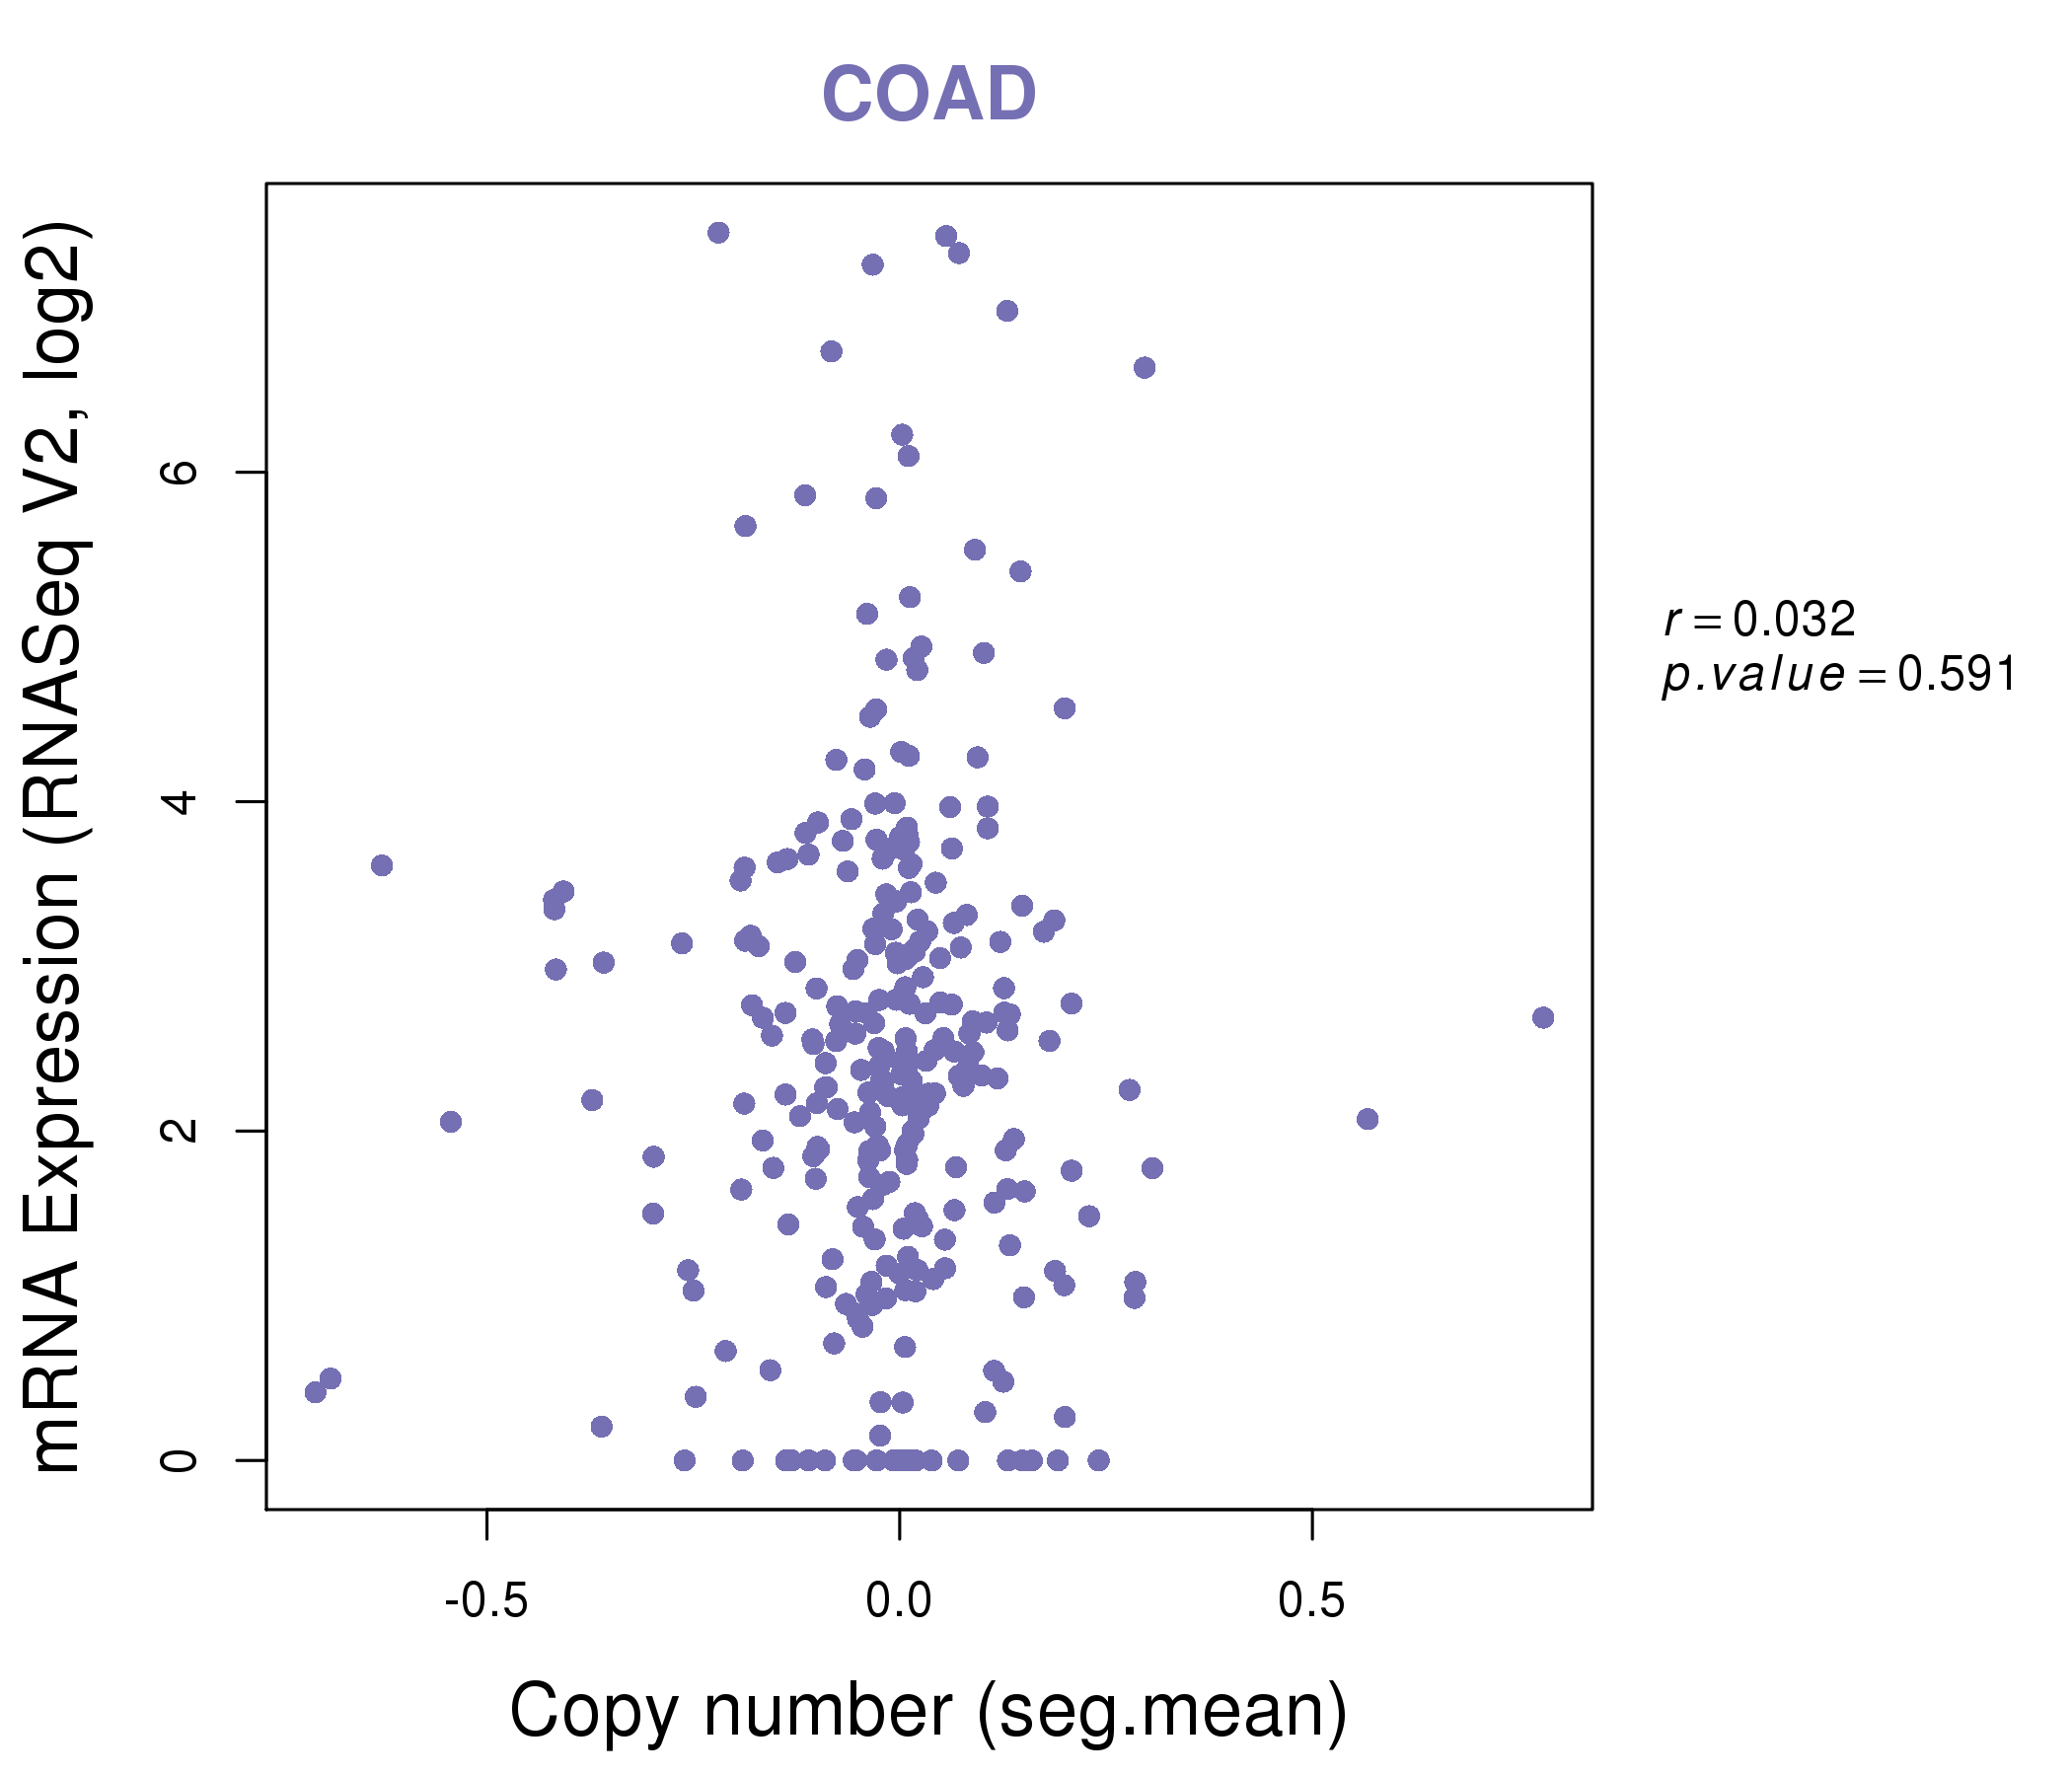
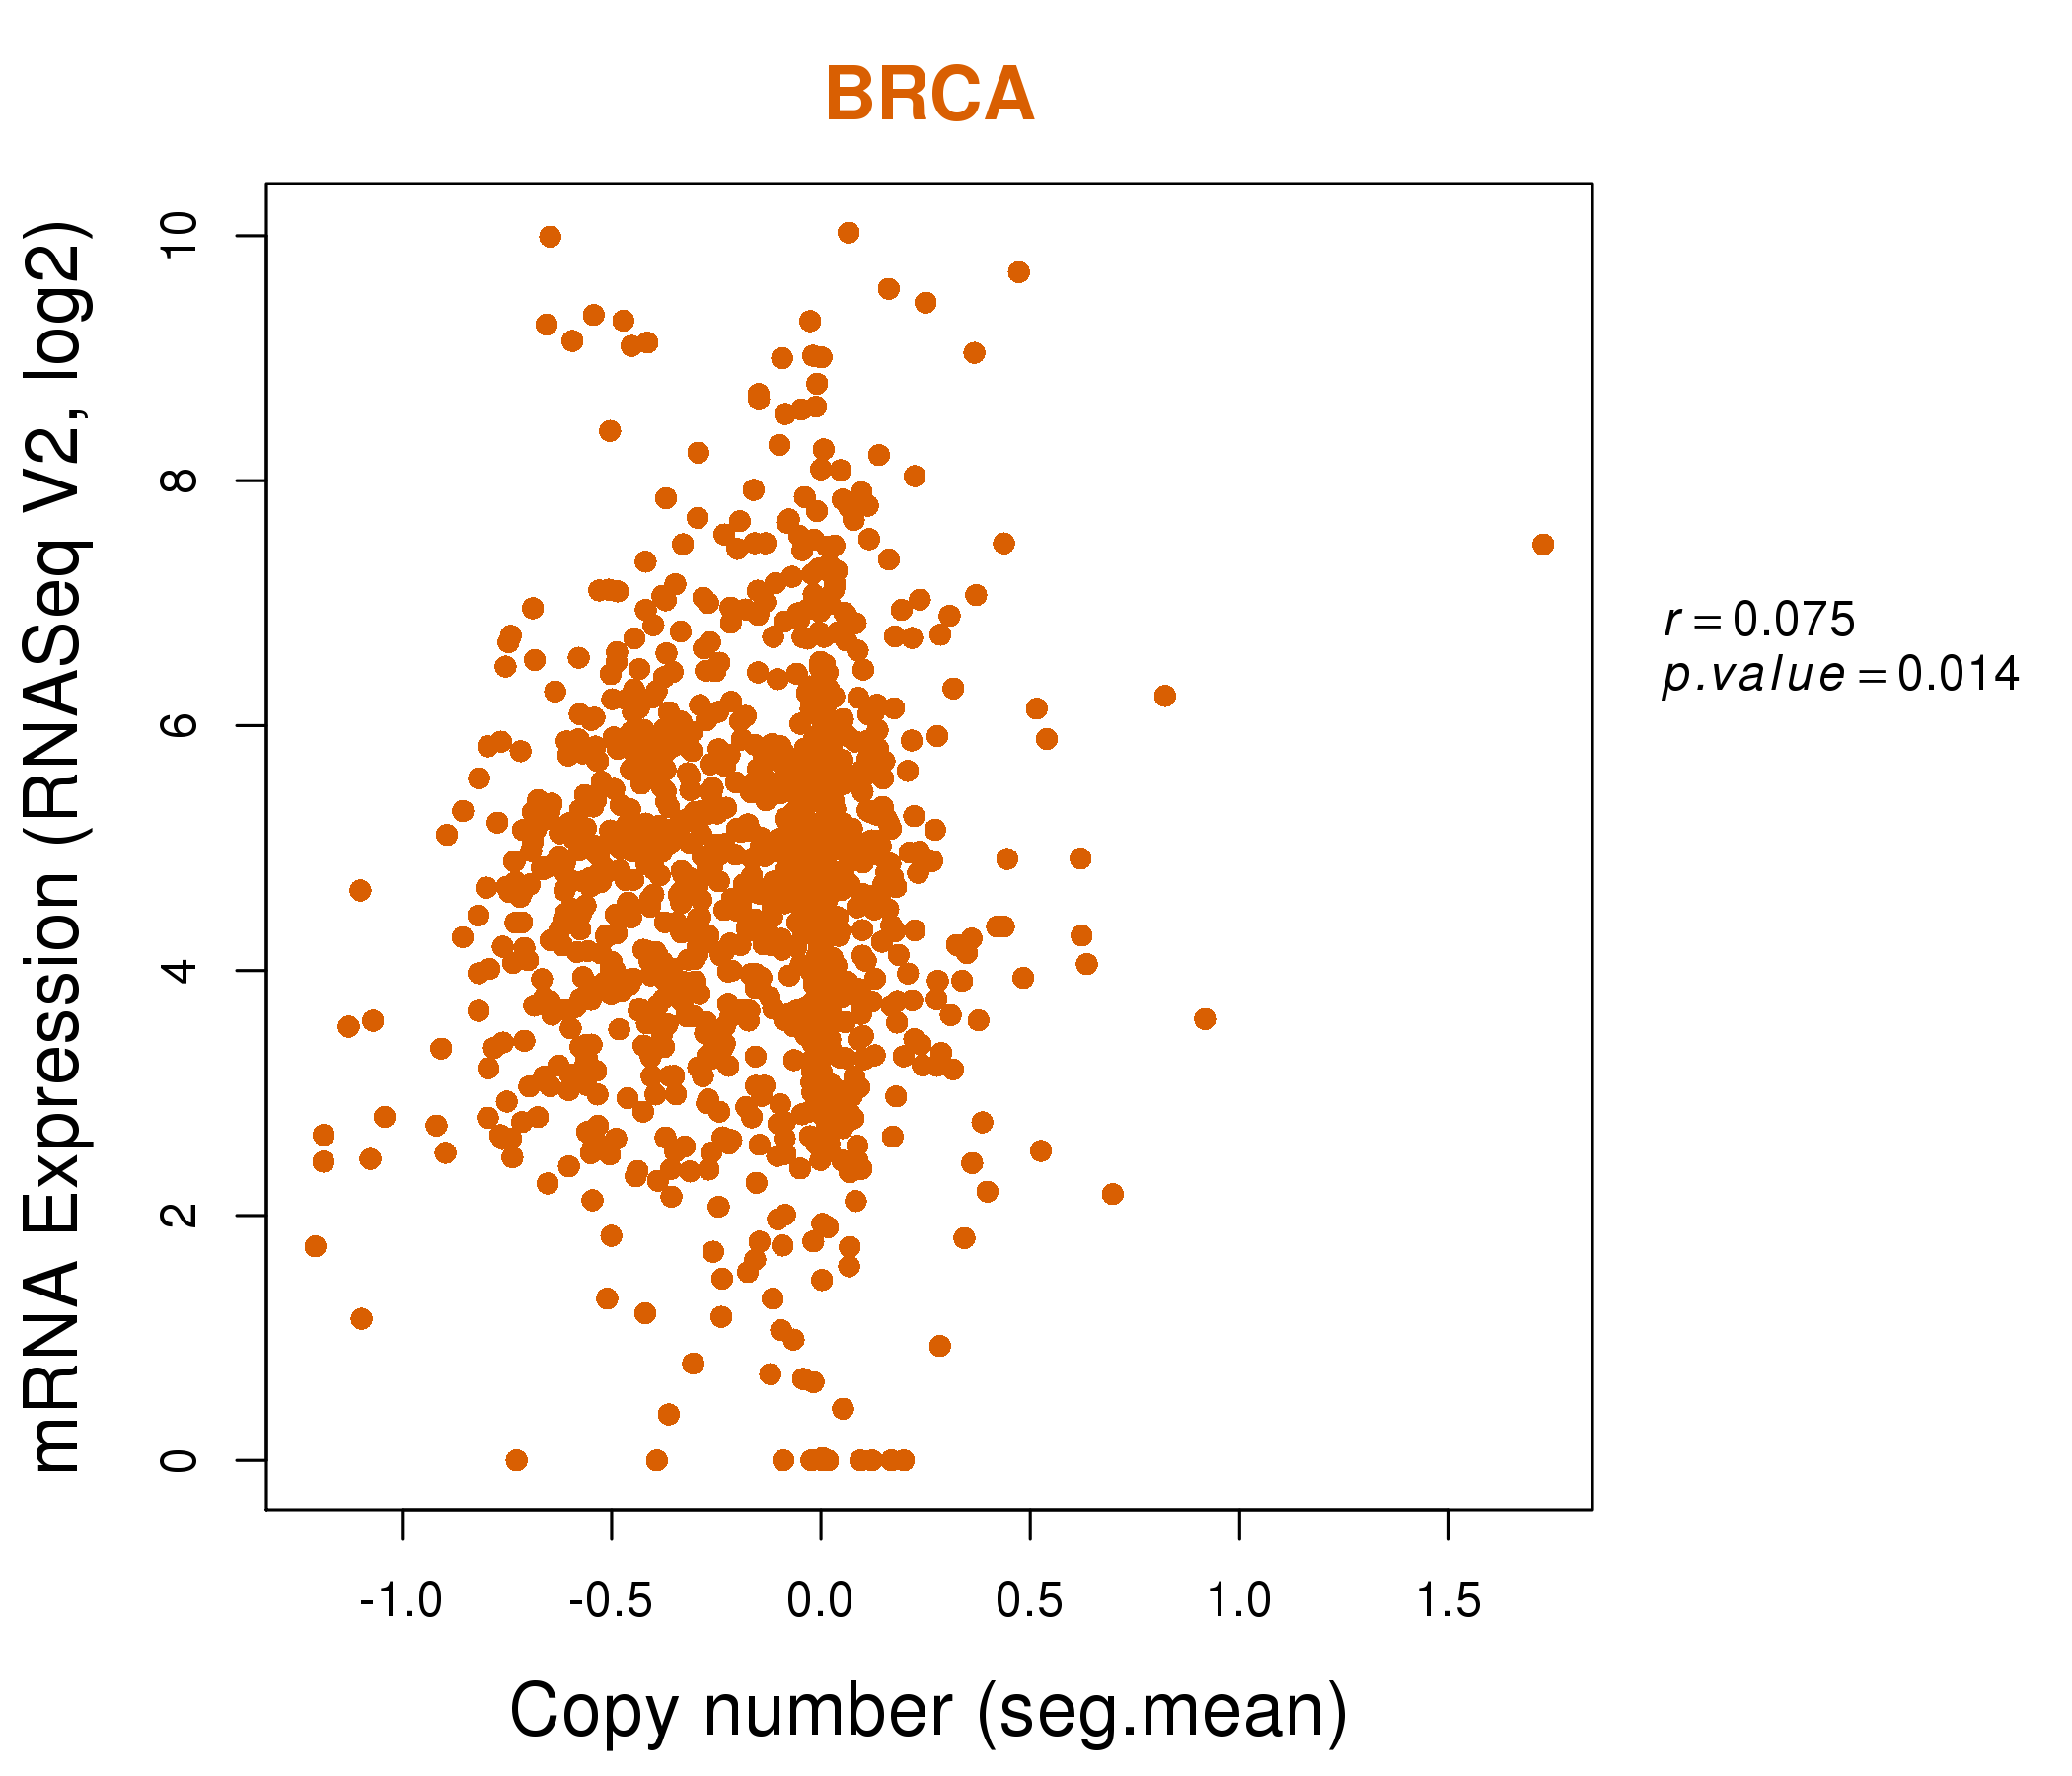
| * Copy number data were extracted from TCGA using R package TCGA-Assembler. The URLs of all public data files on TCGA DCC data server were gathered on Jan-05-2015. Function ProcessCNAData in TCGA-Assembler package was used to obtain gene-level copy number value which is calculated as the average copy number of the genomic region of a gene. |
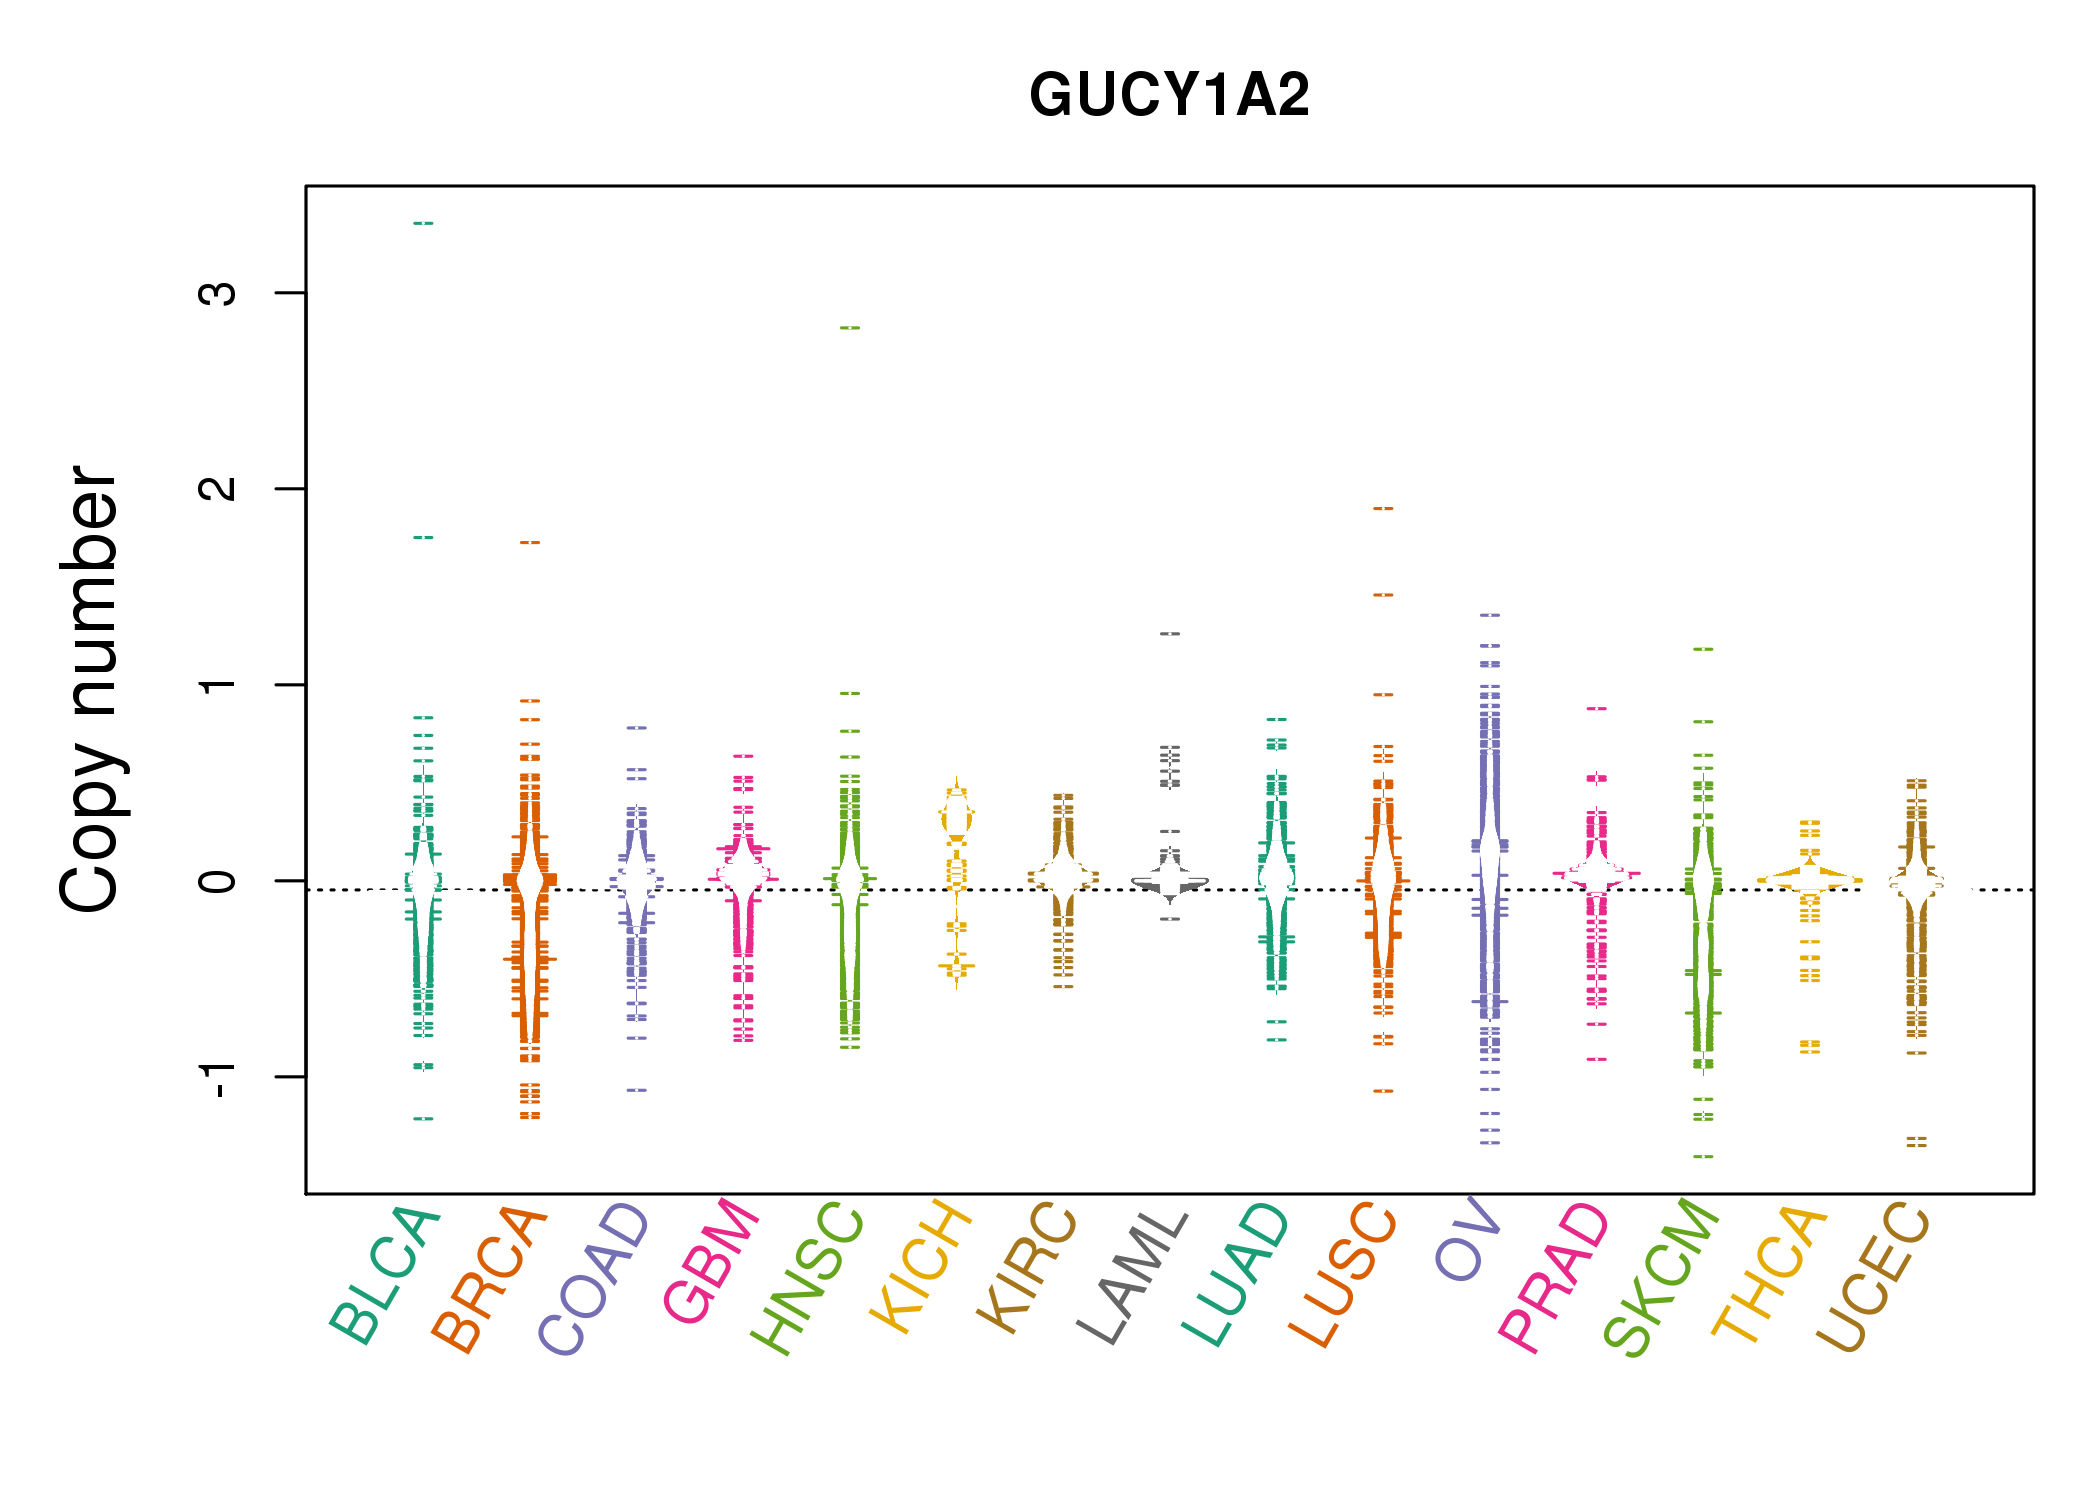 |
| cf) Tissue ID[Tissue type]: BLCA[Bladder Urothelial Carcinoma], BRCA[Breast invasive carcinoma], CESC[Cervical squamous cell carcinoma and endocervical adenocarcinoma], COAD[Colon adenocarcinoma], GBM[Glioblastoma multiforme], Glioma Low Grade, HNSC[Head and Neck squamous cell carcinoma], KICH[Kidney Chromophobe], KIRC[Kidney renal clear cell carcinoma], KIRP[Kidney renal papillary cell carcinoma], LAML[Acute Myeloid Leukemia], LUAD[Lung adenocarcinoma], LUSC[Lung squamous cell carcinoma], OV[Ovarian serous cystadenocarcinoma ], PAAD[Pancreatic adenocarcinoma], PRAD[Prostate adenocarcinoma], SKCM[Skin Cutaneous Melanoma], STAD[Stomach adenocarcinoma], THCA[Thyroid carcinoma], UCEC[Uterine Corpus Endometrial Carcinoma] |
| Top |
| Gene Expression for GUCY1A2 |
| * CCLE gene expression data were extracted from CCLE_Expression_Entrez_2012-10-18.res: Gene-centric RMA-normalized mRNA expression data. |
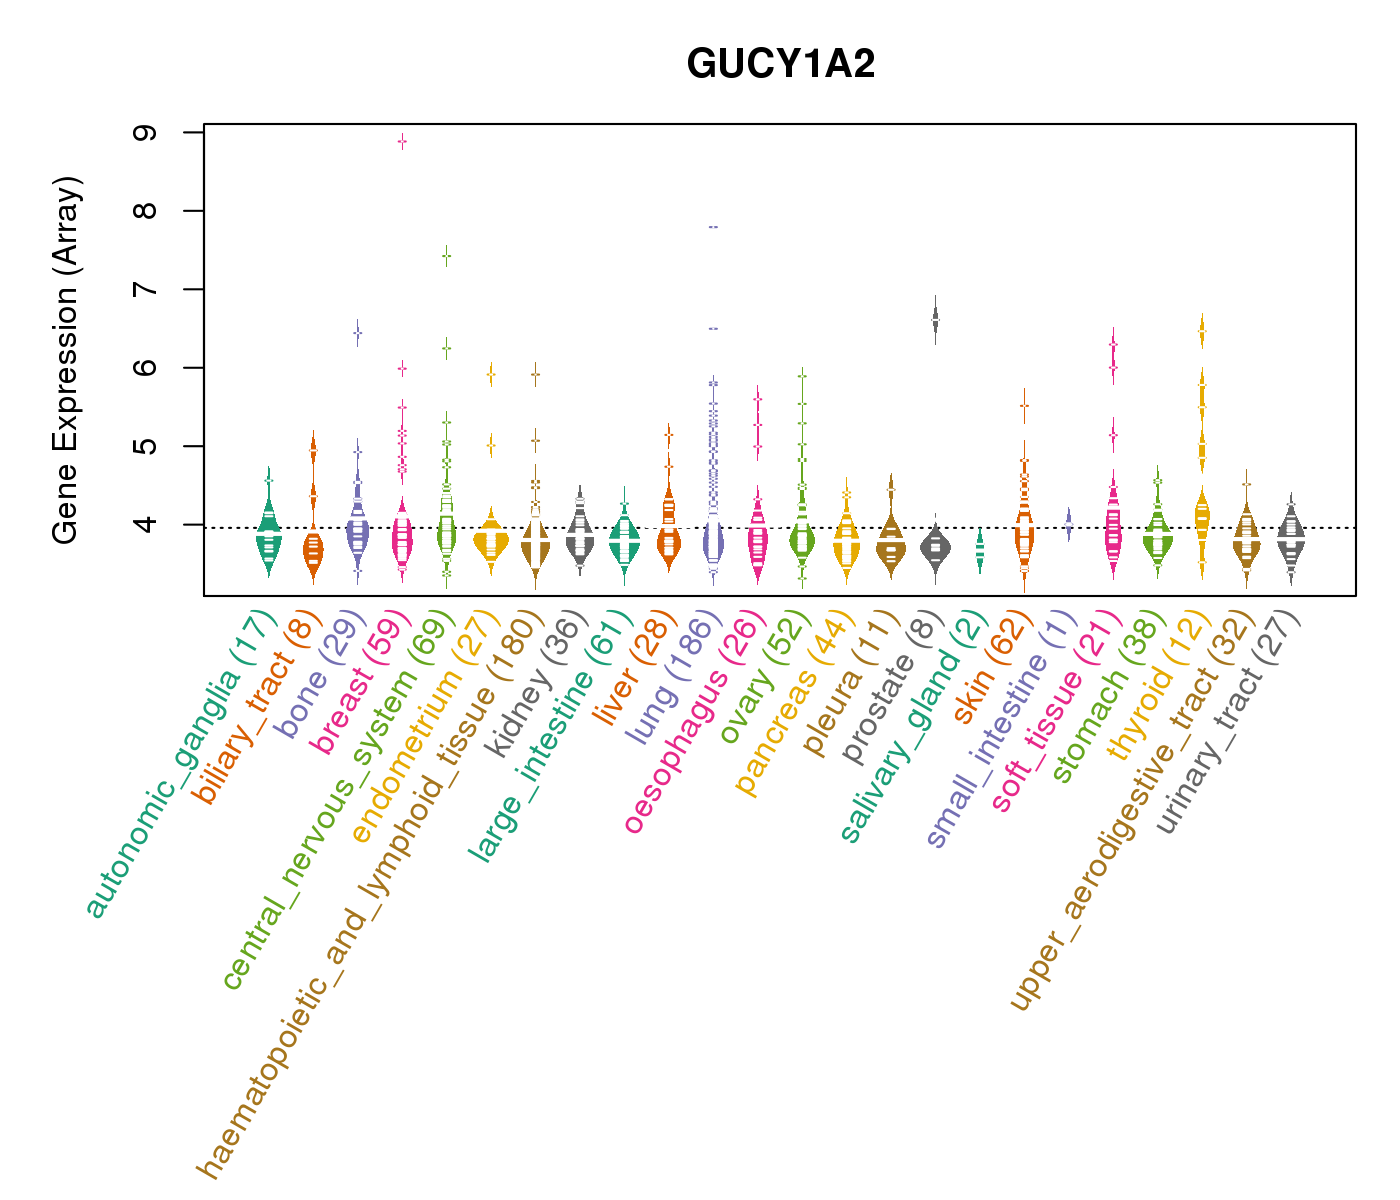 |
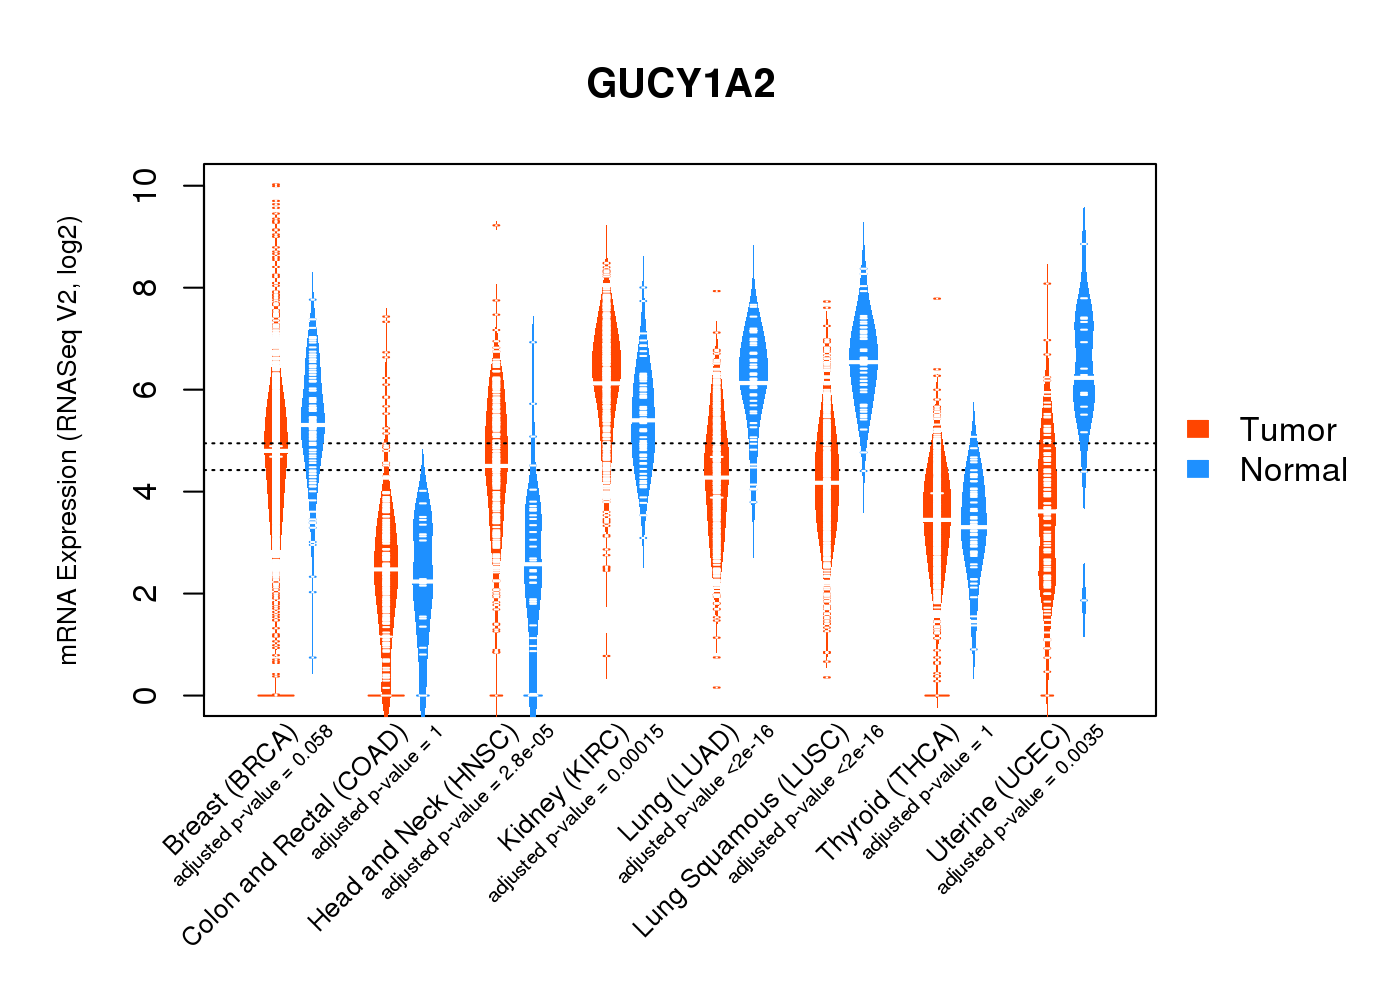
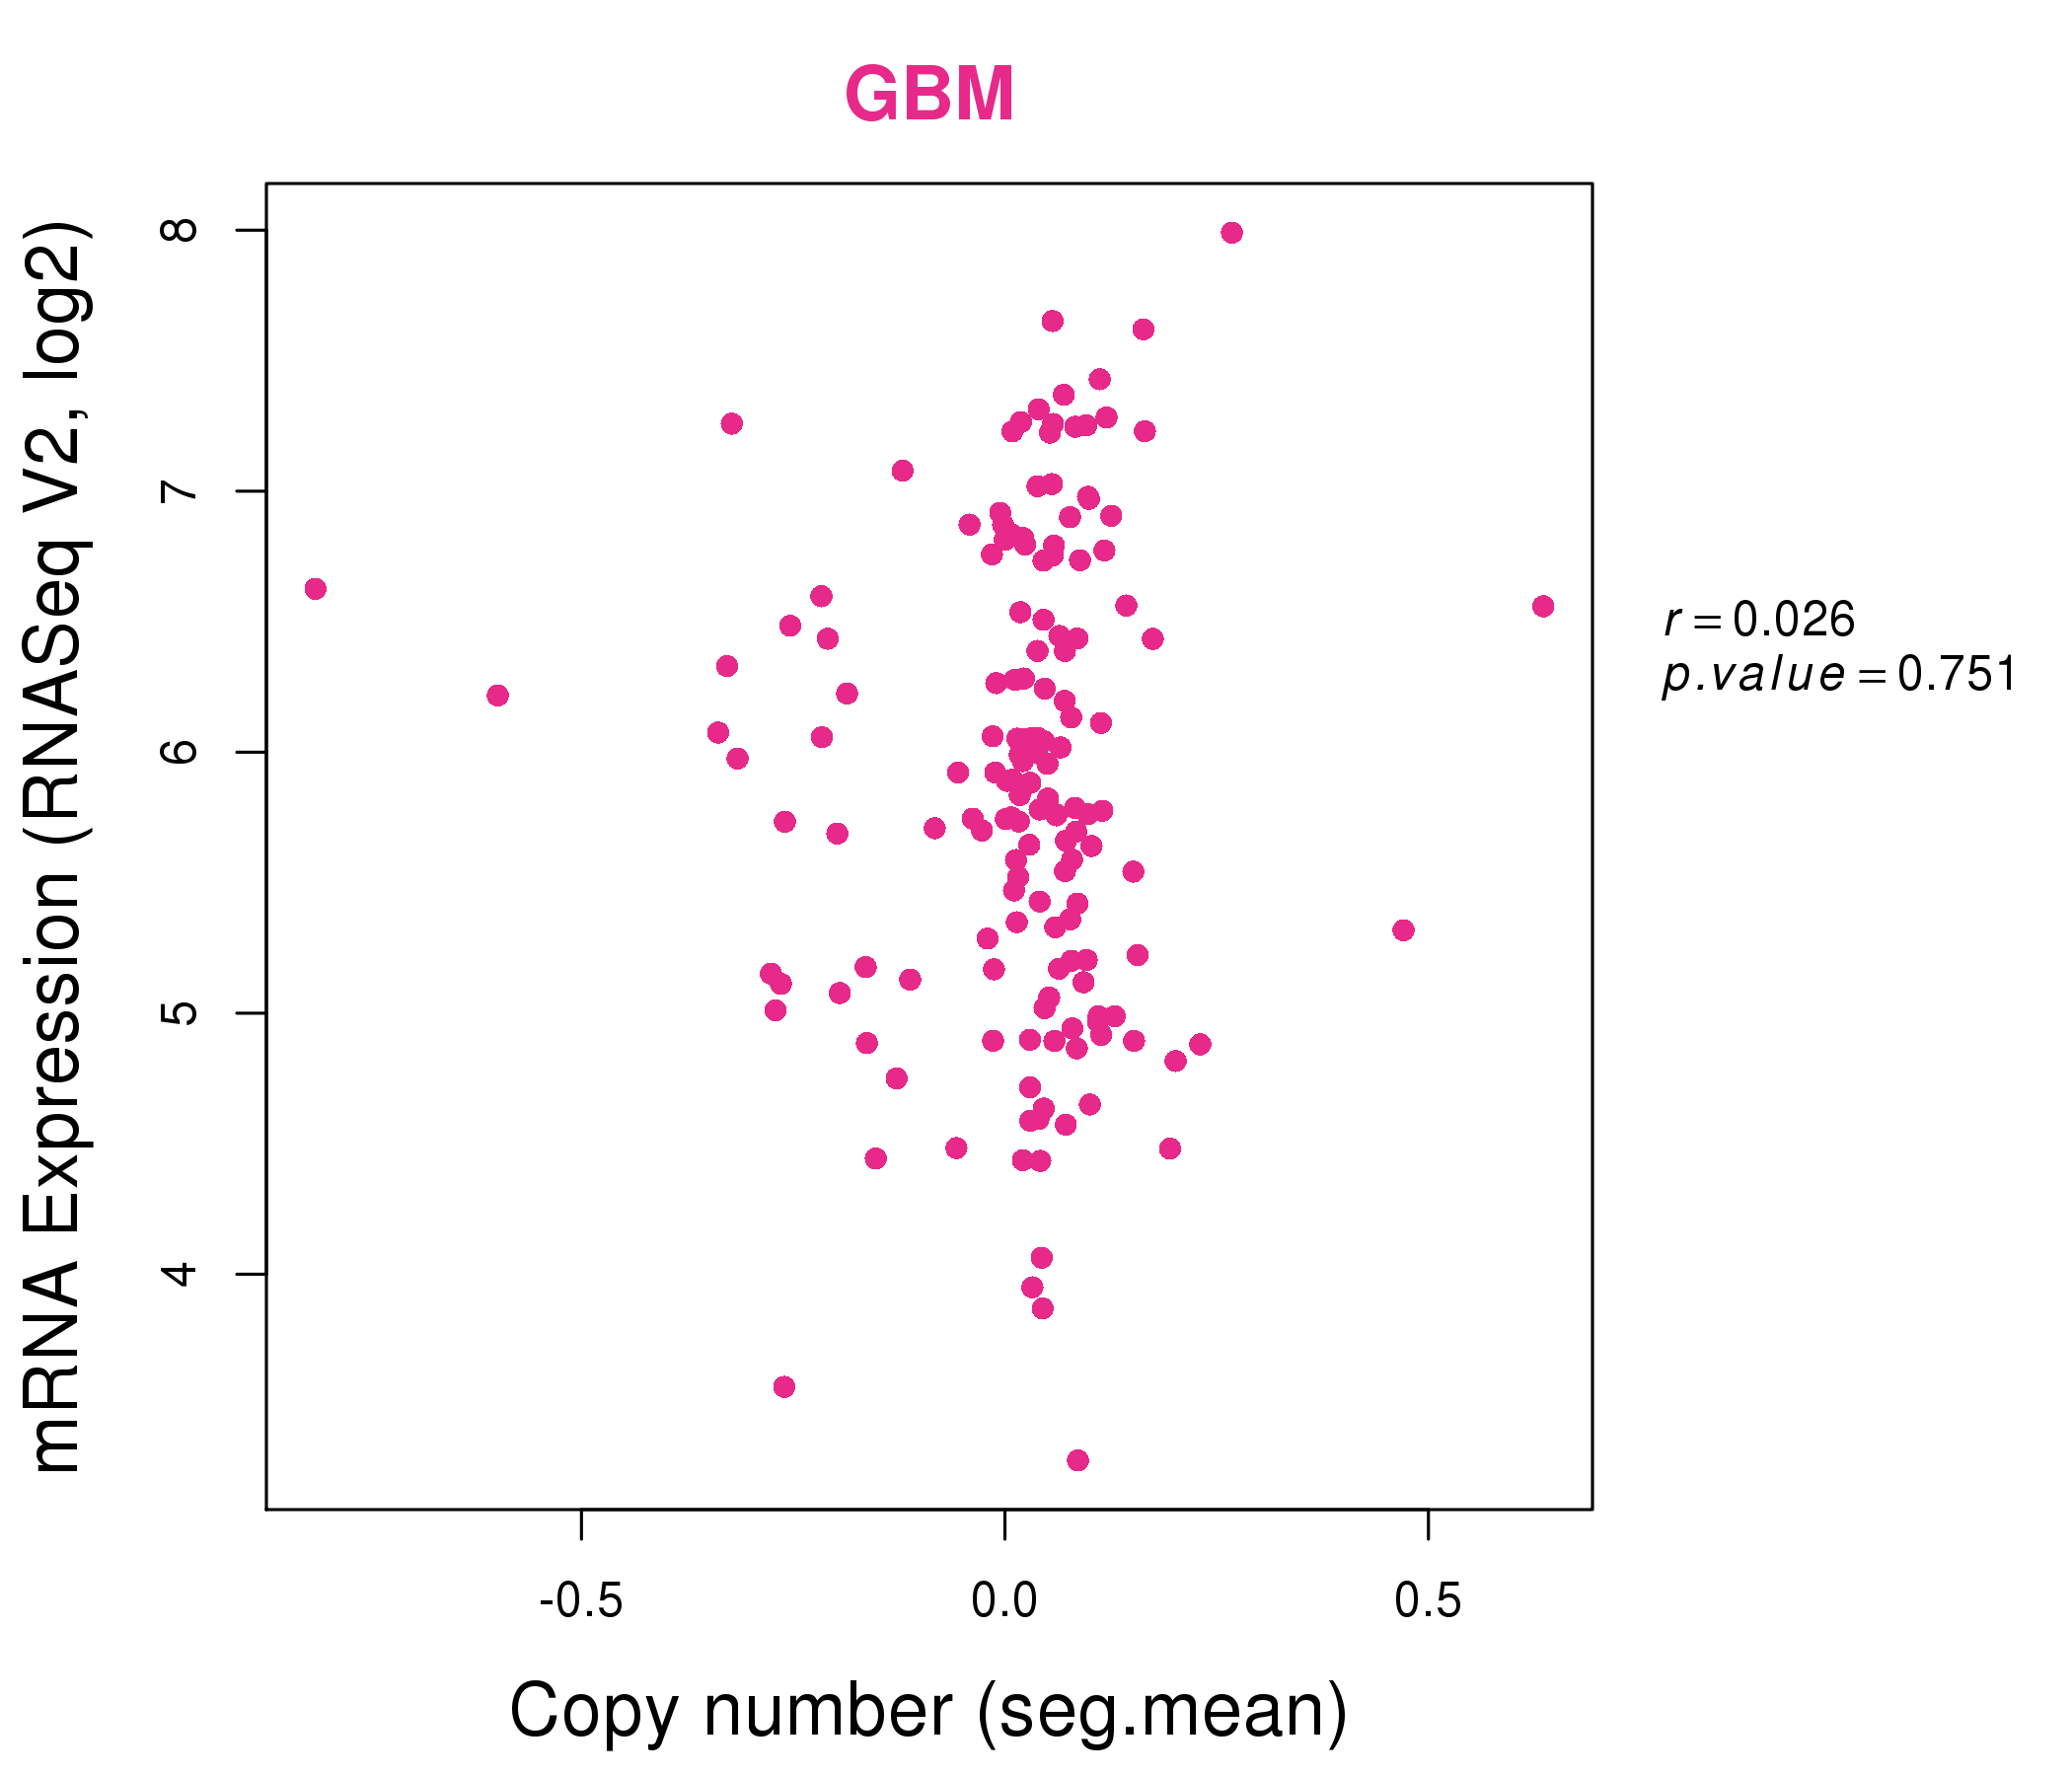
| * Normalized gene expression data of RNASeqV2 was extracted from TCGA using R package TCGA-Assembler. The URLs of all public data files on TCGA DCC data server were gathered at Jan-05-2015. Only eight cancer types have enough normal control samples for differential expression analysis. (t test, adjusted p<0.05 (using Benjamini-Hochberg FDR)) |
 |
| Top |
| * This plots show the correlation between CNV and gene expression. |
: Open all plots for all cancer types
 |
|
 |
|
| Top |
| Gene-Gene Network Information |
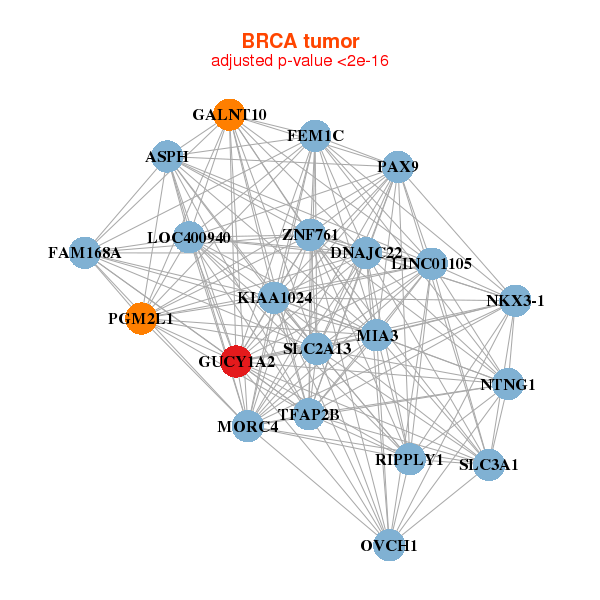
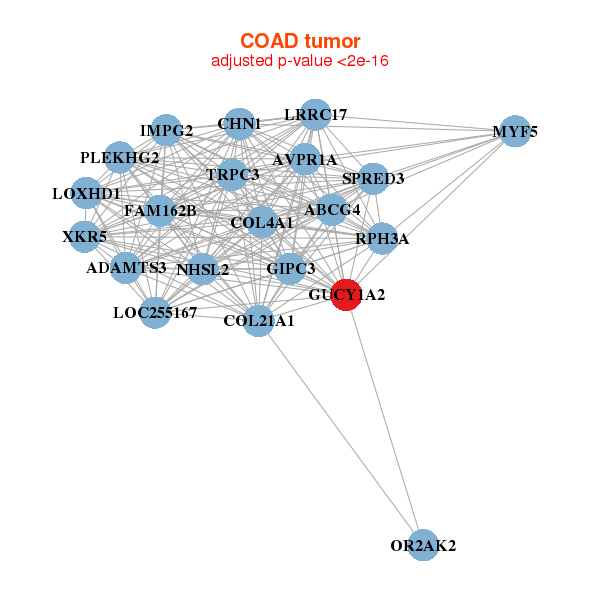
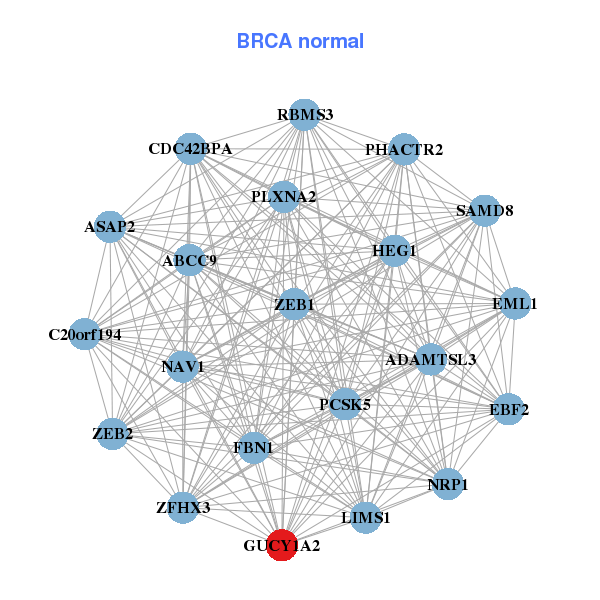
| * Co-Expression network figures were drawn using R package igraph. Only the top 20 genes with the highest correlations were shown. Red circle: input gene, orange circle: cell metabolism gene, sky circle: other gene |
: Open all plots for all cancer types
 |
|
| ASPH,DNAJC22,FAM168A,FEM1C,GALNT10,GUCY1A2,KIAA1024, LINC01105,LOC400940,MIA3,MORC4,NKX3-1,NTNG1,OVCH1, PAX9,PGM2L1,RIPPLY1,SLC2A13,SLC3A1,TFAP2B,ZNF761 | ABCC9,ADAMTSL3,ASAP2,C20orf194,CDC42BPA,EBF2,EML1, FBN1,GUCY1A2,HEG1,LIMS1,NAV1,NRP1,PCSK5, PHACTR2,PLXNA2,RBMS3,SAMD8,ZEB1,ZEB2,ZFHX3 |
 |
|
| ABCG4,ADAMTS3,AVPR1A,CHN1,COL21A1,COL4A1,FAM162B, GIPC3,GUCY1A2,IMPG2,LOC255167,LOXHD1,LRRC17,MYF5, NHSL2,OR2AK2,PLEKHG2,RPH3A,SPRED3,TRPC3,XKR5 | A4GALT,ARHGAP23,ARHGAP29,ARHGEF10,C1orf198,CADM3,ENAH, EYA4,FAM63B,GUCY1A2,HIPK3,IL6ST,KCND2,MAP9, NRXN1,PWAR5,PLEKHA4,PTGIS,RADIL,SCN3B,WTIP |
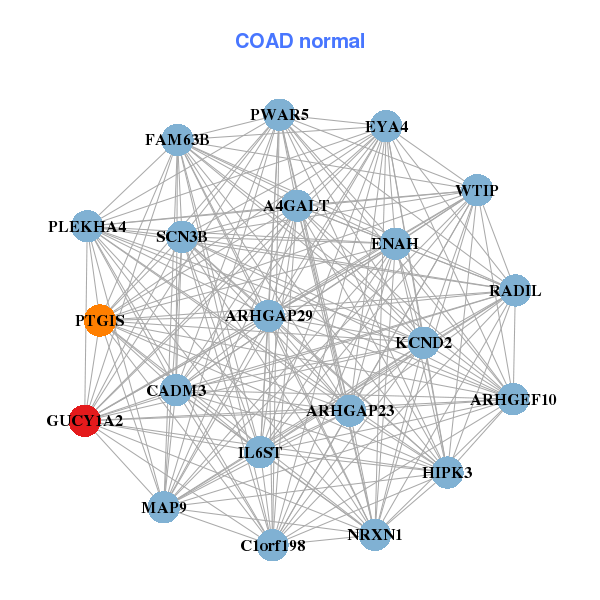
| * Co-Expression network figures were drawn using R package igraph. Only the top 20 genes with the highest correlations were shown. Red circle: input gene, orange circle: cell metabolism gene, sky circle: other gene |
: Open all plots for all cancer types
| Top |
: Open all interacting genes' information including KEGG pathway for all interacting genes from DAVID
| Top |
| Pharmacological Information for GUCY1A2 |
| There's no related Drug. |
| Top |
| Cross referenced IDs for GUCY1A2 |
| * We obtained these cross-references from Uniprot database. It covers 150 different DBs, 18 categories. http://www.uniprot.org/help/cross_references_section |
: Open all cross reference information
|
Copyright © 2016-Present - The Univsersity of Texas Health Science Center at Houston @ |